Android Security & Privacy 2018 Year In Review - March 2019 Celebrating 10 years of Android - Android Open ...
←
→
Page content transcription
If your browser does not render page correctly, please read the page content below
Android Security & Privacy
2018 Year In Review
March 2019

Celebrating 10 years of Android
Android Security 2018 Year in Review                                         2

Contents

 3                                     6                  9
 Overview                              Android Platform   Google Play
                                       Security           Protect

 12                                    27                 30
 Ecosystem                             PHA Families       Acknowledgements
 Data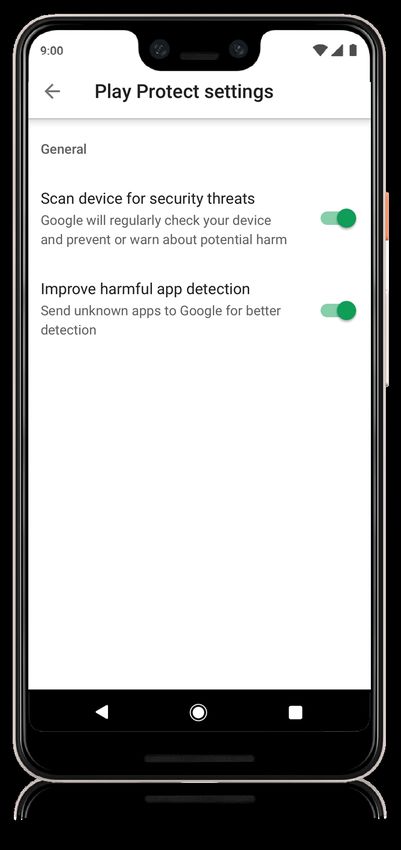
Android Security 2018 Year in Review                                                                           3

Overview

   This being our fifth Year in Review it is very special in that it coincides with the tenth anniversary of
   Android. Dianne Hackborn said it best in her blog post Celebrating a Sweet Decade of Android:

      Ten years ago, we introduced the first version of the Android operating system with
      the T-Mobile G1, and launched Android Market (now Google Play) the very same
      day. Android has grown up a lot since then—there are now more than 2 billion active
      Android devices around the world.

      The operating system itself has gone through some major transformations, too. The
      G1 ran on Android 1.0—a version so early, we didn’t even name it after a dessert. The
      debut included features that you know and love today like pull-down notifications,
      sharing content across apps and multitasking between apps. But it didn’t have more
      advanced features like voice search, turn-by-turn navigation or NFC. 10 years later,
      we’ve come a long way! Our latest release of the operating system, Android 9 Pie, has
      all of those features and harnesses the power of artificial intelligence to make your
      phone smarter, simpler and more adaptive.

    Every new Android version released comes with new features, improvements, and security enhancements. The
    data discussed in this report shows that Android becomes more secure with every major version. The major
    security enhancements are documented on source.android.com in the Enhancements section.
Android Security 2018 Year in Review                                                                                        4

    Our Strategy
    The Android security team’s mission is to protect every one of the more than two billion Android users. We do this
    through massive investment and continuous improvement in our security and privacy technology and operations.

    Our strategy can be broken down into the following three pillars:

  Layered Security                            Transparency                           Backed by Google
We apply a layered approach to            Transparency and openness are the         Android is backed by Google which
protection. Each layer in the Android     foundation of Android. We firmly          means that our security team
security model works together to          believe that transparency creates         collaborates with some of the best
build a strong defense that runs          trust, while closed platforms lead        security and computer science
smoothly and effectively. The main        to distrust and a dangerous false         professionals in the industry, with
layers of Android security include:       sense of security through obscurity.      world class expertise in identity
                                          Android transparency goes well            management, artificial intelligence,
—— Operating system defense               beyond the open source nature of          privacy research, and cloud security.
                                          the operating system itself. Our team
—— App safety defense                     regularly publishes threat research,
                                          blogs about new features, and
—— Human research and analysis            distributes comprehensive monthly
                                          bulletins of security fixes. We also
—— Security development lifecycle         recently launched our Android
                                          ecosystem transparency report,
                                          which is refreshed quarterly, and we
                                          publish a myriad of information on
                                          our recently updated Android Security
                                          Center website, which provides easier
                                          access to our blogs, videos, and
                                          reports.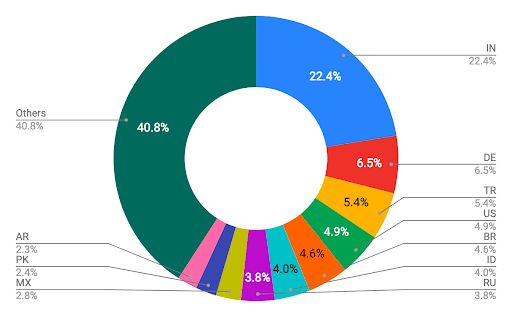
Android Security 2018 Year in Review                                                                                 5

   The best of Android Security & Privacy in 2018
   The broadest statistic for measuring device hygiene is how frequently a full-device scan detects Potentially
   Harmful Applications (PHAs). Google Play Protect, Android's built-in defense mechanism, is incredibly effective
   at keeping PHAs out of Google Play, but malicious apps can still be downloaded from other sources. These apps
   endanger not only the device but also threaten the sanctity of the Android environment. This is why Google Play
   Protect scans all apps installed on a device regardless of the source.

   In 2018 only 0.08% of devices that used Google Play exclusively for app downloads were affected by PHAs. In
   contrast, devices that installed apps from outside of Google Play were affected by PHAs eight times more often.
   Compared to the previous year, even those devices saw a 15% reduction in malware due to the vigilance of
   Google Play Protect.

   Android’s security saw a strengthened application sandbox in 2018 along with hardened developer APIs with
   features like BiometricPrompt and an updated target API level for apps. The Android Security team continued
   their investment in hardware backed security through discrete tamper-resistant secure elements that enable the
   use of industry-first security APIs, such as Protected Confirmation and Strongbox.

       In 2018 we surpassed $3 million in total reward program payouts.
   Our Android security rewards programs allow us to work with top researchers from around the world to improve
   the security of the Android ecosystem. These programs offer some of the highest priced rewards in the industry.

   Through a combination of platform improvements like Treble, new original equipment manufacturer (OEM)
   agreements, and partner programs such as Android Enterprise Recommended, the Android ecosystem has made
   significant progress in releasing security updates.

       In the 4th quarter of 2018 we had 84% more devices receiving a
       security update than in the same quarter the prior year.
Android Security 2018 Year in Review 6
Android platform
security and privacy
Improving Android's security with every major Android release and monthly security updates is critical. However,
in order to be even more effective, we must work to continuously increase security without putting a burden
on our end users. A layered security model is part of our fundamental design principle and is a foundation of
Android’s architecture. The Android platform controls how the operating system works and how apps interact
with other apps, device hardware, and other services. Supported by Google Play Protect, Android is protected
around the clock. The following table lists some of these protections that are designed to provide better platform-
level security.
Platform security feature Protection
Encryption Protects data from unauthorized access.
Strengthens key storage and cryptographic services and enables
Hardware-backed security
strong remote authentication.
Protects the kernel against memory corruption vulnerabilities
Kernel self-protections
and other security flaws in kernel components and drivers.
Keeps each app in a separate space, protecting its data and
Sandboxing
processing from other apps.
Provides an auditable definition of—and enforcement of—
SELinux security boundaries on all operating system and app components
above the kernel.
Protects the operating system and apps against memory
corruption vulnerabilities and other security flaws; includes
Userspace hardening
address space layout randomization (ASLR), data execution
prevention (DEP), and Control Flow Integrity (CFI).
Cryptographically verifies that the operating system starts in a
Verified boot
known good state.Android Security 2018 Year in Review 7 Updates and features With Android 9, we added a myriad of great security features. We strengthened the application sandbox and hardened the developer APIs. We continued to invest in hardware-backed security via the trusted execution environment (TEE) and on select devices through discrete tamper-resistant hardware. We also layered a set of privacy preserving enhancements and adopted more anti-exploitation techniques so that bugs don’t turn into exploitable vulnerabilities. Learn more about all of the Android 9 security and privacy features at Android Pie à la mode: Security & Privacy. Vulnerability rewards and updates The Android Security & Privacy team oversees many programs to provide more frequent security updates to Android devices. In 2018, we have continued our close collaboration with Android partners to keep devices secure. Android security rewards programs Our Android and Play Security Rewards programs help us work with top researchers from around the world to improve Android ecosystem security every day. Learn more about the rewards program at Android and Google Play Security Rewards Programs surpass $3M in payouts. Security research competitions and zero day vulnerabilities The Android Security & Privacy team participated in a number of external vulnerability discovery and disclosure competitions, including Mobile Pwn2Own, which took place at the PacSec conference in Tokyo, Japan. At this event, researchers were rewarded for demonstrating working exploits against major mobile operating systems. Exploits against Google Pixel devices were categorized in the top reward category along with other devices such as the iPhone. No exploits successfully compromised Google Pixel devices and none of the exploits demonstrated against devices running Android utilized a security vulnerability in the Android operating system. Further, in 2018, no critical security vulnerabilities affecting the Android platform were publicly disclosed without a security update or mitigation available for Android devices. Researcher partnerships The Android security team worked closely with leading security researchers to identify and integrate unique technology into the Android ecosystem to help increase the security of devices. One example of this was SnoopSnitch, an independently developed technology by Security Research Labs (SRLabs) that has the ability to detect if an Android device is protected against all of the security vulnerabilities covered in the security patch level (SPL). We worked closely with SRLabs to evaluate, improve, and integrate elements of this technology into the development workflows used by all Android device manufacturers.
Android Security 2018 Year in Review                                                                                    8

   Android security updates program
   Google mitigates security vulnerabilities discovered through the Android Security Rewards program and
   additional engagements through regular Android security updates. In 2018, we continued to work with Android
   device manufacturers, mobile network operators, and system-on-chip (SOC) vendors to increase the number of
   devices receiving regular security updates. Through our combined efforts, which include platform improvements,
   new OEM agreements, and partner programs such as Android One and Android Enterprise Recommended, we’ve
   made significant progress in releasing the latest Android security updates. In fact, in the 4th quarter of 2018 we
   had 84% more devices receiving a security update than in the same quarter the prior year.

       As of December 2018, over 95% of deployed Google Pixel 3 and Pixel
       3 XL devices were running a security update from the last 90 days.
   App security improvements program
   The App Security Improvement program helps identify potential security issues. Before any app is accepted into
   Google Play, it’s scanned for safety and security issues. To date the program has helped over 300,000 developers
   remediate over 1,000,000 Play applications.

   Learn more about this program and all of it’s updates at Helping developers harden their apps, one thwarted
   vulnerability at a time.

                                                      Security Update:
                                                     September 5, 2018
Android Security 2018 Year in Review 9
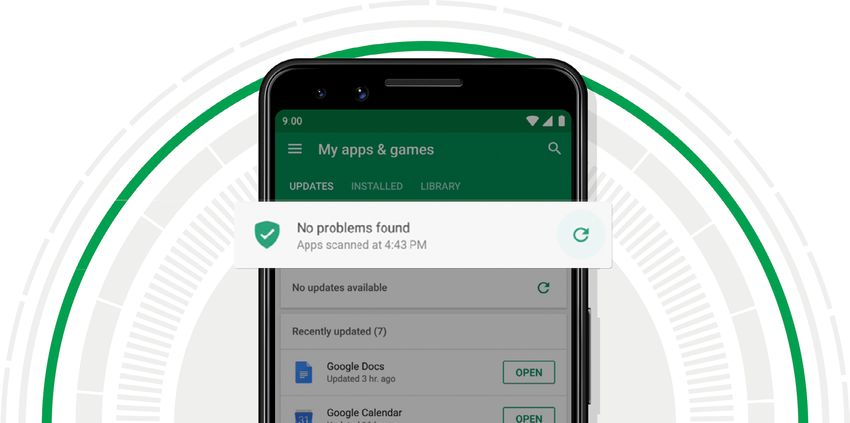
Google Play Protect
The most widely deployed mobile threat protection service in the world
Google Play Protect
Settings
Google Play Protect debuted in 2017, combining new and existing Android
security features, and quickly became the most widely deployed mobile
threat protection service in the world. Every device with Google Play Protect
has on-device protections that also leverages a cloud-based infrastructure
that keep the device secure and its data private.
Google Play Protect scans over 50 billion
apps every day across more than two billion
devices.
Google Play Protect works hard to keep harmful apps out of Google Play
and off of user’s devices. By analyzing and reviewing upwards of 500,000
apps daily in its cloud-based vetting process, Google Play Protect helps
keep harmful apps from ever reaching Google Play.
You can learn all about Google Play Protect’s existing client-side and
backend features as well as details about every Potentially Harmful
Application (PHA) category on the newly launched Google Play Protect
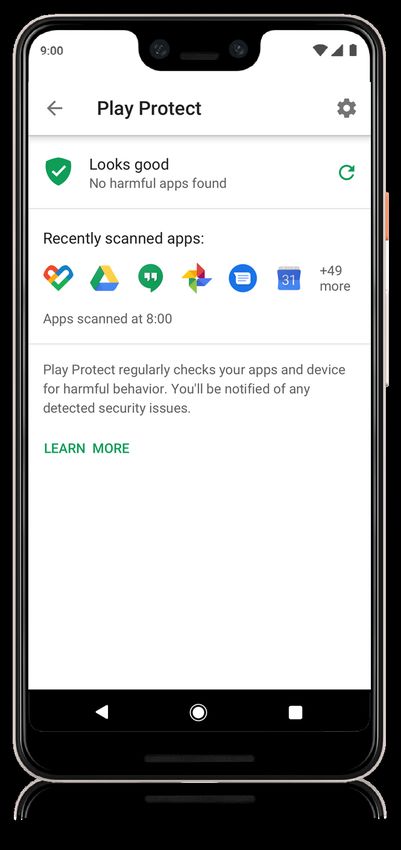
developer site.Android Security 2018 Year in Review 10 New features and improvements in Google Play Protect and Find My Device In 2018, Google Play Protect made Android devices running Google Play some of the most secure smartphones available, with a series of new updates that give our users even greater protection: —— Google Play Protect is now enabled by default to secure all new devices, right out of the box. —— We launched a new feature that notifies users when they are installing apps outside of the Google Play Store that are new or rarely installed in the ecosystem. —— We created a new, contextual warning dialog in Google Play Protect that warns users when they are about to launch a potentially harmful app on their device. —— We extended our coverage of automatically disabled apps to include those that violate Google Play policies, such as privacy issues and deceptive Google Play Protect behavior or content. status screen To learn more about these changes, read our write-up: Google Play Protect in 2018: New updates to keep Android users secure. Find My Device also benefited from a few new changes as well, including: —— We added support for indoor maps so individuals can more easily locate lost devices in large buildings, such as airports. —— We allow users to register the devices in Find My Device using a work profile. —— We prompt the user to perform a Security Checkup if they remotely lock a device. —— We display device-specific information, such as IMEI and device registration date, right in the app. Improvements in cloud-based security analysis In 2018, we continued to expand Google Play Protect's machine-learning capabilities by exploring different techniques and leveraging knowledge from all across Google. To learn more, read our blog post: Keeping 2 billion Android devices safe with machine learning.
Android Security 2018 Year in Review                                                                                  11

   The Android Security and Privacy team also uses machine learning to dramatically increase our ability to detect
   and classify PHAs. Learn more about some of the datasets that make the training and implementation of
   machine learning models possible by reading our write-up: Combating Potentially Harmful Applications with
   Machine Learning at Google: Datasets and Models.

   System image scanning
   In the Android Security 2017 Year in Review report, we announced that we had begun scanning for pre-installed
   PHAs across many software builds for devices with Google services. In 2018, we expanded this program and
   launched it as Build Test Suite (BTS) for partner OEMs.

   BTS is similar to the Compatibility Test Suite (CTS). OEMs submit their new or updated build images to BTS. BTS
   then runs a series of tests that look for security issues on the system image. One of these security tests scans
   for pre-installed PHAs included in the system image. If we find a PHA on the build, we work with the OEM partner
   to remediate and remove the PHA from the build before it can be offered to users.

       During its first calendar year, BTS prevented 242 builds with PHAs
       from entering the ecosystem.
   Anytime BTS detects an issue we work with our OEM partners to remediate and understand how the application
   was included in the build. This teamwork has allowed us to identify and mitigate systemic threats to the
   ecosystem. Through the BTS program, we discovered, analyzed, and remediated PHA families such as Chamois
   and EagerFonts, which are described in detail in the PHA Families section. In 2019, we’re continuing our
   commitment to vetting approved Android devices for security issues.
Android Security 2018 Year in Review 12 Ecosystem data A variety of systems work together to gather information about Potentially Harmful Application (PHA) categories in the Android ecosystem, both inside and outside of Google Play. For example, SafetyNet gathers information on the big picture over time using anonymized device telemetry to track PHAs, which provides insights on security- related services use. In contrast, Verify Apps focuses on details by scanning apps for PHAs before users install them. Potentially Harmful Applications (PHAs) Potentially Harmful Applications (PHAs) are apps that could put users, user data, or devices at risk. Common PHA categories include trojans, spyware, and phishing apps. In 2018, we started tracking click fraud as a PHA category. Click fraud apps simulate clicks on advertisements without user consent. User-wanted PHAs Some apps with attractive features also weaken Android’s built-in security. When users try to install these apps, Google Play Protect warns users about potential hazards so that they can make informed decisions. Our statistics separate these from classic “malware” PHAs. For example, Google Play Protect warns users about apps that disable Android security features, such as SELinux, or root the device with disclosure and user consent. Google Play Protect discourages changes that lower Android’s built-in security protections, but allows individuals to choose the risks that they are willing to take with their devices. A warning message is displayed to the user anytime a PHA installation is detected. If they decide to ignore this warning and proceed with the installation, they will not receive further security warnings about that app. Interrupting the Android user experience with constant warnings would make Google Play Protect more annoying than useful. In 2018, user-wanted PHAs comprised 0.11% of app installations downloaded outside of Google Play (Google Play doesn’t allow any security-breaking apps even if they are user-wanted).
Android Security 2018 Year in Review                                                                                       13

   Mobile unwanted software (MUwS)
   Google defines unwanted software (UwS) as apps that aren’t strictly malware, but are harmful to the software
   ecosystem. Mobile unwanted software (MUwS) impersonates other apps or collects at least one of the following
   without user consent:

   —— Device phone number

   —— Primary email address

   —— Information about installed apps

   —— Information about third-party accounts

   Google Play policies prohibit MUwS, but users who decide to install software from outside of Google Play can still
   be affected by MUwS. To combat this issue, in 2018 Google Play began warning users about MUwS if they initiate
   a download from outside of Google Play. With this change, the total number of install attempts coming from
   MUwS apps declined from 2.09% in 2017 to 0.75% in 2018.

   Changes in methodology
   In 2018, we changed some of our methodology, which led to some variances in numbers in this report compared
   to last year. These changes include:

   —— Added click fraud to our PHAs definitions

   —— Introduced the concept of user-wanted PHAs. These apps are classified as PHAs, but are intentionally
      installed by users who want them for their unique system capabilities. For example, power users install apps to
      root their device or disable security settings, such as SELinux

   —— Introduced the don’t-warn-again concept. If Google Play Protect flags apps as PHAs, users receive a warning
      at the time of install, allowing them to make an informed decision to continue or cancel the installation. If they
      proceed, this specific installation is removed from the metrics for PHAs used for calculating device hygiene

   Threat landscape changes
   In 2018, there were two notable changes to the Android threat landscape: an increase in pre-installed PHAs and
   backdoored SDKs (software development kits).

   Pre-installed PHAs
   Malicious actors increased their efforts to embed PHAs into the supply chain using two main entry points: new
   devices sold with pre-installed PHAs and over the air (OTA) updates that bundle legitimate system updates with
   PHAs. Neither entry point requires action from users, making them difficult to defend against.

   There are three possible reasons for an increase in the number of pre-installed PHAs.
Android Security 2018 Year in Review 14
First, the developers of pre-installed PHAs only need to deceive the device manufacturer or another company
in the supply chain instead of large numbers of users, so it’s easier to achieve large-scale distribution. Even a
less popular device model can compromise hundreds of thousands of users through one pre-installed harmful
application.
Second, pre-installed PHAs can gain more privileged access to the device, so it’s easier to execute malicious
behavior that would usually be blocked by Android’s security model. At the same time, these additional privileges
allow PHAs to defend against security tools or removal attempts by users.
Third, large families of PHAs used exploits to root devices, but this is increasingly more difficult due to Android’s
constantly improving security model which blocks privilege escalation exploits to achieve similar privileges and
defense levels for regular apps. Developers of these apps know that it is easier to compromise the supply chain
of device manufacturers than to attack the Android platform security model.
To combat the problem of pre-installed PHAs, the Android Security team launched a security program in 2017
as part of the Android device certification process. We expanded the program in 2018 and now every new
Android-certified device goes through the same app scanning process as apps on Google Play. Additionally, our
security scanner looks for other common security and privacy issues and denies device certification until device
manufacturers fix these problems.
Backdoored SDKs, apps, and other code
Some SDKs appear legitimate, but include behaviors and functionality that the app developer may not have known
about when they included the SDK. This functionality may compromise user data, device integrity, or experience.
It may also be used as a part of a larger initiative, such as committing click fraud, mining cryptocurrency, or app
install attribution fraud.
Here are some approaches developers use to include malicious code in legitimate SDKs:
—— Backdoored SDKs with legitimate functionality
—— Backdoored Android system code that injects the malicious code into every app on the device
—— Modified Google apps with backdoor code injected
—— Modified SDKs rehosted with similar names to confuse legitimate developers into accidentally downloading
them
Hundreds of apps have been affected by backdoored code. We have been working with impacted developers to
educate them about this new threat and to publish updated versions of their apps without the backdoor code.Android Security 2018 Year in Review 15
Device and ecosystem hygiene
The broadest statistic for measuring device hygiene is how frequently a routine full-device scan detects PHAs.
Since we began to measure device hygiene in late 2014, an average of less than 1% of devices have PHAs
installed at any point. This trend remained steady in 2018.
In 2018, 0.45% of all Android devices running Google Play Protect had
installed PHAs, compared to 0.56% of PHA-affected devices in 2017.
This equates to a 20% year-over-year improvement to the health of
the Android ecosystem.
Apps available on Google Play must adhere to published policies and are reviewed to verify their compliance. Of
the millions of apps published on Google Play, only 0.08% of devices that exclusively used Google Play had one or
more PHAs installed (unchanged from last year).
In contrast, 0.68% of devices that installed apps from outside of Google Play were affected by one or more PHAs
in 2018. While this number is 8 times higher than devices that exclusively used Google Play, it’s a noticeable
improvement from 0.80% in 2017.
Devices that installed apps only from Google Play were 8 times less
likely to be affected by PHAs.
Percentage of devices with PHAs installed, 2016-2018
Google Play Outside of Google Play
0.8%
0.74%
0.68%
PHA RATE
0.05% 0.08% 0.08%
2016 2017 2018
YEAR
This graph shows the percentage of devices that were affected by PHAs over the past three years. The green line
represents devices that only downloaded apps from Google Play while the orange line represents devices that
also installed apps from outside of Google Play.Android Security 2018 Year in Review 16
Device hygiene in the largest Android markets
While Google Play and the overall Android ecosystem became safer in 2018, there is some variance based on the
country of the device. Of the five largest Android markets, three (India, Indonesia, Brazil) became cleaner year-
over-year, one (Russia) stayed at the same level, and for one the numbers went up (USA). These markets have
unique challenges for threat severity and distribution of PHAs, so each is discussed in more detail in this section.
Device hygiene of the largest Android markets, 2018
1.5%
Global
1%
IN
US
PHA RATE
BR
ID
0.5%
RU
0%
2016 2017 2018
YEAR
In India, which is by far the biggest Android market, the number of devices affected by PHAs has decreased each
year. In 2018, 0.65% of all Indian devices were affected by PHAs at any time, a 35% drop from the previous year.
For the first time, India didn’t have the highest device rate of PHAs among the top Android markets. In India, most
PHAs were Trojans, backdoors, or hostile downloaders that downloaded more PHAs onto devices. These apps
were introduced to users through supply chain attacks either in the form of pre-installed apps on new devices
or OTA updates handled by untrustworthy OTA companies. Pre-installed apps from the EagerFonts, Snowfox,
and Chamois families were the most common. For more details on these families, see PHA Families. Two apps
outside of this category are versions of a popular video player that mines cryptocurrency in the background
without user consent. Mobile devices have been damaged by cryptocurrency mining in the past, so we flag apps
with this behavior as PHAs.
As in previous years, the USA is the second biggest Android market. In 2018, the number of impacted devices
rose from 0.4% to 0.5% due to the introduction of click fraud as a PHA category. However, compared to India, the
USA’s context for PHAs is different and less severe. Eight of the top ten PHAs in the USA are wanted by users
or don’t significantly impact them directly. Of these eight, four are power-user tools for rooting devices or for
circumventing other security settings and four are click fraud apps (of the CardinalFall and Snowfox families)
that may harm advertising networks but not users. As a reminder, click fraud wasn’t considered a PHA before
2018 and was treated only as a Google Play policy violation. Thus, the increase is significantly impacted by the
inclusion of click fraud as a PHA category. Only two of the top ten are hostile downloaders or Trojans. In the USA,
Of the top ten PHAs, only one was distributed pre-installed on the device, and that was limited to a single device
type from one carrier.Android Security 2018 Year in Review 17
Brazil continued to be the third-largest Android market in 2018. In 2017, and again in 2018, Brazilian Android
devices were the cleanest among major markets with a 0.23% PHAs device rate (about half the global average).
While the number of affected devices was lower than in other markets, the data suggests that Brazil, like India,
still faces challenges in ensuring device integrity through the supply chain process. Four of the top ten PHAs in
Brazil were pre-installed PHAs that were shipped on devices of a single Brazilian original equipment manufacturer
(OEM). Two others were OEM-specific third-party stores from a different OEM that offered high numbers of PHAs
to users for download. The remaining four PHAs on the top ten list were power user tools that disabled security
settings to enable app piracy.
Indonesia is the fourth-largest Android market and the major market most affected by PHAs. Its overall landscape
of PHAs looks similar to India’s, likely because the Android OEMs and distributors targeting these countries are
similar. That means Indonesia’s Android PHAs are hostile and dangerous to users, and many PHAs come pre-
installed on devices sold and used in Indonesia without end users’ knowledge. Of the top ten PHAs in Indonesia
in 2018, four were pre-installed Trojans posing as system settings apps, font manager apps, or quick search apps.
Two others were Trojanized utility apps (a flashlight app and a camera app) for which the distribution vectors are
unknown.
The last of the five largest Android markets is Russia. While below the world-wide average for PHA infections,
Russia’s infections are user-hostile and often pre-installed on devices. Seven of the top ten PHAs in Russia in
2018 were pre-installed Trojans. Several of those have been known to us since 2016 (Chamois family), which
hints at a greater device longevity in Russia compared to the other surveyed countries. Two more of the top ten
apps were problematic third-party app stores that either offer many PHAs for download or tamper with device
security settings without user consent.
Percentage of devices with PHAs installed in 2018, by top countries
Google Play Google Play and outside of Google Play
1.0%
0.8%
0.6%
0.4%
0.2%
7x 7x 8x
x x
11 9x 11
0.0%
IN US BR ID RU GlobalAndroid Security 2018 Year in Review 18
Device hygiene by Android version
Newer versions of Android are less affected by PHAs.
Android 8 and Android 9 have PHA rates that are at 0.19% and 0.18%
respectively.
We attribute this trend to advancements in platform security. In particular, newer Android versions are more
resilient to privilege escalation attacks that previously allowed PHAs to gain persistence on devices and protect
themselves against removal attempts. On newer versions, GPP is effectively cleaning PHAs. In conjunction with
platform changes, GPP is preventing PHAs from protecting themselves from removal or disabling.
Percentage of devices with PHAs installed in 2018, by Android version
0.65%
0.55%
0.29%
0.19% 0.18%
w
at
eo
e
op
Pi
o
ug
Or
llip
all
No
m
Lo
sh
ar
M
PHA distribution analysis
The device hygiene metric discussed in the previous section provides a way to track how many devices have
installed one or more PHAs. This section focuses on how those PHAs are distributed inside and outside of
Google Play.
Many devices install from both inside and outside of Google Play, so device hygiene is a blended average of all
distribution paths. Device hygiene varies across the ecosystem based on the number of apps users install, which
ranges from zero to several hundred apps per device. To provide more insight into the root cause of changes in
device hygiene, we also analyze the individual install events and distribution paths.Android Security 2018 Year in Review 19
Percentage of PHA installs by market segment, 2016-2018
Google Play Outside of Google Play
3.32%
PHA INSTALL RATE
PHA INSTALL RATE
1.48%
0.92%
0.04% 0.02% 0.04%
2016 2017 2018 2016 2017 2018
PHA install rates from Google Play increased from 0.02% in 2017 to 0.04% in 2018 (+100% YoY). This increase
is due to the inclusion of click fraud as a PHA category. As mentioned earlier, before 2018 click fraud wasn’t
considered a PHA and was treated only as a Google Play policy violation. If we remove the numbers for click
fraud from these stats, the data shows that PHAs on Google Play declined by 31% year-over-year.
In Google Play, we can remove any app that shows PHA behavior. For apps outside of Google Play, this isn’t
the case. Because of this difference, in addition to actual installs, we also track installation attempts for
apps installed from outside of Google Play. Not all installation attempts result in actual installs: if users heed
the warning that an app is a type of PHA, they won’t install the app. In particularly harmful cases, such as
ransomware or banking phishing apps, Google Play Protect blocks the installation in addition to warning users.
In 2018 the total number of app installations in Google Play grew 16%
compared to 2017.
The sideloaded PHA install rate also showed a drastic reduction from 1.48% in 2017 to 0.92% in 2018 (-38% YoY).
Outside of Google Play, PHA installation attempts in 2018 fell by 20% from the previous year. Google Play Protect
stopped 73% of PHA installations from outside of Google Play in 2018 compared to 71% in 2017 and 59% in 2016.
The other 27% were a combination of apps that were installed before we identified them as PHAs and users who
ignored Google Play Protect's warnings.
Google Play Protect prevented 1.6 billion PHA installation attempts
from outside of Google Play in 2018.Android Security 2018 Year in Review 20
PHA install attempts outside of Google Play, 2016-2018
Installed Prevented
29% 27%
41%
71% 73%
59%
2016 2017 2018
Google Play: PHA Trends
In 2018, 0.04% of all downloads from Google Play were PHAs. In 2017, the number was 0.02%. This increase is
due to the change in methodology of upgrading the severity level of click fraud applications from policy violations
to PHAs. If we omit the addition of click fraud for a comparision, 2018 is at 0.017% which is still a reduction from
2017. Now we look for click fraud inside and outside of Google Play and warn users about these apps. All other
PHA categories have declined each year or increased at low levels.
The following sections highlight trends in the most important PHA categories on Google Play.
Top PHA categories
These charts compare all PHA categories by percentage. For example, click fraud installs accounted for 0.023%
of all installs in Google Play during 2018.Android Security 2018 Year in Review 21
Percentage of PHA installs by category in Google Play, 2017 vs. 2018
2017 2018
0.023%
PHA INSTALL RATE
0.007%
0.004%
0.003% 0.003% 0.003% 0.003% 0.002% 0.003%
0.002% 0.002% 0.001% 0.002%
0.000% 0.001% 0.001%Android Security 2018 Year in Review 22
Many of the major apps that we removed from Google Play in 2018 because of embedded click fraud code were
flashlight, music player, or game apps. Click fraud developers build their code into apps that users tend to use
daily and keep installed on their devices.
US
13.8%
IN
8.4%
BR
8.1%
ID
Others 4.9%
46.5% MX
3.9%
RU
3.2%
PH
TR
3.1%
2.4%
VN
3.1%
For details on two of the biggest click fraud families on Google Play, see FlashingPuma and CardinalFall.
Google Play: Trojan
In 2018, about 0.007% of all app installs on Google Play were Trojan applications, an increase of 0.004%
compared to 2017. That’s equivalent to about 16.0% of all PHA apps downloaded from Google Play last year. In
2018, Trojan apps were mainly targeting India, Germany, and Turkey.
The vast majority of Trojan applications downloaded from Google Play fall into a single family called Idle Coconut
which is distributed as an SDK to legitimate developers. When these developers include the Idle Coconut SDK
in their apps, the apps double as end points of a certain commercial VPN that routes traffic through affected
Android devices. This behavior is not disclosed to users who may notice unusual network traffic coming from
some apps. For a more detailed description, please see the section about Idle Coconut further down in this report.Android Security 2018 Year in Review 23
IN
22.4%
DE
6.5%
TR
Others 5.4%
40.8%
US
4.9%
AR BR
2.3% 4.6%
PK ID
2.4% 4.0%
MX RU
2.8% 3.8%
Google Play: SMS fraud
In 2018, about 0.003% of all app installs from Google Play were SMS fraud, the same level as in 2017. With click
fraud recategorized as a PHA, SMS fraud among all PHAs dropped to 6.8%. Last year, SMS fraud apps were
mainly targeting devices in Thailand, Malaysia, UAE, Egypt, and Iraq. In October we announced a Google Play
policy change limiting which apps are allowed to ask for SMS permissions. This means only an app that has been
selected as a user's default app for sending text messages will be able to access SMS.
BreadSMS remains the largest SMS fraud family on Google Play. This family targets users in Thailand almost
exclusively. When users run a BreadSMS app, the app subscribes the device to premium SMS content without
user consent. For a more detailed description of BreadSMS, see our 2017 Year in Review.
Others
20.5%
IN
2.1%
TH
SA
38.3%
2.7%
GR
3.2%
VN
3.3%
DE
3.4%
IQ
3.5% MY
EG 12.0%
5.4%
AE
5.6%Android Security 2018 Year in Review 24
Outside of Google Play: PHA Trends
In 2018, the ratio of PHA installs to total installs decreased by roughly 38% from the previous year, so the overall
health of the Android ecosystem improved.
In 2018, 0.92% of sideloaded apps were PHAs, compared to 1.48% in 2017. In context, this positive downward
trend doesn’t include pre-installed apps. Nevertheless, with the exception of the top PHA category (backdoors)
and the new category (click fraud), all PHA categories saw strong declines outside Google Play.
Top PHA categories
These charts show all PHA categories broken down by percentage against other PHAs in 2017 and 2018. For
example, in 2017 backdoor installs accounted for 0.22% of all installs outside of Google Play and in 2018 they
represented 0.26%.
Percentage of PHA installs by category outside of Google Play, 2017 vs. 2018
2017 2018
0.39%
0.33%
0.26%
PHA INSTALL RATE
0.23%
0.22%
0.20%
0.17%
0.14% 0.14%
0.12%
0.03%
0.02% 0.02% 0.02% 0.01% 0.01% 0.01% 0.02% 0.01%
0.01%
Backdoor Trojan Hostile Click SMS Rooting Privilege Toll Phishing Spyware
downloader fraud fraud escalation fraud
Distribution of PHA categories outside of Google Play, 2018
Backdoor
Trojan
28.0%
Hostile downloader
13.0%
Click fraud
SMS fraud
Rooting
Privilege escalation
22.0%
25.1% Toll fraud
Phishing
OthersAndroid Security 2018 Year in Review 25
Outside of Google Play: Backdoors
In 2018, backdoors were the most prevalent PHA category outside of Google Play where they make up 28.0%
of all PHA installs and 0.26% of all app installs (up from 0.22% in 2017). Last year, backdoor apps were mainly
targeting devices in Russia, Brazil, Mexico, and Vietnam.
As the prevalence of Trojans and hostile downloaders decreased in 2018, backdoors took the top spot. However,
the spread of backdoor PHAs is attributed to a specific PHA family—Chamois—that we previously discussed
publicly. Chamois apps are pre-installed on popular devices from different OEMs that didn’t carefully scan for
malware. As a consequence, users are buying compromised systems. When users start up their new devices, the
pre-installed Chamois apps (usually disguised as system apps) download and install PHAs and other apps in the
background.
RU
14.3%
Others
34.1%
BR
9.5%
IN
US 7.5%
2.2%
TH MX
2.9% 7.3%
PH VE
3.9% 7.3%
AR ID
5.4% 5.6%
For more information on the Chamois family, see Chamois.
Outside of Google Play: Trojans
The prevalence of Trojans among all installed apps fell from 0.33% in 2017 to 0.23% in 2018, decreasing their
rank to second. Trojans now only account for 25.1% of all sideloaded PHAs. Last year, Trojans were particularly
targeting devices in India, Indonesia, Mexico, and the Philippines.
Like hostile downloaders, Trojans have many variations and aren’t from a particular PHA family. The only
noteworthy Trojans are those that mine cryptocurrency without user consent. As cryptocurrency prices rose
dramatically at the end of 2017 and early 2018, the number of malicious actors also rose. Google Play Protect
started warning users about the potential problems of cryptocurrency mining on their devices. In 2018, 4 of the
top 11 Trojans were cryptocurrency miners, all embedded in a popular video player app (previously mentioned as
the most prevalent PHA in India).Android Security 2018 Year in Review 26
Others IN
37.3% 27.7%
DZ
2.0% ID
8.4%
BD
2.8% MX
5.4%
PK PH
3.0% 4.0%
RU BR
3.4% 3.8%
Outside of Google Play: Hostile downloaders
In 2018, hostile downloaders made up 22.0% of all sideloaded PHAs, making this the third most prevalent
category, as in 2017. While this category accounted for 0.39% of all sideloaded apps in 2017, it is down to 0.20%
in 2018, a sharp decline. Last year, Trojans were particularly targeting devices in India, Indonesia, Russia, Brazil,
and Mexico.
The prevalence of hostile downloaders is due to a combination of legitimate third-party stores with poor security
setups that distribute PHAs, fake stores that are built specifically for spreading PHAs, pre-installed apps that
slipped through the security scans of OEMs, and plain apps that pretend to (or actually do) offer user-wanted
features while downloading PHAs in the background.
IN
18.9%
Others
38.3%
ID
9.3%
RU
US
9.3%
2.8%
BR
TH
2.8% 7.7%
PH MX
3.7% 4.3%Android Security 2018 Year in Review 27 PHA Families Google Play Protect removes all apps it detects from Google Play that are part of any of the PHA families listed below. Chamois Chamois was one of the most impactful PHA families in Android in 2018 with more than 199 million installs. It originally emerged in late 2016 and again in early 2017; Google detected and disrupted the first two variants. After an eight month hiatus, Chamois re-emerged in November 2017 outside of Google Play. Chamois uses a variety of distribution mechanisms including being pre-installed, added as an advertising SDK, and injected into popular sideloaded applications. The Android security team implemented detection and remediation techniques across these channels, leading to a sharp decline in installs in 2018. Chamois is a well-engineered, sophisticated piece of malware. As of November 2018, there were five known variants of the Chamois botnet family, three of which emerged after November 2017. These variants are comprised of four or five stages with anti-analysis features and a command-and-control infrastructure for deploying their payload. Google Play Protect classifies Chamois as a backdoor due to the remote command-and- control capabilities it has. The payloads for Chamois range from a variety of ad fraud payloads to SMS fraud to dynamic code loading. Snowfox Snowfox is an advertising SDK with two variants; one variant steals OAuth tokens from a device and the other injects JavaScript for click fraud into WebViews with loaded ads. The Snowfox campaign began in late 2017 and peaked in March 2018. Over the course of 2018, apps with the malicious Snowfox SDK were installed more than 16 million times. Snowfox is predominantly distributed outside of Google Play by apps including the SDK. However there are some distribution mechanisms where an application dynamically downloads the Snowfox SDK as a plugin, probably to bypass static analysis. Cosiloon Cosiloon is a family of hostile downloader PHAs that was pre-installed on uncertified Android devices. Cosiloon apps are two-stage PHAs with the first stage pre-installed on the device. There are two variants of the first stage: a standalone, pre-installed application and a backdoored System UI application. The first stage downloads and installs the second stage, which shows ads and installs other PHAs. Cosiloon was initially detected in November 2017. In early 2018, Avast and Google Play Protect collaborated on a threat analysis. Google Play Protect then deployed two remediation solutions to protect users. By March 2018, Cosiloon was largely eradicated from the Android ecosystem. Because it was pre-installed, Cosiloon was exclusively found outside of Google Play.
Android Security 2018 Year in Review                                                                                     28

   BreadSMS
   BreadSMS is a large PHA family that Google Play Protect began tracking in the beginning of 2017. BreadSMS
   evolved rapidly in 2018, accumulating over 11 million installs with approximately 98% of those occurring on
   Google Play.

   In 2018, BreadSMS added cloaking and obfuscation techniques to evade detection. For example, when some
   BreadSMS apps detect that they are being analyzed, a disclosure and consent dialog opens for premium SMS
   messages. The dialog doesn’t appear when running on users’ devices. In 2018, BreadSMS added WAP fraud,
   subscribing users to services that charge their mobile bills without their knowledge or consent.

   In 2018, 52.6% of BreadSMS installs occurred in Thailand and 19.1% occurred in Malaysia.

   View SDK
   View SDK is a monetization SDK that uses JavaScript to perform ad click fraud. View SDK was originally
   discovered by Google Play Protect in December 2017. However, Google Play Protect didn't begin treating click
   fraud as a PHA category until March 2018. During 2018, there were approximately 5.2 million app installs
   containing View SDK. All of these installs were sideloaded; none occurred from Google Play.

   Affected apps drop a JAR file containing View SDK during execution. View SDK then downloads JavaScript from a
   remote server and injects it into a WebView showing ads and triggering fake ad clicks without user intervention.

   Triada
   Triada software was first documented by Kaspersky in 2016 as a rooting Trojan. In mid-2017, Dr. Web
   documented a pre-installed backdoor variant where the log function in the Android framework of the device’s
   firmware had been backdoored. Any application related to Triada can then communicate and perform commands
   using the backdoored log method. This variant also injects code into other processes, such as browsers or
   Google Play. The purpose of this backdoor was to show ads and install other applications.

   During 2018, Google identified all Triada variants, including new ones, and all devices infected with Triada. Based
   on this information Google reached out to OEMs to remediate. OEMs provided users with system updates that
   removed the Triada backdoor.

   CardinalFall
   CardinalFall is a large PHA family with an SDK that implements click fraud and, in some cases, dynamic code
   loading. The CardinalFall SDK uses encrypted communication with a number of command-and-control servers to
   evade detection. The servers provide CardinalFall apps with specific ad IDs (including AdMob and Facebook ad
   IDs) that are used to serve ads to the affected devices. When an ad is fetched, the CardinalFall app uses the click
   API on a WebView to automatically trigger fake clicks on the loaded ad without user intervention.

   More than 90% of all CardinalFall apps have been found on Google Play. The countries most significantly affected
   by this PHA family in 2018 were India, the US, and Pakistan; although users in more than 10 other countries were
   also impacted.
Android Security 2018 Year in Review                                                                                 29

   FlashingPuma
   FlashingPuma is a large click fraud family discovered in 2018. More than 75% of these apps are from outside of
   Google Play. The FlashingPuma SDK fetches ads and generates fake clicks without user intervention, crediting
   the fraudsters.

   FlashingPuma apps were propagated worldwide, but India was the most affected country with 30% of all installs.
   Enforcement fluctuated during 2018, as new variants were being produced and identified. Now Google Play
   Protect is detecting all apps that belong to this family, whose footprint is significantly reduced.

   EagerFonts
   EagerFonts is an SDK embedded in the Fonts apps that come pre-installed on some Android devices. The
   EagerFonts PHA family was discovered by Google in mid-2018 and at its peak was present in approximately 12
   million devices globally across hundreds of OEMs. Google Play Protect treats EagerFonts as a backdoor because
   it uses a remote server to dynamically download and run fake plugins; these are known PHAs, including Chamois
   and Snowfox. Unlike other hostile downloaders, EagerFonts didn't install an app, but loaded and ran the fake
   plugins dynamically in the original app’s process.

   Google has worked with the affected OEMs to remediate the EagerFonts infections. Upon discovering this family,
   Google immediately stemmed the infection by halting the shipment of new builds containing the PHAs.

   Idle Coconut
   Idle Coconut is an SDK that developers include in their apps for monetization. The apps double as end points of
   a certain commercial VPN that routes traffic through affected Android devices. The SDKs use a websocket for
   communications with a command-and-control (CnC) server and then connect to hosts that the CnC commanded
   over “normal” sockets. None of this behavior is disclosed and the user’s device unknowingly becomes used in a
   proxy network. Thus, Google flags these apps as Trojans.

   About 60% of the installs of Idle Coconut in 2018 came from Google Play and approximately 40% were from
   sideloaded applications. India had the highest rate of installs (approximately 25%) during 2018.
Android Security 2018 Year in Review                                                                                  30

Acknowledgments

   This report—and all of the hard work that it represents—isn’t the product of a single team or company.

   Thank you to the Google teams, our Android partners, and the external researchers who contribute to the security
   of Android throughout the year. Your hard work, effort, and commitment to security makes the entire
   Android ecosystem safer and protects Android users across the world.
Android Security 2018 Year in Review
You can also read