SR 167 HOT Lanes Pilot Project - Third Annual Performance Summary May 2008 - April 2011
←
→
Page content transcription
If your browser does not render page correctly, please read the page content below
SR 167
HOT Lanes Pilot Project

Third Annual Performance Summary
May 2008 – April 2011
Drivers are relying more on HOT lanes
The SR 167 HOT lanes are providing a faster, more reliable commute
for Sue Dahl of south Seattle, who started using the HOT lanes
as soon as they became available in 2008. As a clinical nurse, Dahl
commutes daily to different facilities between Seattle’s Seward Park
neighborhood and Covington.

“I used to commute from Seward Park to Tacoma frequently and
there was hardly ever a time I didn’t use the HOT lanes on SR 167
because traffic was so slow,” said Dahl. “Using the HOT lanes has
                   tremendously improved my commute and saves
                   me about 45 minutes.” Dahl uses the HOT lanes to
                   keep her on time as she drives to different facilities
                   around South King County.

                 “I was thrilled when the HOT lanes came around.”
                 said Dahl. “I think of it as a business tool. I would
be enormously disappointed if the HOT lanes were to be discontinued
because HOT lanes are a large asset for me.”

Now that the HOT lanes are in their third operating year,
drivers like Dahl have come to depend on them. Outreach about
the benefits of using Good To Go! has increased awareness of the
SR 167 HOT lanes and now a broader group of drivers are saving time
and money by using them. Giving drivers the opportunity to choose
whether or not to use the HOT lanes allows for flexibility
and more consistent commute times.

This report provides elected officials, transportation professionals and
the public with a detailed analysis of the first three years of operations
and performance.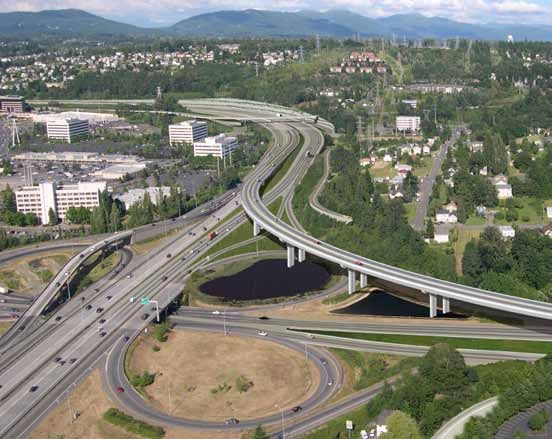
SR 167 HOT Lanes Pilot Project Third Annual Performance Summary
Executive Summary
Revenue & Expenditures: revenue exceeds
operating costs
• Toll revenue exceeded operating costs.
• HOT lane revenue increased 35 percent in fiscal year
2011, generating $750,000; compared to $560,000 that
was generated in fiscal year 2010.
• Toll collection costs have decreased.
Traffic Performance: a reliable trip for everyone
• Approximately 90,000 unique Good To Go! passes
have been used to pay for the SR 167 HOT lanes since
they opened.
• The average number of tolled trips continues to increase:
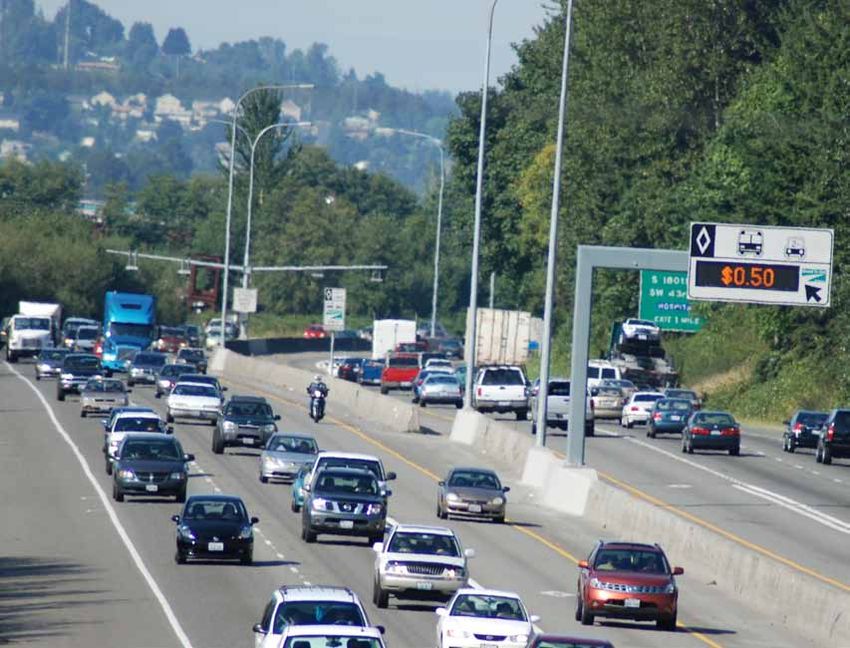
The antenna for electronic tolling on SR 167 HOT lanes u 3,300 tolled trips per weekday* in April 2011, which
The State Route 167 high occupancy toll (HOT) lanes is a nearly 50 percent increase over April 2010 and a
reached a significant milestone in its third year of 87 percent increase over April 2009.
operations. Toll revenue began exceeding operational costs • Travel times in the general purpose lanes are more
in April 2011. More drivers than ever are choosing to use the reliable than before the HOT lanes opened.
SR 167 HOT lanes for a reliable trip. The project’s primary • The average toll paid has stayed between $0.75 and
objective remains unchanged: congestion management. $1 per trip.
HOT lanes continue to help reduce congestion and maintain • Since opening the HOT lanes, peak-period traffic is
free-flow traffic conditions for all lanes in this corridor. moving more efficiently:
Generating revenue is an added benefit.
u On average, daily general purpose lane volumes have
People who opt to use the HOT lanes save time and minimize decreased 4 to 5 percent, while speeds have increased
the stress associated with their daily commute. When drivers 8 percent.
choose to use HOT lanes, it also frees up space and improves u On average, daily HOT lane volumes have increased
speeds in the general purpose lanes. The end result is better 15 percent, while speeds have remained around the
flowing traffic that benefits everyone traveling on SR 167. posted 60 mph speed limit.
It is also known that SR 167 HOT lane customers are the Safety: fewer collisions
strongest supporters because they experience the benefits • Preliminary data indicates that the average number of
firsthand. In fact, a majority of customers polled stated collisions is down 4 percent when compared to the five
they’d choose to use SR 167 HOT lanes again in the future. year average prior to HOT lanes opening in 2008.
Nearly 60 percent of HOT lane business customers consider Customer Service: happy with the system
the HOT lanes to be helpful for their business. • Over 70 percent of surveyed HOT lanes customers
stated they are likely to use the lanes in the future.
• Complaints have remained infrequent.
“Even as highway budgets are forced to do
more with less, the number of vehicles on our Enforcement: drivers comply with HOT lane rules
roads continues to climb. We need to work • Washington State Patrol continues to estimate the
smarter with what we already have.” compliance rate at 95-97 percent.
— USDOT Secretary Ray LaHood
*Monday and Friday excluded due to inconsistent traffic volumes.
-1-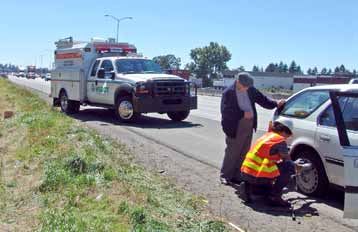
Washington State Department of Transportation
The Pilot Project
On the third anniversary of Washington State’s first-ever On SR 167, the variable toll ensures that traffic in the
HOT lanes, more drivers are choosing to pay a toll to use HOT lane always flows smoothly. The system calculates a
the SR 167 HOT lanes saving valuable time and reducing new toll rate (via an algorithm) from 50 cents to $9 every
the stress that comes with congestion. This pilot project, five minutes. This helps the HOT lanes make the most
between Renton and Auburn, provides solo drivers a reliable efficient use of carpool lane space, while ensuring that
commute option, while continuing to offer free-flowing buses and carpools still have a free-flowing, reliable trip.
travel for transit and carpools.
Figure 1: On May 3, 2008, the SR 167 HOT Lane Pilot Project
opened north- and southbound HOT lanes between Renton
In 2008, WSDOT converted existing SR 167 High- and Auburn. Carpools, buses, motorcycles, and toll paying
Occupancy Vehicle (HOV) lanes to HOT lanes to make solo drivers can access the lanes via zones (marked in
better use of the available space in the HOV lanes. Today, orange) for a faster, more reliable trip.
solo drivers with a Good To Go! pass have the option to pay
a variable, electronic toll for a faster trip in the HOT lane
when space is available.
Carpools of two or more people, vanpools, buses and
motorcycles use the HOT lane toll-free, just as they did
in the HOV lanes, and they do not need a pass. If the
HOT lanes become too full, they switch to HOV only.
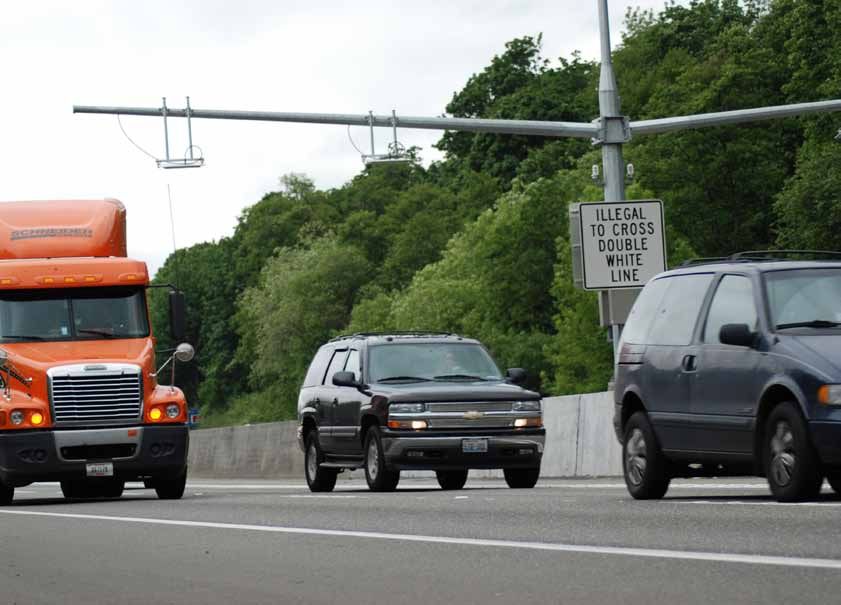
The HOT lanes run northbound and southbound on
approximately 10 miles of SR 167. The highway’s two
general purpose lanes in each direction remain toll-free
and open to all traffic. The HOT lanes are separated from
the general purpose lanes by a solid double white line,
which is illegal to cross. Access in and out of the HOT lanes
is restricted to access zones identified by a dashed white line
(there are six northbound and four southbound
access zones).
Reducing congestion through variable tolling
Variable tolling is a tolling structure where the toll price
changes over time according to certain performance criteria.
The SR 167 HOT lane pilot project uses a type of variable
tolling where the toll rate adjusts dynamically based on
real-time traffic data. The data, collected by sensors
embedded in the roadway, measure vehicle speed and traffic
volume data. When traffic is heavy, the toll price increases,
and when it’s light, the price decreases – the law of supply
and demand.
-2-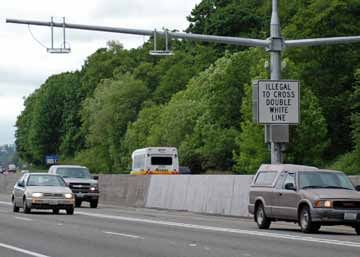
SR 167 HOT Lanes Pilot Project Third Annual Performance Summary
HOT lanes across America Figure 2: HOT lanes across the United States
Source: Project Websites September 2011
WSDOT continues to share information among other SR 167 HOT Lanes
Seattle
projects across the nation that have implemented HOT or I-15 HOT Lanes
Salt Lake City
express toll lanes, which use tolls to manage demand and Seattle
I-394 HOT Lanes
Minneapolis
reduce congestion. The map shown in Figure 2 shows the
location and status of toll lane projects. There are currently Minneapolis
11 HOT or express toll systems in place in the United States, Salt Lake City
Denver
New York City
Alameda County Washington D.C.
most of which are expanding due to their initial success.
Across the nation, another 34 HOT or express toll lane Los Angeles
Orange County
Research Triangle Park
Charlotte
projects are either being implemented or feasibility studies San Diego
Atlanta
are being conducted for them. I-15 Managed Lanes Austin
Dallas
San Diego Orlando
State Route 91
Express Lanes San Antonio Tampa
Why SR 167? Orange County I-25 HOT Lanes
Denver
Katy & Northwest
Ft. Meyers Miami
I-95 Express
The SR 167 corridor runs north and south connecting Freeway Managed Lanes
Houston
Toll Lanes
Miami
communities between Renton and Tacoma. It provides the
LEGEND Albers Projection
Managed Lanes in Operation Feasibility Studies
Central Meridian: -96
1st Std Parallel: 20
2nd Std Parallel: 60
Managed Lanes Being Implemented Proposals Being Considered
Latitude of Origin: 40
Puget Sound Region with an alternative north-south route
to I-5. Unlike most HOV lanes in the region, which
HOT lanes growing in popularity
operate at or above capacity during peak-periods, the
HOV lanes on SR 167 had available space during peak- Alameda County: A 14-mile stretch of HOT lanes opened on I-680
outside of San Jose , CA in September 2010. In 2013 another
period commute times. WSDOT engineers saw HOT lanes 11 miles of I-580 HOV lanes will be converted to HOT lanes.
as a tool to increase vehicle throughput without reducing Atlanta: Georgia DOT opened the I-85 Express Lanes in
the level of service enjoyed by carpools and transit. October 2011 when it converted 16 miles of existing HOV lanes
to HOT lanes. They expect to open an additional 12 miles of
Over the next 30 years, the HOT lanes on I-75 in 2015.
population in the Puget Sound Denver: In June 2006, CDOT converted 7 miles of I-25 HOV
lanes to HOT lanes featuring electronic tolls with the EXpressToll
Region is expected to increase by transponders.
about 1.7 million and the number
Houston: In April 2009, Harris County Toll Road Authority
of jobs by about 1.2 million over completed converting 10 miles of I-10 to HOT lanes with time of
2000 levels. Our general purpose day variable tolling.
lanes, and most of our HOV lanes, Miami: In December 2008, HOT lanes began operating on a
7-mile stretch of northbound I-95. The facility features variable,
are already congested during peak-
electronic tolling with the SunPass transponder. Electronic toll
periods, and those peak-periods are collection on a new southbound HOT lane began in January 2010.
becoming longer all the time. HOT Minneapolis: Minnesota has two Express Lanes facilities
lanes are a way to operate our highways more efficiently currently in operation. I-394 was completed in 2005 and I-35W
was completed in late 2009. An extension to the I-35W Express
and manage traffic demand with more commute choices. Lanes is scheduled to be completed in 2012.
These strategies are part of Moving Washington, WSDOT’s
Orange County: The 10-mile HOT facility on SR 91 opened in
statewide program to keep people and goods moving December 1995. In 2002, voters approved a tax increase to help
through the next decade and beyond. to extend the facility 10 more miles into Riverside County.
Salt Lake City: Utah DOT converted its 38-mile HOT facility on
I-15 from a $50 per month subscription service to electronic,
variable tolling in fall 2010, and is planning to extend the lanes
another 22 miles.
San Diego: San Diego has two reversible express lanes that
currently cover 16 miles. HOT lanes have operated on I-15 since
1996. By 2012 the facility will stretch to 20 miles.
-3-
Washington State Department of Transportation

Revenue & Expenditures

                                                                                                   Expenditures: operating costs drop
    Since HOT lanes began in 2008 revenue
                                                                                                   WSDOT is continuing to take measures to lower
    has increased 88 percent. In the fourth
                                                                                                   HOT lanes operating costs. For example, the agency opened
    quarter of FY 2011 toll revenue surpassed
                                                                                                   a statewide customer service center to support all current
    operational costs.
                                                                                                   and future state tolling facilities. This action centralized all
                                                                                                   customer service activities and lowered the operating costs
Revenue: exceeds operating costs                                                                   by $30,000 per month.

The SR 167 HOT lanes were designed to help                                                         All items relating to the operation of the HOT lanes are
reduce traffic congestion and maintain free-flow traffic                                           accounted for in the expenditures, including: customer
conditions in the HOT lanes. Revenue generation is an                                              service center and back office processing, tolling vendor
added benefit. Nonetheless, revenue has gradually increased                                        operation, cost of passes, HOT lane specific enforcement
(see Figure 3) as drivers have grown more comfortable with                                         by WSP, technology research and consultant services, credit
tolling operations, the economy recovers and Good To Go!                                           card and bank fees, maintenance, Incident Response Team
pass ownership within the region becomes more common.                                              services, Traffic Management Center operation, salaries and
Today, toll revenue covers operating costs.                                                        benefits, supplies, communications, as well as office space
                                                                                                   with related equipment and utilities, and printing.
The items included in revenue are toll collections, pass and
pass shield sales, and operating fund interest.                                                    Toll rates: remain steady
                                                                                                   The toll rate can range from $0.50 to $9.00. The average
                                                                                                   toll rate remained between $0.75 and $1.00 in each of the
    Figure 3: Revenue exceeds operating costs
                                                                                                   three years.
                                                            Revenue           Expenditures
     $500,000                                                                                      In June and July 2008, tolls reached the maximum rate of
     $400,000                                                                                      $9.00. Since then WSDOT engineers adjusted the dynamic-
     $300,000
                                                                                                   pricing algorithm and the toll rate has not exceeded $5.50.
                                                                                                   The higher toll rates during the first few months were the
     $200,000
                                                                                                   intentional result of a sensitive pricing algorithm that was
     $100,000
                                                                                                   set to ensure carpools and buses had premium service while
           0
                 Q1      Q2       Q3        Q4      Q1      Q2         Q3         Q4
                                                                                                   traffic adjusted to the new HOT lane system. (see Figure 4)
                FY 10   FY 10    FY 10     FY 10   FY 11   FY 11      FY 11      FY 11

                                                                                                      Figure 4: Maximum toll rate floats around $4.75
                          Total Revenue                Total Expenditures
      Q1 FY 10                  $120,535                      $367,148                                  Max. Toll                           Year One      Year Two      Year Three
                                                                                                                                            (2008-2009)   (2009-2010)   (2010-2011)
      Q2 FY 10                  $135,799                       $327,181                                 $10.00

      Q3 FY 10                  $136,693                      $456,683                                   $8.00

      Q4 FY 10                  $162,031                      $332,161                                   $6.00
      Q1 FY 11                  $165,444                      $285,416
                                                                                                         $4.00
      Q2 FY 11                  $180,357                      $334,148
                                                                                                         $2.00
      Q3 FY 11                  $165,225                      $246,187
                                                                                                              0
      Q4 FY 11                  $239,420                      $226,595                                              May Jun Jul Aug Sep Oct Nov Dec Jan Feb Mar Apr

                                                                                                      Source: NW Region Traffic and Customer Service Center
    Source: WSDOT Quarterly Financial Statements and WSDOT DataMart

                                                                                             -4-
SR 167 HOT Lanes Pilot Project Third Annual Performance Summary

Traffic Performance

More people choosing to pay a toll to use the
HOT lanes                                                                          Figure 5: SR 167 HOT lanes average daily tolled trips
                                                                                   tripled in three years
The average number of daily (Tuesday through Thursday*)
                                                                                        Avg. Daily                             Year One      Year Two       Year Three
tolled trips continues to increase from month to month (see                             Tolled Trips                           (2008-2009)   (2009-2010)    (2010-2011)
                                                                                        3,500
Figure 5). During the northbound peak-hour (7-8 a.m.),                                  3,000
the average number of tolled trips increased from 140 in                                2,500
May 2008 to 270 in April 2009 to 350 in April 2010 to 433                               2,000
in April 2011, a three times increase over 36 months. The                               1,500
number of tolled trips in the southbound direction has seen                             1,000
a two and a half times increase during the afternoon peak-                                500
                                                                                                May June July Aug. Sept. Oct. Nov. Dec. Jan. Feb. Mar. April
hour (4-5 p.m.) since May 2008.
                                                                                   Source: NW Region Traffic, Tuesday – Thursday*

Figure 6: Performance measures help WSDOT learn more from the pilot project
                                                              May - Jul           Aug - Oct                       Nov - Jan                          Feb - Apr
                                    Year One                    $1.00                  $1.00                         $1.00                                 $0.75
Average Toll Paid                   Year Two                    $0.75                  $1.00                         $1.00                                 $1.00
                                   Year Three                   $1.00                  $1.00                         $0.75                                 $1.00
                                    Year One                    $9.00                  $8.50                        $6.50                                  $5.25
Highest toll paid                   Year Two                    $4.50                  $4.25                        $5.25                                  $5.50
                                   Year Three                   $5.25                  $5.25                        $5.00                                  $4.50
                                    Year One                     1,110                 1,260                        1,410                                  1,670
Average number of
                                    Year Two                    1,750                  1,830                        1,980                                  2,090
daily tolled trips
                                   Year Three                   2,540                  2,780                        2,670                                  3,070
                                    Year One                    1,390                  1,560                         1,910                                 1,880
Highest number of
                                    Year Two                    2,060                  2,150                        2,230                                  2,390
daily tolled trips
                                   Year Three                   3,160                  3,290                        3,340                                  3,480
                                    Year One                     150                    180                          200                                    260
Average peak-hour
                                    Year Two                     250                    290                           320                                   350
northbound tolled trips
                                   Year Three                    360                    370                          340                                    420
                                    Year One                      110                    120                          130                                    160
Average peak-hour
                                    Year Two                     160                     170                          190                                   200
southbound tolled trips
                                   Year Three                    210                     210                         200                                    250
                                    Year One                     210                    240                          260                                     310
Maximum peak-hour
                                    Year Two                     310                    350                          390                                    420
tolled trips
                                   Year Three                    430                    440                          430                                    530

Source: NW Region Traffic and Good To Go! Customer Service Center, Tuesday-Thursday*

* Monday and Friday excluded due to inconsistent traffic volumes.
                                                                          -5-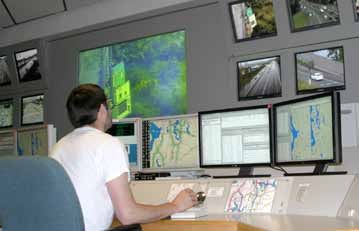
Washington State Department of Transportation

Volume
Daily volumes remain strong                                                                        HOT lane volumes have increased by
During the third year of operations, the average daily traffic                                     15 percent since 2007, making more room
volumes on SR 167 have continued to be similar to that of                                          in the general purpose lanes.
pre-opening volumes in 2007. As Figure 7 demonstrates,
the daily volumes in the first year of operations decreased
slightly, likely in response to the spike in gas prices and the
                                                                                               Speeds
faltering economy. The volumes then recovered during the                                       The HOT lanes exceed the legislative requirement of
second year in spite of the ongoing recession.                                                 maintaining average traffic speeds of 45 mph or more
                                                                                               during peak-hours at least 90 percent of the time. In fact,
Peak-hour volumes: HOT lanes carrying more traffic                                             the HOT lanes exceed this requirement over 99 percent of
than ever                                                                                      the time.
Overall, the average peak-hour, peak-direction traffic
volumes decreased by 1 percent in 2010 compared to 2007                                        Southbound peak-hour general purpose lanes improved
levels, which is consistent with volumes on roadways across                                    average speeds 10 percent between 2007 and 2011, rising
the region. However, the HOT lane’s popularity continues to                                    from 42 mph to 46 mph. Northbound average speeds
increase and the volume in those lanes has grown by                                            decreased one mph between 2007 and 2011. Speeds in both
15 percent. With HOT lanes carrying more and more traffic,                                     directions of the HOT lanes decreased slightly to just below
general purpose lane volumes decreased by 5 percent.                                           the posted speed limit of 60 mph. See Figure 8 for peak-
                                                                                               hour speeds.

    Figure 7: Average daily traffic volumes held steady                                            Figure 8: Average Peak-Hour HOT lanes
    in the third year                                                                              speeds stay high
                                                                                                                        Before Opening   Year One      Year Two       Year Three
                                                                                                   MPH                  (2007-2008)      (2008-2009)   (2009-2010)    (2010-2011)
     Traffic                 Before Opening
                             (2007-2008)
                                               Year One
                                               (2008-2009)
                                                             Year Two
                                                             (2009-2010)
                                                                           Year Three
                                                                           (2010-2011)
                                                                                                   70
     Volumes
     130,000                                                                                       60

     122,000                                                                                       50
                                                                                                   40
     114,000
                                                                                                   30
     106,000                                                                                       20
      98,000                                                                                       10

      90,000
                                                                                                    0
               May - July   August - October      Nov. - Jan.         Feb. - April                         NB HOT          SB HOT              NB GP                 SB GP

    Source: NW Region Traffic, Tuesday – Thursday*                                                 Source: NW Region Traffic, Tuesday – Thursday*

                                                                                               * Monday and Friday excluded due to inconsistent traffic volumes.
                                                                                         -6-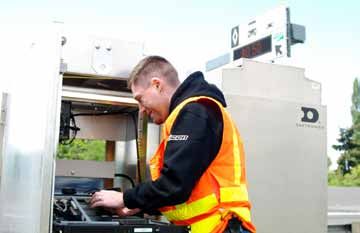
SR 167 HOT Lanes Pilot Project Third Annual Performance Summary

                                                                            The average travel time was 14 minutes for southbound
  HOT lane time savings                                                     drivers in the general purpose lanes during the peak
  The northbound HOT lane provided weekday (Tuesday through                 afternoon hour (4-5 p.m.). The 95th percentile travel time
  Thursday) drivers with an average time savings of nine                    was 22 minutes. This is a slight increase from the second
  minutes in the peak-hour (7-8 a.m.) for an average toll of $1.75.
                                                                            year, where the average travel time was 11 minutes, and the
  The southbound HOT lane provided weekday (Tuesday through
  Thursday) drivers with an average savings of six minutes                  95th percentile travel time was 15 minutes. In the first year,
  during the peak-hour (4-5 p.m.) for an average toll of $1.25.             the travel time averaged 12 minutes, and the 95th percentile
                                                                            travel time was 12 minutes.

HOT lane travel times
                                                                               What is the 95th percentile travel time?
Successfully delivering a more reliable trip
                                                                               The 95th percentile travel time is a statistical reliability
Throughout the first, second and third year, HOT lane                          measure that takes into account the variability of the travel
traffic flowed freely during all hours of the day. The                         time data. It means that 95 percent of the time, the travel time
                                                                               will be at or below the given number.
northbound peak-hour (7-8 a.m.) HOT lane travel time has
remained consistent at an average of 11 minutes since 2008
and the 95th percentile travel time was 12 minutes. The two
nearly equivalent travel time measurements indicate that the                Transit performance
HOT lanes are successfully delivering reliable travel times                 It is difficult to determine the specific effect of the
and maintaining traffic speeds, even on some of the most                    HOT lanes on transit ridership. The changing economic
congested days.                                                             climate, fluctuating gas prices, and changes made to the
                                                                            service and operation routes within the corridor also affect
The results are similar during the southbound peak-hour
                                                                            ridership. However, just like carpools and paying HOT lane
(4-5 p.m.). Both the HOT lane travel time and the
                                                                            customers, transit buses enjoy the benefits of a reliable trip
95th percentile travel time were eight minutes. Again,
                                                                            in HOT lanes. Figure 9 includes ridership on south line
the similar travel time measurements confirm that the
                                                                            Sounder commuter rail and bus routes that use SR 167.
HOT lanes successfully delivered reliable travel times and
maintained traffic speeds, despite the bottleneck caused by
the highway going from three lanes to two lanes at the end
                                                                               Figure 9: Average Weekday Transit Ridership
of the southbound HOT lane.
                                                                                 Avg. Weekday

General purpose lane travel times                                                Boardings
                                                                                 12,000

The average travel time was 20 minutes for northbound                            10,000

drivers in the general purpose lanes during the peak                              8,000

morning hour (7-8 a.m.). The 95th percentile travel time                          6,000

was 25 minutes. The average travel time has held fairly                           4,000

steady, for the last three years. In the first and second years,                  2,000
                                                                                      0
the average travel time was 19 minutes. The 95th percentile                                May Jun   Jul   Aug Sep Oct Nov Dec Jan Feb   Mar April
                                                                                           2010                                2011
travel times were 24 and 26 minutes in the second and first
                                                                               Source: Sound Transit
years respectively.

                                                                      -7-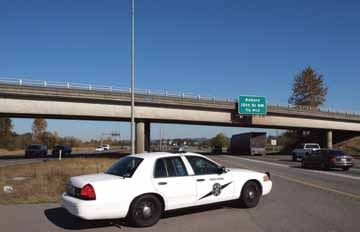
Washington State Department of Transportation

HOT Lane Drivers

Who is driving in the HOT lanes?                                                    Customer satisfaction
Since 2008, WSDOT has conducted an annual survey of                                 HOT lanes customers want HOT lanes in more locations
Good To Go! account holders with a valid email address                              Many customers state that their primary reason for
who had driven the SR 167 HOT lanes at least once.                                  choosing HOT lanes is to avoid congestion. Common
This helps WSDOT better understand the profile of our                               responses from a recent online survey of SR 167 HOT lane
paying HOT lanes customers. The 2011 overall results are                            customers include:
consistent with previous surveys. As shown in Figures 10                              • “HOT lanes give me more reliable travel times making
and 11, nearly 30 percent of HOT lane drivers are between                               me more efficient with my work time.”
the ages of 45 and 54 years old and 20 percent have a
                                                                                      • “Gas is used up quicker in traffic. Being able to move
household income of $75,000-$100,000.
                                                                                        effectively in a non-traffic lane saves time which in turns
                                                                                        saves me money – especially in today’s gas prices”
                                                                                      • “I have an extra choice and can plan my time and
    Figure 10: Age of HOT Lane Drivers
    Most HOT lane drivers are between 35 and 64 years old                               day better”

                               Age 16-18 Age 19-24                                    • “HOT lanes are great! They should be extended south
                                    0% 1.3%                                             into Pierce County ASAP on SR 167!”

                                    Age 65+ Age 25-34                               Drivers who use the HOT lanes strongly support them. The
                                    12.5%   10.4%
                                                                                    2011 SR 167 HOT Lanes Customer Survey revealed the
                                                                                    following highlights:
                                                Age 35-44
                          Age 55-64             20.3%
                          26.4%                                                       • A strong majority (over 70 percent) of all respondents
                                                                                        stated they would likely use the HOT lanes again
                                         Age 45-54
                                         29%                                          • A strong majority (62 percent) of all respondents who
                                                                                        use the HOT lanes at least once a month wanted to see
    Source: 2011 SR 167 Online User Survey (3,716 respondents)
                                                                                        HOT lanes opened on other freeways in our region
                                                                                      • Most people (approximately 88 percent) said that they
                                                                                        use the HOT lanes to avoid congestion in the general
                                                                                        purpose lanes or make a faster trip when they really
    Figure 11: Household Income of HOT Lane Drivers                                     need it
       (Washington State Median             Under $20,000
       Household Income: $56,479)           1.8%
                                                       $20,000 - $34,999
              $150,000 or more                         5.7%
              15.5%                                         $35,000–$49,999
                                                            9.2%

              $125,000–$149,999
              9.5%                                   $50,000–$74,999
                                                     18.4%

                $100,000–$124,999
                19.8%
                                          $75,000–$99,999
                                          20.1%

    Source: 2011 SR 167 Online User Survey (3,383 respondents)

                                                                              -8-
SR 167 HOT Lanes Pilot Project Third Annual Performance Summary
Where are they from? separate HOT lanes from
general purpose lanes. Similarly,
The majority of tolled HOT lane trips are billed to homes in
the 2010 Transportation Budget
the southern, southeastern and eastern portions of the SR
directed WSDOT to further
167 corridor, corresponding to the purple, blue and green
examine access issues. To fulfill
sections of Figure 12.
this requirement, WSDOT
Figure 12: Tolled Trips by Zip Code commissioned the University of
¬
«
522 Kirkland Redmond Washington to conduct a HOT
¬
«
203 lane study focusing on access
Bellevue
areas and double white line
Seattle
¬
«
3 ¬
«
519 Mercer Island
¬
«
202
Bremerton
Port Orchard §
¦
¨405
crossing violations. The study
found that this illegal activity
Newcastle
§
¦
¨
90
¬
«
160
¬
« was more prevalent during rush hour and in locations where
599
Renton ¬
«900
Burien Tukwila
SeaTac
congestion is more frequent. As a result, WSDOT worked
¬
«
515
¬
«
181 with WSP to shift its HOT lane patrols to the hours when
¬
«
302
Kent ¬
«
18
congestion is at its highest.
¬
«
16
¬
« 516 Covington
Gig Harbor ¬
«99
Ruston
Federal Way
Auburn UW Access Study
¬
«
509
§
¬
«
¦ ¬
¨ «
5
167
163
Tacoma In May 2011, the University of Washington published
§
¦
¨
705 Fife
¬
«
University Place 164
“Examination of SR 167 HOT Lane Violation Patterns,”
Enumclaw
Lakewood
Puyallup
Bonney Lake by Jonathon Corey and Mark Hallenbeck. It examines
Buckley
¬
«
512
where and why drivers are illegally crossing the double-
Orting white lines. The report concluded that violations occur at
¬
«
7
¬
«
162
a negligible rate in moderate to light traffic. However, as
¬
«
161 ¬
«
165
traffic congestion rises the violation rate increases from
¬
« 507
nearly zero to approximately eight violations per hour.
This increase is attributed to multiple factors including;
0
¯
1.5 3 6 9
Miles
12
Trips per Zip
1 - 3,751
3,752 - 11,323
Tolled Trips on SR 167
May 2008 - April 2011
approaching backups, on-ramps, getting in the HOT lane
before the double-white lines end, and leaving the HOT lane
11,324 - 22,937
22,938 - 68,564
before the next access point. It also identified the section of
68,565 - 172,571 northbound SR 167 between the S 180th St. on-ramp and
Zipmap2.mxd Printed: 08/17/2011
I-405 interchange, as the highest violation area, comprised
Source: Customer Service Center Database, May 2011 almost exclusively of vehicles entering the lane. The study
noticed that drivers were using their signals while making
HOT Lane access these violations, suggesting that they were more focused on
Restricted access has been the most common issue raised safety than legality.
by the public since the HOT lanes opened in May 2008.
WSDOT has tried to address this by lengthening the There were very few observed instances of toll jumping,
entrance and exit area, and adding signs advising drivers where a driver temporarily leaves the HOT lane to avoid
when to leave the HOT lanes to reach a particular exit. being detected by the overhead antenna. This suggests
that drivers are willing to pay the toll as long as there is an
Survey respondents were given an opportunity to voice any obvious benefit gained by using the HOT lanes. WSDOT is
of their concerns with a write-in comment section. One considering these results, as well as the responses from the
recurring theme was to focus enforcement on preventing online survey, as it looks for ways to improve the HOT lanes.
drivers from illegally crossing the double whites that
-9-Washington State Department of Transportation
Enforcement
HERO Program
A concerned driver can call in a potential violator through
the HERO program if they see a solo driver using the
SR 167 HOT lanes without a Good To Go! pass. WSDOT
then mails the registered owner of the vehicle educational
materials about how to use the HOT lanes. The number of
potential violations reported to the HERO program has
remained steady since the HOT lanes opened.
Year 1 Year 2 Year 3
2008-2009 2009-2010 2010-2011
Average calls
50 40 60
per month
The Washington State Patrol provides additional enforcement on SR 167.
HOT lanes compliance is estimated to be 95 – 97 percent.
The HERO program was included as an element of the
Washington State Patrol HOT lanes project to provide drivers an opportunity to
report vehicles that they saw improperly use the lanes.
The Washington State Patrol provides additional
enforcement to ensure drivers are complying with the rules
of SR 167 HOT lanes. Specific WSP shifts are dedicated to
HOT lane enforcement, and emphasis patrols are paid for
with HOT lane operations funding. Since opening day, WSP
has maintained a visible presence in the project area.
HOT lane violations
In coordination with WSDOT, WSP has reduced the
number of shifts assigned to HOT lane enforcement on
SR 167, while more efficiently focusing on peak-hours when
violation rates increase. This reduction in enforcement was
done to lower operating costs.
Year 1 Year 2 Year 3
2008-2009 2009-2010 2010-2011
Traffic Stops 2,740 2,010 2,030
HOV/HOT violation
730 660 650
citations
Crossing double
320 290 240
white line citations
- 10 -SR 167 HOT Lanes Pilot Project Third Annual Performance Summary
Safety and Response
Safety Incident response
HOT lanes remain a safe option An important component of HOT lanes operations is the
The third year of HOT lanes operation data indicates that addition of incident response team (IRT) vehicles along
the average number of collisions is down 4 percent when SR 167 to assist drivers (e.g. change flat tires, supply
compared to the five-year average prior to HOT lanes emergency gas, etc.) and clear blocking vehicles.
opening in 2008. The collision data timeframe begins in May
February to April
and ends in December because HOT lanes began in May
2008, and December 2010 is the most recent collision data 2008 2009 2010 2011
available (see Figure 13).
Monthly incidents
130 195 180 180
responded to
Multiple factors can affect the safety record, including the
double white lines preventing erratic lane changes in and Average response
10.3 9.3 9.9 8.9
time (in minutes)
out of the HOT lanes, changing traffic volumes, increasing
WSP enforcement, roadway surface conditions, changes By funding more IRT vehicles along the corridor, the
in visibility and a new law requiring the use of hands-free HOT lanes project enabled IRT to respond to incidents
cellular devices. WSDOT remains confident that HOT lanes more quickly. This reduced the congestion and delay caused
are not adversely impacting driver safety and engineers will by incidents and helps keep all lanes moving.
continue to closely monitor safety data.
Figure 13: Collisions on SR 167
HOT lanes are not adversely impacting safety
Collisions
400
350
300
250
200
May 03 May 04 May 05 May 06 May 07 May 08 May 09 May 10
~ ~ ~ ~ ~ ~ ~ ~
Dec 03 Dec 04 Dec 05 Dec 06 Dec 07 Dec 08 Dec 09 Dec 10
Data Source: NW Region Traffic The incident response team provides additional assistance on SR 167.
- 11 -Washington State Department of Transportation
Operations and Maintenance
Traffic Management Center
At WSDOT’s Northwest Region Traffic Management
Center in Shoreline, team members pay close attention
to SR 167 traffic using remote control cameras and data
collected from traffic sensors. They monitor the variable toll
rate and HOT lane traffic data using software that creates a
dashboard displaying all the HOT lane variables, including
traffic volumes, lane speed and toll rates. Operators monitor
the HOT lane around the clock to ensure that the displayed
toll rates accurately reflect the traffic conditions along
SR 167. In the event of an accident, construction or
excessive traffic in the HOT lanes, operators can manually
Inside the traffic management center, WSDOT engineers monitor the HOT
override the HOT lanes rate sign to display messages such lanes, variable toll rates and traffic data to ensure smooth operations.
as “CLOSED,” “HOV ONLY” or “OPEN TO ALL.” Also,
if anything goes awry, the designated engineer works with
the tolling vendor, WSDOT maintenance and Toll Division
personnel to troubleshoot the problem and find a solution.
Maintenance
WSDOT partners with a toll vendor to assist WSDOT in
monitoring, maintaining and ensuring optimal performance
of the HOT lanes system. The partnership has enabled
WSDOT to ensure delivery of a reliable system while at
the same time building the internal knowledge of WSDOT
engineers and technicians. Aided by software, both
partners watch the system for errors and alert messages.
When errors are detected, the toll vendor and WSDOT
engineers collaborate to diagnose and usually solve the
problem remotely. If the issue cannot be addressed remotely,
WSDOT field technicians are dispatched to replace the
failed equipment.
WSDOT HOT lanes technician Allen Mushatt checks the electronic equip-
While minor errors or alerts occur weekly, the fully ment cabinet.
redundant system does not falter. If the data collected at
the tolling location fails to upload to the central system, it is
collected and stored at each location. When the connection
to the central system is restored the data is then uploaded
and processed.
- 12 -SR 167 HOT Lanes Pilot Project Third Annual Performance Summary
Public Outreach and Communications
Listening: business customer feedback Education: increasing awareness
In order to gain a better understanding of how businesses WSDOT conducted a public education campaign from May
along the SR 167 corridor are using the HOT lanes, to September 2010 to help drivers understand how to use
WSDOT conducted an online survey. Its highlights include: the HOT lanes, increase usage and raise awareness about the
• Nearly 60 percent considered the HOT lanes helpful for HOT lanes’ purpose and benefits.
their business After the SR 167 HOT Lanes Pilot Project Annual
• Time savings was the most common response why the Performance Summary was published, the project website
HOT lanes were helpful received more than three times the average number of daily
• Over 50 percent were interested in connecting the visits. This demonstrates that there is a high interest in the
SR 167 HOT lanes to the future I-405 express toll lanes progress of the HOT lanes pilot project and that targeted
media outreach resulted in reaching people along the
WSDOT continues to take feedback from drivers and make SR 167 corridor. As Good To Go! outreach has ramped up
adjustments to the HOT lanes program. in preparation for SR 520 tolling this December, pass sales
Examples include: have increased along with SR 167 HOT lanes usage.
• Providing more options for passes that benefit HOT Methods of outreach included:
lane drivers, such as switchable or movable passes • Boeing Safety Fair (major employer along the SR 167
• Reducing customer costs by providing less corridor - approximately 300 people contacted)
expensive passes • Puyallup Fair (significant event with 1.1-1.2 million
• Installing new readers to accommodate both old and people in attendance)
new passes • Gas pump toppers placed at 20 gas stations along the
SR 167 corridor provided information on how to use
Get there faster...
HOT lanes
SR 167 HOT lanes • Direct media contact that resulted in print and TV
The girls are waiting.
coverage, including a drive-along with KOMO TV
It’s easy. It’s convenient. It’ll save you time.
◊
◊
◊
Set up a prepaid Good To Go! account
Enter and exit the HOT lanes at dashed lane striping
When you enter the HOT lane, the toll displayed is deducted from your Good To Go! account
• Better incorporation of HOT lanes into our overall
Good To Go! campaign to educate drivers on all toll
◊ Vehicles with two or more people use the HOT lanes toll-free; no transponder necessary
1-866-936-8246
!
To Go facilities and providing information on which passes
Good
www.wsdot.wa.gov/GoodToGo
Or, visit us at the Puyallup Fair,
Sept. 18, 19, 20
work best for HOT lanes customers
9
Example of gas pump topper
- 13 -Washington State Department of Transportation
Citizen correspondence New technology
In the third year of the HOT lanes operations, feedback As a result of listening to customer feedback and advances
from the public was minimal. Most inquiries came from in tolling technology, SR 167 HOT lanes became the first
drivers who were interested in tolling on the SR 520 bridge existing toll facility in the United States to convert to a new
and unfamiliar with the statewide tolling process. However, tolling communication protocol: ISO 18000 6C. The new
drivers continue to have questions about access in and out protocol is faster, non-proprietary, more accurate, more
of the HOT lanes, including extending the entrance and exit secure, less costly and offers more pass options
points. An average of four inquires are received a month. for customers.
Customer Service Center One of the greatest challenges
WSDOT is currently working towards implementing tolling was ensuring that the existing Good To Go!
on the SR 520 bridge in December 2011. A critical part legacy passes would continue to
of this program is to increase awareness of the statewide operate seamlessly. Relentless
electronic tolling system, Good To Go!. The statewide system testing and consistent
operates all tolling accounts for tolled facilities statewide: verification have proven
the system to be exceeding
• Tacoma Narrows Bridge operational performance Legacy sticker pass
• SR 167 HOT lanes requirements.
• SR 520 bridge Washington was the first state in the country to read both
By unifying the entire system, WSDOT is able to save ISO 18000 6C and another tolling communication protocol
money because the cost of the statewide toll customer on the same facility.
service center is split between facilities. With SR 520 bridge WSDOT is now leading an international effort to
tolling beginning in 2011, two new customer service centers standardize the information contained on the pass. By
were opened in Seattle and Bellevue, bringing the total of
standardizing the information in the future, Good To Go!
available centers to three.
customers, will be able to use their passes at other toll
locations across North America. In the future, other states
and agencies passes will be accepted for use on WSDOT
toll facilities.
The improved WSDOT website facilitates the distribution of information.
From top: switchable pass, moveable pass, sticker pass.
Not shown: license plate and motorcycle passes
- 14 -SR 167 HOT Lanes Pilot Project Third Annual Performance Summary
Conclusion
The SR 167 HOT lanes are successfully accomplishing
what they were designed to do: making the highway
more efficient by maximizing vehicle throughput. The
HOT lanes effectively manage the flow of additional traffic
in the carpool lane when the space is available. This system
preserves free-flowing traffic conditions for carpools and
transit at virtually all times, and benefits traffic flow through
the entire corridor.
More people are using the SR 167 HOT lanes each year and
the drivers who use the HOT lanes strongly support them.
Commercial users value the HOT lanes and see a benefit to
their business.
HOT lanes are redefining tolling by demonstrating that
tolling is not only a means for funding infrastructure HOT lanes in use
but also a congestion management tool. The variable
toll ensures that traffic in the HOT lanes flow smoothly
– offering a quicker and more reliable trip than the general
purpose lanes. The HOT lanes are also now covering All-electronic tolling technology can now do
operating costs while successfully delivering reliable travel what additional lane space alone cannot — get
times and maintaining traffic speeds, even on some of the people safely to where they need to go when
most congested days. they cannot afford to be late.
- 15 -Washington State Department of Transportation
What’s next
The purpose of this four-year pilot project is to learn how HOT lanes and other forms of
variable tolling could be used in Washington to make our highways more efficient at moving
people and reducing congestion. In March 2011, the state legislature extend the authority
for the pilot project for an additional year, until June 30, 2013, as part of the Engrossed
Substitute House Bill 1175.
If WSDOT receives additional authority to continue using HOT lanes on SR 167, the
southbound HOT lane will be extended south to 8th St. E. If authority is not granted, an
HOV lane will be built instead and the existing HOT lane will be converted back to a HOV
lane after the current authority expires. The project to add a new lane is scheduled to be
advertised for construction in 2012 and completed in December 2014.
The HOT lanes pilot project on SR 167 is just one tolling application. In addition to
expanding the HOT lanes on SR 167, WSDOT is considering connecting the HOT lanes to
the Interstate 405 express toll lanes to create a 50 mile system from Lynnwood to Puyallup.
A visualization of the proposed future direct connection between the I-405 express toll lanes and the SR
167 HOT lanes.
- 16 -For more information
SR 167 HOT lanes Web site:
www.wsdot.wa.gov/Tolling/SR167HotLanes/
Tolling Web site:
www.wsdot.wa.gov/tolling/
Good To Go! Web site and to open an account:
www.wsdot.wa.gov/GoodToGo/
Contact information
Craig J. Stone , P.E.
WSDOT Toll Division Director
401 Second Avenue South, Suite 300
Seattle, WA 98104
206-464-1222
StoneC@wsdot.wa.gov
Title VI Statement to Public: WSDOT ensures full compliance with Title VI of the Civil Rights Act of 1964 by prohibiting discrimination against any
person on the basis of race, color, national origin or sex in the provision of benefits and services resulting from its federally assisted programs and activities.
For questions regarding WSDOT’s Title VI Program contact Jonté Sulton at 360-705-7082 or SultonJ@wsdot.wa.gov.
Americans with Disabilities Act (ADA) Information: Materials can be provided in alternative formats for people with disabilities by calling Shawn Murinko
at 360-705- 7097 or murinks@wsdot.wa.gov. Persons who are deaf or hard of hearing may contact Office of Equal Opportunity through the Washington
Relay Service at 7-1-1.
11-09-0919Washington State Department of Transportation
Toll Division
401 Second Avenue South, Suite 300
Seattle, WA 98104You can also read