D1.4 - Final TomTom pilot - QROWD - Because Big Data Integration is Humanly Possible
←
→
Page content transcription
If your browser does not render page correctly, please read the page content below
Ref. Ares(2019)7478227 - 04/12/2019

      QROWD - Because Big Data
    Integration is Humanly Possible
                                       Innovation action

          D1.4 – Final TomTom pilot

 Author/s                                                Jacek Skalski, Lukasz Kosma, Mattia
                                                         Zeni, Pauline Baudens
 Due date                                                30.11.2019
 Version                                                 1.0
 Dissemination level                                     PU
 Status                                                  Final

Project co-funded under Horizon 2020 Research and Innovation EU programme, grant agreement no. 732194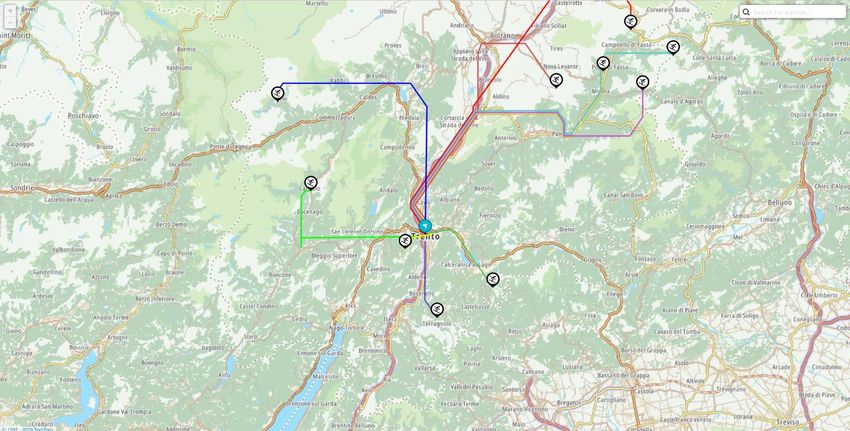
D1.4 Final TomTom pilot
Table of contents
EXECUTIVE SUMMARY ............................................................................................ 4
INTRODUCTION ........................................................................................................ 5
CHAPTER 2: THE RESULTS OF THE TOURISTIC NETWORK’S USE CASE ......... 6
  The concept: How does the Touristic Network work?.............................................. 6
       Possible Improvements ........................................................................................ 9
  The implementation of the web app ...................................................................... 12
       Design: ............................................................................................................... 12
       Implementation: .................................................................................................. 12
       POIs datasets merged by the SLIPO Workbench and integrated into the Touristic
       Network prototype .............................................................................................. 14
  Results: ................................................................................................................. 20
  The Touristic Network, a use case among many others........................................ 23
       The example of searching a Mexican restaurant in Toulouse, France ............... 23
       The example of searching an Indian restaurant in Berlin, Germany. .................. 25
  Evaluation by the UX team .................................................................................... 26
  Exploitation plan .................................................................................................... 28
       Replication to be ready for the market:............................................................... 28
       Cognitive load research and development: ........................................................ 28
       Crowdsourcing open more opportunities: ........................................................... 28
       Filing a patent on going: ..................................................................................... 28
  KPIs....................................................................................................................... 29
CHAPTER 3: EVALUATION OF THE UC2 "PARKING SERVICES" AND UC3
"TRAFFIC SERVICES" ............................................................................................ 34
  1. The UC2 “Parking services” including Off-Street and On-Street Parking .......... 34
       Contribution of QROWD in launching the TomTom On-Street Parking Service. 34
  2. The UC3 "Traffic services" ................................................................................ 36
       Contribution of QROWD in improving prototypes today commercialized: The
       MOVE Portal, a successful traffic management tool for cities ............................ 36
  3.      Licensing after project .................................................................................... 38
CONCLUSION ......................................................................................................... 39
REFERENCES ......................................................................................................... 40

    D1.4                                                                                                    Page 2 of 40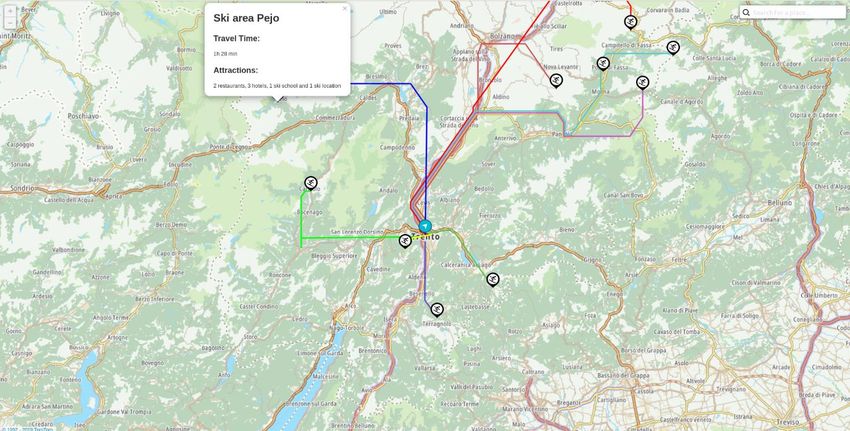
D1.4 Final TomTom pilot
LIST OF FIGURES

Figure 1: The concept of the Touristic Network described by mock-ups
Figure 2: The visualization of the background: with and without the map behind
Figure 3: Selection of the available services
Figure 4: Scoring ski resorts
Figure 5: The prototype of the Touristic Network
Figure 6: The information on available services and on the ski resort itself displayed
on the schematic map
Figure 7: The three POIs gathered in one using SLIPO Workbench
Figure 8: Architecture in the use case 1 (UC#1-BC1) “The Touristic Network”, QROWD
Figure 9: Data integration / SLIPO Workbench
Figure 10: The three POIs datasets represented in Qgis
Figure 11: The output dataset obtained by combining the three POIs datasets
Figure 12: An example of merging several features coming from OSM Trentino and
POIs Open data Trentino:
Figure 13: An example of merging several features coming from OSM POIs and
TomTom POIs
Figure 14: The Output dataset combining the three POIs datasets
Figure 15: The results of merging the three POIs datasets in numbers:
Figure 16: The use case of Mexican restaurants located in the surrounding area
Figure 17: The use case of Indian restaurants located in the surrounding area
Figure 18: The current situation where mainly famous ski resorts attract tourists
Figure 19: The concept of better spreading tourists amongst every ski resort due to
the Touristic app
Figure 20: Ratio of visitors who went through a traffic jam going to a ski resort

LIST OF TABLES

Table 1: Results from the merge using the SLIPO Workbench
Table 2: Estimation of the positive impacts thanks to the adoption of the Touristic
Network app.
Table 3: Ratio of visitors who went through a traffic jam going to a ski resort
Table 4: The four services supported by QROWD
Table 5: Licensing of TomTom products/services used in QROWD

   D1.4                                                                   Page 3 of 40
D1.4 Final TomTom pilot
EXECUTIVE SUMMARY

This deliverable is the conclusion of the three previous deliverables in WP1.

First, the deliverable reports on the results following the implementation of the first use
case named the Touristic Network, described in the D1.1 Datasets Release for Model
Region and more specifically in the D1.3 Road information service. The description of
the implementation of the second and third use cases were already described in D1.3
Road information service.

Secondly, the deliverable will report on the final evaluation of the Touristic Network
and about the positive impacts of QROWD in the research area and in the
commercialisation of new products and features in TomTom.

To sum up, the main outputs of this deliverable are:
   1. The results of the implementation of the Touristic Network
   2. The evaluation of the Touristic Network
   3. The Touristic Network after QROWD
   4. The contribution of QROWD into TomTom

The deliverable is public. The main target readers of the document are the research
partners in QROWD, and the potential customers among the cities. Cities might be
interested in the results of the implementation of the smart mobility services developed
in QROWD.

   D1.4                                                                     Page 4 of 40
D1.4 Final TomTom pilot
INTRODUCTION
In the WP1, the three use cases related to new smart mobility services and described
in the D1.1 “Datasets Release for Model Region” and D1.3 “Road information services”
were fully implemented.

As a first objective, this deliverable describes the implementation of the first use case
named the Touristic Network as it was not done yet in the D1.3. The description of the
second and third use cases’ implementation was already described in the D1.3 “Road
information services”.

As a second objective, the effectiveness of every service developed into QROWD will
be demonstrate within the evaluation in terms of reduced travel time and in term of
improving the global traffic situation of the pilot, Trento. The potential commercial
distribution of the three different services will be also presented.

The document follows the structure described below:

   1. In a first step, the final concept of the use case n°1 “the Touristic Network” will
      be described with the result from its implementation. The commercial
      distribution with potential possibility of replicating the developed service among
      other cities will be as well presented. The UX evaluation will follow as well as
      the KPIs evaluation.

   2. In a second step, the contribution of QROWD into the development and the
      productization of several traffic analysis services, as these services were used
      to study the traffic situation of Trento, will be described. Moreover, TomTom
      City was recently replaced by TomTom Traffic Index and includes even more
      relevant global traffic analysis. Therefore, this new portal will be presented as
      replacing TomTom City.

   D1.4                                                                   Page 5 of 40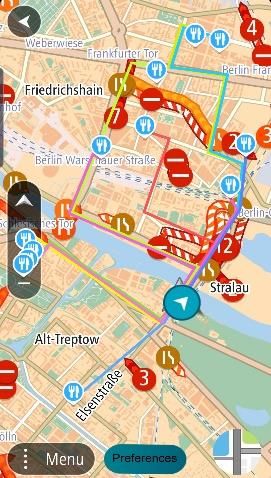
D1.4 Final TomTom pilot
CHAPTER 2: THE RESULTS OF THE TOURISTIC
  NETWORK’S USE CASE

The concept: How does the Touristic Network work?

The idea of the Touristic Network is to create a feature which could be integrated into
the TomTom GO Navigation app. Therefore, the concept was first designed through
the TomTom GO Navigation app using mock-ups. Therefore, it copies the interface.
Moreover, the concept uses the outputs coming from the Hackathon 2018 “What the
Hack? #4” as the system suggests the best options to the driver among many more
options. The concept of the Touristic Network is described below using the mock-ups
designed for demo purposes. It indeed helps in clarifying the concept idea in parallel
of the prototype.

          Figure 1: The concept of the Touristic Network described by mock-ups

The user opens its TomTom GO Navigation app and searches a destination. In the
example described by the mock-ups, the user is already located in Trento, but he could
also be located somewhere else as this does not impact the way the app works.

                                     1                                                      2

As a destination, the user writes “ski resorts” in the research function. The app
suggests several ski resorts located around, as this is usually the case in the normal
set-up of TomTom GO Navigation app. The app proposes also to the user an overview
of all the ski resort located around. In order to get this overview, the user needs to click
on the button named “All ski resorts”.

Once, the user clicks on this button, the app shows an overview of every ski resort
located around and indicates for each ski resort how much time does it takes to reach

   D1.4                                                                      Page 6 of 40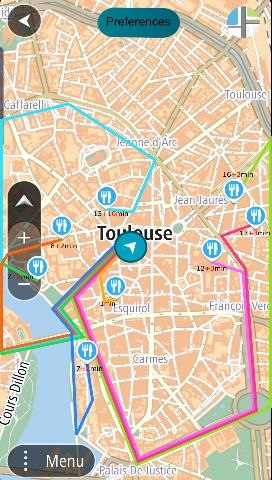
D1.4 Final TomTom pilot
the place, considering possible delays (traffic jams, road closures, accidents, etc.).
The overview is given using a schematise map view looking like metrolines.

The user can click in any of the ski resort, represented by the following logo: . When
the user clicks on it, he gets information about the specific selected ski resort. The
user can also choose to directly drive their, clicking on the drive logo.

                          3                              4                               5

   D1.4                                                                 Page 7 of 40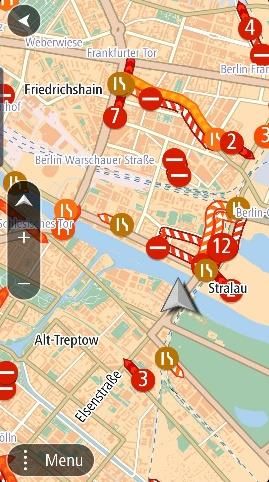
D1.4 Final TomTom pilot
Otherwise, the user can click on “Preferences”. The app asks to the user about its
preferences: Does the user need to rent materials, take ski lessons or even need to
place to stay or is willing to go to a restaurant at the ski resort?

According to what the user answers and the travel time, the app suggests the Top 3
best options. The user can choose to drive to one of these three options, by clicking
on the driving logo:      .

The user can also access the map with the overview of these three options, by clicking
on the map logo:      . From the overview too, the user can select one option and drive
there by clicking on the driving logo.

                              6                          7                                8

Once the driver clicks on the driving logo, the TomTom GO Navigation app guides him
through the destination.

                                                          9

   D1.4                                                                  Page 8 of 40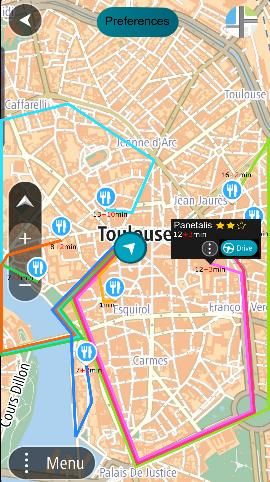
D1.4 Final TomTom pilot
Possible Improvements

   1) Choosing the background:

As a future improvement, it would be nice to offer to the user the possibility of
displaying the map behind the schematic network, adding buttons proposing this
option of changing display:

   -   Map view in the background:         .

   -   Schematic map only:         .

In the example below, the map still shows the road network which makes it a bit
confusing. It would be better to display the map without road network and to keep only
the topology of the place, in the background.

   Figure 2: The visualization of the background: with and without the map behind

   2) More detail preferences:

As an improvement, preferences proposed to the user in order to better fit his needs
in suggesting the Top 3 best options could be more detailed and related to the ski
resort activities in order to be even more relevant to users. For instance, the app could
propose users to request the availability of certain level of slopes. The Top 3 would
then suggest three ski resorts having such level of slopes. With such information, the
Top 3 best options would better consider the preferences of the user more related to
ski slopes themselves and propose better suggestions.

   D1.4                                                                   Page 9 of 40
D1.4 Final TomTom pilot
                          Figure 3: Selection of the available services

   1) More detail information about ski resorts themselves:

It would be an added-value to provide very detail information about the ski resorts
themselves (e.g. ski slope levels, level of snow, weather at the station, number of ski
slopes, etc.). Therefore, before to reach any station, users get all these details which
might help them also to choose which ski resort they want to go.

More sources of data could be explored like social medias in order to improve POIs
information.

   2) Inclusion of feedbacks from previous visitors of ski resorts:

The Top 3 best options suggested by the app could also be given considering previous
feedbacks about the ski resort. For instance, scoring stars could be used in order to
give clear indication on common advices about the place.

Crowdsourcing feedbacks about every ski resort would improve the quality of this
feature and it would make such application much more relevant for drivers searching
for trip suggestions.

  D1.4                                                                    Page 10 of 40
D1.4 Final TomTom pilot
Figure 4: Scoring ski resorts
3) Share your trip
It would be interesting as an extra feature for users to have the possibility of sharing
their trips with their friends and family.
This would provide very interesting information about the quality of offers of available
services around ski resorts.
D1.4 Page 11 of 40D1.4 Final TomTom pilot
The implementation of the web app
The implementation of the Touristic Network was done on the web app following the
expertise of the software engineers who worked on developing the concept. In the
future, this feature might be integrated into every TomTom navigation systems for all
type of devices, depending on decisions coming from the management boards and
product managers.
The design and the description of the final implementation as a web app can be found
below:
Design:
In the WebApp standard map layout is displayed. Chevron location (car position) is
set to the centre of Trento. The application always adds simplified routes in form of
"metro polylines*" towards 10 most popular ski resorts in the area. When user clicks
on a POI information about time of arrival and attractions at the location are displayed
in a popup box.
*We describe a metro polyline as a polyline consist of lines oriented in one of following
angles: 0, 30, 60 and 90 degrees)
Implementation:
The Web App consists of two parts: server part and client part:
1) Server part is implemented in C++. It stores the data about ski resorts around
the city of Trento and provides the line simplification service. The line
simplification service returns all points of simplified routes and all attractions
available at ski resorts in text format. For route simplification Visvalingam
algorithm was used to provide metro style polylines.
2) Client part implemented in JavaScript uses TomTom Maps API for map display
and other crucial functionalities like drawing polylines, POIs and text boxes.
Time of arrival for each of POIs is provided by TomTom Routing API.
As a result of the implementation, the below figure shows the display of the schematic
map of every route leading to every ski resort from Trento, as an origin point. The
display of the routes looks like metrolines with a similar off-setting. Indeed, the different
routes going in the same direction are displayed in parallel and not juxtaposed.
D1.4 Page 12 of 40D1.4 Final TomTom pilot
Figure 5: The prototype of the Touristic Network
The figure n°6 shows the display of the schematic map as well, with the information
given for each ski resort and on available services around.
Figure 6: The information on available services and on the ski resort itself displayed
on the schematic map
D1.4 Page 13 of 40D1.4 Final TomTom pilot
POIs datasets merged by the SLIPO Workbench and integrated into the Touristic
Network prototype
The implementation of this use case is described in D5.2 “Pilot Report” (restricted
deliverable / see the reference section, page 40) and D5.3 “Final Evaluation Report”
(public deliverable not submitted yet / see the reference section, page 40) of the project
SLIPO.
The SLIPO Workbench was used to gather POI information from a variety of sources
in every ski resort in Trentino to guarantee high-accuracy and the high-quantity of
available services.
From first as it was described in the D1.3, the three datasets:
- TomTom POIs available for the region of Trentino
- Ski Ropeway (open source)
- Ski Slopes (open source)
were interlinked and fused using the SLIPO Workbench. Unfortunately, the results
were not good enough as there were not enough connections found in between the
different attributes of the different datasets.
Therefore, other datasets were collected with the aims of being merged in a unique
dataset.
➔ The three datasets are:
o TomTom POIs for the region of Trentino
o OSM POIs for the region of Trentino
o POIs Open data in Trentino
These three datasets had different formats: CSV, SHP and JSON. However, in these
datasets the POIs are exclusively represented by points. The number of features for
each of these POI datasets, for the whole region of Trentino, differs: The TomTom
POIs, in the version used for the integration, includes 40 124 POIs. The OSM POIs
counts 38 550 features and the POIs Open data Trentino gathers 2 857 features.
D1.4 Page 14 of 40D1.4 Final TomTom pilot
Figure 7: The three POIs gathered in one using SLIPO Workbench
TomTom
POIs
SLIPO: A unique
Transformation, enriched dataset
OSM POIs Interlinking, POIs Trentino
Fusion
POIs Open
data
Trentino
Figure 8: Architecture in the use case 1 (UC#1-BC1) “The Touristic Network”,
QROWD
D1.4 Page 15 of 40D1.4 Final TomTom pilot
Figure 9: Data integration / SLIPO Workbench
In the process proposed by the SLIPO workbench, the three datasets: TomTom POIs;
OSM POIs; POIs Open data Trentino; were transformed into RDF (Resource
Description Framework). Then, the TomTom POIs and the OSM POIs were first
interlinked by spatial dimensions of the entities, names, and addresses, and then
fused. The output dataset containing the TomTom POIs and the OSM POIs was
interlinked and then fused with the POIs Open data Trentino. The output is a dataset
containing the three POIs coming from the various sources.
D1.4 Page 16 of 40D1.4 Final TomTom pilot
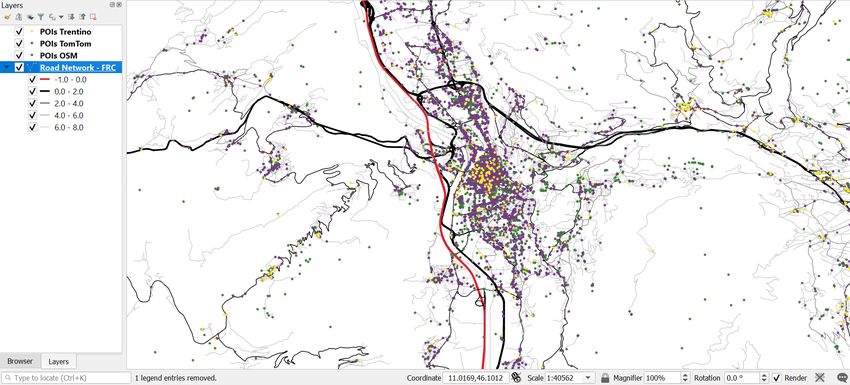
Figure 10: The three POIs datasets represented in Qgis
TomTom POIs are represented in purple, OSM POIs in green and POIs Open data
Trentino in yellow.
Consequently, this dataset is much more enriched in quantity of features but also in
quality, which is an added value. Indeed, a certain number of features coming from
the three datasets were combined.
D1.4 Page 17 of 40D1.4 Final TomTom pilot
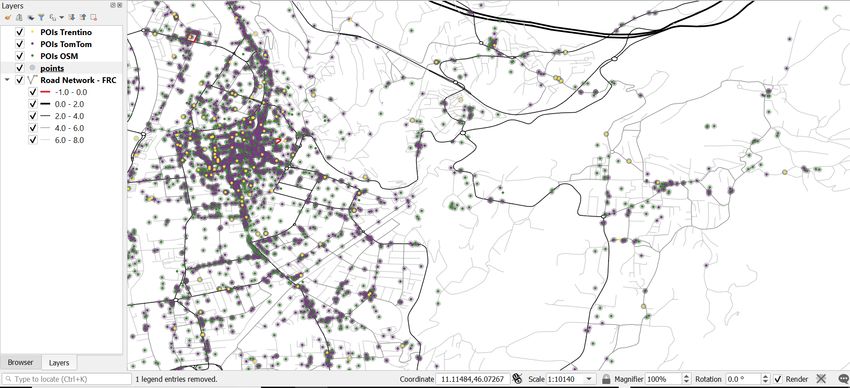
The map below shows the results:
Figure 11: The output dataset obtained by combining the three POIs datasets
TomTom POIs are represented in purple, OSM POIs in green and POIs Open data
Trentino in yellow. The output dataset, after the completion of the integration work in
the SLIPO Workbench, is represented in grey circles.
D1.4 Page 18 of 40D1.4 Final TomTom pilot
In several cases, it is possible to observe some duplications and merging datasets
(see the two examples below):
Example 1:
Figure 12: An example of merging several features coming from OSM Trentino and
POIs Open data Trentino:
TomTom POIs are represented in purple, OSM POIs in green and POIs Open data
Trentino in yellow. The output dataset, after the completion of the integration work in
the SLIPO Workbench, is represented in grey circles.
An example of
merged datasets
In this example, can be observed that the second green point (OSM Trentino) is not
part of the output dataset because its information was merged with the yellow point
(POIs Open data Trentino) located a bit higher in the map. The two features coming
from OSM POIs and POIs Open data Trentino were merged into one dataset as both
datasets were containing the same information. In fact, both datasets contained the
same feature which was the University area.
D1.4 Page 19 of 40D1.4 Final TomTom pilot
Example 2:
Figure 13: An example of merging several features coming from OSM POIs and
TomTom POIs
TomTom POIs are represented in purple, OSM POIs in green and POIs Open data
Trentino in yellow. The output dataset, after the completion of the integration work in
the SLIPO Workbench, is represented in grey circles.
In the picture, it can be observed that one green point (OSM POIs) is not surrounded
by the grey circle (output dataset). The reason is that this green point was merged with
the purple point (TomTom POIs). This purple point is surrounded of red because it
was selected during the screenshot, but it is usually surrounded of grey as it is a
feature part of the output dataset. Checking the different detail information of the
different points, this grey point for now on gathers the TomTom POIs and the OSM
POIs. This duplicated POI now unique is a restaurant called “La Terraza”.
Results:
The three POIs datasets were gathered in order to obtain a more complete POI dataset
with consequently added value. This obtained dataset is more complete and well-
describe. In some cases, the same information was contained in the various datasets
but thanks to the SLIPO workbench and the interlinking tool, the duplications were
detected and removed.
D1.4 Page 20 of 40D1.4 Final TomTom pilot
Figure 14: The Output dataset combining the three POIs datasets
The output dataset is represented here in blue.
Figure 15: The results of merging the three POIs datasets in numbers:
D1.4 Page 21 of 40D1.4 Final TomTom pilot
Table 1: Results from the merge using the SLIPO Workbench
Merged datasets: Number of features in each dataset:
TomTom POIs 40 124 features
OSM POIs 38 550 features
POIs Open data Trentino 2 857 features
Results: Total number of features:
Output dataset 53 507 features
The output dataset contains 53 507 features while the total of features of the three
POIs datasets is 81 531 features. This means that 28 024 features were removed as
they were duplicates.
This output dataset was integrated into the Touristic Network prototype. The app
users, regardless of where they are coming from, request the information on how much
time it takes to reach every ski resort in Trentino. Then, the app provides them with
information on travel time to reach every ski resort but also on the different available
services around the areas. Knowingly, the users can choose the best option for them
according to their preferences and drive to the most suitable ski resort, avoiding traffic
jam and enjoying the nicest services there. This guarantees to travellers the best
experience in Trentino.
D1.4 Page 22 of 40D1.4 Final TomTom pilot
The Touristic Network, a use case among many others
The Touristic Network is the use case used to develop the concept. However, the
concept of suggesting every option available considering the distance and of
visualizing the information in a simplify way like metroline maps can be implemented
in many more use cases in other contexts.
Below can be found the description of two other type of use cases:
1) The example of searching a Mexican restaurant in Toulouse, France.
2) The example of searching an Indian restaurant in Berlin, Germany.
Much more use cases can be developed. For instance:
• How much time does it take to reach every post office? This would help the
user to choose and reach the closest post office. The user saves time.
• How much time does it take to reach every Electrical charging point to recharge
an electrical vehicle? The app would give to the user the best option. The user
saves time and is not stress by such constraint.
• Much more use cases can be thought using this concept.
The example of searching a Mexican restaurant in Toulouse, France
A driver would like with the family to eat in a Mexican restaurant in Toulouse.
Therefore, the driver checks the different Mexican restaurants in the TomTom GO
Navigation app by typing “Mexican restaurant” inside the search feature. The app
suggests options. The driver clicks on “All options” and gets the overview of all the
Mexican restaurants located around with the travel time needed in order to reach every
of them by car. If the driver clicks on one of the restaurant logo, the app displays
several information about the specific restaurant:
1) Name
2) Travel time with possible delay
3) Review given by scoring stars
The driver decides to go to one of the Mexican restaurants which is located around,
and which has a very good review scoring.
D1.4 Page 23 of 40D1.4 Final TomTom pilot Figure 16: The use case of Mexican restaurants located in the surrounding area The difficulty in this use case is that the city centre of Toulouse is walkable and there are many prohibited directions which complexify the drive. Therefore, most of the people prefer to move on foot inside the city-centre. Therefore, this use case is very interesting but does not show a proper reality. D1.4 Page 24 of 40
D1.4 Final TomTom pilot
The example of searching an Indian restaurant in Berlin, Germany.

A driver and his friends would like to go to an Indian restaurant. In order to find a good
restaurant and to drive there, the driver opens TomTom GO Navigation app and types
“Indian restaurants” into the searching” functionality. The app displays to the driver an
overview showing the location of every Indian restaurant located close by and
indicating the travel time considering delays.
If the driver clicks on one of the restaurant icons, the app displays several information
about the selected restaurant:
     1) Name
     2) Travel time with possible delay
     3) Review given by scoring stars
The driver decides to go to one of the Indian restaurants which is close by and has a
very good scoring review.

    Figure 17: The use case of Indian restaurants located in the surrounding area

  D1.4                                                                    Page 25 of 40
D1.4 Final TomTom pilot
Evaluation by the UX team
The TomTom UX team has dedicated some time and effort to evaluate the concept of
the Touristic Network. With expert eyes, the team discussed some rooms of
improvement of the concept in order to make possible the adoption of such app to
potential users in the case this app would be productised in the future.
The evaluation was done by two UX designers. Both found the concept very
interesting, well developed and having potential. However, their evaluation brought
many questions from the user perspective which haven’t been thought in detail before.
Some questions were already answered but some others still need research and
investigation.
• How much user value does the app provide?
• How often people are looking at leisure activities?
• Who is the target user?
• Is this a good feature (schematic maps, suggesting the best
destination/alternatives among many similar possibilities) to implement into
the TomTom Navigation applications?
• What is proposed, is this the easiest way of presenting it?
• What are the hypothesis?
Further clarifying the value of the Touristic Network as a feature of the TomTom
Navigation applications should be the main focus for the coming month in order to
make its integration into the TomTom Navigation applications potentially possible. This
is a key step.
One of the topics raised during the UX evaluation is the driver distraction. The feature
should not, in any way, disturb the driver. The Touristic Network is a feature conceived
to be used as trip planner. Indeed, the usual guiding interface takes over during the
drive. However, the problematic of driver distraction should still be carefully thought.
One of the critics which came back several times during the evaluation of the two UX
designers is that the Touristic Network feature does not seem to connect enough with
the TomTom Navigation application, especially in a design point of view. The mock-
ups try to follow the design and the user interface interaction of the TomTom GO
Navigation app, but some inconsistencies appear. The way how the app was designed
lacks “TomTom style”. As this is for now only a prototype, it is not a problem but, in the
case this Touristic Network feature would get implemented in the final product of
TomTom navigation devises, the design and also the “TomTom logic” will need to
strictly respect the TomTom design requirements to ensure consistency.
As an example of inconsistency, on the mock-up n°3 (described page 8) there is a
bottom named “All ski resort”. It can indeed be pretty surprising for the app user to
click on it and get the schematic map as a next visualization. The user does not expect
a map, especially because in the TomTom app in order to get a map view the user
usually needs to click ahead on the map icon. Thus, in this case the user expects more
filtering options or a list of suggestions. Therefore, the user is surprised about the
D1.4 Page 26 of 40D1.4 Final TomTom pilot
schematic map view and it might seem to the user that he switched to another app. It
would be more consistent to integrate the filtering and preferences features, mock-up
n°2 (described page 7), directly into the search feature and to propose to switch to the
map view thanks to a map view button.
Moreover, when the user looks at the schematic map view, few difficulties of
understanding the information provided by the map appear. In fact, the user can see:
“10 ski resorts represented by a specific label and for each of the way leading to a ski
resort there are numbers”. These numbers might appear unclear. They would certainly
understand that the black number is the travel time, but the red number might appear
unclear while it shows the delay. Some additional works need to be done in order to
share better the information, so the user understands the information in a few seconds.
The information given need to be properly documented or extremely clear and
consistent.
The icons used should also be tested ahead in order to be aware which icons users
understand better.
The both UX designers agreed that the schematic map with the topology map visible
in the background was a better representation and easier for the user to understand
as it seems more “familiar”. Of course, the topology map should not include the routes
as it disturbs the user and create a conflict between the routes and the schematic map.
Moreover, not all user finds easy to read maps, even simplify maps, and this should
be well considered.
In addition, some suggestions were given by the two UX designers:
• In the TomTom Navigation application, a route comparison feature, showing
three potential routes, is already existing. Therefore, the Touristic Network
concept could be implemented within this already existing feature. It would add
value to it.
• More researches could be done on finding more use cases which would bring
more possibilities of commercializing this feature to more diverse customers.
For example, the Touristic Network concept is for now on based on mainly
proposing alternative ski resorts around considering travel time and fitting the
user’s preferences concerning available services. However, other information
could be presented like the fuel consumptions.
• Part of TomTom, the TomTom Roadtrips website could be interested in
implementing a similar feature than the Touristic Network. This website
suggests to road user’s enjoyable road trips through scenic routes in different
areas. Using schematic maps to display the routes could be a concept the
Roadtrips team in TomTom could implement, as well as suggesting Top 3 best
options considering additional criteria like available services along the way,
petrol stations, etc.
Link: https://www.tomtom.com/en_us/roadtrips/
D1.4 Page 27 of 40D1.4 Final TomTom pilot Exploitation plan Replication to be ready for the market: TomTom is a global company which obviously conceives products not for a single region or city but at a global scale. Therefore, the Touristic Network is a use case describing a context which can be replicated in different scenarios and in different regions. Of course, this Touristic Network example of ski resorts can be replicated to cities facing similar touristic issues related to winter season as Trento. In addition, other use cases less locally focused can be thought (see in the two examples of use cases presented in the previous paragraphs: 1) The example of searching a Mexican restaurant in Toulouse, France. And, 2) The example of searching an Indian restaurant in Berlin, Germany). In fact, suggesting options using a schematic map can be replicated in many contexts. Before to commercialise the Touristic Network some more use cases need to be researched and developed. Once the product managers understand the added-value of such a feature within the TomTom Navigation applications because of the possibility of a global scale commercialization, the Touristic Network would be integrated within the existing navigation products and be ready for the market. Cognitive load research and development: The Touristic Network was the chosen use case to study the different way of simplifying lines. In the future, TomTom might pursue this research on how should look like schematic maps in order to share the best information to users. Cognitive load studies and user satisfaction are the next steps. Those topics require time and effort in research and development. They might be subject to other research and innovation projects in the close future. Crowdsourcing open more opportunities: Crowdsourcing is a growing topic in TomTom. Doing more crowdsourcing will enable collecting more datasets that can be used to improve and developed new services. In addition, crowdsourcing can be used to collect feedbacks from users in order to improve the services and in order to understand better their needs. Moreover, crowdsourcing could also be used in order to learn more from users and be able to suggest destinations/itineraries which fit better their preferences based on previous trips. There is here a whole area to research and explore. The concept has inspired TomTom, as TomTom aims to collect more datasets coming from drivers using a new app. This is currently being developed, therefore the description of this new app cannot yet be made public. Filing a patent on going: The team at the origin of the implementation of the Touristic Network is currently working closely with the legal team of TomTom to file the patent about the concept of D1.4 Page 28 of 40
D1.4 Final TomTom pilot
the schematise map. Discussions are currently on going and should lead to the
creation of a patent in the coming months.

KPIs

The Touristic Network was unfortunately not evaluated by users during the project time
because of several reasons:

-   First of all, the Touristic Network is a feature which needs to be integrated into the
    TomTom Go Navigation applications in order to able to be tested in a real situation.
    The users, testing the service, need to be in the real situation of searching for a ski
    resort around Trento during the high peak winter season and then use the feature
    within any TomTom navigation device. Integrating the feature into TomTom Go
    Navigation applications as well as testing the app with users in a real situation is
    very time challenging and could not fit into the running time of the project.
-   Moreover, integrating the Touristic Network as a feature into the TomTom Go
    Navigation applications means that the feature needs to be almost ready to be
    commercialized with a very well-researched catchy design which respects
    cognitive load requirements. This also challenges the running time of the project.
    The software engineers working on the Touristic Network prototype in TomTom
    had enough time to achieve the prototype but there was not enough time left to
    integrate the feature into the TomTom Go Navigation app with a fully respected
    branding design and test the feature. Indeed, the study on route off-setting and
    schematising map took a lot of time, as it was the main focus in the TomTom
    roadmap for QROWD.

Therefore, as an evaluation two TomTom UX designers shared their expertise and
gave some suggestions concerning the Touristic Network feature. This evaluation can
be found in the previous sub-chapter named: “Evaluation by the UX team”, (pages 26,
27).

In addition, an estimation of impacts considering the potential number of users was
calculated. The hypothesis is that the application will help tourists discovering less
famous ski resorts. Tourists will be better spread among all the ski resorts available
and overall this will help reduce congestions on the road network of the Trentino
region.

Below, can be found two illustrations of the hypothesis. The first figure represents the
current situation where tourists go mainly in the few most famous ski resorts which are
busy and where the roads leading to these ski resorts are often congested. And the
second figure represents the situation where a certain percentage of the tourists use
the Touristic Network app and reach other ski resorts less famous and less congested.
The traffic on major roads leading to ski resorts would be expectedly less congested
because the tourists would be better spread through all the ski resorts in Trentino.

    D1.4                                                                   Page 29 of 40
D1.4 Final TomTom pilot
Figure 18: The current situation where Figure 19: The concept of better
mainly famous ski resorts attract spreading tourists amongst every ski
tourists resort due to the Touristic app
Below, calculations are done assuming this better spread of tourists amongst all the
ski resorts in Trentino due to the usage of the Touristic Network app would be running
and commercialized with a certain number of users. Considering that in 2016 the
region of Trentino-South Tyrol gathered around 863 000 visitors (source: Statista
Research Department) which was a very small number of visitors comparing with other
years. The impacts of the Touristic Network app can be estimated assuming that a
certain percentage of these visitors would use the app. Calculations are done
assuming that:
- 1% from the global number of annual visitors uses the Touristic Network app,
so 8630 tourists.
- 5% from the global number of annual visitors use the Touristic Network app, so
43150 tourists.
- 10% from the global number of annual visitors use the Touristic Network app,
so 86300 tourists.
- 15% from the global number of annual visitors use the Touristic Network app,
so 129450 tourists.
- 20% from the global number of annual visitors use the Touristic Network app,
so 172600 tourists.
If well disseminated, the Touristic Network app could be used by maybe 1% to 20% of
the tourist population in Trentino. These visitors would adopt the Touristic Network app
and use it in order to discover “more hidden” ski resorts more fitting their requirements
and in order to save driving time, being less stuck in traffic jams.
These 1% to 20% tourists, travelling to Trentino during several days in winter time and
using the app, would drive on less congested routes to less busy ski resorts. It would
be less vehicles leading to the most famous and busy ski resorts which, as they are
mountain roads, do not have a lot of capacity to host traffic. This means that the routes
leading to the most famous and busy ski resorts would be have a traffic less dense as
a certain percentage of tourists go somewhere else. Consequently, the traffic will be
reduced by the percentage of tourists using the Touristic Network app. The tourists,
better spread over the whole region of Trentino, will benefit from less traffic congestion
along the mountain roads leading to ski resorts. In addition of impacting the traffic
situation, the pollution would drastically be reduced. Indeed, more the app would
D1.4 Page 30 of 40D1.4 Final TomTom pilot
distribute the visitors to every ski resort, less there would be congestion on the regional
network. Consequently, less pollution would be produced.
Assuming all these positive consequences using the Touristic Network app, below is
the table with the estimations calculated depending on how many tourists adopt the
app:
Table 2: Estimation of the positive impacts thanks to the adoption of the Touristic
Network app.
% of users from total 0% 1% 5% 10% 15% 20%
number of tourists
(863 000 visitors)
Number of users 0 8630 43150 86300 129450 172600
Average traffic 0 480886 446366 403216 360066 316916
reduction*
Total hours wasted in 309722 306939 295823 281924 268025 254126
traffic jam (hours)
Average Money saved 0% 1% 4% 9% 13% 18%
Total fuel wasted 185833 184166 177494 169154 160818 152475
(litter)
CO2 saved 0% 1% 4% 9% 13% 18%
Below follows the explanation of the calculations done to come up with the estimations
given in the table.
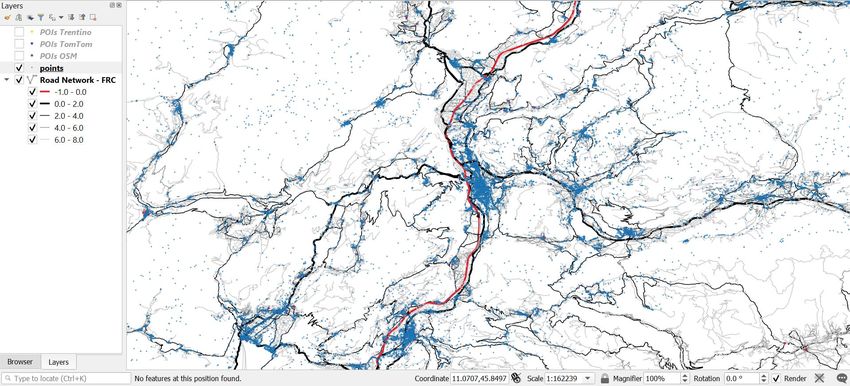
In order to calculate the average traffic reduction, floating car data and traces were
used to give an estimation of the current traffic situation during winter time in Trentino
region. This estimation of “how much traffic is in roads leading to ski resorts during the
touristic winter peak season”, considering 863 000 tourists, was then deducted by the
percentage of tourists hypothetically using the Touristic Network app.
The traffic analysis was running for 20 ski resorts routes and during the touristic winter
peak seasons. Data collected from the 1st December 2018 to the 28th of April 2019
were selected to be studied.
D1.4 Page 31 of 40D1.4 Final TomTom pilot
Figure 20: Ratio of visitors who went through a traffic jam going to a ski resort
Table 3: Ratio of visitors who went through a traffic jam going to a ski resort
D1.4 Page 32 of 40D1.4 Final TomTom pilot Considering 863 000 tourists, 489 516 tourists are in a jam as an average of all the calculated routes. Assuming that, if the tourists use the Touristic Network app and that they go to other not congested ski resorts, their numbers was deducted from the number of jams. The total number of hours wasted is calculated comparing the jams with the optimal travel time for each route leading to every ski resort and considering the number of “jammed drivers”. The total numbers hours wasted is approximately 309 722 hours. Of course, this is only an estimation. From this number, the number of visitors who used the app were deducted in order to calculate the average money saved. The total fuel wasted, estimated at approximately 154 861 litters, was calculated by multiplying the idle oil consumption (litters per hour) with the total hour wasted in traffic jams. The idle oil consumption was estimated at 0,60 litter per hour, which equal 0,16 US liquid gallons per hour, for the calculation: “Based on work developed by Argonne National Laboratory, the idle fuel consumption rate with no load (no use of accessories such as air conditioners, fans, etc.) varies widely. Compact cars with 2-liter engines consume about 0.16 gallons per hour. A large sedan with a 4.6-liter engine consumes just over twice as much fuel at idle, or over a quart.” (source: https://www.chicagotribune.com/autos/sc-auto-motormouth-0308-story.html) However, this is a very low estimation considering that during winter time vehicles consume more energy with the heating system on, etc.: “The U.S. Environmental Protection Agency (EPA) estimates that a drop-in temperature from 24°C to 7°C can increase fuel consumption in urban commutes by 12 to 28%.” (Source: https://www.nrcan.gc.ca/energy/efficiency/energy-efficiency-transportation-and- alternative-fuels/choosing-right-vehicle/tips-buying-fuel-efficient-vehicle/factors- affect-fuel-efficiency/cold-weather/21032) To sum up, the more tourists would use the Touristic Network app, the more they would drive to less famous ski resorts and get away from traffic jam along the way leading to the suggested ski resort. Less vehicle would be going on the most famous ski resorts. The tourists would be more equally spread among the different ski resorts and there would be less traffic congestions. Consequently, there would be less oil consumed and less pollution. D1.4 Page 33 of 40
D1.4 Final TomTom pilot
CHAPTER 3: EVALUATION OF THE UC2 "PARKING
  SERVICES" AND UC3 "TRAFFIC SERVICES"

1. The UC2 “Parking services” including Off-Street and On-Street
     Parking

Contribution of QROWD in launching the TomTom On-Street Parking Service.

Parking search takes on average between 3.5 and 14 minutes in a typical search to
find a parking spot. It causes frustration to drivers who do not find easily proper parking
spots. In addition to contribute to increased traffic congestion, searching for parking
spot also adds to noise pollution and CO2 emissions.

Facing this issue, the solution developed in QROWD was to inform drivers about
available parking spots by using parking probabilities developed in TomTom but also
by gathering different kind of datasets, especially parking payments (Data n°1035).
The Off-Street Parking dataset was also provided by the Municipality of Trento. In
order to inform the drivers, the Off-Street parking as well as the On-Street parking
services are both visualized into the QROWD dashboard. It indicates to the visitors of
the website the parking situation at different times of the day and during the different
days of the week. Therefore, citizens and visitors of Trento know the parking situation
and know where the probability of finding a parking spot is the highest at the time they
want to park their vehicle. This information has a major impact on the traffic situation
as, when drivers are informed about available parking spots, they avoid dangerous
driving behaviour searching for parking free spots which drastically slow-down the
traffic.

The TomTom On-Street Parking Service was released in February 07, 2018. Before
hands, it was already provided to the Trento for the year of 2016, 2017 and 2018. The
results were very good despite the fact that Trento is a relatively small town of around
120 000 inhabitants.

For the year 2016 and 2017, it was necessary to combine 6 years of datasets in order
to obtain proper results for the city of Trento. For the year 2018, four years of traffic
data were computed in order to obtain proper results. This shows an improvement in
the number of available traces.

The parking payments dataset (Data n°1035) was planned to be integrated into the
parking probabilities to increase the quality of the probabilities. Unfortunately, the
dataset could not be provided by the Municipality of Trento due to licensing negotiation
issues. This dataset was not released in time to allow its integration into the parking
probabilities.

Therefore, the improvements can only be observed by evaluating the Parking
Probabilities. Unfortunately, the main problem encountered by the parking
probabilities team in TomTom is that there is no way to measure the quality of the

  D1.4                                                                     Page 34 of 40
D1.4 Final TomTom pilot traces used for the probability’s calculations. There is no way to quantify improvements which causes problem to evaluate the tool. The parking probabilities team as well as the quality team, aware of this problem, are working on it. However, assuming that most of drivers would be checking from time-to-time, when it is needed, the parking probabilities, the routes would be less congested. Following this, the CO2 emission would be reduced since the pollution would be positively impacted and would be reduced. In the same way, the average money saved would be higher compare to the situation where drivers do not know where to park and spend lots of time searching for a free spot. D1.4 Page 35 of 40
D1.4 Final TomTom pilot
       2. The UC3 "Traffic services"

       Contribution of QROWD in improving prototypes today commercialized: The
             MOVE Portal, a successful traffic management tool for cities

       The four traffic analysis services described below were used in order to run analysis
       and to study the traffic of Trento and Trentino. At that time two out of the four services
       were at the stage of prototype.

                          Table 4: The four services supported by QROWD

Traffic analysis   Used          Description                                            Status
service
Route              UC1           Designed to address the growing road congestion        Product release in
Monitoring                       challenges faced by Smart Cities worldwide. Route      November 14, 2017
                                 Monitoring is a service that helps traffic managers,
                                 event managers and emergency service
                                 dispatchers monitor travel times and delays on
                                 routes of interest – as they happen – and inform
                                 the public of delays and alternative routes through
                                 smartphones, in-car systems and variable
                                 message signs.
O/D Analysis       UC3           This service provides valuable insight for urban       Product release in
                                 and infrastructure planners by allowing them to see    September 18,
                                 drivers’ preferred routes and trip behaviour trends,   2018
                                 by identifying trip dynamics, and determine which
                                 areas of a city require additional infrastructure,
                                 information signage, new parking facilities or could
                                 be considered attractive for a targeted
                                 advertisement or a new retail location.
TrafficStats       UC3           Traffic Stats provides insights into the traffic       Product
                                 situation on the road network throughout the day.      improvement
                                 With the simplest set of inputs, users can create a
                                 customized query for a specific area or route,
                                 specific days and the time periods in the date range
                                 that are of interest. The results are computed, and
                                 a report is made available to view or download
                                 within just a few minutes. Even a complicated
                                 query containing a large area and a wide date
                                 range will never take longer than 24 hours to
                                 generate results.
Road Event         UC3           One way to stop congestion from forming is to          Product
Reporter                         inform drivers of potential blockages before they      improvement
                                 occur – giving them time to find a new route. Road
                                 Event Reporter service helps achieve this goal of
                                 reducing congestion by allowing cities and road
                                 authorities, event organizers, and fleet managers
                                 to collaborate and announce roadwork or
                                 stoppages to millions of users at once. Trusted

          D1.4                                                                      Page 36 of 40
D1.4 Final TomTom pilot
partners can report road closures, accidents and
other potential traffic disruptions using the Road
Event Reporter, a web-based application. Once
the disruptions are reported, TomTom’s traffic
fusion engine and moderation teams use GPS
observations from millions of connected devices to
validate the issue. The temporary disruption is then
reported to users, encompassing in-dash systems,
smartphones, navigation devices and web, to help
improve routing calculations.
QROWD has highly contributed in testing these different services and in delivering
many feedbacks to the production teams implementing and constantly improving these
services which were rebranded. Feedbacks were constantly given, helping the team
implementing all these traffic analysis services to obtain the best results.
All over the years of the project QROWD, the design of all the traffic analysis services
kept changing and kept being improved. The Move Portal rebranding has been
finalized in September 2019. As result the final design is catchier compare to the
previous designs. Also, the traffic analysis services are today designed in a more
intuitive interface.
Today these four services have been already released into the market and are
available as part of “TomTom Move” which is the web portal. Before, all the services
were standalone which means multiple web portals. Today, all these services were
moved into this single web portal in order to avoid users to play with multiple interfaces.
This facilitates the commercialization of all these four services to cities and traffic
management experts.
D1.4 Page 37 of 40D1.4 Final TomTom pilot
3. Licensing after project
Table 5: Licensing of TomTom products/services used in QROWD
# Services Usage after QROWD License Link
1 Parking Yes, possible. Yes. No
Probabilities However, there is no
(version 2018) possibility of updating
the version to further
years.
2 Traffic API/ Map Yes, if the transactions Yes https://developer.tomtom.c
tiles used in the per day are less than om/maps-sdk-
QROWD 2,500 requests. Upper, web/functional-
dashboard the transactions need examples#traffic-flow
to be paid.
3 Road Event The access granted to Yes https://road-
Reporter (part of the Municipality of event.tomtom.com/
the MOVE offer) Trento will stay open.
They have access to
an evaluation account.
4 TomTom MOVE A license will be Yes https://developer.tomtom.c
Portal (Route needed for further om/route-monitoring/route-
Monitoring, usage. monitoring-documentation
Origin/Destination,
TrafficStats)
When QROWD will terminate, several licenses will be needed by the partners using
TomTom services.
Please, find below the table showing the different needs of licensing.
1. The Parking Probabilities service does not require any license because updated
versions cannot be provided because of company's restructuration.
2. The Traffic API and Map tiles are licensed. Details can be found on the developer
portal website of TomTom (the link is in the table). Under 2,500 requests per day
the transactions are free, upper users need to pay the transactions.
3. The evaluation account of the Road Event Reporter is free to use. The
Municipality of Trento will keep the access to the account. In case it closes, or
that they request a live account to register incidents, an access with be granted
to them.
4. To be used to run further analytics, the access to the MOVE portal will need to
be requested and a paying account will need to be set up.
D1.4 Page 38 of 40D1.4 Final TomTom pilot CONCLUSION The implementation of all the different use cases part of the WP1 was successfully achieved. The final description of the prototype of the Touristic Network use case is described in this deliverable. This prototype was evaluated by two UX designers who showed lots of interest and found that this feature is very promising in a commercial point of view at a global scale, due to the diversity of the business use cases. In addition, they reported that some improvements are still needed. The visualisation of schematic maps needs further studies especially in the domain of cognitive load in order to propose a complete and well-finish feature. In parallel of further studies, product managers will be asked about their interest in implementing such feature within the navigation products. Following their approvals, more investments will be done in the study of cognitive load and visualisation of schematic maps in order to potentially commercialized the Touristic Network as a feature of every TomTom Go Navigation applications. In addition, the contribution of QROWD in supporting prototypes developed within TomTom is reported in this document and shows the value of feedbacks. It indeed helped the production teams understanding the view and needs of secondary cities like Trento. These prototypes tested within QROWD are today successful commercialized products on the market. This Touristic network as well as the Parking Service use case demonstrates the growing importancy of crowdsourcing more and more data in order to improve the quality of datasets (e.g. POIs), but also to get feedbacks from service users in order to better understand their needs. D1.4 Page 39 of 40
D1.4 Final TomTom pilot
REFERENCES
B. Weber, “How much gas is wasted by idling?”, Chicago Tribune, March 11, 2018.
URL: https://www.chicagotribune.com/autos/sc-auto-motormouth-0308-story.html

Cold weather, Natural Resources Canada, April 9th, 2018.
URL: https://www.nrcan.gc.ca/energy/efficiency/energy-efficiency-transportation-and-
alternative-fuels/choosing-right-vehicle/tips-buying-fuel-efficient-vehicle/factors-
affect-fuel-efficiency/cold-weather/21032

Statista Research Department, “Italy: international tourists´ arrivals in Trentino-South
Tyrol 2016, by province”.
URL: https://www.statista.com/statistics/703156/international-tourists-arrivals-in-
trentino-south-tyrol-by-province-italy/

“New TomTom Origin-Destination Analysis Enables City Planning”, TomTom,
September 18, 2018.
URL: https://www.tomtom.com/company/press-releases/news/25031/

“TomTom’s Next-Generation Road Event Reporter Launches”, TomTom, October 17,
2019. URL: https://www.tomtom.com/company/press-releases/news/25936/

“TomTom Traffic Index: Mumbai takes Crown of ‘Most Traffic Congested”, TomTom,
June 04, 2019. URL: https://www.tomtom.com/company/press-releases/news/25601/

D5.2 Pilot Report, SLIPO, private deliverable. URL: http://slipo.eu/?page_id=30

D5.3 Final Evaluation Report, SLIPO, public deliverable, not yet published.
URL: http://slipo.eu/?page_id=30

  D1.4                                                                   Page 40 of 40
You can also read