ATM in Europe It's all about performance
←
→
Page content transcription
If your browser does not render page correctly, please read the page content below

ATM in Europe
              -
It's all about performance
COPYRIGHT:
FABEC
PERFORMANCE MANAGEMENT GROUP
WWW.FABEC.EU

                               2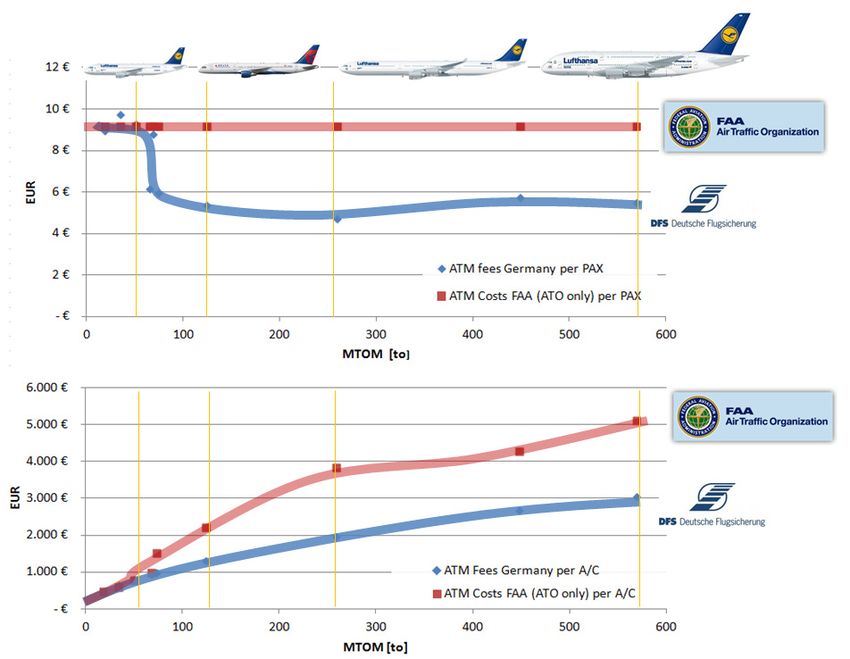
TABLE OF CONTENTS

1         Executive summary .................................................................................................................................. 4
2         Objective of this paper ........................................................................................................................ 6
3         European ATM viewed by outsiders .................................................................................................. 7
    3.1       Excerpts from other publications ......................................................................................................... 7
    3.2       Summary of the public statements ............................................................................................. 8
4         "Financial damage of EUR 5 billion annually" ................................................................................. 8
5         "42 additional unnecessary km on average per flight" .............................................................. 11
6         "ATM in the USA is significantly less expensive and they handle more air traffic" .............. 14
7         Summary .............................................................................................................................................. 26

                                                                                                                                                                 3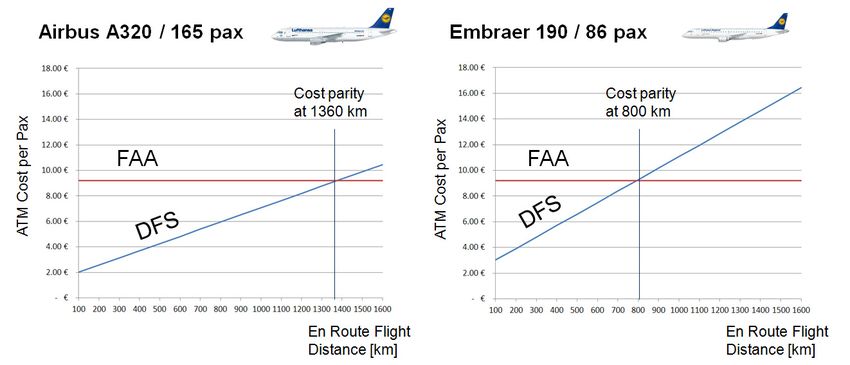
1 EXECUTIVE SUMMARY
Background
European air traffic management (ATM) has received a lot of bad press. "Fragmented",
"too expensive", or "flights zigzagging across Europe" are typical headlines that suggest
that there is a lot of work to be done to further optimise ATM in Europe.
Particularly the European Commission expressed criticism in response to delays in the
exceedingly political implementation of SES. It made harsh allegations that there were
persistent areas that needed serious attention in the European sky and has demanded
speedy improvement in committees as well as in statements to the press.
The Commission has the support of the European airlines who are acting under intense
pressure to reduce costs. Many are in the middle of consolidating and some are
stagnating. More and more have increasing problems earning a modest profit over the
long term by transporting passengers and air cargo.
From the perspective of its customers, ATM is increasingly seen as a cost intensive
provider of infrastructure that is capable of causing significant financial damage to its
customers when ATFM delay occurs or direct routings cannot be provided.
Criticism of ATM is frequently overstated and oversimplified, usually at the expense of
the facts. For instance, the number of sectors in Europe (650) is used to illustrate
fragmentation. This completely disregards the fact that dividing airspace into sectors is
currently one of the basic ATM principles around the world.
The very critical portrayal of European ATM is in stark contrast to other facts that have
not had as much attention from the media:
At present, air traffic regularly ad naturally crosses national borders in Europe
without any problems.
Technologies (e.g. radar, radiotelephony, ILS) and procedures that are used in
Europe are compatible with aircraft and crew from around the globe.
In the first half of 2013, about 98 percent of flights in the FABEC area experienced
no ATFM delay.1
Conclusions
This document attempts to explain both sides of the differing views and it reaches some
important fundamental conclusions.
The way the European Commission and the airlines describe the performance of
European ATM is not accurate. Certainly, there is room for improvement, but the
scale of the necessary improvements is not nearly as large as some assert.
Statements that have appeared in the media, in EUROCONTROL documents and
European Commission papers are not understandable even for experts.
Additionally, they do not state their sources nor how certain conclusions were
arrived at. Some of the statements concerning delay costs would not pass
examination if the factual accuracy were checked in a neutral and thorough
manner.
Often, bits of isolated information are used. In other words, only supporting facts
are presented without providing other relevant facts. This is, in particular, the
underlying principle used when comparing performance between the USA and
Europe. This type of comparison clearly cannot be used as the basis for optimising
the European situation.
1http://www.fab-europe-central.eu/fab/internet_2010/englisch/start/performance_first_half_2013_19_
august_2013/mr_performance_first_half_2013_final.pdf
4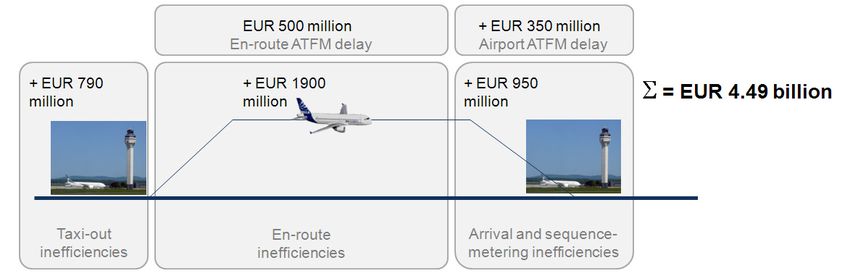
The criticism of European ATM usually ignores the fact that, for example, a
reduction of delays can only be attained by providing additional capacity.
Additional capacity is, however, linked to higher expenditures and costs. Thus the
goal ought to actually be to achieve a balance between costs and benefits
(reduction of delay) and not the total elimination of delays.
This document aims to point out specific mistakes in the criticism that is frequently
asserted concerning performance as follows:
Criticism concerning European Conclusions of this paper
ATM
"Airlines and passengers annually It is unclear how the amount of EUR 5 billion was
incur financial damage of about arrived at. By contrast, the costs stemming from
EUR 5 billion due to the delays caused by ANSPs, which include the
inefficiency of the fragmented anticipated route extensions that could be
European air traffic control reduced, come to about 25% of this value. This
system. These costs would be would equal about EUR 1.25 billion per year.
eliminated if the SES
This amount is equivalent to about 16% of the
requirements were met."
annual total air navigation charges of all European
ATM and not the alleged 63%.2
Any efforts to reduce this amount would have to
be measured against the expenditures necessary
to make it happen (cost benefit ratio).
"The fragmented structure of Currently, the foreseeable level of potential
airspace translates to additional improvement of flight efficiency in Europe is 6 km
unnecessary 42 km on average per flight – not 42 km.
per flight in Europe."
The "fragmentation" of airspace does not
necessarily have anything to do with this potential
saving of 6 km. There are many reasons why
aircraft are not able to keep to the ideal flight
path, e.g. separation or weather.
These 42 km could obviously only be saved if each
aircraft were to fly the great circle in the en-route
part from TMA exit to entry and if these exit and
entry points were located exactly on the line
connecting origin and destination airport.
"The FAA in the USA controls Depending on the exchange rate and the approach
more air traffic at about half the used to analyse the situation, the FAA is either
costs." just a bit more expensive or just a bit less
expensive for airspace users than ATM in Europe.
The high traffic performance per air traffic
controller in the USA has more to do with different
traffic mix, different working conditions and
working methods applied in the USA. These are
related to societal and cultural conditions or safety
concerns and cannot be adapted.
2EUR 1.25 billion delay costs / EUR 8 billion ATM charges = 15,6%; EUR 4.5 billion delay costs / EUR 8 billion
ATM charges = 62,5%
5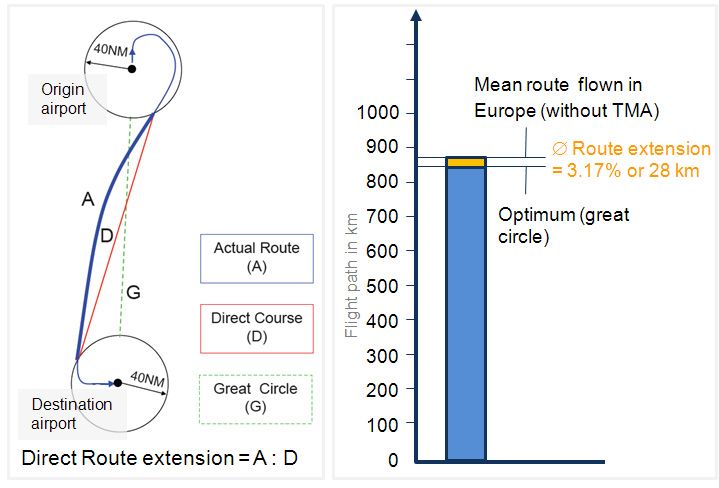
Outlook
    Having a well-founded and comprehensive understanding of the actual situation and the
    reasons for any real failings is the sole prerequisite for a serious estimate of what
    potential for improvement truly exists and if a feasible level of effort and expenditure
    would mitigate the problems.
    Not until there is a factual basis
    -   can adequate measures be initiated - be they national or international, related to a
        certain area or with a view to gate-to-gate
    -   can a goal-oriented strategy for the European ATM system be formulated.
    We would like to invite you to engage yourself with the facts and connections presented
    in this document. The goal is to support the development of European ATM to optimise it
    even further as concerns performance and costs.

2   OBJECTIVE OF THIS PAPER
    Criticism of European ATM in the media and at various European committees is
    characterised by its focus on non-uniform procedures, diverse organisational structures,
    operational procedures in need of improvement and relatively high costs. Many
    publications link these failings to the sluggish implementation of the Single European Sky
    (SES).
    Early in the summer of 2013, a wave of publications appeared that focused on the
    following alleged deficiencies:
    -   Annual losses of billions of euro caused by "inefficiencies of European ATM",
    -   Ongoing deficiencies in flight route efficiency and
    -   The high cost of European ATM in comparison to the FAA
    The goal of this paper is to expand on the fundamental data and facts on which the
    statements on the performance of European ATM were based.

    Limits
    This paper does not aim to present European ATM as a totally optimal construct as
    concerns operations and organisation. There is room for improvement and this is being
    addressed on many fronts. However, to take advantage of the existing potential, our
    view should be directed at the facts concerning opportunities and limitations so that
    optimisation efforts can focus on a sensible use of funds to achieve realistic and adequate
    benefits. This paper would like to make a case for this fact-based point of view.
    It is also not the intention of this paper to make light of the high level of performance of
    American ATM and the FAA. Instead, the point is to offer a neutral perspective on aspects
    that are comparable and others that are not comparable in the ways ATM is provided on
    both continents.

                                                                                               6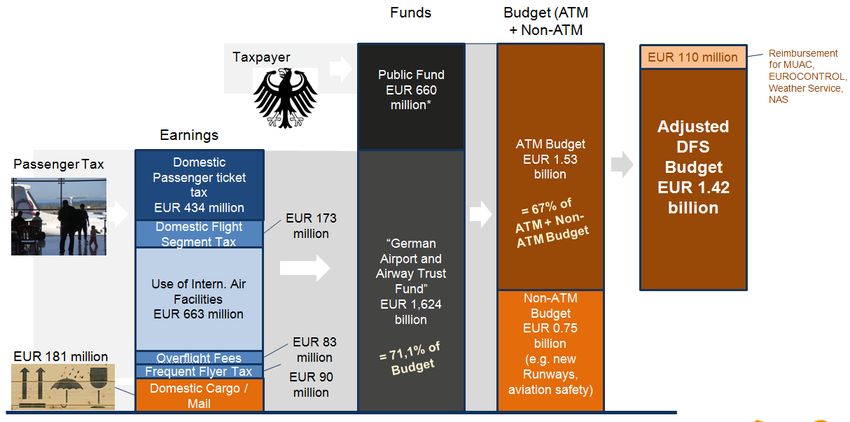
3   EUROPEAN ATM VIEWED BY OUTSIDERS
3.1 Excerpts from other publications
    The less-than-adequate performance evaluations for European ATM come chiefly from four sources:
    1)   Airlines and their associations
    2)   The European Commission
    3)   EUROCONTROL
    4)   The media (using press releases from the above mentioned groups)

    The following selection of published quotations exemplifies this:
    1) Interview with Christoph Franz, CEO of Lufthansa in June 2013 in "Airline International":
       "Every intra-EU flight is 50 km longer than necessary, which results in $6.53 billion (EUR 5 billion)
       in additional costs—every year. And don't forget the avoidable CO2 emissions, which add up to 50
       million tonnes every year. So the arguments about why we need SES now are extremely
       convincing. The industry has a clear environmental roadmap, we have technology, tools, and
       procedures. Now it’s up to the EU to finally implement SES to bring true benefits to the public and
       the environment."

    2) Remarks of Tony Tyler at the Annual General Meeting of the International Federation of Air
       Line Pilots’ Associations (IFALPA) in April 2013:
       "Europe needs the Single European Sky (SES), but progress is glacial. The European Single Sky
       Committee’s recent decision to endorse weakened performance and charging scheme regulations
       for ANSPs over the period 2015-2019 is a huge setback in the much needed drive to deliver the
       efficiency improvements aviation needs. The failure to implement the SES in Europe costs
       airlines, air travellers and the overall economy 5 billion euro per year and wastes some 8.1 million
       tonnes of CO2 per year—and it hurts our ability to grow."

    3) Press release of the European Commission of June 2013
       "Inefficiencies in Europe's fragmented airspace bring extra costs of close to 5 billion euro
       each year to airlines and their customers. They add 42 kilometres to the distance of an
       average flight forcing aircraft to burn more fuel, generate more emissions, pay more in
       costly user charges and suffer greater delays. The United States controls the same
       amount of airspace, with more traffic, at almost half the cost. EU Transport Commissioner,
       Siim Kallas, said: "Our airlines and their passengers have had to endure more than 10
       years of reduced services and missed deadlines on the route to a Single European Sky.
       We cannot afford to continue this way."

    4) Interview with Frank Brenner, General Director EUROCONTROL in "Flugrevue" in
       February 2013:
       "Currently the costs of providing air traffic control for one airplane per hour are almost
       twice as expensive in Europe as in the USA. We haven't even brought up Asia in the
       discussion. Costs arising from the provision of air navigation services in Europe run to
       about EUR 14 billion annually. Of these, 8.3 billion are air navigation services charges. The
       remainder is costs that the airspace user has to bear due to inefficiencies. Thus, delays
       cost about EUR 5.2 billion per year."

    What is remarkable in many of the publications of media services, newspapers and agencies is
    that they often simply take over the pronouncements formulated by interest groups without
    reflection and usually do so without quoting their source or identifying the complaint as a
    quote.

                                                                                                           7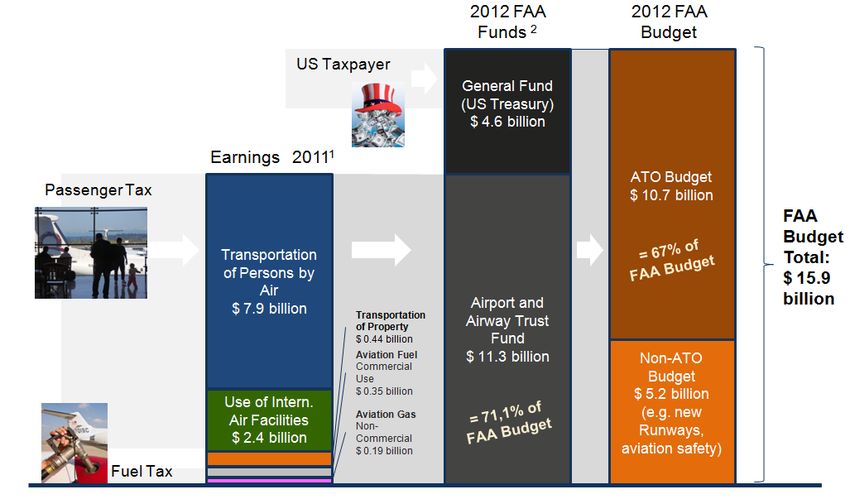
It must also be said that the ANSPs and their associations have not yet made any visible
attempts to change this negative perception of European ATM performance in the media in
their own publications, for instance. It seems reasonable that the public and the aviation
industry take this silence as silent consent.
3.2 Summary of the public statements
The negative statements can be summarised into three categories:
"Airlines and passengers annually incur financial damage of about EUR 5 billion due to
the inefficiency of the fragmented European air traffic control system. These costs
would be eliminated if the SES requirements were met."
"The fragmented structure of airspace translates to additional unnecessary 42 km on
average per flight in Europe."
"The FAA in the USA controls more air traffic at about half the costs."
4 "FINANCIAL DAMAGE OF EUR 5 BILLION ANNUALLY"
A source for this figure has never been given explicitly in any of the publications. In the
publications of the European Commission, one is referred to the work of the Performance
Review Commission (PRC) that undertook a calculation of the total costs of European
ATM in the 2012 Performance Review Report (PRR). According to it, the airlines as
customers do not only have costs in the form of air navigation charges but also in the
form of delays. Delays can be – as supported by numerous studies of the relation
between delay and costs – calculated to be financial indicators. The average assumption
is that one minute of flight delay results in additional costs of about EUR 80.
For the year 2012, the PRC calculated a total cost of about EUR 13 billion for the
complete ATM of Europe. About EUR 8 billion air navigation charges are included in this
value as well as about EUR 850 million financial damage that occurred due to ATFM delay
en-route and at destination airports in 2012.
Together with about EUR 3.6 billion due to what is referred to as "ANS-related
inefficiencies in the gate-to-gate phase", the result is a total sum of about EUR 4.5 billion
which is close to the often mentioned amount of EUR 5 billion. (Perhaps the amount of
EUR 5 billion is related to the value mentioned in the 2011 PRR. In that year, ATFM delay
costs were about EUR 500 million higher than in 2012 which would be about equivalent
to the difference.)
The figure of EUR 4.5 or 5 billion that is mentioned in the voluminous PRR is taken for
granted by various interest groups.
Picture 1: Gate to gate depiction of the EUR 4.49 billion yearly financial damage, that are
summarized in the 2012 PRR
8
The following examines the constituent parts of this enormous sum, looking at the aspect
as to whether the ANSPs can influence the figure or not. Where this is the case, we will
examine to what extent this is influenced and to what extent cross-border activities such
as SES would be able to reduce these figures. At the same time, we will analyse whether
and how the implementation of SES would help to reduce the amount of “EUR 5 billion
financial damage” (EUR 4.5 billion in 2012).

a) Constituent parts of ATFM delay
Generally3, the ANSPs are made responsible for all ATFM delay, including en-route and
airport, as part of the alleged 2012 financial damage of EUR 4.5 billion.
-    There are two reasons why this does not work for the ATFM Airport part.
     According to CODA, ATFM Airport is defined as follows: "Airport and/or runway closed
     due to obstruction, industrial action, staff shortage, political unrest, noise abatement,
     night curfew, special flights." Only a few of these disturbances of operations are
     actually within the control of the ANSP. This means that making the ANSP completely
     responsible for ATFM Airport delays by calling it "ANSP-related delay" or "ANSP-
     related financial damage" is not at all accurate. This is in contrast to "ATFM en-route
     delay" which is mainly actually within the control of the ANSP.
-    The minimisation of delay means more work and costs. For example, to minimise the
     ATFM delay en-route caused by the ANSP, more air traffic controllers could be hired
     which would reduce the amount of delays due to staff shortages, but this would
     increase the annual costs of the ANSP. The value for ATFM en-route delay in 2012
     corresponds to the balance between capacity costs and delay costs and is in keeping
     with the requirements of RP1. A sustainable reduction to EUR 0 delay costs would
     simply be too expensive.

Picture 2: Cost of Delay versus Cost of Excess Capacity. An economic optimum is situated at the
lowest point of the blue “total cost” curve. Source: http://agile-jitsu.blogspot.de/
The graph shows that the economic optimum (the lowest point of the blue curve) would
be achieved when there is a balance between delay costs and costs of additional capacity
and not the lowest point of the red curve (delay costs).
If the SES requirements make it possible to actually reduce the relevant ATFM en-route
delays in the future is an open question that cannot be answered at present. This is
because it is currently not known which share of ATFM delay is caused by factors that
would be improved by better cooperation between the ANSPs. In addition, it is not clear
whether a reduction of ATFM delay could be achieved at the ANSP itself (by new ATM
systems, additional ATCOs) or between ANSPs (FABEC: Free Route, IP South East etc.).

3http://www.tourism-review.com/airspace-fragmentation-of-europe-wastes-billions-news3516; http://www.iata.org/
whatwedo/ops-infra/Pages/ATM.aspx; https://www.eurocontrol.int/articles/viewpoints-single-european-sky

                                                                                                             9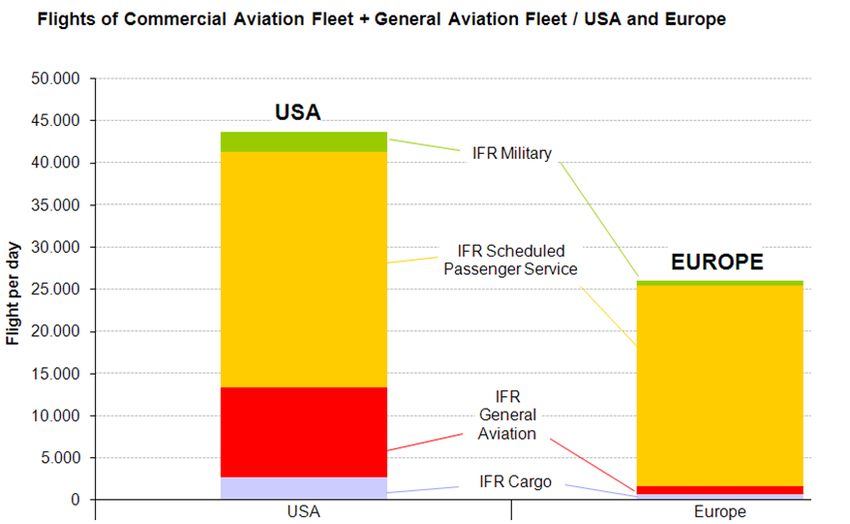
b) Constituent parts of the "ANS-related inefficiencies in the gate-to-gate
   phase"
This type of ANS-related inefficiency became more predominant in 2012 according to PRR
when it amounted to about EUR 3.6 billion and thus was seven times as high as the
share of ATFM delay en-route that the ANSPs were originally responsible for. This
extremely high percentage of damage allegedly caused by the ANSPs was not presented
very clearly in PRR 2012. The figures were based on "strategic" and "tactical" delays.
Even the "Scheduled Block Times" defined by the airlines were calculated into the
strategic delays. These were apparently also made the responsibility of the ANSPs.
The PRR does not contain any directly usable references to the studies that were the
basis for this. The sole reference was an analysis by the University of Westminster4
(commissioned by: EUROCONTROL, PRC). However, it is not clear what the figures have
to do with the statement that the ANSPs are responsible for the majority of the strategic
and tactical delays. The analysis does not make it generally clear how the damage
caused by inefficiencies can be divided between the various parties involved in the
process (ANSPs, airports, airlines), if this is at all possible. Such an anlaysis would make
it easier to judge whether there is an overstatement of the number of delays caused by
ANSPs. The analysis in PRR 2012 also does not contain information as to how much the
ANSPs can influence these inefficiencies and if so how much this would cost. There is also
no information as to what extent these inefficiencies could be reduced within acceptable
cost limits, which would have to be commonly agreed upon between ANSP and Airlines or
regulator. Information is also lacking about the percentage of ANS-related inefficiencies
caused by the structures of nationally oriented ATM in Europe and whether the
implementation of SES would actually help to reduce these types of delay. The fact that
about half of the inefficiencies supposedly occur during the taxi-out or in the arrival
process supports the idea that this is related to local problems and not cross-border
processes.
In addition, according to the CODA annual report 20125, the percentage of the total
primary delay costs in 2012 due to ATFM En Route delay amounted to 8%. The
percentage due to airlines during the same time frame came to 54%. This relation could
be used to show that the airline-related inefficiencies would be presumably much larger
than the EUR 2.1 billion damage caused by the ANSPs6 if the calculation method of the
PRC (additional damage equivalent to the sum of “ANSP related inefficiencies”) were
used. The reports, however, do not mention this.

Picture 3: Share of primary delay reasons 2012 according to data of the CODA annual report 2012
(page 7, figure 3)

4   http://www.eurocontrol.int/documents/european-airline-delay-cost-reference-values
5 http://www.eurocontrol.int/sites/default/files/content/documents/official-documents/facts-and-figures/coda-
reports/CODA-Digests-2012/coda-digest-annual-2012.pdf
6According to CODA annual report, there were 2.8 minutes of primary delay per flight caused by reason “airline”
on average. Given the widely used value of 79 EUR damage per minute of delay and 9.5 million flights per year in
Europe, this would account to 2.8 minutes x 79 EUR/minute x 9.5 million flights = EUR 2.1 billion annual damage

                                                                                                                10
5 "42 ADDITIONAL UNNECESSARY KM ON AVERAGE PER FLIGHT"
It is also difficult to find concrete calculations as to how this figure was arrived at. The
publications7 neither mention a source nor how the figure was derived.
The current horizontal route efficiency in Europe for the en route part of flights is in fact
3.17% (2012)8. This means that - excluding the distance of 40 NM around the departure
and destination airport - the average flight of about 1000 km has an actual flight path
that is 28 km longer than the great-circle distance. (The shortest distance between two
points on a sphere is the great-circle distance.)
Picture 4: Graphical display of distances that can be used for deriving values for flight
efficiency (left); share of the route extension 2012 to mean route flown (right)
The 42 km mentioned can either be explained if one looks at the relation between the
actual flight path (“A”) and the segment of the great circle connecting the origin and
destination airport (“G”+ 2 x 40 NM). The prerequisites for this are that
- the runway at the departure airport must point in the exact direction of the
destination airport,
- the wind conditions must be such so that a take-off in this direction is possible,
- the direct route between departure and destination airport must be flown,
- the runway at the destination airport must lie in exactly the same direction as the
flight path and
- the prevailing wind conditions must allow for a landing in this direction.
These conditions are purely theoretical and can hardly ever be met for any flight, except
for helicopters and vertical take-off and landing aircraft (VTOLs).
Another explanation would be that the actual flight path (“A”) was set in relation to the
shortest connection between the circumferences of the origin and destination airport
(“G”). Even in this case, one can hardly diminish this route extension to 0 since the exit
and the entry points will hardly lie directly on the crossing of line “G” to the 40NM-circle.
In most cases, this could only be achieved by adding extra miles within the 40NM range
to overfly this point:
7 http://europa.eu/rapid/press-release_IP-13-523_en.htm; http://www.swissnews.ch/magazine/single/article/air-
traffic-control-to-be-tighter-and-flights-lessened-across-europe/
8https://www.eurocontrol.int/sites/default/files/content/documents/events/Presentations/userforum2014/d2-
europe/140130-UF-1330-Free%20Route%20and%20Airspace%20improvements%20in%20practice%20-
%20Bucuroiu.pps
11Picture 5: “Optimal routing” (yellow route), that would have to be flown to reduce the
route extension according the value of A/G to 0 km.
It is doubtful, if one can judge this track “G” as an optimal one.
Even a direct flight path between the “perfect” exit and entry point of the 40-NM circle
around the departure and destination airport is rarely possible as there are many reasons
to divert from this great-circle track.
- Conflict avoidance
- Airspace availability (e.g. military airspace)
- Airspace structure (disentangling traffic flows, TMA design)
- Flight planning optimised with regard to wind
- Flight planning optimised with regard to ANS costs
- En-route + local weather
The diverse reasons for not flying the direct route between two points underlines the
importance of differentiating between the existing values measuring route efficiency. A
difference needs to be made between deviations that were necessary and those that
were unnecessary. Undoubtedly, deviations from the flight path to avoid infringement of
separation count as a necessary reason.
Studies have shown that route efficiency decreases with increasing traffic density in
saturated airspace and that conflict avoidance is a growing reason for this reduced
efficiency9.
While the popularly quoted 42 km cannot be a serious measuring reference and do not
differentiate between necessary and unnecessary route extensions, even the actual 28
km (= 3.17%) route extension cannot be used as the goal for achievable route efficiency.
Possible improvements:
- Free route in upper airspace
- Relocation of military exercise areas
- Optimised flexible use of airspace (FUA)
- Optimised flight route designs
- Uniform ANSP unit rates in Europe
At the moment, the PRB itself assumes10 that the implementation of all the currently
planned measures for route efficiency to be in place in Europe by 2019 will in the best-
case scenario have improved the situation by about 2.5%. For the flight distance of 1000
km (en route part: 1000 km – 2 x 40 NM (TMA) = 851 km), this would mean a reduction
of roughly 0.6% of the en route flight path.
9 http://atmseminar.eurocontrol.fr/past-seminars/5th-seminar-budapest-hungary-june-2003/papers/paper_023
10 http://ec.europa.eu/transport/media/consultations/doc/2013-07-03-sesrp2/report.pdf
12Picture 6: Relation between air traffic density/complexity and achievable flight efficiency
(schematic example), source: DFS
Further clear improvements are probably only achievable, when measures are taken that
have an overriding significant effect on route efficiency, such as the shifting of military
exercise areas out of the core area of European air traffic. This is a very long-term
political discussion that is outside the direct influence of the ANSPs. The current status of
this discussion should not be taken as another example of the poor performance of
European ATM. In addition, further study is required to determine the percentage of
route extensions caused by various factors. Such a study could help to prioritise
measures by analysing the costs in relation to the benefits. Only promising measures
would be implemented. This means as well that it has not been shown as yet which
portion of route extensions are caused by a lack of cooperation between ANSPs in
Europe.
One way forward for improving flight efficiency in Europe is supported by measures on
the FABEC level. However, the curve showing the development of flight efficiency is more
and more approaching an asymptote, whose exact location is not known really known
due to the reasons mentioned above.
Picture 7: Possible measures to increase en route flight efficiency. Schematic
representation, effects of the measures would have to be calculated at European level;
Source: DFS
What is clear is that a reduction of the route extension to 0 km cannot and will not
happen. It would be pointless to set this as a goal. Whoever mentions this goal in the
media has based their statements on false assumptions.
136 "ATM IN THE USA IS SIGNIFICANTLY LESS EXPENSIVE AND THEY
HANDLE MORE AIR TRAFFIC"
Picture 8: Sectorization of Air Traffic Control Center Washington (left) and Langen (right)
This comparative evaluation can be found in many documents concerning the potential
for improvement of European ANSPs. It is based mainly on PRC research which compared
many performance parameters of the FAA with European ANSPs11.
The FAA in fact currently controls a volume of traffic (number of controlled flights per
day) that is about 67% higher than the European12 total while total costs for ATM are
slightly higher in the USA.
Table 1: Air Traffic Management U.S.A. and Europe in comparing figures
11http://www.eurocontrol.int/sites/default/files/content/documents/single-sky/pru/publications/other/us-europe-
comparison-of-atm-related-operational-performance.pdf
12 43,600 flights per day versus 26,000 flights per day = +67%
14If one examines the FAA infrastructure costs in relation to the traffic volume, it is
accurate to state that the controlled flight in the USA on average is about 38% less
expensive as in Europe13 when the total amount of traffic is taken into consideration.
However, this point of view overlooks many influential factors which could change the
assertion:
a) Exchange rate variability
In the years from 1999 to 2013, the exchange rate between the US dollar and the
euro fluctuated between $0.86 and $1.58/EUR 1. The current exchange rate is about
$1.30/EUR 1.
Picture 9: Exchange rate EUR/USD 1999 - 2013
http://www.onvista.de/devisen/Dollarkurs-EUR-USD
This means, that total costs of ATM in the USA vary depending on the fluctuating
exchange rate.
Using the exchange rate from June 2008 ($1.58/EUR 1), the cost of a controlled flight
in the USA was even 50% cheaper than in Europe. Using the exchange rate from June
2001 ($0.86/EUR 1), it would have been 7% cheaper. The current comparison of
costs in the USA and Europe (PRB report "Union-Wide Targets for the 2nd Reference
Period of the Single European Sky Performance Scheme", page 34) attempts to take
the fluctuation into account by introducing the value "ATM/CNS Cost in MPPS 2011" to
compare the costs of infrastructure14.
Table 2: Comparison of ATM/CNS costs in MPPS 2011
Source: http://ec.europa.eu/transport/media/consultations/doc/2013-07-03-
sesrp2/report.pdf
The MPPS value takes the purchasing power of the two currency areas into account.
The PRB document quoted here states that the ATM/CNS-related MPPS (2011) for the
USA was 9.3 and for the SES area was 6.9.
Using this comparison, the controlled flight in the USA is currently 20% cheaper than
in Europe, not 50%.
13 Cost per flight = Cost of ATM per year / (controlled flights per day * 365 days)
14 http://ec.europa.eu/transport/media/consultations/doc/2013-07-03-sesrp2/report.pdf
15Using the PPP value of 0.8 that is published by OECD15, cost of ATM in the USA
account to EUR 8.6 billion, leaving the controlled flight in the USA 36% less expensive
than in Europe.
b) Infrastructure costs
To a great extent, the provision of ATM is a provision of infrastructure with which the
ANSP must offer defined air navigation services (safety, avoidance of delay) in a
defined airspace.
These services only allow for a limited variation on the basis of traffic-related costs.
The depreciation and maintenance of a radar station does not become less expensive
when there is less traffic. The principle is comparable to the situation of a traffic light,
that will not be cheaper in operation (concerning total costs) if less traffic passes. The
hardware for ATM in the USA is used more frequently by aircraft. This means that
initially the provision of services is cheaper for everyone. This is assuming the costs
are divided equally between those using the services and that ATM technology
expenditures are not different than in Europe.
The level of performance that an ATM system uses has an influence on the
infrastructure costs. It is certainly not sensible to use the same system (e.g. AMAN,
DMAN) to assist air traffic controllers in areas with low air traffic volume that is used
in areas with high traffic volume. This decision is, however, again made on the basis
of the balance between capacity costs and delay costs.
Staffing has a further visible effect on the "unit cost" of ATM. This aspect will be
examined in section d).
As mentioned in section a), the direct comparison of infrastructure costs (ANSP
expenditures for ATM) shows that this value is not half as high as in Europe. Using
the OECD PPP value of 0.8, the costs in the USA as described are actually 7.5%
higher than in Europe (EUR 8.0 billion Europe versus EUR 8.6 PPP in USA). Even using
“conventional” methods, the costs in the USA at the current exchange rate of
$1.30/EUR 1 are 3.8% higher than in Europe (EUR 8.0 billion Europe versus EUR 8.23
billion in USA). This means that there must be another reason for the costs per
controlled flight being lower in the USA. It cannot be the annual costs for ATM
themselves.
c) Traffic structure
The major difference between the air transport system in the USA and Europe is the
level of traffic numbers of the various of types of traffic. While, in Europe,
significantly more than 90% of controlled air traffic consists of IFR commercial traffic,
in the US, this amounts to only about 70% (see picture 10). The remainder consists
primarily of IFR general aviation flights (propeller airplanes, helicopters, business
jets).
15 http://www.oecd.org/std/prices-ppp/purchasingpowerparitiespppsdata.htm
16Picture 10: Air traffic composition USA – Europe; Source for FAA data: Bureau of
Transportation Statistics, FAA ETMS, OPSNET, 2009; Source for European data:
EUROCONTROL 2009 with deductions for IFR Cargo and GA IFR
Many of these flights operate from aerodromes and in airspace not used to the same
extent by commercial aviation. This means that these two types of traffic use
separate spacial capacity resources which reduces the load on the airspace and thus
the FAA.16
Some of the reasons for the higher number of general aviation flights in the USA than
in Europe are
the geography,
the comparably cheaper fuel costs,
frequently better weather for flying,
in certain regions, a not very extensive network of roads and
a lack of competition for other modes of transport such as high-speed train
network and
the generally poor reputation of the rail system.
Another factor behind the higher number general aviation flights that fly under IFR is
that it is much cheaper to get and maintain a PPL and IFR rating in the USA than in
Europe17.
In addition, general aviation (GA) in the USA is only responsible for a very small
portion of the financing of the FAA. For the services rendered, they pay a comparably
small fuel tax. It can be assumed that IFR general aviation flights in the USA amount
to about 25% of total traffic but that they pay for significantly less than 2% of the
costs of the FAA.
If one compares flown passenger miles per day between the two systems, the
European value is about 11.7% higher than the American one. This is because, on
average, IFR general aviation flights are expected to transport two passengers while
commercial aviation transport about 78 in the USA and about 91 in Europe18.
16 http://dspace.mit.edu/bitstream/handle/1721.1/72392/ICAT%20REPORT%20SHETTY.pdf
17 https://aopa.de/interessen-vertretung/easa-lizenzierung/die-easa-es-tut-sich-was.html
18 The assumption for this calculation is that the average commercial aircraft in the USA has about 97 seats with a
utilisation rate of about 80%. In Europe the average aircraft is larger with about 120 seats but the utilisation rate
is a bit lower at 76%.
17Picture 11: Passenger Transportation Performance USA – Europe;
Source for FAA data: Bureau of Transportation Statistics, FAA ETMS, OPSNET; Source
for European data: EUROCONTROL with deductions for IFR Cargo and GA IFR;
Average Miles from 2010 U.S./Europe Comparison of ATM-Related Operational
Performance; Average Passengers per IFR Scheduled: 78 (USA) 91 (Europe); average
pax per IFR GA: 2 (assumption)
If the costs for ATM (PPP) are divided by the passenger kilometre performance
parameter, the conclusion can be drawn that the controlled passenger kilometre in
Europe is currently about 16% less expensive than in the USA.
Picture 12: Comparison of ATM Costs per year versus ATM Costs per Pax-Miles;
Source: Data from table 1, pax miles from picture 11
d) Working conditions
The higher level of staff efficiency in the USA (more controlled flights and a somewhat
lower number of air traffic controllers) is also influenced by the fact that according to
a PRC report from 200319, American air traffic controllers work about 30% more
hours than their European counterparts. This is due to the generally different working
conditions as can be seen in the following table comparing American, German and
French working conditions.
19EUROCONTROL PRC 2003, A Comparison of Performance in Selected US and European
En-route Centres; May 1, 2003.
www.eurocontrol.int/documents/comparisonperformance-selected-us-and-european-en-route-centres.
18Table 3: Comparison of different working conditions in the USA and in Europe
(examples); source: FAA, DFS, DSNA
As these working conditions are not generally a special feature of the ATM industry
but a reflection of the general differences between working conditions in the USA and
Europe, changes in this area would not be achievable without initiating a fundamental
societal discussion.
e) Working methods
In addition to the simply larger average traffic density, working methods are also a
reason for the greater number of flight hours controlled per air traffic controller in the
USA. While many European ANSPs use the principle of single staffing at times of the
day with low traffic density and at night, in the USA it is also quite normal to have a
single radar controller control a high level of traffic. In the USA, the coordinator
position is frequently not filled. This position coordinates with adjacent sectors and
ensures that there are always two pairs of eyes observing traffic. Due to safety
considerations, it will probably not be the case in Europe that the principle of two
controllers will be eliminated during peak times in the foreseeable future.
FAA tower locations can decide on their own if they continue to staff a tower when
there are fewer than 4 flights per hour. This is not possible in Europe.20 It has been a
widespread practice to have single staffing at towers in the USA. However, ever since
an accident in 2006 in Lexington, Kentucky,21 and other incidents that occurred under
single staffing at night, 22 this working principle has received a lot of criticism.
f) Charging regime
In Europe, the costs for ATM are based on flight-related criteria and covered by
charges related to the weight of the aircraft. In addition, the airlines are seen as
customers. In the USA the system is financed mostly by passenger taxes that every
passenger has to pay. A difference is made between international and domestic
flights when determining these taxes. Taxes are also incurred on the number of miles
that are collected in a frequent flyer programme. In addition, special taxes on jet fuel
are passed on to the FAA. Actually, they are passed on to the Airport and Airway
Trust Fund (AATF) which is the main source of funding for the FAA. Here is a list of
the most relevant taxes that finance the FAA:
20 http://www.businessweek.com/news/2013-02-22/zombie-towers-among-air-traffic-sites-on-faa-closing-list
21 http://lessonslearned.faa.gov/ll_main.cfm?TabID=1&LLID=54&LLTypeID=12
22 http://www.nbcnews.com/id/42573418/ns/travel-news/t/sleeping-controllers-prompt-faa-add-late-night-staff/
19Table 4: FAA funding taxes 2013 (examples); source: FAA; Taxpayer Relief Act of
1997, Public Law 105-35 – updated January 2013; remarks: Only relevant aviation
taxes are mentioned here – e.g. Tax on General Aviation, Fuel Tax or Oceanic has not
been selected or taken into consideration here.
In addition to that, FAA funding needs financial help from the US treasury – thus
leading to the statement, that the FAA does only reimburse parts of its costs by user
taxes.
Picture 12: The FAA tax structure; source: DFS, based upon data from FAA
In this picture one can see, that in 2012 the share of the “Airport and Airway Trust
Fund”23 that comprises the passenger-, airfreight and fuel-related taxes, is just a
71.1% share of the FAA budget. The rest is added by the “General Fund” that is
23 http://www.faa.gov/about/office_org/headquarters_offices/apl/aatf/
20financed by the US taxpayer. From this “FAA total budget”, ATM costs (Budget of FAA
Air Traffic Organisation) make a 67% share in 2012.
If this charging regime were used in Germany with a few conservative adjustments to
take into account the very different dimensions and the related high percentage of
international flights, Germany would have the following annual income:
Table 5: FAA funding principle adopted to German, source: DFS, based on FAA and
DFS data; Source/remarks:
1
Exchange rate used EUR 1 = US$ 1.30 ; German Federal Statistical Office,
Fachserie 8, Reihe 6.1.; Verkehr – Luftverkehr auf ausgewählten Plätzen, Anlage
„Originäreinsteiger.“
2
German Federal Statistical Office, Fachserie 8, Reihe 6.1.; Verkehr – Luftverkehr auf
ausgewählten Plätzen – here only DFS controlled aerodromes were taken into
account. The assumption was that there was an equal number of disembarkments as
embarkments in other EU countries.
3
EUROCONTROL, CRCO: Report on the Operation of the Route Charges System in
2012 & DFS data
4
German Federal Ministry of Transport, Building and Urban Development (BMVBS):
Traffic statistics for 2011/2012, pages 86 et seq
5
Lufthansa annual report 2008, page 136; value per 1000 miles: EUR 7.30 ;
Wikipedia.de: Miles and More 198 billion miles accrued in 2010
+ Intra-EU flights regarded as domestic flights and comparable to continental USA +
FAA ATO attains 68% of FAA budget
Germany would levy approx. EUR 1.62 billion of taxes from air transport. Considering
the ATO part and other tax contributions as well as reimbursement for costs of MUAC,
weather services, NAS and EUROCONTROL DFS would earn EUR 1.42 billion per
annum.
21Picture 12: The FAA tax structure adopted to Germany / DFS; source: DFS, based
upon data from FAA
The DFS budget would increase by 32 percent if the FAA tax structure were applied to
Germany:
Picture 13: The FAA tax structure adopted to Germany / DFS; source: DFS, based
upon data from FAA
Thus, the popular argument that the public, airlines and passengers in
Europe necessarily have to pay more for ATM than in the USA is not true.
(As described above, one of the reasons for this is that general aviation in the USA
hardly pays anything for ATM and thus the others have to pay accordingly more.
Another major reason is, that the FAA is partly funded by general tax money.)
To make this easier to understand, the following calculation is for a "typical" domestic
flight on a flight between Munich and Hamburg with a typical aircraft type (Airbus
A320) carrying 165 passengers.
22Table 6: Comparison of air navigation charges USA – DFS for an Airbus A320 (165
pax), flying the distance from MUC to HAM
This calculation shows that the charges for ATM in the USA would be more than twice
as much per passenger than in Germany.
Another example with a smaller aircraft (Embraer EM190, 86 passengers) on the
same trip shows the following values:
Table 7: Comparison of air navigation charges USA – DFS for an Embraer EM190 (86
pax), flying the distance from MUC to HAM
ATM costs in this example are 37% higher in the USA than in Germany.
These examples show, that both charging regimes are extremely hard to compare
due to their nature. While the ticket-price-based FAA tax remains constant with the
travel distance (domestic and international flights), this not the case with the
European ATM charging regime. The following picture shows, that for each aircraft
type, there is an en route flight distance, where ATM costs show parity.
23Picture 14: Comparison of ATM costs per pax versus en route flight distance; source:
DFS, based on FAA and DFS data
Another comparison depicts the dependence of the ATM costs per aircraft or ATM
costs per pax by the Maximum Take Off Mass (MTOM or MTOW). As an en route flight
distance, 800 km were chosen, which roughly equals the average en route flight
distance in the USA24:
Currency exchange rate JUL 2013: 1.30 $/€
Domestic Flight, Flight Distance En-Route 800 km (equals average flight distance of scheduled passenger services USA)
Picture 15: Comparison of ATM costs per pax / per A/C versus MTOM; source: DFS
with FAA data and DFS data
It is visible, that ATM services are clearly more expensive in the USA for aircraft > 50
to MTOM, which is the case for the majority of aircraft of airline carrier.
24 http://www.faa.gov/air_traffic/publications/media/us_eu_comparison_2012.pdf section 2.1.3
24Table 8: Active Fleet of United Airlines (example for aircraft MTOM)
Source: http://en.wikipedia.org/wiki/United_Airlines
This effect comprises domestic and international flights as well.
Using other ways of approaching the topic, it still cannot be shown that the airlines
and passengers in Europe have to pay more than in the USA. In Europe, the
percentage of total operating costs related to air navigation costs amounted to about
6% in 2012 according to the AEA. At the same time, the FAA share in the costs of an
average domestic ticket was about 9%.
Picture 16: Share of ANSP/FAA costs in operating costs / ticket prices;
Assumption Europe: No accounting for a profit margin per flight (about 5%, which
would raise the share of costs of the ANSP to about 5.9%.)
Assumption USA: Average domestic air fare Q IV 2012 round trip $374 according to
DOT Bureau of Statistics;
http://www.rita.dot.gov/bts/airfares
http://web.mit.edu/TicketTax/Karlsson_Incidence_of_Ticket_Taxes_and_Fees_in_U.S
._Domestic_Air_Travel.pdf
Even if one assumed that to this 9% another 3.6% would have to be added (General
Fund share, paid by the US treasury) and only 67% of this total of 12.6% were used
for FAA air navigation services (Picture 12), then the remaining figure of 8.5% would
still not lead to the conclusion that ATM is cheaper for public, airlines and passengers
in the USA. Even when not taking into account the General Fund share, the ATO costs
account to 6% - equivalent to the European value.
257 SUMMARY
a) "Airlines and passengers annually incur financial damage of about EUR 5 billion due
to the inefficiency of the fragmented European air traffic control system. These costs
would be eliminated if the SES requirements were met."
The ANSP opinion:
It is unclear how much of the EUR 5 billion can be influenced by ANSPs.
It is unclear how much of this is caused by "fragmented" ATM.
It is unclear to what extent "ANS-related inefficiencies" could be diminished - by
whom, how much and at what cost
The delay costs for which ANSPs were responsible in 2012 were primarily EUR 0.5
billion from ATFM en-route delays (2011: EUR 1 billion with 2.6% more traffic).
The delay values achieved in 2012 are in line with the RP1 target.
A reduction of ATFM delay costs to EUR 0 is not feasible with justifiable expenditures
(balance of delay costs vs. capacity costs).
b) "The fragmented structure of airspace translates to additional unnecessary 42 km on
average per flight in Europe."
The ANSP opinion:
Currently en-route flight paths are on average about 3.17 percent longer than
great circle distance (= 28 km route extension).
The fact that the responsibility for ATM remains largely in the hands of individual
European countries is only one of many reasons for longer flight paths.
Even if airspace and procedures continue to be optimised, route extension cannot
be 0 km. (Alone keeping the necessary separation between aircraft is a factor that
will not allow for further reduction – therefore route extension is at least partially
necessary.)
According to the PRB, the potential for improvement is about 6 km per flight
on average (leading to 22 km route extension).
c) "The FAA in the USA controls more air traffic at about half the costs."
The ANSP opinion:
Costs for ATM infrastructure (technology, personnel) are comparable in Europe
and the USA.
Different working conditions and working methods result in a higher amount
of traffic handled per air traffic controller in the USA.
Calculated per passenger, ATM roughly costs about the same in Europe as it
does in the USA.
ATM in Europe per passenger kilometre is 13% cheaper than in the USA – with the
current exchange rate of 1.30 $/€. Using the PPP value from OECD, ATM per
passenger kilometre is 16% cheaper than in the USA.
A general comparison of ATM-related data between the EU and the USA does not
help to design a solid European ATM performance improvement scheme. Reason:
Significant differences in basic working principles, working conditions, airspaces,
traffic mix and cost reimbursement principles.
26You can also read