Decarbonising European transport and heating fuels - Is the EU ETS the right tool? - Is the ...
←
→
Page content transcription
If your browser does not render page correctly, please read the page content below
European Climate Foundation

Decarbonising European transport
and heating fuels - Is the EU ETS
the right tool?

  Final Report                June   Cambridge Econometrics   js@camecon.com
                              2020   Cambridge, UK            www.camecon.com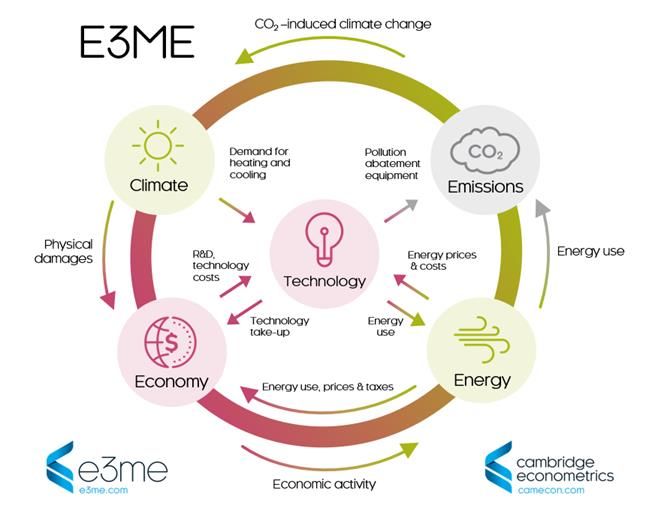
Decarbonising European transport and heating fuels - Is the EU ETS the right tool?

Contact person:            Jon Stenning js@camecon.com

Authors:                   Jon Stenning js@camecon.com
                           Ha Bui hb@camecon.com
                           Alexandra Pavelka ap@camecon.com

Project director:          Jon Stenning js@camecon.com

   Cambridge Econometrics’ mission is to provide clear insights, based on rigorous and independent
   economic analysis, to support policymakers and strategic planners in government, civil society and
                    business in addressing the complex challenges facing society.

                         Cambridge Econometrics Limited is owned by a charitable body,
                             the Cambridge Trust for New Thinking in Economics.
                                       www.neweconomicthinking.org

Cambridge Econometrics                                                                                                         2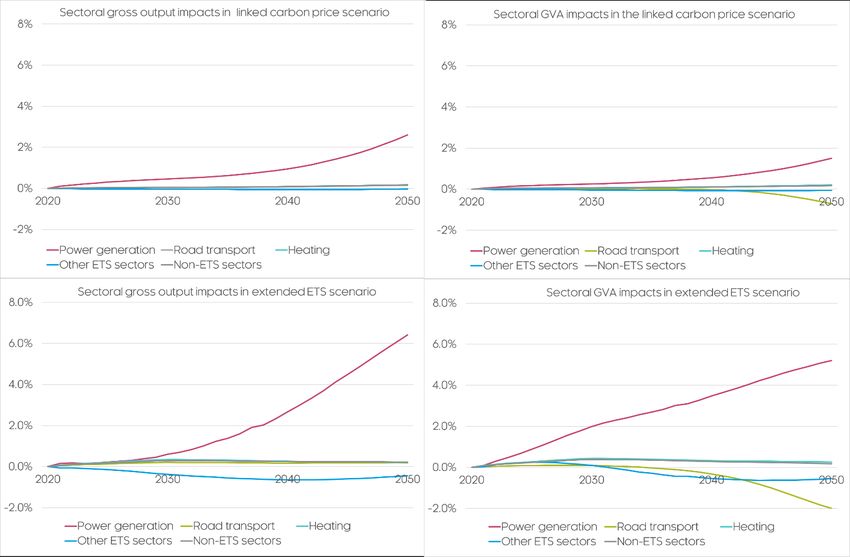
Decarbonising European transport and heating fuels - Is the EU ETS the right tool?

Contents

                                                                                               Page

1   Background                                                                                       5
    1.1 The policy context                                                                           5
    1.2 The aims of the analysis                                                                     5
    1.3 The structure of this report                                                                 6

2   The analytical approach                                                                          7
    2.1 The requirements                                                                             7
    2.2 Designing the scenarios to be modelled                                                       7
    2.3 The E3ME model                                                                             11
    2.4 Assessing the distributional impacts                                                       13

3   Environmental impacts                                                                          15
    3.1 Emissions trends in the baseline                                                           15
    3.2 Impacts of applying a linked carbon price in the transport & buildings
        sectors                                                               15
    3.3 Impacts of a single extended ETS including transport & buildings                           16
    3.4 The change from different revenue recycling options                                        17

4   Socioeconomic impacts                                                                          19
    4.1 The impacts on GDP                                                                         19
    4.2 The impacts on employment                                                                  22
    4.3 Distributional effects                                                                     23

5   Conclusions                                                                                    27

Appendices                                                                                         30

Appendix A        References                                                                       31

Appendix B        E3ME model description                                                           32

Cambridge Econometrics                                                                               3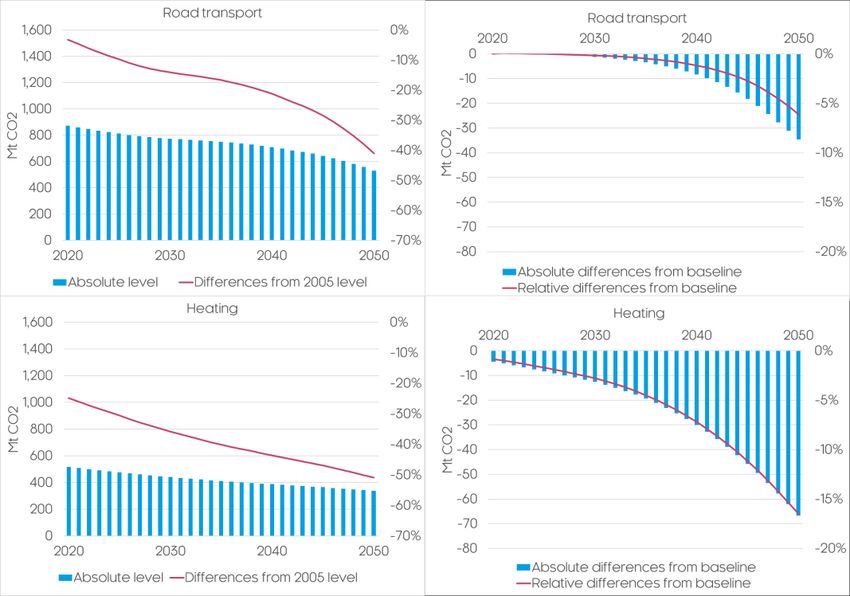
Decarbonising European transport and heating fuels - Is the EU ETS the right tool?

Summary for policymakers

• The European Commission is considering including transport and
  (residential & commercial) buildings in the ETS as a means of accelerating
  emissions reductions in these sectors.
• In this study, we have explored two possible approaches to doing that
  through the application of bottom-up technology and a macroeconomic
  model: (1) through the imposition of a linked carbon price in the transport
  and buildings sectors that is set at a level equivalent to the ETS allowance
  price, and (2) directly including these sectors in an extended ETS alongside
  existing ETS sectors.
• Our analysis finds that inclusion within the ETS, through either method
  explored, would not deliver emissions reductions in buildings & transport in
  line with the overall aims of the ETS.
• In addition, because the buildings and transport sectors are relatively
  unresponsive to the carbon price, under a single extended ETS cap
  companies in the existing ETS sectors would have to do more to
  compensate, and would need to achieve an additional 250 MT of carbon
  reductions by 2030, and an extra 315 MT of carbon reductions by 2040.
  This would lead to a loss of competitiveness in these sectors, and therefore
  small reductions in output and employment.
• Widening the single ETS cap to include transport and buildings would push
  up average spending on gas-fuelled household heating by 30% and
  increase the cost of fuelling a fossil fuel vehicle by 16% in 2030, before
  taking into account reductions in demand as a result of higher prices.
• At the same time, low-income households, which are most financially
  constrained, are likely to be hardest hit by a single extended EU ETS, with
  little scope to invest in new technologies and little discretionary spending on
  heating and transport that can be cut without affecting their quality of life.
• We conclude that the inclusion of transport and buildings within the ETS
  would not achieve the desired policy goal and would simultaneously create
  additional challenges both to consumers and to current ETS sectors.

Cambridge Econometrics                                                                               4
Decarbonising European transport and heating fuels - Is the EU ETS the right tool?

1           Background

1.1         The policy context
The European Commission describes the EU Emissions Trading System (EU
ETS) as the “cornerstone of the EU’s policy to combat climate change and its
key tool for reducing greenhouse gas emissions cost-effectively”1.
The EU ETS is a carbon cap and trade system, under which the Commission
issues emission allowances, which economic operators in certain sectors must
surrender at the end of each year to cover their emissions or face substantial
fines. There is a cap on the number of allowances issued each year, which
declines year on year; the aim is therefore to reduce the total emissions
allowed over time.
The EU ETS currently covers operators in power and heat generation, energy
intensive industries, and (at least until the end of 2023) intra-EU aviation, and
covers emissions of carbon dioxide (CO2), nitrous oxide (N2) and
perfluorocarbons (PFCs).
After her confirmation as president-elect of the European Commission, Ursula
von der Leyen outlined her desire to expand the coverage of the EU ETS; to
include aviation (in a more complete fashion) and shipping, and potentially
also to include road transport and construction (by which it is assumed she is
referring to space heating of buildings). The European Green Deal also
explicitly states that “it will consider applying European emissions trading to
road transport”. The aim of such a policy would be to accelerate emissions
reductions in these sectors.
Expanding the coverage of the ETS to cover road transport and buildings
would entail a major restructuring of the EU ETS, and there is an existing body
of evidence, including previous work by Cambridge Econometrics for the
European Climate Foundation2, which suggests that such a policy may be an
ineffective way of reducing emissions in these sectors, due to the degree of
‘lock-in’ (i.e. that vehicles, once they enter the stock, remain there for a long
period of time) and the relatively low price elasticity of transport demand (i.e.
that demand for road transport is not very responsive to price changes).

1.2         The aims of the analysis
In this study, we aim to explore the potential impacts of an extended ETS,
through the application of a macroeconomic model, E3ME, and other
quantitative analysis.
This study seeks to explore three primary research questions;
•      How responsive are the road transport and buildings sectors to a carbon
       price?

1
    https://ec.europa.eu/clima/policies/ets_en
2
    The Impact of Including the Road Transport Sector in the EU ETS, 2014
https://europeanclimate.org/the-impact-of-including-the-road-transport-sector-in-the-ets/

Cambridge Econometrics                                                                                      5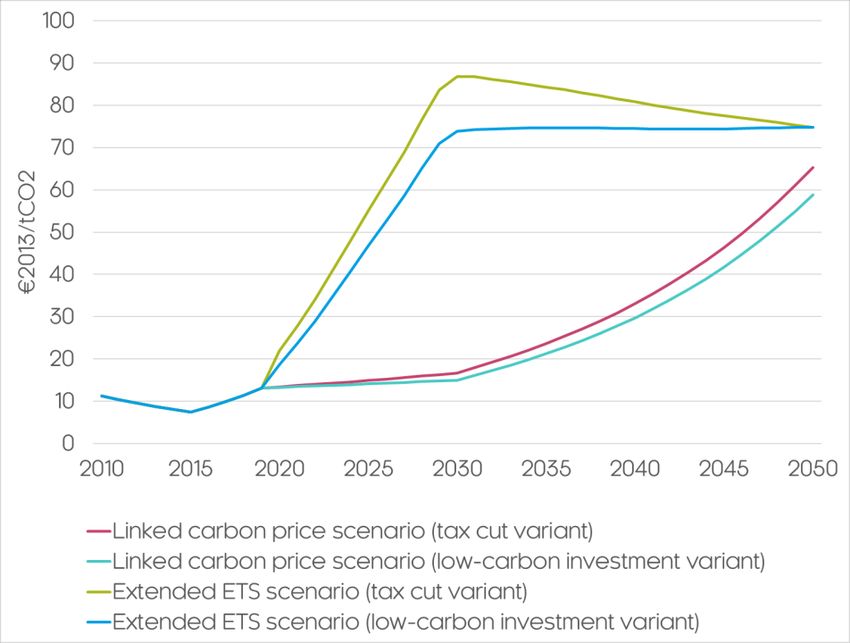
Decarbonising European transport and heating fuels - Is the EU ETS the right tool?

•     In a single unified EU ETS including these sectors, what is the impact on
      allowance prices, and where across the ETS sectors are the emissions
      reductions realised?
•     What are the economic and distributional impacts of including these
      sectors in the EU ETS?

These questions will be explored through the construction of example ETS
design scenarios, and the implementation of these scenarios in a
macroeconomic modelling framework. Through the macroeconomic model, we
are able to assess the price elasticity of emissions from the road transport,
heating and current EU ETS sectors, taking into account both short-term
demand effects and long-term technology substitution effects, and how these
play out against each other in a unified EU ETS, including implications for
household energy bills.

1.3      The structure of this report
In Chapter 2, we outline the way the analysis was carried out, including a brief
description of the key analytical tools. In Chapters 3 and 4 respectively we set
out the environmental and economic impacts of the scenario modelling, and in
chapter 5 we set out a series of conclusions from the analysis.

Cambridge Econometrics                                                                               6
Decarbonising European transport and heating fuels - Is the EU ETS the right tool?
2 The analytical approach
2.1 The requirements
The key topics assessed in this analysis were;
• The responsiveness of sectors (including road transport and buildings) to a
carbon price
• The change in the EU ETS allowance prices that results from expanding
the scope of the system
• The socioeconomic and distributional impacts of the introduction of
additional carbon costs in the existing ETS, road transport and buildings
sectors.
This requires two different quantitative approaches, which are set out in more
detail below. The bulk of the analysis uses E3ME, a macroeconomic model, to
assess the responsiveness of sectors, the ETS allowance prices required to
meet certain emissions targets, and the socioeconomic impacts of this policy.
After this analysis has been conducted, off-model analysis uses historical data
on consumer expenditure by income decile to examine in more detail the
potential distributional impacts of policy.
2.2 Designing the scenarios to be modelled
To assess the research questions posed in Chapter 1, we designed two
stylised scenarios, and implemented them on top of the model baseline. Below
we briefly describe key decisions made in the design of the scenarios, how the
three sets of outcomes are implemented, and the implications of our
approach.
Emission The first element of the scenarios that was decided was the level of ambition
reduction targets of the EU ETS. The EU ETS has a stated target for 2030 of emissions 43%
under the EU below 2005 levels3; for the period beyond 2030, a linear reduction factor of
ETS out to 2050 2.2% (in fact in place from 2021) is current policy, which implies a zero cap
(i.e. no emissions in ETS sectors) in 2058. This is substantially more
ambitious than the emissions projections in the PRIMES 2016 Reference
case, where the current ETS sectors reduce emissions by 37% in 2030, and
63% in 2050.
In the scenarios outlined below, we have chosen to use a mix of the official
policy and the PRIMES 2016 Reference scenario; specifically, we target a
43% reduction in ETS emissions in 2030 (in line with the 2030 climate &
energy framework) compared to 2005 levels, and a 63% reduction in ETS
sectors in 2050 (i.e. aligning with the PRIMES scenario). The reasoning
behind adopting a 2050 target that is less ambitious than the official policy is
that in this analysis, we are seeking to introduce a single policy (a carbon
price/extended ETS), and observe the different sectoral responses to that
single policy. Meeting a more stringent emissions reduction target (e.g. 80-
90% reduction in 2050) would require additional policy support in addition to
the ETS and introducing these complicates the interpretation of the analysis.
3
https://ec.europa.eu/clima/policies/ets_en
Cambridge Econometrics 7Decarbonising European transport and heating fuels - Is the EU ETS the right tool?
The scenarios described below all use the same ETS emissions reduction
target, as summarised in Table 2.1. The major difference between them is the
scope of that ETS.
Table 2.1 Emissions reductions achieved in ETS sectors in the scenarios
Scenario Emissions reductions in Emissions reductions in
ETS sectors in 2030 ETS sectors in 2050
(%, compared to 2005) (%, compared to 2005)
Baseline -43% -63%
Linked carbon price in -43% -63%
transport and buildings
Extended ETS -43% -63%
It is clear that a more stringent 2030 and 2050 emissions targets would require
a higher ETS price, and additional supporting policy, to be delivered. The
scenarios described below (and the results presented in subsequent chapters)
should therefore be interpreted as illustrative scenarios which explore the
relative responsiveness of sectors, rather than definitive policy scenarios.
Within the modelling framework, these targets are used to calculate EU ETS
allowance prices that are required to cover the emissions reduction required in
the relevant sectors. The resultant ETS allowance price is a function of the
responsiveness of emissions from each sector to changes in costs; so, the
inclusion of less responsive sectors would, inter alia, be expected to lead to
higher allowance prices. The resultant allowance prices are shown in Figure
2.1 below.
Figure 2.1 ETS allowance prices used in the analysis
In the baseline, the ETS allowance price rises steadily in real terms over time,
as more expensive abatement measures are required in existing ETS sectors
to meet the allowance cap. However, under a single extended ETS cap, a
Cambridge Econometrics 8Decarbonising European transport and heating fuels - Is the EU ETS the right tool?
much higher allowance price is required in the short term to drive sufficient
emissions reductions to meet the 2030 target across the extended range of
sectors – in particularly, to encourage a more rapid take-up of low-carbon
technologies in the road transport and buildings sectors. Once the 2030 target
is achieved, further abatement can be delivered (most notably in the road
transport and buildings sectors, through steady turnover of the stock) without a
further increase in the allowance price. The price therefore falls slightly in real
terms (although in nominal terms it increases slowly).
The model The starting point for our analysis is the PRIMES 2016 Reference case. This
baseline scenario, prepared for the European Commission, has extensive detail in the
public domain, and is therefore a suitable baseline from which to assess the
impacts of ETS policy. More recent baselines (for example, that used in the
European Commission’s Long Term Strategy4) do not have sufficient detail
available in the public domain for the relevant alignment of E3ME to be
conducted.
However, there is a major caveat to the use of this baseline; being published
in 2016, it has an outdated set of policies. For example, it does not include the
2030 climate & energy framework, nor reflect more recent policy regarding
carbon neutrality in 2050. This is most relevant to the level of emissions
reduction that occurs in the current ETS sectors, and those sectors (road
transport and heating) which are being considered for inclusion in the ETS. To
address this, we compared the decarbonisation achieved in the baseline in
current ETS sectors, transport and buildings to other existing studies5, and
adjusted the trajectory in the baseline to ensure broad consistency with
existing views.
A second important caveat is that, even when the baseline is aligned to the
published PRIMES 2016 Reference case, the difference in model structures,
and the way that the model is parameterized (i.e. how model relationships are
quantified) leads to different levels of sensitivity to policy. Most notably, the
introduction of a higher ETS price in E3ME, aligned to the PRIMES 2016
Reference case, will show different impacts to the same higher price
introduced into the PRIMES model.
Scenario 1 – a In the first scenario assessed, we took baseline projections of ETS allowance
linked carbon prices, i.e. the allowance price required to limit emissions in current ETS
price introduced sectors to the 2030 and 2050 targets outlined in Table 2.1, and introduced
into the road them as a carbon price in the road transport and buildings sector.
transport and The aim of such a scenario is to understand the impact that a carbon price
building sectors (which increases over time, reflecting increasing scarcity of allowances as the
emission reduction target increases) has upon the road transport and
buildings sector.
4
https://ec.europa.eu/clima/policies/strategies/2050_en
5
Including the IEA’s World Energy Outlook 2019 , EUCalc and EURIMA
Cambridge Econometrics 9Decarbonising European transport and heating fuels - Is the EU ETS the right tool?
Scenario 2 – an In the second scenario, we extend the coverage of the ETS to include road
extended EU transport and the heating of buildings. Allowance prices are calculated to
ETS including deliver the targeted emissions reductions across the enlarged ETS, but
the road without prejudicing which sectors within the extended ETS realise emissions
transport and cuts (i.e. following the principles of the EU ETS that the market should
buildings determine which sectors have the lowest abatement costs, and allow the
sectors emissions reductions to happen there, and for other sectors to pay for their
emissions).
The aim of this is to observe which parts of the extended EU ETS achieve
different levels of emissions reduction, and to better understand the
socioeconomic and distributional implications of such a policy.
The role of In both of the scenarios outlined above, there are expected to be higher
revenue government revenues; in the first scenario, a new revenue source is
recycling introduced (a linked carbon price on road transport and buildings), and in the
second the ETS is extended to new sectors (so more allowances will be
issued, and at a higher price, than in the baseline). This leads to higher
government revenues (although net effects could be reduced if economic
activity in some parts of the economy is reduced due to the competitiveness
effects linked to higher costs); the net economic impact of these scenarios can
be heavily dependent upon how such revenues are treated.
In this analysis we consider three potential options;
• A central case, where all revenues are recycled through tax reductions
(equally split between reductions in income tax, employers’ social security
contributions and VAT)
• A low carbon investment variant, where 10% of the revenues are diverted
away from tax cuts; 9% are used to realise energy savings, and 1% for
direct subsidies of low-carbon technologies, and the remaining 90% is
used for tax cuts as in the central case
• A debt paydown variant, where 90% of the revenues are still used for tax
cuts, but 10% is used to held onto by governments, and assumed to be
used to reduce government debt levels.
The aim of this sensitivity is to explore how the different choices of how
revenues are re-used affects the ETS allowance; this is likely to be through
both a rebound effect (i.e. recycling revenues to consumers is likely to
increase consumption, and therefore create additional emissions, some of
which will be in ETS sectors), and a technology cost effect (i.e. that
subsidising low carbon technologies increases their take-up, and can reduce
some emissions which are subject to the ETS).
Cambridge Econometrics 10Decarbonising European transport and heating fuels - Is the EU ETS the right tool?
2.3 The E3ME model
Overview E3ME is a computer-based model of the world’s economic and energy
systems and the environment. It was originally developed through the
European Commission’s research framework programmes and is now widely
used in Europe and beyond for policy assessment, for forecasting and for
research purposes.
E3ME as an E3 Figure 2.2 shows how the three components (modules) of the model - energy,
model environment and economy - fit together. The economy module provides
measures of economic activity and general price levels to the energy module;
the energy module provides measures of emissions of the main air pollutants
to the environment module, which in turn can give measures of damage to
health and buildings. The energy module provides detailed price levels for
energy carriers distinguished in the economy module and the overall price of
energy as well as energy use in the economy.
Figure 2.2: E3 linkages in the E3ME model
Technological progress plays an important role in the E3ME model, affecting
all three E’s: economy, energy and environment. The model’s endogenous
technical progress indicators (TPIs), a function of R&D and gross investment,
appear in nine of E3ME’s econometric equation sets including trade, the
labour market and prices. Investment and R&D in new technologies also
appears in the E3ME’s energy and material demand equations to capture
energy/resource savings technologies as well as pollution abatement
equipment.
The FTT models In addition to the treatment of technology through TPIs, E3ME also captures
low carbon technologies in the power, transport and residential heating sector
through its interactions with the Future Technology Transformation (FTT)
models which measure the substitution of technologies in response to
changes in costs (both purchase and operational). These models can better
Cambridge Econometrics 11Decarbonising European transport and heating fuels - Is the EU ETS the right tool?
assess shifts in technology, and the impact upon energy demand/emissions,
than a simple (linear) elasticity of demand, as found in many macro models.
The FTT models have a number of important characteristics:
• Investors are modelled according to a distributed curve of preferences (i.e.
investors are heterogenous, with different willingness to adopt
new technologies)
• The models do not model specific non-market barriers (i.e. split incentives
in rented properties which dramatically reduce the take-up of new
technologies, even when they have cheaper levelized costs)
• The models assume that technologies are perfect substitutes (e.g. that a
heat pump can be ‘dropped in’ as a replacement to a gas boiler in all
circumstances, and without considering the need for energy efficiency to
reduce peak heating need)
• The responsiveness to changes in technology costs is
calibrated based upon historical data
Some of the assumptions (e.g. perfect substitution, lack of non-market
barriers) have the potential to lead to over-estimates of the responsiveness to
price changes. Therefore, the baseline rates of decarbonisation in these
industries are adjusted to ensure that the model is producing results in line
with other studies.
The implications The use of these modelling tools, and in particular the FTT models to assess
of using this changes in demand for specific technologies in response to changes in fuel
modelling costs, has specific implications for the analysis. Using these models, we can
framework for better assess the long-term responsiveness of these sectors to changes in the
this analysis costs of specific technologies, since we are able to capture changes in
purchasing decisions, rather than simply assessing the short-term elasticity
(which is dominated by a change in demand for the final output in response to
price changes, rather than changes in the technology used). This approach
also allows for non-linear responses, i.e. for elasticities to change, which is a
key critique of the standard approach, where a single coefficient is estimated
based on historical data.
However, these models also make some simplifying assumptions which could
conversely lead to the over-estimation of elasticities. In particular, the models
assume that technologies are perfect substitutes (e.g. a heat pump can be
‘dropped in’ to replace a gas boiler, while in most cases substantial energy
efficiency improvements are required to a property in order to shift to a heat
pump for heating) and a lack of non-market barriers (e.g. split incentives in
rented properties which severely depress the take-up of low-carbon heating
technologies in this type of building).
We do not explicitly correct for this non-market barriers to take-up; instead, the
model baseline is calibrated to ensure broad consistency with other modelling
exercises which have more formally included these barriers. The implication of
this approach is that while the baseline is broadly in line with other modelling
approaches, there is the potential that our modelling over-estimates the
responsiveness of investors to changes in the price of heating technologies;
i.e. that the higher cost of fossil fuel-based technologies leads to a greater
degree of fuel switching in the modelling than would be observed in reality.
Cambridge Econometrics 12Decarbonising European transport and heating fuels - Is the EU ETS the right tool?
The approach taken through the combination of E3ME and FTT models is a
more detailed top-down approach; but while the FTT models do not treat
consumers as a homogeneous mass (a typical shortcoming of macro models),
they fail to take into account the full details of specific individual investment
decisions in the way that a bottom-up stock model might. This modelling
should not be interpreted as a perfect representation of these sectors, but as a
less simple representation than is typically included in macro models.
2.4 Assessing the distributional impacts
The introduction of a carbon price onto transport and heating fuels affects
households differently depending upon their individual circumstances, such as
their demand for these fuels and their household incomes. A key policy
consideration is the distributional effects of such policy; specifically, whether
policy has an unduly large impact upon the worst off in society.
In this analysis, we use a combination of E3ME results (for changes in fuel
prices) and evidence from the literature on the responsiveness of households
to changes in fuel prices to assess potential impacts on example households.
We construct a decomposition of impacts through a two-stage process. First,
we take changes in the price of transport and heating fossil fuels from the
macroeconomic modelling work described previously. We then consider,
based upon reviewed literature, the demand response that such a price
increase will elicit (i.e. by how much households might reduce demand when
faced with a price increase) to assess the overall change in fuel costs as a
result of the policy.
The heating fuel price increase is incorporated in the gas, liquid fuel and solid
fuels consumption categories, while the road transport price increase is
incorporated in the diesel, petrol and other fuels and lubricants for personal
transport equipment consumption categories.
We make a number of assumptions to assess these impacts;
• The passthrough rate of fuel price changes from industry to consumers is
100% in both the road transport and heating sectors.
• The elasticity of demand of the lowest-income households to changes in
heating costs is between -0.21 and -0.326, i.e. a 1% increase in the price of
gas for heating leads to a decrease of between 0.21% and 0.31% in
demand.
• The elasticity of demand of households to changes in road transport costs
in the lowest quintile ranges from -0.30 to -0.37, depending upon the
make-up of the household7.
• In both transport and buildings, price elasticities increase as income
increases; this behaviour can be attributed to the reduced role of
‘essential’ consumption as incomes increase (i.e. a smaller proportion of
total usage is to meet essential needs, and therefore a larger proportion is
discretionary and can be cut in response to price changes).
For the purposes of this analysis, we examine the impact in 2030, and take
6
Schulte, I. and Heindl, P. (2016) Price and Income Elasticities of Residential Energy Demand
in Germany. ZEW Discussion Paper No. 16-052.
7
ibid.
Cambridge Econometrics 13Decarbonising European transport and heating fuels - Is the EU ETS the right tool?
an example household which has not shifted their heating or road transport
technology. The aim of this exercise is to consider impacts on those who
might be worst affected by the policy; it is well understood that the lowest
income households are, in the absence of specific mitigating policy,
unlikely to have the financial means to change technologies (for either
heating or road transport) before the end of the natural life of their current
assets, and therefore are less likely to be able to respond to changes in
fuel prices through adopting new low-carbon technologies, and it is
precisely these kinds of consumers that we seek to examine through this
analysis. In housing, low-income households are also more likely to be in
rental properties8, where split incentives (the owner pays for the installation
of the heating technology, but the tenant pays the ongoing bills)
substantially reduce the take-up of low-carbon technologies when these
have higher purchase prices.
• Our analysis focuses on 2030 because this is when the distributional
effects are likely to be most pronounced; in the case of road transport,
there are unlikely to be large volumes of second-hand electric vehicles
available to purchase for low-income households, and the price-
competitiveness of low-carbon heating and transport technologies will still
be evolving, meaning that not all low-income households that need
replacement technology by 2030 will elect for (or have installed by building
owners) the low-carbon option.
• We assess only the response of households to changes in the costs of
fuels that they consume. There will also be indirect effects of the different
policy options explored; for example, increased transportation costs for
goods as a result of higher transport fuel prices, but these effects are
complex and better assessed entirely through the macroeconomic
modelling (where all policy effects, including changes in consumer income
and expenditure as a result of changes in employment, can net off against
each other).
8
See, for example, HM1.3 Housing Tenures (2019), OECD Affordable Housing Database, available at
http://www.oecd.org/social/affordable-housing-database/housing-market/
Cambridge Econometrics 14Decarbonising European transport and heating fuels - Is the EU ETS the right tool?
3 Environmental impacts
3.1 Emissions trends in the baseline
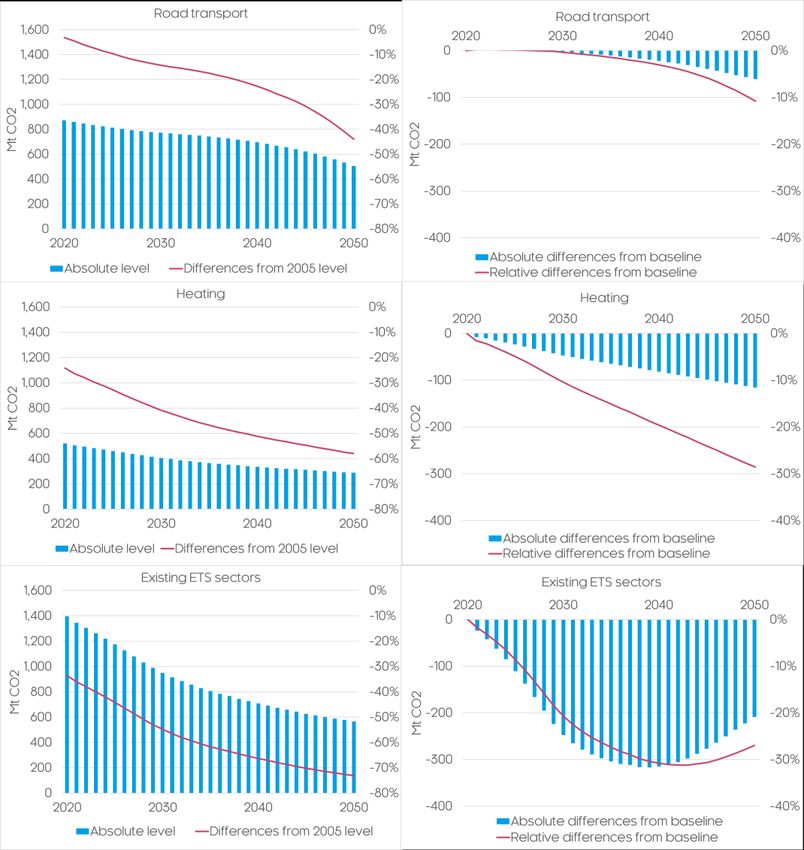
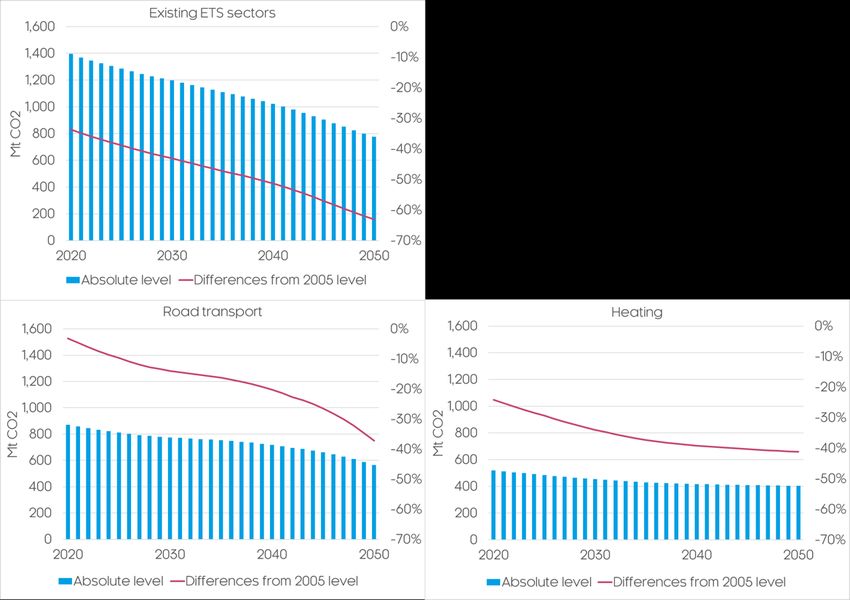
In the baseline (see Figure 3.1), emissions in existing ETS sectors are
calibrated to the 2016 PRIMES Reference emissions reduction targets (a 43%
reduction from 2005 levels by 2030 and a 63% reduction by 2050). This is
equivalent to total CO2 emissions of just under 800Mt across current EU
Member States and the UK by 2050.
Emissions from road transport and buildings sectors are also sense-checked
against and calibrated to publicly available projections9. In comparison with
existing ETS sectors, emission reductions in these sectors are assumed to
take place at a much slower pace, representing approximately a 40%
reduction from 2005 levels by 2050. By 2050, the absolute levels of emissions
are projected to be slightly above 550MtCO2 in road transport and 400MtCO2
in buildings.
Figure 3.1: Baseline emissions projections
3.2 Impacts of applying a linked carbon price in the transport &
buildings sectors
In the first scenario modelled, a carbon price equivalent to the baseline ETS
price is applied in the transport and buildings sectors through the FTT models.
This makes technologies with high emission factors, namely those using fossil
fuels, more expensive, therefore creating more incentives for consumers to
switch to low-carbon technologies, reducing emissions in these sectors
further.
9
These include reference case scenario projections by EUCalc and EURIMA.
Cambridge Econometrics 15Decarbonising European transport and heating fuels - Is the EU ETS the right tool?
A carbon price Figure 3.2 shows that at the EU aggregate level, the additional reduction in
has a limited transport compared to the baseline is small, while in the buildings sector it is
effect on expected to have a more substantial response, but still below the emissions
decarbonisation reductions delivered by this price in the existing ETS sectors.
in both road Figure 3.2: Transport and buildings emissions in the linked carbon price scenario
transport and
buildings
Both transport Nevertheless, in terms of emission reductions, both sectors are projected to
and buildings lag lag behind existing ETS sectors, achieving just over 40% and 50% reductions
behind existing from 2005 levels by 2050, respectively.
ETS sectors
Because these sectors are assumed to remain outside of the ETS in this
scenario, the implication is that there is no impact on the ETS price, which
means relatively little impact on emissions from existing ETS sectors.
3.3 Impacts of a single extended ETS including transport &
buildings
This scenario assumes transport and buildings are included in an extended
ETS which also has a higher permit price. The ETS prices are designed to
deliver emissions reductions consistent with the 2016 PRIMES Reference
reductions for existing ETS sectors (so the more ambitious the target, the
higher the ETS price).
A higher ETS According to Figure 3.3, road transport emissions are projected to decline
price results in more rapidly after 2040 and additional reductions in buildings emissions are
larger emission projected to be slow and steady, reflecting the long operational life of heating
reductions in all installations and the low rate of renovations.
ETS sectors but
In other ETS sectors (which include power generation and energy-intensive
the trajectories
manufacturing industries), emission reductions are expected to take place at a
vary by sector
faster rate than in the baseline. However, additional reductions plateau around
2040 and start moving back towards the baseline due to increased demand for
Cambridge Econometrics 16Decarbonising European transport and heating fuels - Is the EU ETS the right tool? electricity in the long term as emissions by final energy users (particularly transport) continue to fall. Figure 3.3: Emissions in transport, buildings and existing ETS sectors in the extended ETS scenario 3.4 The change from different revenue recycling options As outlined in section 2.2, three revenue recycling options were modelled to demonstrate potential macroeconomic impacts in each scenario. All options modelled involve making reductions to direct and indirect taxes, which translate into lower prices and more disposable income for consumers. In principle, this leads to an increase in total demand, which means lower abatement efforts given the same technology choices. Nevertheless, the impact of these rebound effects is estimated to be small (see section 2.2). Cambridge Econometrics 17
Decarbonising European transport and heating fuels - Is the EU ETS the right tool?

Meanwhile, a lower ETS price is required to achieve the same emissions
reduction when some of the revenues are used to invest in energy efficiency
and low-carbon technologies, as in the low-carbon investment variant (see
Figure 3.4). In particular, the price would be consistently lower in the linked
carbon price scenario and increase less sharply in the short and medium term
in the extended ETS scenario.
Figure 3.4: ETS prices under different revenue recycling options

This occurs through two mechanisms. On the one hand, reinvesting a
proportion of the ETS revenues into efficiency improvements reduces overall
demand for energy, meaning that less energy is needed to be sourced from
fossil fuels and reducing emissions. On the other hand, subsidies for
renewables provide added fiscal incentives for investors to take up those
options, increasing the share of low-carbon technologies in electricity
generation and pushing out fossil fuel generation more rapidly. Given the
same ETS price, both of these channels lead to larger emissions reductions in
all sectors (including road transport and buildings) than in the tax cut variants.

Cambridge Econometrics                                                                             18
Decarbonising European transport and heating fuels - Is the EU ETS the right tool?

                     4       Socioeconomic impacts

                     Rather than assessing the impacts of different decarbonisation policies, the
                     modelling is intended to quantify the macroeconomic impacts of the two
                     scenarios in comparison with the baseline where no additional policy is
                     implemented in the future, through changes in assumptions for sectoral
                     coverage and permit prices.
                     The implication therefore is that some of the impacts that are outlined below
                     arise as a result of more decarbonisation, rather than specifically because of
                     the policy route chosen (i.e. via a linked carbon price/ETS). We do not
                     evaluate the potential economic impacts of alternative methods of achieving
                     the same emissions reductions through other policy pathways; such analysis
                     is beyond the scope of this work.

                     4.1     The impacts on GDP
                     It is assumed that revenues collected from the linked carbon price or ETS are
                     re-used by government. As a result of this, for Europe as a whole, the impacts
                     on total GDP relative to a ‘do nothing’ baseline are expected to be positive in
                     both scenarios.
GDP impacts are      The GDP impacts reflect the trends for the ETS price assumptions, as higher
strongly linked to   allowance prices lead to more revenues being recycled than in the absence of
   the ETS prices    such policy(see Figure 4.1). Particularly, the relative impact of the extended
                     ETS scenario is expected to be more positive for most of the forecast period
                     but becomes more similar to that for the linked carbon price scenario in the
                     long term as the ETS price assumptions converge.
                      Figure 4.1: EU+UK total GDP impacts

                     Cambridge Econometrics                                                                             19
Decarbonising European transport and heating fuels - Is the EU ETS the right tool?
Sector-level These trends are also observed at the sector level, although there is some
impacts vary variation between sectors (see Figure 4.2):
• Power generation output as measured by either gross output or gross
value added (GVA) is expected to be higher than in the baseline as a
result of increased electrification (and therefore higher demand in new
generation capacity).
• Impacts on sectors that supply and demand heating services (which make
up the majority of the economy and consist of most service sectors) are
small, reflecting offsetting impacts of reduced consumption (in response to
the linked carbon price or the ETS price) and higher investment (as part of
decarbonising the technology mix).
• Impacts on road transport gross output are also small, as with buildings.
However, GVA impacts are slightly negative, suggesting that the sector is
likely to maintain its level of economic activity in response to the higher
costs, albeit with a squeeze on profits and wages.
• Other ETS sectors (which consist of energy-intensive manufacturing
industries) are expected to suffer poor outcomes due to higher costs.
Figure 4.2: EU+UK GVA impacts by sector
Different uses of As a sensitivity, two other options for revenue recycling are modelled (see
recycled Figure 4.3).
revenues alter
In the Low-carbon investment variant, recycling some revenues to this channel
macroeconomic
is expected to lead to a higher share of renewables in generation, lower
outcomes
demand for energy (due to improved energy efficiency) and a lower ETS price
(because abatement costs are reduced). On the other hand, the Debt
Cambridge Econometrics 20Decarbonising European transport and heating fuels - Is the EU ETS the right tool? paydown variant is expected to generate less positive GDP impacts without material influence on the ETS price. This means that for a similar level of emission reductions, the Reference case and the Low-carbon investment variant have similar outcomes while the variant with some debt paydown has slightly lower economic impacts because money is taken out of the economy. Figure 4.3: Impacts of different revenue recycling options on EU+UK GDP Cambridge Econometrics 21
Decarbonising European transport and heating fuels - Is the EU ETS the right tool?

                       4.2     The impacts on employment
                       At the EU aggregate level, total employment impacts mirror GDP impacts in
                       both scenarios (see Figure 4.4). The relative differences from baseline for
                       employment are slightly smaller overall, due to positive wage adjustments in
                       response to higher output.
                        Figure 4.4: EU+UK total employment impacts

      Employment       The EU-wide sector level impacts also follow the trajectories of the impacts on
   impacts are in      gross output, with power generation benefiting the most and other ETS
    line with GDP      sectors seeing lower employment, while impacts on transport and buildings
      impacts, but     are negligible (Figure 4.5).
          relatively
                       In the Extended ETS scenario, the employment impact for power generation is
       stronger for
                       particularly strong and larger than the impact for this sector’s output (on both
power generation
                       gross output and GVA measures). This may seem counter-intuitive but can be
                       explained by changes in the generation mix in response to high demand for
                       electricity and a high ETS price in this scenario. As renewables are more
                       labour-intensive than their fossil fuel counterparts, there is a strong increase in
                       demand for labour associated with their take-up over time.

                       Cambridge Econometrics                                                                             22
Decarbonising European transport and heating fuels - Is the EU ETS the right tool? Figure 4.5: EU+UK employment impacts by sector 4.3 Distributional effects The impacts on expenditure occur through two mechanisms; first, the introduction of the carbon charge (whether through a linked carbon price or ETS allowance) increases the costs of household heating or vehicle refuelling. Then, there is a demand response to the higher price. As a result, the final impact is a balance of change in cost and demand response. In this analysis, we consider what is likely to be the worst-hit type of consumer; those in the lower income deciles, who have tight constraints on their expenditure, and therefore are less likely than a typical consumer to have the financial capital to purchase a low-carbon technology; or are more likely to be in rented accommodation, and therefore not able to explicitly choose low- carbon technologies (which are typically more expensive up-front purchases). We use data on changes in fuel costs from E3ME and apply short-term price elasticities drawn from the literature to measure the impact on the typical household that does not have access to low-carbon technologies in 2030, as outlined in section 2.4. The reason for choosing 2030 for this analysis is that in this year, according to our modelling, most consumers will still hold high- Cambridge Econometrics 23
Decarbonising European transport and heating fuels - Is the EU ETS the right tool?

          carbon technologies, either because their existing technology has not reached
          end-of-life, or because when it did they chose to re-invest in a high-carbon
          technology (for cost or other reasons). By later on (e.g. 2050), costs of low-
          carbon technologies have fallen, and even low-income households are likely
          to have replaced their technologies at least once and had the option (where
          they are the ultimate decision maker) to take-up a low-carbon technology.
Heating   Looking first to impacts on household expenditure on heating; in the linked
          carbon price scenario, the price of gas for household heating increases in
          2030 by 6%; without a demand response, this would be the increase in
          household bills. However, assuming a price elasticity of 0.2110, demand
          reduces such that the total increase in household heating expenditure across
          the low-income deciles is reduced to less than 5% (see Figure 4.6).
               Figure 4.6 Decomposition of impacts on low-income households heating
               expenditure

          In the extended ETS scenario, where the ETS allowance price is substantially
          higher in 2030, the impacts are much more pronounced. Household natural
          gas prices are 30% higher in 2030; and while the demand response reduces
          expenditure by just over 8%, the net impact is an increase on expenditure on
          heating of around 22%.
          In both cases above, we have taken the price elasticity from single adult
          households with no dependents. Other household types have higher price
          elasticities; for example, in the same study, the price elasticity of households
          with two adults and two dependents (the highest report for this income
          quartile) was -0.32. Under such an assumption, the net change in expenditure
          in 2030 is 4% higher in the linked carbon price scenario, and almost 18%
          higher in the extended ETS scenario.
          Similarly, higher-income households also have higher price elasticities; in the
          case of heating, the highest price elasticity from the study used was -0.92, for

          10
               Drawn from Schulte, I. and Heindl, P. (2016) Price and Income Elasticities of Residential Energy Demand
          in Germany. ZEW Discussion Paper No. 16-052.

          Cambridge Econometrics                                                                                   24
Decarbonising European transport and heating fuels - Is the EU ETS the right tool?
households in the highest income quartile with two adults and three children in
the household. This implies that for every 1% increase in price, there is a
0.92% decrease in consumption of heating.
In all cases, this is explained through the proportion of use which is ‘essential’.
Ultimately there are minimal uses of heating which a typical household will
require (e.g. during the coldest nights), and the price elasticity of consumers at
this point is very high (i.e. there would have to be a very substantial price
increase for them to forego this heating use, since the welfare impacts are
likely to be substantial). Across different household income levels and type,
the proportion of discretionary usage above this minimum differs, and
therefore their overall sensitivity to price increases.
Road transport In our analysis of the road transport sector we take an income elasticity of -
0.30 for the lowest income quartile11. As outlined above for heating, there are
greater changes in demand across different household make-ups (e.g.
demand is most price-sensitive across all income quartiles for households with
two adults and no children) and income levels (e.g. the price elasticity of the
highest-income households, for single adult households, is -0.7). This leads to
greater changes in demand in the higher quartiles, primarily because the trips
being taken by the lowest-income households will already be limited (i.e. a
higher proportion of their trips will be for ‘essential’ purposes, such as
commuting, and discretionary use will be lower).
In the lowest income quartile, the addition of carbon pricing to fossil fuels
increases the costs of refuelling by an average of 3% in the linked carbon
price scenario, and almost 16% in the extended ETS scenario; however the
reduction in demand results in an increase in expenditure on transport fuels of
2% and just more than 10% in the linked carbon price and extended ETS
scenarios respectively (see Figure 4.7.)
Figure 4.7 Decomposition of impacts on low-income households road
transport expenditure
11
From Schulte, I. and Heindl, P. (2016) Price and Income Elasticities of Residential Energy Demand in
Germany. ZEW Discussion Paper No. 16-052.
Cambridge Econometrics 25Decarbonising European transport and heating fuels - Is the EU ETS the right tool? In all cases, the key messages are the same; any consumer that is locked-in to a high-carbon technology (whether for reasons of technology lock-in, living in rented accommodation, or financial limitations) is facing higher bills for household heating and transport (in particular the latter), and for lower levels of consumption (i.e. they are paying more for less). This has substantial impacts on consumer welfare for this segment of the population, and points to the need for supporting policy to help these consumers manage higher costs (in the short term) and transition to new technologies (in the long term). Cambridge Econometrics 26
Decarbonising European transport and heating fuels - Is the EU ETS the right tool?

             5       Conclusions

             The European Commission is interested in potentially extending the EU ETS
             with the aim of accelerating the reduction in emissions realised in the road
             transport and buildings sector. In this report, we have assessed the impacts of
             two potential designs for an extended ETS, and examined the impact on
             emissions from the transport, buildings and current ETS sectors, as well as
             the socioeconomic and distributional effects of the policy.
Impacts on   In our baseline analysis, neither the road transport nor buildings sectors are
 emissions   on track to meet the EU ETS emissions reduction target of emissions 43%
             below 2005 levels in 2030. According to our baseline projections, in road
             transport, emissions are expected to be around 14% below 2005 levels in
             2030; the equivalent figure for heating is 34%. In 2050 these sectors are
             expected to achieve emissions 37% (road transport) and 41% (heating) below
             2005 levels. Our analysis has shown that a carbon price mirroring the ETS
             allowance price in these sectors does not substantially shift this trajectory;
             there is no impact in road transport in 2030, and by 2050 it increases the
             emissions reduction realised to only 41% below 2005 levels (see Figure 5.1).
             In the heating sector, emissions reductions in 2030 hit 36% below 2005 levels,
             still short of the target, and reach 51% by 2050 (see Figure 5.2).

               Figure 5.1 Emissions from road transport

             Introducing an extended ETS, which includes road transport and buildings
             alongside existing ETS sectors, leads to some further emission reductions,
             although neither sector achieves the 43% reduction target for 2030, placing
             greater weight on the existing ETS sectors. Because there is a hard cap on
             emissions, and road transport and buildings do not deliver their share of
             emissions reductions, greater reductions are achieved in other sectors. In
             2030, the existing ETS sectors reduce emissions by 55% compared to 2005
             levels, ensuring that the combined ETS achieves the 43% target. A similar
             trend is observed in 2050, where an unambitious target of 63% reductions in
             ETS emissions compared to 2005 levels is only achieved through a 73%

             Cambridge Econometrics                                                                             27
Decarbonising European transport and heating fuels - Is the EU ETS the right tool?
reduction in emissions from existing ETS sectors, to make up the shortfall in
the transport and buildings sectors.
Figure 5.2 Emissions from heating
Socioeconomic Achieving the emissions reductions required of an extended ETS (i.e.
impacts emissions 43% below 2005 levels in 2030, and 63% below in 2050, in our
scenarios) requires a substantially higher ETS allowance price than is the
case in the existing ETS sectors (see Figure 5.3). This has implications both
for the generation of revenues, but also upon the competitiveness of the
existing ETS sectors.
Figure 5.3 ETS allowance prices used in the analysis
The overall economic impacts of the imposition of an explicit carbon price in
the road transport and buildings sectors are positive; GDP is 0.4% higher in
2030, decreasing to below 0.2% by 2050. These economic impacts are largely
driven by the additional government revenues collected through the policy
measures, and reflect potential benefits of (mildly) accelerated
Cambridge Econometrics 28Decarbonising European transport and heating fuels - Is the EU ETS the right tool?
decarbonisation of the road transport and buildings sectors; without comparing
them to alternative policy measures, it is not possible to say whether such a
policy is economically the best, or the worst, way to achieve such a
decarbonisation.
What is notable in the analysis, however, is the impact that such a policy has
on the existing ETS sector. When an extended ETS is modelled, the higher
ETS price leads to lower output and employment in existing ETS sectors.
Gross value added in these sectors is around 0.5% lower consistently
between 2030 and 2050 due to the loss of competitiveness from the
imposition of this higher carbon price.
At the same time, an extended ETS which includes consumers directly is likely
to lead to potentially uneven distributional effects. The lowest-income
households are likely to be financially constrained, and therefore find it difficult
to adopt low-carbon technologies until prices of these technologies have fallen
further (and/or, in the case of cars, a competitive second-hand market for
them has emerged). Furthermore, households living in rental property do not
have autonomy over the adoption of low-carbon technologies, they are
dependent on decisions of the owner of the property. Those households that
are stuck with existing high-carbon technologies are likely to face substantially
higher household bills; the cost of fossil fuel heating, for those unable to switch
to low carbon alternatives, are expected to be 22% higher in 2030 – but facing
prices which are 30% higher, some of the effect is only mitigated by a
reduction in demand, which in the case of low income households could lead
to under-heating and therefore a substantial loss of welfare. Similarly, while
the cost of refuelling an ICE is expected to be 16% higher in 2030 as a result
of transport fuels featuring in an extended ETS, bills will increase by 10% for
the lowest income deciles; but this more limited increase is only achieved
through a reduction in the use of cars for private transportation. As such,
consumers across the income distribution end up paying more for less, where
they remain reliant upon high-carbon technologies.
In summary An extended ETS would not, by itself, deliver the substantive reductions in
emissions required of road transport and buildings. Our analysis suggests that
there is no scope for relaxing existing policies, if the ETS were widened.
Indeed, the extended ETS would require substantive additional support to
deliver the required savings. Such policy must consider sector-specific
challenges, such as the slow rate of fleet renewal, and the challenge that this
causes to low-income consumers.
Given the minor improvements in emissions an extended ETS causes in road
transport and buildings, such a policy would force additional decarbonisation
onto existing ETS sectors and damage their competitiveness.
However, the ETS has a major role to play in other sectors. In particular, it
continues to drive decarbonisation of the electricity sector. Achieving a low-
carbon electricity sector is the only way to decarbonise (through electrification)
transport and buildings, so the ETS should continue to play a role where it can
deliver in a cost-effective way such outcomes.
Cambridge Econometrics 29Decarbonising European transport and heating fuels - Is the EU ETS the right tool?
Appendices
Cambridge Econometrics 30Decarbonising European transport and heating fuels - Is the EU ETS the right tool? Appendix A References European Commission. 2018. “A Clean Planet for all: A European strategic long-term vision for a prosperous, modern, competitive and climate neutral economy.” Accessed March 4, 2019. https://ec.europa.eu/clima/sites/clima/files/docs/pages/com_2018_733_en.pdf. IEA. 2019. “World Energy Outlook.” Jossen, Q, B Martin, J Meessen, J Pestiaux, E Taylor, and P Vermeulen. 2018. The key role of energy renovation in the net-zero GHG emission challenge. EURIMA. Nilsen, O B, F Asche, and R Tveteras. 2005. Natural gas demand in the European household sector. Bergen: Institute for Research in Economics and Business Administration. Research, Potsdam Institute for Climate Impact. 2020. EUCalc. Accessed May 1, 2020. http://tool.european-calculator.eu/intro. Schulte, I, and P Heindl. 2016. “Price and Income Elasticities of Residential Energy Demand in Germany.” ZEW Discussion Paper No. 16-052. (ZEW Discussion Paper No. 16-052.). Cambridge Econometrics 31
Decarbonising European transport and heating fuels - Is the EU ETS the right tool?

                   Appendix B E3ME model description

       Overview    E3ME is a computer-based model of the world’s economic and energy
                   systems and the environment. It was originally developed through the
                   European Commission’s research framework programmes and is now widely
                   used in Europe and beyond for policy assessment, for forecasting and for
                   research purposes. The latest version of E3ME provides:
                   • global geographical coverage
                   • feedbacks between individual European countries and other world
                     economies
                   • treatment of international trade with bilateral trade between regions
                   • new technology diffusion sub-modules
                   The full model manual is available online from www.e3me.com.
 Applications of   Although E3ME can be used for forecasting, the model is more commonly
          E3ME     used for evaluating the impacts of an input shock through a scenario-based
                   analysis. The shock may be either a change in policy, a change in economic
                   assumptions or another change to a model variable. The scenarios represent
                   alternative versions of the future based on a different set of inputs. By
                   comparing the outcomes to the baseline (usually in percentage terms), the
                   effects of the change in inputs can be determined.
                   Model-based scenario analyses often focus on changes in price because this
                   is easy to quantify and represent in the model structure. Examples include:
                   • changes in tax rates including direct, indirect, border, energy and
                     environment taxes
                   • changes in international energy prices

                   All of the price changes above can be represented in E3ME’s framework
                   reasonably well, given the level of disaggregation available. E3ME could then
                   be used to determine:
                   • secondary effects, for example on consumers of fuels
                   • rebound effects
                   • overall macroeconomic impacts
Comparison with    E3ME is often compared to Computable General Equilibrium (CGE) models.
CGE models and     In many ways the modelling approaches are similar; they are used to answer
   econometric     similar questions and use similar inputs and outputs. However, underlying this
   specification   there are important theoretical differences between the modelling approaches.
                   In a typical CGE framework, optimal behaviour is assumed, output is
                   determined by supply-side constraints and prices adjust fully so that all the
                   available capacity is used. In E3ME the determination of output comes from a
                   post-Keynesian framework and it is possible to have spare capacity. The
                   model is more demand-driven and it is not assumed that prices always adjust
                   to market clearing levels.
                   The differences have important practical implications, as they mean that in
                   E3ME regulation and other policy may lead to increases in output if they are
                   able to draw upon spare economic capacity. This is described in more detail in
                   the model manual.

                   Cambridge Econometrics                                                                             32
You can also read