On the impact of excess diesel NO X emissions upon NO 2 pollution in a compact city - IOPscience
←
→
Page content transcription
If your browser does not render page correctly, please read the page content below
LETTER • OPEN ACCESS

On the impact of excess diesel NOX emissions upon NO2 pollution in a
compact city
To cite this article: Jaime Benavides et al 2021 Environ. Res. Lett. 16 024024

View the article online for updates and enhancements.

                               This content was downloaded from IP address 46.4.80.155 on 27/04/2021 at 04:58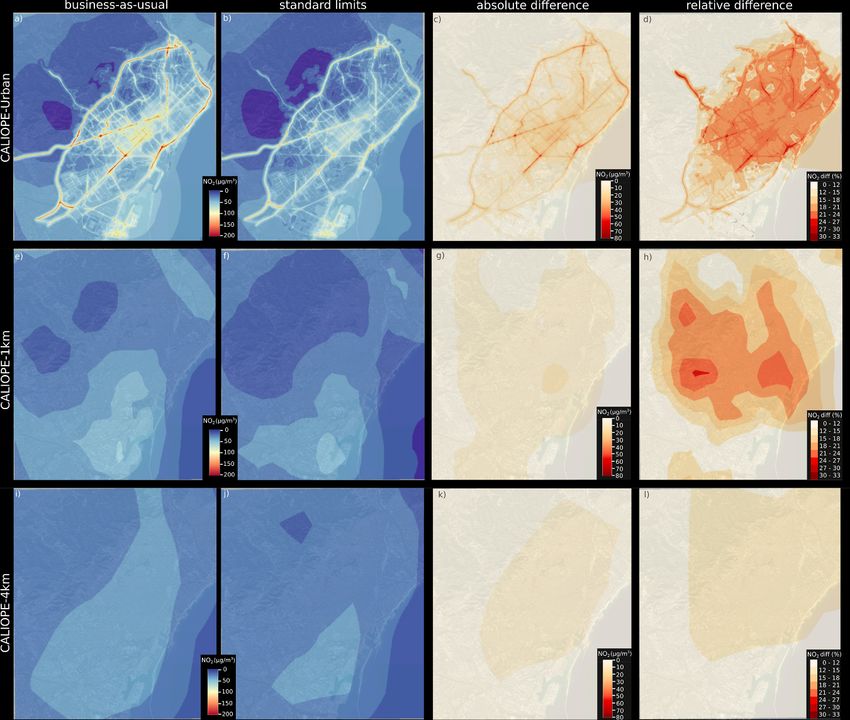
Environ. Res. Lett. 16 (2021) 024024 https://doi.org/10.1088/1748-9326/abd5dd
LETTER
On the impact of excess diesel NOX emissions upon NO2 pollution
OPEN ACCESS
in a compact city
RECEIVED
27 August 2020 Jaime Benavides1, Marc Guevara1, Michelle G Snyder2, Daniel Rodríguez-Rey1, Albert Soret1,
REVISED Carlos Pérez García-Pando1,3 and Oriol Jorba1
26 November 2020
1
Barcelona Supercomputing Center, Barcelona, Spain
ACCEPTED FOR PUBLICATION 2
22 December 2020 Elon University, Department of Physics and Engineering, Elon, NC, United States of America
3
ICREA, Catalan Institution for Research and Advanced Studies, Barcelona, Spain
PUBLISHED
27 January 2021 E-mail: jaime.benavides@bsc.es
Keywords: air quality, model resolution, light duty vehicles, excess diesel NOX emissions, NO2 concentrations, NO2 exposure
Original Content from
this work may be used Supplementary material for this article is available online
under the terms of the
Creative Commons
Attribution 4.0 licence.
Any further distribution Abstract
of this work must
maintain attribution to NOX emissions from diesel light-duty-vehicles (LDV) largely exceed the Euro emission standards
the author(s) and the title
of the work, journal
in real-world driving conditions. Recent studies have quantified their impact upon air quality and
citation and DOI. human health primarily based on air quality models at mesoscale and large-scale resolutions. Here,
we show that these approaches can significantly underestimate the impact of diesel LDV excess
NOX emissions upon NO2 pollution in cities, particularly in the more compact and heavily
trafficked ones. We compare an air quality mesoscale model at both 4 and 1 km resolution with a
street-scale model in Barcelona, a compact city where the EU annual NO2 limits are repeatedly
exceeded and a large share of passenger cars are diesel (65%). We compare consistently two
emissions scenarios: a business-as-usual scenario where diesel LDV emit NOX in excess, and a
counterfactual standard limits scenario where emissions are compliant with the Euro emission
standards. We first show that in contrast to the mesoscale model, the street scale model is able to
largely represent the observed NO2 concentration gradients between traffic and background
stations in the city. In a second step, we find that the mesoscale model strongly underestimates the
impact of diesel LDV excess NOX emissions upon NO2 pollution both in absolute terms (by
38%–48%) and relative terms (by 10%–35%). We argue that such underestimated impacts should
be considered when assessing NOX excess emissions by LDV in cities. Using the street scale model,
we find that diesel LDV excess NOX emissions are associated with about 20% of NO2 levels in the
city, contributing substantially to an increased number of citizens exposed to high NO2 pollution
in Barcelona.
1. Introduction emissions above the Euro emission standards as excess
diesel NOX emissions.
In 2017, 16 European Union (EU) countries reported Assessments of excess NOX emissions impacts on
NO2 exceedances of the annual limit value enforced air quality and health have relied on air quality mod-
by the European Air Quality Directive (40 µg m−3 ), els at mesoscale or large-scale resolutions and have
with 86% of them occurring at urban traffic mon- mostly focused on PM2.5 and O3 . For instance, Barrett
itoring stations (EEA 2019). Exceedances are mostly et al (2015) tackled specifically the impact of Volk-
due to emissions from vehicles, especially diesel swagen diesel LDV equipped with emission defeat
light-duty-vehicles (LDV) (Ntziachristos et al 2016, devices (Thompson et al 2014). Based on estimated
Degraeuwe et al 2017) which represent about 40% of PM2.5 increases calculated with a chemistry-transport
the European fleet, and whose emissions fail to meet model at 50 km resolution, this study attributed to the
the Euro emission standards under real-world driving so-called ‘dieselgate’ scandal ∼59 premature deaths
conditions (Weiss et al 2011, Thompson et al 2014, in the US. Anenberg et al (2017) attributed as much
Lewis et al 2015). Hereafter we will refer to diesel as ∼38 000 premature deaths to excess diesel NOX
© 2021 The Author(s). Published by IOP Publishing Ltd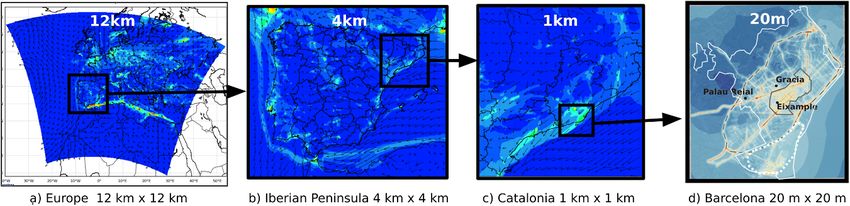
Environ. Res. Lett. 16 (2021) 024024                                                                                    J Benavides et al

   Figure 1. CALIOPE domains for EU, IP, and CAT (a–c), and the CALIOPE-Urban domain over Barcelona city (d). The panels
   depict NO2 concentration at surface level. The black dots in (d) represent the location of the monitoring stations used in this
   work. The lines in (d) depict areas mentioned in this study: solid-white is Barcelona municipality, dashed-white is harbour,
   dashed-grey are ring roads and solid-grey is Eixample district in the city center.

emissions worldwide via increases in PM2.5 and O3                     here a robust quantification of the impact of excess
based on a model at 2◦ by 2.5◦ downscaled to 0.1◦                     diesel NOX emissions upon NO2 levels in a com-
by 0.1◦ resolution. Von Schneidemesser et al (2017)                   pact city. To the best of our knowledge, this study
estimated the impact of excess emissions upon NO2                     presents the first such assessment using a street-
concentrations at 16 measurement sites in Berlin                      scale air quality model. We focused on Barcelona city
based on a model at 1 km resolution and observa-                      (Spain) (figure 1(d)), a densely populated and traf-
tions, and found that NOX traffic emissions would                     ficked urban area (about 5500 vehicles km−2 ) where
be reduced by 30%–55% if diesel LDV would com-                        the annual NO2 limit value set up by the European
ply with the regulatory standards. Using a chemical                   Air Quality Directive (40 µg m−3 ) has been exceeded
transport model at 0.1◦ by 0.1◦ , Jonson et al (2017)                 uninterruptedly since year 2000, the majority of pas-
estimated ∼5000 premature deaths from PM2.5 and                       senger cars are diesel (65%) (Barcelona City Coun-
O3 in the adult population due to excess diesel NOX                   cil 2017a) and road transport is the main contrib-
emissions in EU28, Norway and Switzerland in 2013.                    utor to the chronic NO2 exceedances. According to
Chossière et al (2018) showed that a large fraction of               the local Public Health Agency about 70% of its 1.6
the health impacts from changes in PM2.5 and O3 in                    million citizens were exposed to NO2 concentration
Europe are trans-boundary.                                            levels above the annual air quality limit value in
     We identify two gaps in previous studies. First,                 2017. These NO2 exposure levels were associated with
they omit the effect of NO2 upon health. It has                       about 929 premature deaths in Barcelona city in 2017
been argued that the relationship between NO2 and                     (ASPB 2018).
health is not as well-established as for PM2.5 (Jonson                     Our underlying hypothesis is that prior modeling
et al 2017). Although the role of NO2 as a surrog-                    studies at mesoscale and large-scale resolutions have
ate of other measured or unmeasured pollutants can-                   substantially underestimated the impact upon NO2
not be completely ruled out, a variety of studies are                 in cities, particularly in the more compact and heav-
consistent with long- (e.g. Faustini et al 2013, Sun-                 ily trafficked ones. We compare modeled NO2 con-
yer et al 2015, Atkinson et al 2018, Achakulwisut                     centrations calculated consistently at 4 km, 1 km and
et al 2019) and short-term (Samoli et al 2006, Chi-                   street-level resolutions using an air quality multiscale
usolo et al 2011) NO2 effects upon health. Given                      modeling system fed by a state-of-the-art bottom-up
that NO2 is prominent in populated cities, omitting                   emission model for two scenarios: business-as-usual
its effect may substantially bias the estimated health                (BAU) and standard limits (SL) diesel LDV NOX emis-
impact of excess NOX emissions. Second, health effect                 sions. The BAU scenario represents real-world driving
assessments can be strongly affected by the meth-                     conditions and the SL scenario represents diesel LDV
ods for evaluating exposures; in this sense air quality               emissions complying with Euro emission standards.
model-based assessments using models at mesoscale
or large-scale resolutions tend to underestimate pol-                 2. Methods
lutant levels and the associated health impacts (Li et al
2016, Korhonen et al 2019) as they do not cap-                        2.1. Domain and period of study
ture intra-urban and near-roadway exposure gradi-                     Barcelona city covers an area of 101 km2 (figure 1(d)).
ents (Greco et al 2007, Karner et al 2010, Borge                      The simulation period for the case study is from the
et al 2014). This is particularly important in com-                   9th to the 25th of November 2017. This period is
pact cities for NO2 and other species within the PM2.5                selected because it is representative of late autumn air
fraction.                                                             quality levels in Barcelona, including both an episode
     Our study focuses on the second gap. Meso-                       of high NO2 concentrations and days that are repres-
scale air quality models cannot represent NO2 gradi-                  entative of the observed annual mean daily cycle in the
ents and underestimate NO2 levels in compact cit-                     city. During this period the NO2 hourly limit set up
ies (Borge et al 2014, Duyzer et al 2015). We provide                 by the European Air Quality Directive (200 µg m−3 )

                                                       2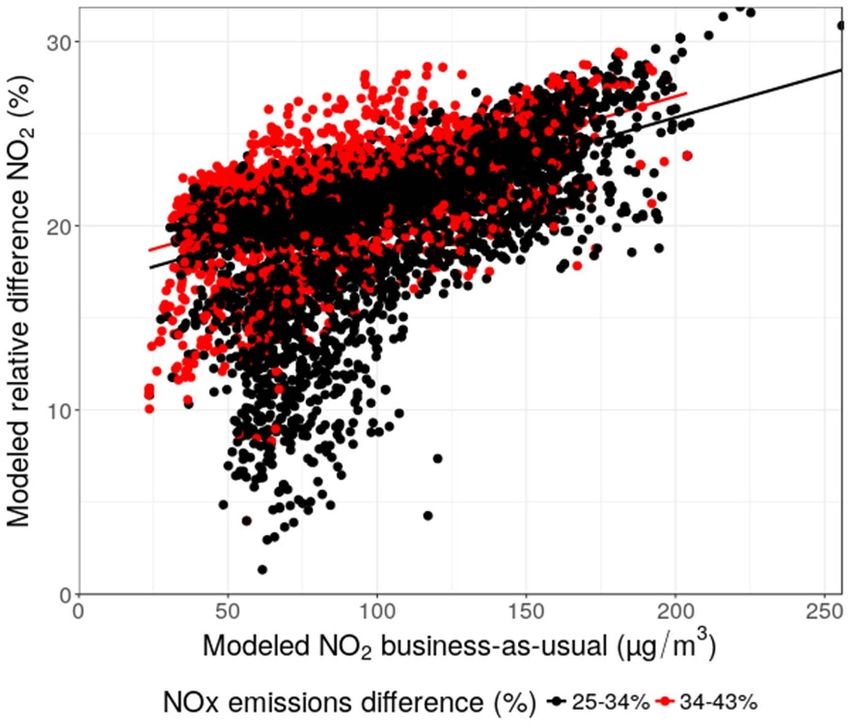
Environ. Res. Lett. 16 (2021) 024024                                                               J Benavides et al

was exceeded two times at the Gràcia-Sant Gervasi        surrounding the city (figure 1(d)). This domain is
(i.e. Gràcia) traffic monitoring station in Barcelona.   covered by a regular receptor grid of 20 m resolution.
The high concentration levels recorded were due to a
strong temperature inversion causing stagnant air.        2.2.1. Road traffic emissions
                                                          Road traffic emissions were estimated using the
2.2. Multiscale air quality modeling: from                bottom-up traffic emission module from HERMESv3
mesoscale to street-level                                 (Guevara et al 2020) for the IP-4 km and CAT-
We used the CALIOPE-Urban street-scale model-             1 km mesoscale domains as well as for the BCN-
ing system which consists of the CALIOPE air qual-        20 m urban domain. This allows to maintain consist-
ity mesoscale modeling system (Baldasano et al            ency between the different scales and therefore obtain
2011) coupled with the near road dispersion model         comparable results. Estimated hourly road link-level
R-LINE (Snyder et al 2013) adapted to street canyons      vehicle emissions were conservatively mapped onto
(Benavides et al 2019). CALIOPE consists of the           the gridded mesoscale domains (IP-4 km and CAT-
Weather Research and Forecasting model version 3          1 km) and adapted to the requirements of BCN-20 m.
(WRF; Skamarock and Klemp 2008), combined with            HERMESv3 estimates hot and cold exhaust road
the HERMESv3 multi-scale atmospheric emission             transport emissions combining the tier 3 method
modeling framework (Guevara et al 2019, Guevara           described in the 2016 EMEP/EEA air pollutant emis-
et al 2020), the Community Multiscale Air Qual-           sion inventory guidebook (EMEP/EEA 2016), which
ity Modeling System version 5.0.2 (CMAQ; Byun             is fully incorporated in the COPERT 5 software, with
and Schere 2006) and the mineral Dust REgional            a digitised traffic network. This traffic network con-
Atmospheric Model (BSC-DREAM8b; Basart et al              tains specific information by road link for daily aver-
2012). CALIOPE was run over a domain cover-               age traffic, mean speed circulation, temporal pro-
ing Europe at a 12 km by 12 km horizontal resol-          files and vehicle fleet composition profiles. For the
ution (figure 1(a)), Iberian Peninsula at 4 km by         city of Barcelona, this information was obtained from
4 km (figure 1(b)), hereafter referred to as IP-4 km,     multiple sources, including the local automatic traffic
and the Catalonian domain, including Barcelona, at        counting network (Barcelona City Council, personal
1 km by 1 km, hereafter referred to as CAT-1 km           communication), fleet composition from a remote
(figure 1(c)). CALIOPE results have been evaluated in     sensing device campaign in 2017 (Barcelona City
detail elsewhere (e.g. Pay et al 2014). For the meso-     Council 2017a) and TomTom historical average speed
scale model, simulations were initialised with the        profiles (TomTom 2019) based on GPS data gathered
ECMWF reanalyses (ERA-Interim), boundary con-             from circulating vehicles between 2015 and 2016.
ditions for chemistry come from the CAMS reana-           In HERMESv3, we further extended the degrada-
lysis of atmospheric composition (Inness et al 2019)      tion factors for diesel vehicles taking into account
and pollutant emissions are obtained from HER-            mileage reported by COPERT 5 for gasoline vehicles.
MESv3. For the European parent domain (EU-12 km)          For EURO 2 and EURO 3, this extension considers a
HERMESv3 was run using the TNO-MACIII invent-             deterioration of tailpipe NOX emissions of 22% and
ory (Kuenen et al 2014) for European countries and        10% respectively, as suggested by Chen and Borken-
the HTAPv2.2 inventory (Janssens-Maenhout et al           kleefeld (2016). HERMESv3 disaggregates the calcu-
2015) for countries outside Europe. For the nes-          lated NOX emissions into NO and NO2 using vehicle-
ted mesoscale domains covering the Iberian Penin-         dependent speciation factors that are extracted from
sula (IP-4 km) and Catalonia (CAT-1 km) the same          EMEP/EEA (2016) (chap. 1.A.3.b.i–iv, table 3.87) and
approach was applied except for Spain, where high         the investigations of Rappenglueck et al (2013) and
resolution detailed emissions were estimated using        Carslaw et al (2016). HERMESv3 also estimates the
the bottom-up module of HERMESv3 (Guevara et al           emissions released from other anthropogenic sources,
2020). The coupling with R-LINE estimates local           which are considered in the mesoscale model and
traffic dispersion driven by channeled street winds       their contributions are taken into account in the
and vertical mixing with background air taking into       street-scale model as background concentrations.
account atmospheric stability and street morpho-
logy (e.g. aspect ratio). R-LINE applies the Generic      2.3. Emission scenarios
Reaction Set (GRS) to resolve simple NO to NO2            We defined two scenarios to quantify the effect
chemistry (Valencia et al 2018). Further informa-         of excess diesel LDV NOX emissions in Barcelona
tion regarding CALIOPE-Urban’s methodology and            City. The BAU scenario is our best estimate of NOX
its evaluation using NO2 observed concentrations can      emissions under real-world driving conditions for
be found in Benavides et al (2019). To obtain high-       Barcelona city in 2017. It incorporates emissions
resolution concentration maps for the entire Bar-         representing real-world driving conditions, which
celona city, hereafter referred to as BCN-20 m, we set    is supported by (a) the use of COPERT 5 real-
the domain over Barcelona city as the minimum rect-       world adjusted NOX emission factors for EURO
angle where Barcelona municipality is contained and       5 and 6 diesel vehicles, (b) the inclusion of a
extended it by 250 m buffers that include the highways    mileage correction factor for diesel vehicles and (c)

                                             3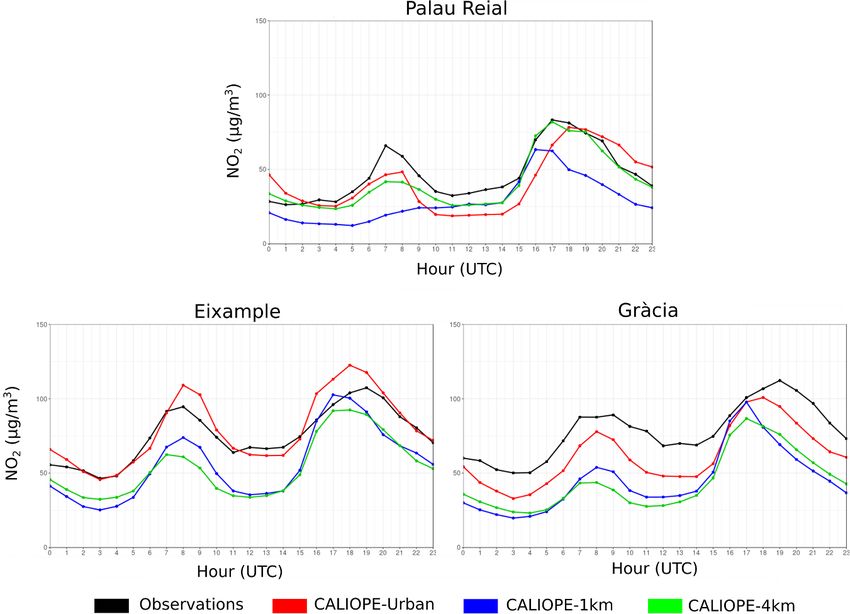
Environ. Res. Lett. 16 (2021) 024024                                                                                  J Benavides et al

   Figure 2. Comparison between diesel passenger cars emission factors (g km−1 ) derived from a RSD campaign performed in
   Barcelona (Barcelona City Council 2017a) and emission factors reported by different versions of the COPERT emission factor
   model. Emission factors are estimated at an average speed of 28 km h−1 . RSD in red, COPERT 5 using degradation factors in
   blue, COPERT 5 in grey and COPERT 4 in white.

Table 1. HERMESv3 vehicle fleet for Barcelona city (%). The urban area represents the region within the surrounding ring roads and the
ring roads represent the highways surrounding the city. Only the vehicle categories with a percentage higher than 1 are shown.

Vehicle type                           Fuel                    Euro category             Urban area (%)             Ring roads (%)

                                                                EURO 2                          2.1                         2.2
                                                                EURO 3                          8.2                         8.5
Passenger cars                          Diesel                  EURO 4                         13.0                        13.2
                                                                EURO 5                         13.7                        14.0
                                                                EURO 6                          9.5                         9.7
                                                                EURO 2                          0.6                         0.7
                                                                EURO 3                          2.7                         2.7
Light commercial vehicles               Diesel                  EURO 4                          4.0                         4.1
                                                                EURO 5                          5.6                         5.7
                                                                EURO 6                          0.8                         0.8
Passenger cars                          Petrol                  All                            19.5                        20.0
Light commercial vehicles               Petrol                  All                             0.3                         0.3
Motorbikes                              Petrol                  All                            11                           6.5
Mopeds                                  Petrol                  All                             2.6                         0
Trucks                                  Diesel                  All                             1                           8
Buses                                   Diesel                  All                             2.4                         1.2
Buses                                   Natural gas             All                             1.0                         0.3
Buses                                   Hybrid                  All                             0.5                         0.3

the good agreement observed between the emission                    ring roads and urban streets within these ring roads,
factors estimated by HERMESv3 and measured dur-                     to account for observed differences in the composi-
ing the Remote Sensing Device (RSD) campaign per-                   tion of the circulating vehicles. In Eixample district,
formed in Barcelona (Barcelona City Council 2017a)                  the percentage of mopeds and motorbikes is increased
(figure 2). As shown in figure 2, the combination                   up to 25% to better represent the observed fleet (Bar-
of COPERT 5 emission factors with the degradation                   celona City Council 2017a) while the ratio among
factors is in close agreement with the RSD-derived                  other vehicle types is kept the same as in the urban
NOX emission factors for the prevalent EURO cat-                    streets. Diesel LDV predominate in both the urban
egories. COPERT-derived emission factors were cal-                  fleet (60.2%) and in the ring roads (61.6%) vehicle
culated considering an average speed of 28 km h−1 ,                 fleet distributions. The main difference is that diesel
the same speed at which RSD measurements were                       trucks are more frequent in the ring roads (8%) than
performed. This speed value is within the range of                  in the inner city (1%), while mopeds are not allowed
the common vehicle’s average speed within the urban                 to circulate in the ring roads (0% versus 2.6%).
area of Barcelona (Barcelona City Council 2017b).                       The counterfactual scenario is the SL scenario,
Table 1 shows the two vehicle fleet distributions used              which assumes that diesel LDV emissions comply
in HERMESv3 for Barcelona city. The profiles divide                 with the Euro emission standards (European Com-
the road network within the city into two main zones,               mission 2007). It therefore considers that emission

                                                      4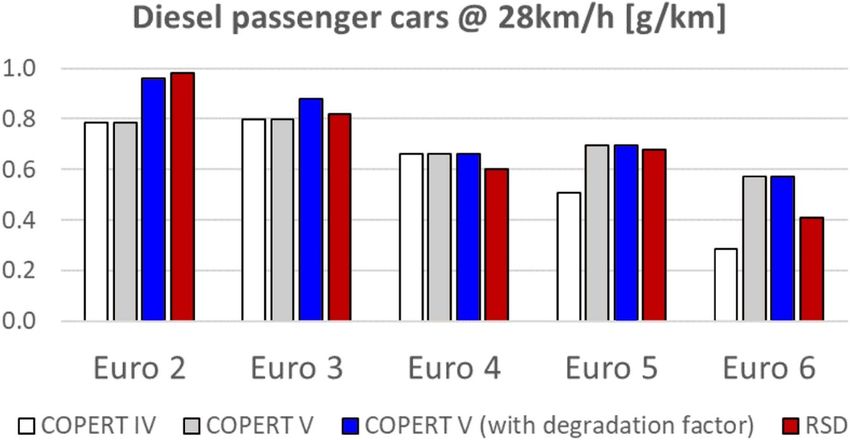
Environ. Res. Lett. 16 (2021) 024024                                                                                    J Benavides et al

Table 2. Diesel LDV real-world emission factors from HERMESv3 estimated at 28 km h−1 , Euro emission standards and standard limit
scaling factors for NOX adopted from Anenberg et al (2017).

                                                                       Real-world             NOX emission           Standard limit
Vehicle type          Fuel                   Euro category            NOX (g km−1 )           limit (g km−1 )        scaling factor

                                             EURO 3                          0.88                    0.50                   0.60
LDV                   Diesel                 EURO 4                          0.66                    0.25                   0.31
                                             EURO 5                          0.69                    0.18                   0.23
                                             EURO 6                          0.57                    0.08                   0.17

Table 3. NO2 model evaluation statistics calculated at Palau Reial, Eixample, and Gràcia sites (figure 1(d)) during the period of study
(9–25th November 2017). Standard statistics are described in Chang and Hanna (2004) and are computed with model hourly results of
CALIOPE-Urban, CALIOPE-1 km and CALIOPE-4 km systems. FAC2 refers to the fraction of model results within a factor of 2 of
observations, MB is the mean bias, RMSE is the root-mean-square error and r is the correlation coefficient. Bold numbers represent
model results with better performance for each statistic and site.

Site                  Method                         FAC2                    MB                   RMSE                       r

1. Palau Reial        CALIOPE-Urban                  0.62                   −5.17                  28.91                   0.51
                      CALIOPE-1 km                   0.54                  −18.66                  34.11                   0.49
                      CALIOPE-4 km                   0.65                   −5.53                  27.78                   0.58
2. Eixample           CALIOPE-Urban                  0.86                    4.16                  31.27                   0.57
                      CALIOPE-1 km                   0.76                  −19.36                  33.44                   0.65
                      CALIOPE-4 km                   0.75                  −21.26                  35.97                   0.57
3. Gràcia            CALIOPE-Urban                  0.81                  −16.21                  36.04                   0.58
                      CALIOPE-1 km                   0.57                  −33.04                  46.57                   0.57
                      CALIOPE-4 km                   0.57                  −34.01                  48.81                   0.48

limits are not exceeded for light passenger and com-                  Eixample) and in one of the urban background sta-
mercial vehicles under real-world driving condi-                      tions (Palau Reial), which is considered to be rep-
tions following the European Commission regula-                       resentative of the models behaviour at this site type,
tion 2016/646. To create this scenario we transformed                 as shown in figure 1(d). The model performance
the real-world traffic NOX emissions using the scal-                  at the other urban background sites can be found
ing factors proposed by Anenberg et al (2017) for                     in the supplementary material (available online at
diesel LDV from EURO 3 to EURO 6. These scaling                       stacks.iop.org/ERL/16/024024/mmedia) and for a
factors are reported by vehicle type and EURO cat-                    more complete evaluation near traffic in Barcelona
egory and are based on an extensive review of previ-                  we refer to Benavides et al (2019). Table 3 shows
ous works measuring real-world vehicle’s emissions.                   standard statistics computed using the modeled and
The scaling factors are used to estimate standard limit               measured concentrations and figure 3 depicts the
emissions by correcting the real-world NOX emis-                      NO2 average daily cycle. All the simulations tend to
sion factors considered in HERMESv3 for each vehicle                  slightly underestimate NO2 and behave similarly well
type and EURO category. In the present study, emis-                   in the urban background station. Yet, IP-4 km and
sions from older diesel LDV (i.e. pre-EURO1, EURO1                    CAT-1 km are strongly biased in the traffic stations.
and EURO2) are not considered in the scaling process                  As expected BCN-20 m is able to better reproduce the
due to their low share reported in the vehicle com-                   observed values at the traffic stations. At the Gràcia
position profiles (about 3%). We focus on diesel LDV                  site, it reduces the underestimation by ∼50% (∼−16
because they are the dominant contributors to excess                  vs ∼−33 µg m−3 ) and at the Eixample site, by a factor
NOX health impacts in Europe (Anenberg et al 2017)                    ∼5 (∼4 vs ∼−20 µg m−3 ). Between the traffic sites,
and the dominant vehicle type in Barcelona’s circu-                   we relate the distinct behaviour at each site to the
lating fleet (60.2% in the urban area and 61.6% in the                relative influence of local traffic in each site, to the
ring roads).                                                          influence of the main trafficked areas and to the spe-
                                                                      cific micro-meteorological patterns.

                                                                      3.2. Impact of excess diesel LDV emissions upon
3. Results                                                            total NOX emissions
                                                                      Table 4 shows the annual total NO, NO2 and NOX
3.1. Model evaluation                                                 traffic emissions estimated for Barcelona city for the
We first provide an evaluation of the BAU scen-                       BAU and the SL scenarios. NOX traffic emissions
ario using hourly NO2 concentrations reported                         decrease by ∼27% on average when diesel LDV are
by the official monitoring network in Catalonia                       assumed to comply with EU standard limits. The
(XVPCA) for the year 2017 in the only two traffic                     decrease in primary NO2 emissions is much stronger
stations available in Barcelona (i.e. Gràcia and                     (∼49%) than in NO emissions (∼22%). This is

                                                       5
Environ. Res. Lett. 16 (2021) 024024 J Benavides et al
Figure 3. NO2 average daily cycle at Palau Reial (background), Eixample and Gràcia sites (traffic) (figure 1(d)) during the period
of study (9–25th November 2017). Observations are represented in black lines, CALIOPE-Urban in red, CALIOPE-1 km in blue,
and CALIOPE-4 km in green lines.
Table 4. Estimated annual NO, NO2 , and NOX traffic emissions (figure 1(d) because the fleet is dominated by heavy
(Tg) for the year 2017 in Barcelona for all the vehicle types at road
link-level for the BAU and SL scenarios and the relative difference duty vehicles, from −20% to −30 % in the very built-
in traffic emissions (%) that is calculated by (BAU−SL)/BAU. up Eixample city center district, and from −30% to
Reductions are expressed as negative values. −40 % in most of the other districts in the city and the
Configuration name NO NO2 NOX ring roads (figure 1(d)). The lower difference in the
centre district may be caused by the greater share of
BAU 5348 1331 6679 mopeds and motorbikes in that district (25% accord-
SL 4163 681 4844
ing to Barcelona City Council 2017a). The impact on
Reduction in traffic −22% −49% −27%
emissions (%) NO2 emissions (figure 4(f)), with a relative difference
ranging from 40% to 60%, is greater than it is on NO
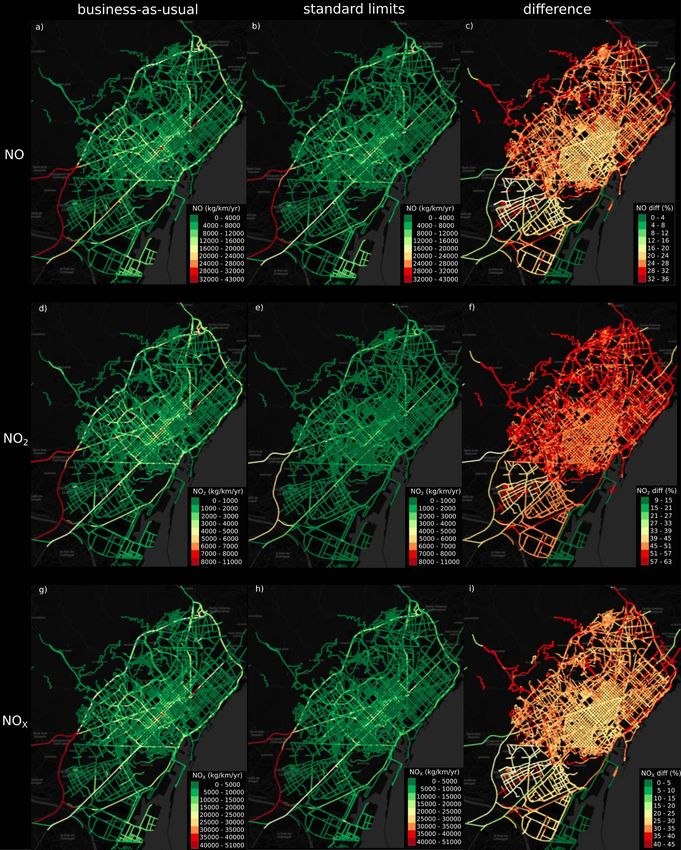
(figure 4(c)), ranging from 20% to 40%.
explained by the larger contribution of NO2 emis- 3.3. Impact of excess diesel LDV emissions upon
sions in diesel LDV compared to other vehicles. For NO2 concentration
instance, Carslaw et al (2016) found the NO2 /NOX Figure 5 shows the average NO2 concentration maps
ratio for diesel cars EURO 4, 5 and 6 to range from for BCN-20 m, IP-4 km and CAT-1 km. The two
0.25 to 0.34 whereas for EURO-equivalent petrol cars mesoscale outputs were interpolated using bilinear
it ranged from 0.05 to 0.12. interpolation to the 20 m resolution grid for compar-
Table 5 shows the intra-urban variability of NOX ison purposes. For the three cases, we show the BAU
emissions per km2 at road-link level for both scen- and the SL scenarios along with the absolute and relat-
arios and the relative difference of these scenarios. ive differences thereof. The spatial detail of BCN-20 m
The impact upon NO2 emissions, with relative reduc- enables characterising the impact of excess diesel LDV
tions ranging from −11.4% to −58.1%, is stronger NOX emissions at street-level; the median value of the
than upon NO (−2.2% to −36.4%). average BAU concentrations across the 20 m recept-
Figure 4 shows the spatial distribution of NOX ors is 58.9 µg m−3 (interquartile ranges (IQR) from
traffic emissions in Barcelona city at road-link level 46.0 to 75.8 µg m−3 ); the median value of the absolute
for both scenarios and the relative difference thereof. difference between average BAU and SL concentra-
The relative reductions in NOX emissions (figure 4(i) tions is −10.5 µg m−3 (IQR from −6.7 to −14.7 µg
range only from 2.2% to 10% in the harbour area m−3 ); and the median value of the relative difference
6Environ. Res. Lett. 16 (2021) 024024 J Benavides et al
Table 5. Estimated annual NO, NO2 , and NOX traffic emissions (Tg) per km2 for the year 2017 in Barcelona at road link-level for all the
vehicle types for the BAU and SL scenarios and the relative difference in traffic emissions (%).
NO NO2 NOX
Statistic BAU SL Diff. (%) BAU SL Diff. (%) BAU SL Diff. (%)
Average 35.9 27.9 −22.9 8.9 4.6 −47.7 44.8 32.5 −27.9
Median 29.1 22.5 −25.7 7.0 3.8 −51.4 36.9 26.5 −31.2
Max 124.8 116.2 −36.4 32.8 15.7 −58.1 156.0 128.2 −41.9
Min 0.0 0.0 −2.2 0.0 0.0 −11.4 0.0 0.0 −3.1
Figure 4. Estimated annual NO (a–c), NO2 (d–f) and total NOX (g–i) traffic emissions (kg km−1 ) for the year 2017 in Barcelona
city for the entire vehicle fleet for both BAU and SL scenarios and the relative percentage difference computed using the BAU as
reference value.
is −20% (IQR from −15% to −21%). These differ- The largest differences are generally found in the
ences are consistent with the daily results as seen in areas with highest NOX traffic emissions (figure 4).
section S2 figure S2 in the supplementary material. In fact, the relative differences in NO2 levels between
7Environ. Res. Lett. 16 (2021) 024024 J Benavides et al
Figure 5. Average NO2 concentrations during the period of study (9–25th November 2017) for BAU scenario, SL scenario and
their absolute and relative differences for CALIOPE-Urban (a)–(d), CALIOPE-1 km (e)–(h) and CALIOPE-4 km (i)–(l).
Figure 6. Scatter plot showing the relation of NO2 mean concentrations for the BAU scenario and the relative difference between
scenarios during the period of study (9–25th November 2017) using CALIOPE-Urban results. The dots represent values at 12 389
receptors within 10 m radial distance from road-link mid-points for road-links with NOX emissions difference between scenarios
above 25% (a 93% of links) in 2017 in Barcelona municipality. Colours represent relative difference in NOX emissions.
8Environ. Res. Lett. 16 (2021) 024024 J Benavides et al
scenarios broadly scale with the average NO2 concen- NO2 concentrations and interquartile ranges in Bar-
tration (figure 6), a feature that is not reproduced celona municipality of −10.5 µg m−3 (−6.7 to −14.7
in IP-4 km and CAT-1 km (not shown). Diesel LDV µg m−3 ), −6.5 µg m−3 (−5.6 to −8.1 µg m−3 ), and
NOX emissions strongly contribute to NO2 concen- −5.5 µg m−3 (−5.0 to −6.0 µg m−3 ) in absolute
trations in the ring roads and some major streets that terms and −20% ( from −15% to −21%), −18%
act as the main entrance routes towards the city cen- (from −15% to −19%), −13% (from −13% to
ter. Additionally, some districts such as the Eixample −14%) in relative terms using BCN-20 m, CAT-1 km
are more affected to excess diesel emissions than oth- and IP-4 km, respectively. In other words, the meso-
ers mainly due to the combination of the aspect ratio scale simulations underestimated the absolute reduc-
of the streets and the traffic intensity. In contrast, in tions in NO2 concentrations by ∼38% and ∼48% and
areas where NO2 concentrations are predominantly the relative reductions by 10% and 35% compared to
affected by other sources, the difference between scen- the street-scale model when NOX diesel LDV emis-
arios is comparably low. For instance, in the area sur- sions were assumed to comply with Euro emission
rounding the harbour, the impact of LDV is lower standards.
than in other parts of the city due to the high share Other prior studies (e.g. Anenberg et al 2017, Jon-
of diesel high-duty-vehicles operating there (around son et al 2017) have used low resolution models to
45% of the total circulating vehicles). This area is rep- characterise the impacts upon PM2.5 and O3 . While
resented by the points showing relative differences our study focuses only on NO2 , it is likely that PM2.5
below 10% in figure 6. or at least a fraction of it is largely underestimated
IP-4 km and CAT-1 km show very different spa- in compact cities at mesoscale resolutions. Stronger
tial patterns; the steep spatial gradients appearing in underestimations on both the absolute and relative
BCN-20 m are smoothed out and concentrations in reductions are to be expected as model resolution
the BAU scenario only reach a median value of 41.7 decreases. Thus, street models are strongly recom-
µg m−3 (IQR from 39.5 to 44.7 µg m−3 ) and 38.6 µg mended to avoid underestimations in impact assess-
m−3 (IQR from 35.0 to 48.4 µg m−3 ), respectively, ments of alternative emission scenarios in compact
a 29% (IQR from 14% to 41%) and 34% (IQR from cities.
24% to 36%) less compared to BCN-20 m. The largest differences in NO2 between scenarios
The absolute differences between scenarios are were found in the areas with the highest NOX traffic
−5.5 µg m−3 (IQR from −5.0 to −6.0 µg m−3 ) for emissions. Using observations, Von Schneidemesser
IP-4 km and −6.5 µg m−3 (IQR from −5.6 to −8.1 µg et al (2017) estimated a potential NO2 reduction in
m−3 ) for CAT-1 km, which is 38%–48% less than in traffic sites across Berlin ranging from −9 to −23
BCN-20 m. The median relative differences are −13% µg m−3 if diesel LDV would comply with the EURO
(IQR from −13% to −14%) for IP-4 km and −18% standards. Similarly, we found an average reduction
(IQR from −15 to −19%) for CAT-1 km, which is ranging from −13 to −18 µg m−3 at traffic sites dur-
10%–35% less than in BCN-20 m. ing the period of study using the street-scale model.
Despite the large improvements, these sites would
still not meet the EU and WHO annual limit values
4. Discussion and conclusions assuming that the relative differences between scen-
arios during our study are maintained during the
To quantify the impact of excess NOX diesel LDV whole year (40.6 µg m−3 in Gràcia and 45.6 µg m−3
emissions upon NO2 concentrations over Barcelona in Eixample sites).
city we compared simulations with two different Our results imply an increase in the number of
emission scenarios: a business-as-usual (BAU) scen- citizens exposed to unhealthy NO2 levels when com-
ario representing NOX diesel LDV emissions under paring the BAU with the SL scenario. We estimate
real-world driving conditions and a counterfactual that 90.2% of citizens would be exposed to NO2
standard limits (SL) scenario, which represents NOX levels above 40 µg m−3 under the BAU scenario, a
diesel LDV emissions compliant with the Euro emis- percentage that would decrease to 76.6% within the
sion standards. SL scenario during the study period (see section S3
We first showed that, in contrast to the meso- and figure S3 in supplementary material). Assuming
scale model, the street-scale model is able to repro- that the relative difference is maintained through-
duce the NO2 concentration gradients observed in out the year 2017, the percentage of Barcelona cit-
the city between open areas and trafficked zones. We izens exposed to higher concentrations than the
found a decrease on the order of −30% in total NOX annual limit would have been reduced from 70%
and −50% in total primary NO2 emissions, consist- (ASPB 2018) to 59%. Future studies should further
ent with other studies (e.g. Von Schneidemesser et al investigate the associated health implications in a city
2017). The differences are not homogeneous across where exposure to NO2 was associated with about 929
the city; we estimated higher NOX emissions in the premature deaths in 2017 (ASPB 2018).
very built-up city center and near the ring roads. Based on our findings, diesel LDV should actually
Overall this translated into a reduction of median meet the EURO standards under real-world driving
9Environ. Res. Lett. 16 (2021) 024024 J Benavides et al
conditions to substantially reduce NO2 concentra- Oriol Jorba https://orcid.org/0000-0001-5872-
tion levels in cities with a high proportion of diesel 0244
LDV and chronic NO2 exceedances. Moving towards
cleaner LDV in these cities is likely not enough to
References
meet the EU and WHO annual limit values for
NO2 in trafficked streets and other policies targeting Achakulwisut P, Brauer M, Hystad P and Anenberg S C 2019
the overall reduction of LDV circulating should be Global, national and urban burdens of paediatric asthma
encouraged. incidence attributable to ambient NO2 pollution: estimates
from global datasets Lancet Planet. Health 3 1–13
Anenberg S C et al 2017 Impacts and mitigation of excess
Data availability statement diesel-related NOx emissions in 11 major vehicle markets
Nature 545 467–71
ASPB 2018 Agència de Salut Pública Barcelona. Avaluació de la
The data that support the findings of this study qualitat de l’ aire a la ciutat de Barcelona (available at:
are available upon reasonable request from the https://www.aspb.cat/wp-content/uploads/2018/07/AVAL
authors. UACIO_QUALITAT_AIRE_BARCELONA_2017-1.pdf)
Atkinson R W, Butland B K, Anderson H R and Maynard R L 2018
Long-term concentrations of nitrogen dioxide and
mortality: a meta-analysis of cohort studies Epidemiology
Acknowledgments 29 460–72
Baldasano J M, Pay M T, Jorba O, Gassó S and Jiménez-Guerrero P
The authors thank the Generalitat de Catalunya for 2011 An annual assessment of air quality with the CALIOPE
providing access to the measurements of the offi- modeling system over Spain Sci. Total Environ. 409 2163–78
Barcelona City Council 2017a Caracterització dels vehicles i les
cial monitoring network XVPCA and Pablo Martínez seves emissions a l’àrea metropolitana de Barcelona
from the urban planning studio 300 000 km s−1 for (available at: https://www.bcnregional.com/ca/projects/
providing the census-level population dataset disag- medi_ambient/caracteritzacio-del-parc-de-vehicles-
gregated at the address level. The authors acknow- circulant-en-funcio-de-les-seves-emissions/)
Barcelona City Council 2017b Dades bàsiques de mobilitat
ledge PRACE and RES for awarding access to Mar- Informe (available at: https://bcnroc.ajuntament.barce
enostrum4 based in Spain at the Barcelona Super- lona.cat/jspui/handle/11703/111727)
computing Center through the eFRAGMENT2 and Barrett S R H, Speth R L, Eastham S D, Dedoussi I C, Ashok A,
AECT-2020-1-0007 projects. Jaime Benavides was Malina R and Keith D W 2015 Impact of the Volkswagen
emissions control defeat device on US public health Environ.
funded by grant BES-2014-070637 from the FPI pro- Res. Lett. 10 114005
gramme by the Spanish Ministry of the Economy Basart S, Pérez C, Nickovic S, Cuevas E and Baldasano J M 2012
and Competitiveness. The authors also acknow- Development and evaluation of the BSC-DREAM8b dust
ledge the support from the Ministerio de Ciencia, regional model over northern Africa, the Mediterranean and
the Middle East Tellus B 64 1–23
Innovación y Universidades (MICINN) as part of Benavides J, Snyder M, Guevara M, Soret A, Pérez García-Pando
the BROWNING project RTI2018-099894-B-I00 C, Amato F, Querol X and Jorba O 2019 CALIOPE-Urban
and NUTRIENT project CGL2017-88911-R and the v1.0 : coupling R-LINE with a mesoscale air quality
support from the Agencia Estatal de Investigacion modelling system for urban air quality forecasts over
Barcelona city (Spain) Geosci. Model Dev. 12 2811–35
(AEI) as part of the VITALISE project (PID2019- Borge R, Lumbreras J, Pérez J, De la Paz D, Vedrenne M, de
108086RA-I00/AEI/10.13039/501100011033). Car- Andrés J M and Rodríguez M E 2014 Emission inventories
los Pérez García-Pando acknowledges the long- and modeling requirements for the development of air
term support from the AXA Research Fund, quality plans. Application to Madrid (Spain) Sci. Total
Environ. 466–467 809–19
as well as the support received through the Byun D W and Schere K L 2006 Review of the governing
Ramón y Cajal programme (Grant RYC-2015- equations, computational algorithms and other components
18690) of the Spanish Ministry of Economy and of the Models-3 Community Multiscale Air Quality
Competitiveness. (CMAQ) modeling system Appl. Mech. Rev. 59 51–77
Carslaw D C, Murrells T P and Keenan M 2016 Have vehicle
emissions of primary NO2 peaked? Faraday Discuss.
ORCID iDs 189 439–54
Chang J C and Hanna S R 2004 Air quality model performance
Jaime Benavides https://orcid.org/0000-0002- evaluation Meteorol. Atmos. Phys. 87 167–96
Chen Y and Borken-kleefeld J 2016 Emissions from diesel
1851-5155
passenger cars worsen with age Environ. Sci. Technol.
Marc Guevara https://orcid.org/0000-0001-9727- 50 3327–32
8583 Chiusolo M et al 2011 Short-term effects of nitrogen dioxide on
Michelle G Snyder https://orcid.org/0000-0003- mortality and susceptibility factors in 10 Italian cities: the
EpiAir Study Environ. Health Perspect. 119 1233–8
4225-1556
Chossière G P, Malina R, Allroggen F, Eastham S D, Speth R L and
Daniel Rodríguez-Rey https://orcid.org/0000- Barrett S R H 2018 Country- and manufacturer-level
0002-8055-7524 attribution of air quality impacts due to excess NOx
Albert Soret https://orcid.org/0000-0002-1962- emissions from diesel passenger vehicles in Europe Atmos.
Environ. 189 89–97
2972
Degraeuwe B, Thunis P, Clappier A, Weiss M, Lefebvre W, Janssen
Carlos Pérez García-Pando S and Vranckx S 2017 Impact of passenger car NOx
https://orcid.org/0000-0002-4456-0697 emissions on urban NO2 pollution—scenario analysis
10Environ. Res. Lett. 16 (2021) 024024 J Benavides et al
for 8 European cities Lewis A C, Carslaw D C and Kelly F J 2015 Diesel pollution long
Atmos. Environ. 171 21330–337 under-reported Nature 526 195
Duyzer J, van den Hout D, Zandveld P and van Ratingen S 2015 Li Y, Henze D K, Jack D and Kinney P L 2016 The influence of air
Representativeness of air quality monitoring networks quality model resolution on health impact assessment for
Atmos. Environ. 104 88–101 fine particulate matter and its components Air Qual. Atmos.
EEA 2019 Air quality in Europe—2019 report (No. 10/2019) Health 9 51–68
Technical Report 10 (available at: https://www.eea.eur Ntziachristos L, Papadimitriou G, Ligterink N and Hausberger S
opa.eu/publications/air-quality-in-europe-2019) 2016 Implications of diesel emissions control failures to
EMEP/EEA 2016 EMEP/EEA: air pollutant emission inventory emission factors and road transport NOx evolution Atmos.
guidebook 2016 Technical guidance to prepare national Environ. 141 542–51
emission inventories Technical Report EMEP/ EEA EEA Pay M T, Martínez F, Guevara M and Baldasano J M 2014 Air
Report No. 21/2016 (available at: https://www.eea. quality forecasts on a kilometer-scale grid over complex
europa.eu/publications/emep-eea-guidebook-2016) Spanish terrains Geosci. Model Dev. 7 1979–99
European Commission 2007 Regulation (EC) No. 715/2007 of the Rappenglueck B, Lubertino G, Alvarez S, Golovko J, Czader B
European Parliament and of the Council of 20 June 2007 and Ackermann L 2013 Radical precursors and related
Technical Report L 171/1 (European Commission) (available species from traffic as observed and modeled at an urban
at: https://op.europa.eu/en/publication-detail/- highway junction J. Air Waste Manag. Assoc.
/publication/03e19ce5-448d-43dd-b49a-1c68d75c78f4) 63 1270–86
Faustini A, Rapp R and Forastiere F 2013 Nitrogen dioxide and Samoli E et al 2006 Short-term effects of nitrogen dioxide
mortality: review and meta-analysis of long-term studies on mortality: an analysis within the APHEA project
Eur. Respir. J. 44 744–53 Eur. Respir. J. 27 1129–37
Greco S L, Wilson A M, Hanna S R and Levy J I 2007 Factors Skamarock W C and Klemp J B 2008 A time-split nonhydrostatic
influencing mobile source particulate matter atmospheric model for weather research and forecasting
emissions-to-exposure relationships in the Boston Urban applications J. Comput. Phys. 227 3465–85
Area Environ. Sci. Technol. 41 7675–82 Snyder M G, Venkatram A, Heist D K, Perry S G, Petersen W B
Guevara M, Tena C, Porquet M, Jorba O and Pérez García-Pando and Isakov V 2013 RLINE: a line source dispersion model
C 2019 HERMESv3, a stand-alone multi-scale atmospheric for near-surface releases Atmos. Environ. 77 748–56
emission modelling framework—part 1: global and regional Sunyer J et al 2015 Association between traffic-related air
module Geosci. Model Dev. 12 1885–907 pollution in schools and cognitive development in primary
Guevara M, Tena C, Porquet M, Jorba O and Pérez García-Pando school children: a prospective cohort study PLoS Med.
C 2020 HERMESv3, a stand-alone multi-scale atmospheric 12 e1001792
emission modelling framework—part 2: the bottom–up Thompson G J, Carder D K, Besch M C, Thiruvengadam A and
module Geosci. Model Dev. 13 873–903 Kappanna H K ICCT 2014 In-use emissions testing of
Inness A et al 2019 The CAMS reanalysis of atmospheric light-duty diesel vehicles in the United States (available at
composition Atmos. Chem. Phys. 19 3515–56 https://theicct.org/sites/default/files/publications/WVU_
Janssens-Maenhout G et al 2015 HTAP_v2.2: a mosaic of regional LDDV_in-use_ICCT_Report_Final_may2014.pdf)
and global emission grid maps for 2008 and 2010 to study TomTom 2019 TomTom historical average speed profiles
hemispheric transport of air pollution Atmos. Chem. Phys. (available at: https://www.tomtom.com)
15 11411–32 Valencia A, Venkatram A, Heist D, Carruthers D and
Jonson J E, Borken-Kleefeld J, Simpson D, Nyíri A, Posch M and Arunachalam S 2018 Development and evaluation of the
Heyes C 2017 Impact of excess NOx emissions from diesel R-LINE model algorithms to account for chemical
cars on air quality, public health and eutrophication in transformation in the near-road environment Transp. Res. D
Europe Environ. Res. Lett. 12 094017 59 464–77
Karner A A, Eisinger D S and Niemeier D A 2010 Near-roadway Von Schneidemesser E, Kuik F, Mar K A and Butler T 2017
air quality: synthesizing the findings from real-world data Potential reductions in ambient NO2 concentrations from
Environ. Sci. Technol. 44 5334–44 meeting diesel vehicle emissions standards Environ. Res. Lett.
Korhonen A et al 2019 Influence of spatial resolution on 12 114025
population PM2.5 exposure and health impacts Air Qual. Weiss M, Bonnel P, Hummel R, Manfredi U, Colombo R, Lanappe
Atmos. Health 12 705–18 G, Lijour P L and Sculati M 2011 Analyzing on-road
Kuenen J J P, Visschedijk A J H, Jozwicka M and Denier Van Der emissions of light-duty vehicles with Portable Emission
Gon H A C 2014 TNO-MACC_II emission inventory; a Measurement Systems (PEMS) Technical Report (Joint
multi-year (2003–2009) consistent high-resolution Research Centre at European Commission) (available at:
European emission inventory for air quality modelling https://ec.europa.eu/clima/sites/clima/files/transport/
Atmos. Chem. Phys. 2013 10963–76 vehicles/docs/2011_pems_jrc_62639_en.pdf)
11You can also read