Application of Three Different Machine Learning Methods on Strategy Creation for Profitable Trades on Cryptocurrency Markets
←
→
Page content transcription
If your browser does not render page correctly, please read the page content below
Application of Three Different Machine Learning
Methods on Strategy Creation for Profitable Trades on
 Cryptocurrency Markets
 Mohsen Asgari#1 , Seyed Hossein Khasteh#2
 #
 Artificial Intelligence Department, Faculty of Computer Engineering, K. N. Toosi University of Technology
 Mohsen0Asgari@gmail.com
 khasteh@kntu.ac.ir
 Abstract— AI and data driven solutions have been applied to thought-provoking. First, the user adoption of
 different fields with outperforming and promising results. In this
 research work we apply k-Nearest Neighbours, eXtreme Gradient various cryptocurrencies has really taken off, with
 Boosting and Random Forest classifiers to direction detection billions in market cap and millions of wallets
 problem of three cryptocurrency markets. Our input data estimated to have been ‘active’ in 2016. Second, the
 includes price data and technical indicators. We use these
 classifiers to design a strategy to trade in those markets. Our test cryptocurrency industry is both globalised and
 results on unseen data shows a great potential for this approach in localised, with borderless exchange operations, as
 helping investors with an expert system to exploit the market and well as geographically clustered mining activities.
 gain profit. Our highest gain for an unseen 66 day span is 860$ per
 1800$ investment. We also discuss limitations of these approaches Third, the industry is becoming more fluid, as the
 and their potential impact to Efficient Market Hypothesis. lines between exchanges and wallets are increasingly
 ‘blurred’ and a multitude of cryptocurrencies, not
 Keywords— Market Prediction, Financial Decision Making, k- just bitcoin, are now supported by a growing
 NN Classifier, Extreme Gradient Boosting, Random Forest, ecosystem, fulfilling an array of functions.” which
 Quantitative Computation
 has been quoted from a survey by Cambridge Center
 I. INT RODUCT ION for Alternative Finance in 2017, a year which is not
 Artificial Intelligence has widely been applied to even comparable to what is the prevalence of
 different areas in the last decade and there have been blockchain based technologies now. As of the time
 reported a lot of improvements in results by using its of writing this, only BTC makes a market cap of
 applications. One of the very interesting areas of $1,042,689,199,152 and a 24 hour circulating
 application is financial markets. There could be a lot volume of $57,794,818,577 (“Today's
 of improvements in exploiting these markets by Cryptocurrency Prices by Market Cap”). As the
 means of artificial intelligence and machine learning. dominance of BTC is 50 percent (“Today's
 Some cases of these applications include Loan Cryptocurrency Prices by Market Cap”) at the
 Application Scoring, Credit Evaluation, Sovereign moment, the total market cap of cryptocurrenc ies
 Credit Ratings, Mortgages Choice Decision, registered in Coin Market Cap database can be
 Portfolio Management, Financial Performance estimated as about more than 2 thousand billion US
 Prediction and Market Direction Prediction Dollars. This impressive amount of money shows a
 (Bahrammirzaee). great potential for this innovative use of technology
 In this paper we focus on the Market Directio n with increasingly facing new challenges (like
 Prediction problem and we look at it as a data science expensive transaction fees) and tackling them over
 problem. with innovative solutions (like MicroCache
 One of very innovative usages of new technolo gy (Almashaqbeh et al.)).
 in finance are cryptocurrencies. As we read in The main goal of the methods described in this
 (Hileman et al. 2) ”The findings are both striking and article are to determine if the price of the analysed
 cryptocurrencies will move higher or lower in the
coming four hours. To do that we use a data channel on findings of this article the interest in using Market
directed to the Binance cryptocurrency exchange Information and Technical Indicators as inputs to
free available API and receive the data from the models have increased in the past few years. It also
exchange’s database. Then we run some shows more attention to ensemble methods for this
preprocessing procedures on them and get them topic recently. Another interesting finding in this
ready to be used as entry to our machine learning survey is better accuracy obtained by using
models. Technical Indicator and Social Networks data
 Three different machine learning methods have combined together in comparison with other data
been used in this work. The first one being kNN as sources as input.
an example-base learner and the last two ones being Second survey (Obthong et al.) points out
Random Forest and Gradient Boosting methods as advantages and disadvantages of using 23 differe nt
tree-base learners. These models have been machine learning models with each other, which
discussed in the “Methods and Materials” section. include k-NN and Random Forest. k-NN, described
 Data used for these analyses are mostly Open, as a Classification and Forecasting Algorithm, has
High, Low, Close and Volume data from three been noted to have advantages of being robust to
different cryptocurrency markets: ETH-USDT, noisy training data and being very efficient if the
LTC-BTC, ZEC-BTC. It has been augmented by training datasets are large. It also points to the issue
technical indicators to make better learning data for of determining the best k for this algorithm and its
the models. high complexity in computation and memory
 After explaining the models and the data, we limitations as its disadvantages. k-NN can be
explore the implementation of these models in the sensitive to the local structure of the data based on
“Proposed Method” section. the findings in this survey (Archana and Elango va n)
 At the “Experimental Results” section we look at (Jadhav and Channe). In the same survey, random
the performance of these models in predicting the forest has been categorized as another Classifica tio n
next four hour movement of the market in the test and Forecasting algorithm and for its advantages we
data, which our learned models have not been read: “Robust method for forecasting and
exposed to. classification problems since its design that is filled
 At the “Discussion” section we look at the with various decision trees, and the feature space is
performance of our models and we discuss some modelled randomly, automatically handles missing
different and debatable aspects of these methods and values and works well with both discrete and
the whole strategy creation system and their relation continuous variables”. RF algorithm has been
to Efficient Market Hypothesis. There are some disadvantaged by the following points “Requires
improvements which can be made to this work and more computational power and resources because it
we mention some of them in the “conclusion and creates a lot of trees and requires more time to train
future works” section. than decision trees” (Obthong et al. 5)
 (Pradeepkumar and Ravi).
 II. RELAT ED WORKS
 Third survey (Kumar et al.) organises core
 In this section we introduce three different surveys Computational Intelligence approaches for stock
done on the topic of market direction prediction and market forecasting in three different classes
also point to the previous usages of the impleme nted including: Neural Network, Fuzzy Logic and
methods in other studies. Genetic Algorithm. It surveys application of these
 First Survey (Bustos and Pomares-Quimbaya 8) models in markets of 19 different countries. Mostly
shows a comprehensive taxonomy of stock market used data for training models based on this survey
prediction algorithms based on machine learning and are Technical Indicators (Kumar et al. 15). It also
their categories. This survey has also a performance shows that more research has been done for
comparison of the stock market forecast models American Markets (NYSE & NASDAQ) than other
(Bustos and Pomares-Quimbaya 10) which has 47 geographical locations. This survey concludes
different models compared with each other. Based “identification of suitable pre-processing and feature
selection techniques helps in improving the accuracy * 103 BTC (for their method 1) and ∼ 95 BTC (for
of stock market forecasting models and their Method 2) starting from 1 BTC (Alessandretti
computational intelligence approaches can be et al. 7).
effectively used to solve stock market forecasting
 III. M ET HODS AND MAT ERIALS
problem with high accuracy. Among them hybrid
models are predominant techniques applied to In this section we first look at the data used in this
forecast stock market due to combined prediction project, then we get acquainted with three differe nt
capability of base models”. methods which have been used to make the models
 k-Nearest Neighbours algorithm (k-NN) is an for the prediction task.
instance-base learner model first developed by (Fix 1. Used Data
and Evelyn). This model has shown a good Binance is a cryptocurrency exchange that
performance regarding returns in financial markets. provides a platform for trading various
Applying this model to Jordanian Stock Market has cryptocurrencies. As of April 2021, Binance was the
been reported to yield Total Squared RMS error of largest cryptocurrency exchange in the world in
0.263, RMS error of 0.0378 and the average error of terms of trading volume (Coin Market Cap).
-5.434E-09 for “AIEI” symbol (Alkhatib et al.). Binance provides a free to use API for data
Another scheme of applying k-NN has been reported gathering. This API is conveniently available to use
in (Chen and Hao) by the name of “FWKNN”. It has in python language. We use this API to gather Time
been concluded in that research: “The experime nt stamp (in second precision), Open, High, Low, Close
results clearly show that FWSVM-FWKNN stock and Volume for a 4 hours period dataframe. This
analysis algorithm where the classification by procedure runs for all three different assets that we
FWSVM and the prediction by FWKNN, is robust, study: ETH-USDT, LTC-BTC and ZEC-BTC. Data
presenting significant improvement and good gets gathered from mid-2017 until April 2021. This
prediction capability for Chinese stock market makes our raw input data.
indices over other compared model”.
 Random Forests have been used since the late 90s 2. First Classifier: k -Nearest Neighbours Vote
to overcome the over fitting problem in decision Neighbours-based models are type of instance-
trees (Ho and Kam). A variation of this algorithm has based learning or non-generalizing learning. They
been applied to cryptocurrency market direction don’t attempt to construct a general internal model,
detection problem on 60 minutes data in (Akyild ir im but simply store instances of the training data (hence
et al.). Their out-of-sample accuracy on BTC, ETH, called lazy learners). Classification is computed
LTC and ZEC has been reported 0.52, 0.53, 0.53 and from a sort of majority vote of the nearest neighbours
0.52 respectively. They have used mostly OHLC and of each point: the point we are trying to classify is
indicator-based data for their model training. They assigned to the data class which has the most
also have concluded that their used algorithms representatives within the nearest neighbours of the
“demonstrate the predictability of the upward or point. Using distance metrics can sometimes
downward price moves” (Akyildirim et al. 27). improve the accuracy of the model. (Pedregosa et al.)
 Gradient Boosting is a relatively old popular These models are also beneficial for regression
machine learning method in dealing with non-linear problems.
problems (Friedman). Later a more efficient variant Suppose we have pairs ( 1 , 1 ), ( 2 , 2 ),…,
of it has been developed by (Chen and He) known ( , ) taking values in × {1,2}, where Y is the
today as Extreme Gradient Boosting (XGBoost) class label of X, so that | = ~ for = 1,2 (and
algorithm. It has been reported (Alessandretti et al. probability distributions ). Given some norm ||. ||
4) this method has been used in a number of winning on and a point ∊ , let ( (1) , (1) ),
Kaggle solutions (17/29 in 2015). XGBoost has been ( (2) , (2) ), …, ( ( ) , ( ) ) be a reordering of the
applied to the Bitcoin market in (Chen et al. 12) and training data such that || (1) − || ≤. . . || ( ) − ||.
its accuracy has been reported 0.483. Another
experiment on XGB-based methods has yielded 1.1
Now, by voting on ( ) starting from = 1 and going even the same tree many times, if the training increasingly for , we can do the classification task. algorithm is deterministic); bootstrap sampling is a We use Scikit-learn implementation (Pedregosa et way of de-correlating the trees by showing them al.) of k-NN classifier in this project. different training sets. The number of samples/trees, , is a free 3. Second Classifier: Random Forest parameter. Typically, a few hundred to several Random forests or random decision forests are thousand trees are used, depending on the size and classified as ensemble learning methods. They can nature of the training set. An optimal number of be applied to classification, regression and other trees, , can be found using cross-validation, or by tasks that operate by constructing an assembly of observing the out-of-bag error: the mean prediction decision trees at training time and returning the class error on each training sample , using only the trees that is the mode of the classes (for classification) or that did not have in their bootstrap sample (James mean/average prediction (for regression) of the et al. 316-321). individual trees (Ho). “Random decision forests We use Scikit-learn implementation (Pedregosa et correct for decision trees' habit of over fitting to their al.) of random forest classifier in this project. training set” (Friedman et al. 587-588). Random forests generally perform better than individua lly 4. Third Classifier: eXtreme Gradient Boosting assisted decision trees, but their accuracy could be Gradient boosting is a machine learning techniq ue lower than gradient boosted trees. However, data for regression and classification problems, which characteristics can affect their performance like random forest, produces a prediction model in (Piryonesi and El-Diraby). the form of an ensemble of weak prediction models, The training algorithm for random forests applies typically decision trees. When a decision tree is the the general technique of bootstrap aggregating, or weak learner, the resulting algorithm is called bagging, to tree learners. Given a training set = gradient boosted trees, which usually outperforms 1 , . . . , with responses = 1 , . . . , bagging random forest (Piryonesi and El-Diraby) (Friedman repeatedly (B times) selects a random sample with et al.). It builds the model in a stage-wise fashion like replacement of the training set and fits trees to these other boosting methods do, and it generalizes them samples: by allowing optimization of an arbitrary for b=1, … , B: differentiable loss function. I. Sample, with replacement, n training Like other boosting methods, gradient boosting examples from , ; call these , . combines weak "learners" into a single strong learner II. Train a classification or regression tree on in an iterative fashion. It is easiest to explain in the , . least-squares regression setting, where the goal is to After training, predictions for unseen samples ′can "teach" a model to predict values of the form ̂ = be made by averaging the predictions from all the ( ) by minimizing the mean squared error 1 individual regression trees on ′: ∑ ( ̂ − )2 where indexes over some training 1 ̂ = ∑ =1 ( ′) set of size of actual values of the output variable . or by taking the majority vote in the case of So we have following definition: classification trees. This bootstrapping procedure leads to better model ̂ = The Predicted Value ( ) performance because it decreases the variance of the = The Observed Value model, without increasing the bias. This means that = The Number of Samples in while the predictions of a single tree are highly Now, let us consider a gradient boosting algorithm sensitive to noise in its training set, the average of with stages. At each stage (1 ≤ ≤ ) of many trees is not, as long as the trees are not gradient boosting, suppose some imperfect model correlated. Simply training many trees on a single (for low this model may simply return ̂ = ̅, training set would give strongly correlated trees (or where the right-hand side is the mean of ). In order
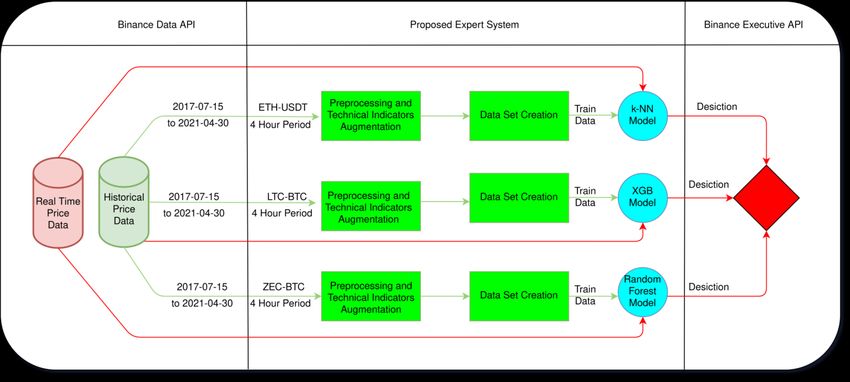
to improve , our algorithm should add some new 1. Raw Data Gathering
estimator, ℎ ( ). Thus, At the time of doing this research, Binance has
 +1 ( ) = ( ) + ℎ ( ) = made available, access to its historical records (for
or, equivalently, Open, High, Low, Close and Volume) through its
ℎ ( ) = − ( ). API for time frames bigger than one minute. We
Therefore, gradient boosting will fit ℎ to the residual gather 4 hour period data to a Pandas dataframe since
 − ( ). As in other boosting variants, each +1 its first available timestamp (which is usually mid
attempts to correct the errors of its predecessor . 2017). The data includes OHLCV for ETH-USDT,
A generalization of this idea to loss functions other LTC-BTC, ZEC-BTC. We use 95% of the data for
than squared error, and to classification and ranking training and the remaining 5% to evaluate the
problems, follows from the observation that models.
residuals ℎ ( ) for a given model are the negative 2. Pre Processing and Dataset Creation
gradients of the mean squared error (MSE) loss
 After gathering the data, we augment it with some
function (with respect to ( )):
 1 famous Technical Indicators in finance. Typically
 = ( − ( ))2 these indicators are some mathematical functio ns
 2
 which take some arguments from real time or past
 ℎ ( ) = − = − ( ).
 data and they create some insights about “technica l”
So, gradient boosting could be specialized to a
 moves of the market. Name and formula for these
gradient descent algorithm, and generalizing it
 technical indicators has been reported in the
entails "plugging in" a different loss and its gradient
 Appendix A.
(Li).
 After augmentation we have a dataframe includ ing
 Now, with having an overview of boosted trees,
 all relevant data for each record. Now, two things
one may ask what are XGBoost trees? XGBoost is a
 must be done to make it a suitable dataset for our
tool motivated by the formal principle introduced.
 models: 1- We need to encapsulate all the features
More importantly, “it is developed with both deep
 used for identifying a data point for each one of
consideration in terms of systems optimization and
 them, 2- We need to label each datapoint.
principles in machine learning”. “The goal of this
 For this project we use the last financial records
library is to push the extreme of the computatio n
 plus 59 records proceeding it as its features. These
limits of machines to provide a scalable, portable and
 records are in a 4 hour period and all of the produced
accurate library” (Chen and Guestrin). We use this
 features are numerical. We normalize them by using
library for our implementations of the solution.
 the Feature Scaling method. Each value gets divided
 IV. PROPOSED MET HODS to its maximum value minus its minimum.
 In this section we look at our proposed methods To encapsulate the feature data for each datapoint
for market direction problem in cryptocurrenc y we take all the 60 rows (and 19 parameters at each
markets. First, we fill in details about our raw data row) from our augmented dataframe and put all those
gathering procedure. Then at the second subsection, variables inside another array named X. So, each
we elaborate on our pre-processing steps for the will be a data point with 1140 parameters.
obtained raw financial data. We also explain the To label each datapoint we define a threshold to
dataset creation part of the scheme at this subsection. determine if retrospectively we would have entered
The third step, sums up the definition of our three the market at that timestamp, after 4 hours we would
different models. We also make some concise points make profit or loss? This threshold gets defined
about hyper parameters of each model. Last using the fees per each cryptocurrency exchanger. At
subsection looks at evaluation of results and the time of doing this research the least possible fee
concludes the strategy creation part of the system. to exchange in the market in Binance was 0.15
Figure 1 (look at page 7) shows a comprehens ive percent (0.075 percent to exchange from A symbol
view of the whole system, green lines indicate train to B symbol and 0.075 to exchange from B to
phase and red lines indicate exertion phase. original A symbol). So, we define our threshold in
this project as about 0.15 percent of the price and Brute Force based on the values passed to fit
movement in the 4 hour period. To sum up, if an method.
asset’s value changes more than this threshold in a
positive direction, we label that as “1” and otherwise Leaf Size: 30
we label it as “0”, This way per any label=1 if we
had entered the market at that point we would make The Distance Metric to Use for The Tree:
profit. Minkowski
3. Model definition- Model Training
 Power Parameter for The Minkowski Metric: 2
 At this subsection we look at the libraries and
hyper parameters involved in each model. We also Hyper parameters involved in Random Forest
note each model's training time. A more elaborate classifier are as follows:
discussion about the hyper parameters is held in the
Discussion section. The number of trees in the forest: Depended on The
 kNN model and random forest have been Dataset (700 for ETHUSDT and ZECBTC, 1000 for
implemented using open source machine learning
 LTCBTC)
library Scikit-learn. Scikit-learn features various
classification, regression and clustering algorithms The Function to Measure The Quality of A Split:
including support vector machines, random forests, gini
gradient boosting, k-means and DBSCAN, and is
designed to interoperate with the Python numeric a l The Maximum Depth of The Tree: Nodes are
and scientific libraries NumPy and SciPy. expanded until all leaves are pure or until all leaves
(Pedregosa et al.) An important design note about contain less than the minimum number of samples
scikit-learn is its unified interface for its models. If required to split an internal node samples.
user’s data suffices this interface requirements, it’s
easy to use and change models to use for the same The minimum number of samples required to split
data. an internal node: 2
 XGB has been implemented using XGBoost.
XGBoost is an optimized distributed gradient Hyper parameters involved in XGB classifier are
boosting library designed to be highly efficie nt, as follows:
flexible and portable. It implements machine
learning algorithms under the Gradient Boosting Booster: gbtree
framework. XGBoost provides a parallel tree
boosting (also known as GBDT, GBM) that solve Eta (alias: Learning Rate): 0.3
many data science problems in a fast and accurate
way (Chen and Guestrin). Minimum Loss Reduction Required to Make A
 Hyper parameters involved in kNN classifier are Further Partition on A Leaf Node of The Tree (The
as follows: larger gamma is, the more conservative the
 algorithm will be.): 0
 Number of Neighbours: Depended on The Dataset Maximum Depth of A Tree: 6
(5 for ETHUSDT, 20 for LTCBTC, 100 for
ZECBTC) Lambda (L2 regularization term on weights.
 Increasing this value will make model more
 Weight Function Used in Prediction: Distance conservative.): 1

 Algorithm Used to Compute The Nearest Alpha (L1 regularization term on weights.
Neighbours: Auto: will attempt to decide the most Increasing this value will make model more
appropriate algorithm between BallTree, KDTree conservative.): 0
mentioned graph shows what we are trying to
 Training and evaluation of the models in this predict. The third graph is the pair's price movements
project has been done using Colab virtual machines through its test phase (which makes 5% of our data).
by google. Training time takes the most for Random Then we report the accuracy of each model on their
Forest with an average of 167.97 seconds. Second test data and we look at their performance as their
place goes to XGB with an average of 46.85 seconds profits through the test time. This performance is
and finally kNN takes only 1.06 seconds on average assessed with a cumulative reward graph which
to be trained for these datasets. shows how much money we have earned with a fixed
 position at each time we entered or exited the market.
4. Evaluation and Strategy Creation
 Finally, we have some information regarding the test
 To evaluate each model in this project we use two of models and a distribution graph of each model’s
different methods: Accuracy of The Model and The (positive or negative) profits.
Profit Obtained by The Model. By accuracy in this
context, we mean how many times the predicted
label for the market direction matches with the real
direction of the market. To discuss how we calculate
the obtained profit, we need to understand how we
use the models to create the strategy.
 Strategy Creation procedure is pretty
straightforward. We took 60 rows of records from
now and past data and then we decide if the price will
go up enough to cover the exchange’s fee? If we
predict it will, we enter the market and after 4 hours
we retry this operation to decide for the next 4 hours.
If the next 4 hours still shows an adequate positive
movement, we keep the buy position and if it does
not, we sell what we have bought. Now, our profit is
the difference between the values of bought and sold
assets. It will accumulate this positive or negative
profit through the test span. Notice that our position
size stays the same at each buying or selling trade.
At the final step of the strategy we sell whatever we
have. Another evaluative indicator for strategy
assessments in financial markets is Profit Factor,
which is defined as: “The gross profit divided by the
gross loss (including commissions) for the entire
trading period”. We calculate this metric for each
model and each asset. In the next section we look at
the results of our experiments with our models.
 V. EXPERIMENT AL RESULT S
 Here we look at three different cryptocurrenc ie s
that we study, separately. This section has three
subsections relative to each cryptocurrency pair. At
each subsection, first, we have a graph of the pair’s
price movements through the time span that we
scrutinize it. Then, we have a graph that shows the
normalized returns of that pair through the time. The
A. ETH-USDT:

 Figure 2. Close Price for ETH-USDT from 2017-07 to 2021-07

 Figure 3. Normalized Return for ETH-USDT from 2017-07 to 2021-07
Figure 4. Normalized Close Price for ETH-USDT in Test Data

 Figure 5. Performance of The k-NN Model for ETH-USDT in Test Data

Figure 6. Performance of The XGB Model for ETH-USDT in Test Data
Figure 7. Performance of The Random Forest Model for ETH-USDT in Test Data

 Testing Accuracy 0.519900 Testing Accuracy 0.547264

 Net Profit 575.810 Net Profit 860.940

 Number of Winning Trades 105 Number of Winning Trades 120

 Number of Losing Trades 82 Number of Losing Trades 90

 Total Days in Test 66 Total Days in Test 66

Percent of Profitable Trades 56.15% Percent of Profitable Trades 57.14%

 Avg Win Trade 29.680 Avg Win Trade 36.302

 Avg Los Trade -30.983 Avg Los Trade -38.836

 Largest Win Trade 177.820 Largest Win Trade 174.820

 Largest Los Trade -161.700 Largest Los Trade -158.100

 Profit Factor 1.23 Profit Factor 1.25

Table 1. Information Regarding k-NN Test on ETH-USDT Table 2. Information Regarding XGB Test on ETH-USDT
Testing Accuracy 0.562189

 Net Profit 672.80

Number of Winning Trades 166

 Number of Losing Trades 125

 Total Days in Test 66

Percent of Profitable Trades 57.04%

 Avg Win Trade 29.782

 Avg Los Trade -34.168

 Largest Win Trade 135.050
 Figure 9. Distribution of Profits for XGB in ETH-USDT
 Largest Los Trade -158.100

 Profit Factor 1.16
Table 3. Information Regarding Random F Test on ETH-
 USDT

 Figure8. Distribution of Profits for k-NN on ETH-USDT Figure 10. Distribution of Profits for Random Forest on ETH-USDT
B. LTC-BTC

 Figure 11. Close Price for LTC-BTC from 2017-07 to 2021-07

 Figure 12. Normalized Return for LTC-BTC from 2017-07 to 2021-07
Figure 13. Normalized Close Price for LTC-BTC in Test Data

Figure 14. Performance of The k-NN Model for LTC-BTC in Test Data

Figure 15. Performance of The XGB Model for LTC-BTC in Test Data
Figure 16. Performance of The Random Forest Model for LTC-BTC in Test Data

 Testing Accuracy 0.585956 Testing Accuracy 0.520581

 Net Profit 0.0005090 Net Profit 0.0006720

Number of Winning Trades 46 Number of Winning Trades 88

 Number of Losing Trades 40 Number of Losing Trades 91

 Total Days in Test 66 Total Days in Test 66

Percent of Profitable Trades 53.49% Percent of Profitable Trades 49.16%

 Avg Win Trade 0.00006 Avg Win Trade 0.00004

 Avg Los Trade -0.00005 Avg Los Trade -0.00003

 Largest Win Trade 0.00024 Largest Win Trade 0.00024

 Largest Los Trade -0.00019 Largest Los Trade -0.00024

 Profit Factor 1.24 Profit Factor 1.22

Table 4. Information Regarding k-NN Test on LTC-BTC Table 5. Information Regarding XGB Test on LTC-BTC
Testing Accuracy 0.467312

 Net Profit 0.0004430

Number of Winning Trades 71

 Number of Losing Trades 65

 Total Days in Test 66

Percent of Profitable Trades 52.21%

 Avg Win Trade 0.00006

 Avg Los Trade -0.00006

 Largest Win Trade 0.00027

 Largest Los Trade -0.00029

 Profit Factor 1.12 Figure 18. Distribution of Profits for XGB in LTC-BTC

Table 5. Information Regarding Random Forest Test on
 LTC-BTC

 Figure 19. Distribution of Profits for k-NN in LTC-BTC Figure 20. Distribution of Profits for Random Forest in LTC-BTC
C. ZEC-BTC

 Figure 4.
 Normalized Close
 Price for ETH-
 Figure 20. Close Price for ZEC-BTC from 2017-07 to 2021-07

 USDT in Test
 Data

 23. Performance of The k-NN Model for ZEC-BTC for
 The Test Data

 Figure 21. Normalized Return for ZEC-BTC from 2017-07 to 2021-07
Figure 22. Normalized Close Price for ZEC-BTC in Test Data

 Figure 23. Performance of The k-NN Model for ZEC-BTC in Test Data

Figure 24. Performance of The XGB Model for ZEC-BTC in Test Data
Figure 25. Performance of The Random Forest Model for ZEC-BTC in Test Data

 Testing Accuracy 0.521277 Testing Accuracy 0.518617
 Net Profit 0.0003430 Net Profit 0.000293
Number of Winning Trades 21 Number of Winning Trades 46
 Number of Losing Trades 22 Number of Losing Trades 49
 Total Days in Test 66 Total Days in Test 66
Percent of Profitable Trades 48.84% Percent of Profitable Trades 48.42%
 Avg Win Trade 0.00004 Avg Win Trade 0.00005
 Avg Los Trade -0.00002 Avg Los Trade -0.00004
 Largest Win Trade 0.00015 Largest Win Trade 0.00045
 Largest Los Trade -0.00010 Largest Los Trade -0.00021
 Profit Factor 1.63 Profit Factor 1.14

Table 7. Information Regarding k-NN Test on ZEC-BTC Table 6. Information Regarding XGB Test on ZEC-BTC
Testing Accuracy 0.510638

 Net Profit 0.0007550

 Number of Winning Trades 87

 Number of Losing Trades 85

 Total Days in Test 66

 Percent of Profitable Trades 50.58%

 Avg Win Trade 0.00004

 Avg Los Trade -0.00004

 Largest Win Trade 0.00020 Figure 27. Distribution of Profits for XGB on ZEC-BTC

 Largest Los Trade -0.00014

 Profit Factor 1.25

Table 9. Information Regarding Random Forest Test on ZEC-BTC

 Figure 26. Distribution of Profits for k-NN on ZEC-BTC Figure 28. Distribution of Profits for Random Forest on ZEC-BTC
VI. DISCUSSION “The efficient market hypothesis (EMH) is a back-
 In this section we discuss how our models have breaker for forecasters. In its crudest form it
been performing through different market effectively says that the series we would very much
conditions, we also delve into the question “Have our like to forecast, the returns from speculative assets,
models beaten the market?”. We talk about how are unforecastable. The EMH was proposed based on
these results challenge the Efficient Market the overpowering logic that if returns were
Hypothesis (EMH) in the context of cryptocurrenc y forecastable, many investors would use them to
markets and how one can implement practically generate unlimited profits. The behaviour of market
these models and exploit the market. We also note participants induce returns that obey the EMH,
the limitations and differences between response otherwise there would exist a ‘money-machine’
times of our models. producing unlimited wealth, which cannot occur in a
 All our three studied cryptocurrency pairs show stable economy.” (Timmermann and Granger 1) The
different market conditions through our models train point here is, what if some patterns exist in the
phases (i.e. all of them have bullish, bearish and market dynamics but are not visible to ordinary users
range movements), although frequency of these and they could only be discovered through artific ia l
moves are not equal and this could make effects on intelligence based systems? If that would be the case,
the results. Let’s compare test results on late April it’s obvious that our formulation of EMH should
2021 fall of ETH-USDT. By comparing Fig 2 and change accordingly. Maybe the hidden patterns
Fig 3 we see k-NN based strategy has not fallen in inside a market can be exploited to some extent and
equity during that span, but figures 4 and 5 shows this extent is determined by the behaviour of the
that XGB and Random Forest have fallen there, exploiters. But of course due to laws of
although the overall smoothness of the last two thermodynamics there will be a limit for this exploit.
models is better. Again, if we take Fig 22 as a It can be definitely said due to the second law of
reference and compare figures 23 and 25 with it, we thermodynamics, a system’s entropy increases and
see how models have avoided bearish markets. this eventually makes that system unstable for
Figure 16 shows a model where, although being exploitation.
positive in the final returns, does not look good for There were two important factors of tuning these
practical usage. Cumulative results in 66 days for all models: Hyper parameters and Labelling Sensitivity
models show a positive return, but is this positive Threshold. Each discussed model has its own hyper
return because of the market or because of our parameters and changing them affected the results
models? significantly. Labelling Sensitivity Threshold was
 To discuss the above question, we look at what another consequential parameter in our experiments.
would have happened if we had bought the This parameter defines to which extent the return
cryptocurrency in question right after the start of the should be, to be considered a positive return for the
test time span and we hold it till the last day. For model. Usually, it should be at least greater than the
demonstration purposes here we focus on ETH- exchange’s fee to denote a profitable trade, but
USDT. For ETH-USDT it means buying an ETH tweaking with it yields different results. One can use
coin for about 1577 $ and selling it for about 2757 grid searching in available values for these tunings.
$ which yields 1180 $. The point here is with all of There may be a need to reconfigure them from time
our AI based strategies we already cover this profit to time.
and our strategy’s profit is the Net Return plus this As it has been shown in this project, models
amount, because at the last step of our strategies we perform differently in different markets. Beside the
get back to whatever cryptocurrency we have started generated profit, each machine learning model can
with. We will have that coin plus whatever we have have its own pros and cons. For example, in our
gained in Net Profit. To sum up, the answer is yes, experiments, k-NN usually took about 7.5 seconds to
we beat the market (i.e. the strategy of holding) by predict the label where Random Forest took about
using discussed methods. 0.13 seconds and XGB took only 0.008 seconds.
These differences will make each of them preferable 2. Ensembling different approaches in machine
to another based on the contexts. learning to decrease the bias of the whole
 All of what has been discussed till now are system
theoretical arguments, implications of these models 3. Using social networks data streams to obtain
look very attractive but it definitely will bring up an accumulated view on public opinion on
new issues and more research needs to be done. different assets
Many exchanges nowadays allow automatic traders 4. Using Deep neural networks to feature
to act in their provided markets. One can use these extraction from raw data
exchanges data and process them inside the 5. Using Deep Reinforcement Learning to
introduced schemes and decides and trades based on design sophisticated strategies directly to
them in hope of profit. As cryptocurrency markets enhance performance
are almost always available (i.e. 24/7) using a 6. Using machine learning approaches for risk
dedicated server can find trade opportunities and acts management in a collateral system to
on them automatically. decision making
 Besides what we have discussed about financ ia l
 VII. CONCLUSIONS AND FUT URE WORKS
 markets, it seems machine learning models can be
 The impact of artificial intelligence’s applicatio ns used in many other chaotic natured problems which
in many areas are promising for a more efficient and share some of their data characteristics with financ ia l
prosperous future. In this study we looked at three data. These fields could include supply chain
different machine learning approaches to help support, Business affairs with public opinions,
investors to make their decisions in some new public views on political issues and many other use
emerging international markets in a more data driven cases.
and autonomous manner. We also addressed a
simple strategy creation framework to use these
models. Although all of our models showed positive
returns in comparison to baseline strategy (i.e.
holding the assets) and a maximum of 1.60 profit
factor for ZEC-BTC by k-NN in 66 days and a
minimum profit factor of 1.12 for LTC-BTC by
Random Forest, it’s obvious more research needs to
be done in this area. The resulting strategies still lack
“smoothness” in their equity graphs and hence
showing large potential risks to be implemented.
Designing a full autonomous trading system surely
involves more concerns than the ones we had
simplified in this research work, like market liquid ity
issues. We also discussed how these new and
uprising technological advancements can cast a
shadow on some long lasting hypothesis in finance
like Efficient Market Hypothesis.
 As we can see, there seems a predictability
potential in a highly complex system like financ ia l
markets by means of machine learning. For future
works, our suggestions include:
 1. Combining Fundamental Information with
 Technicals to improve the accuracy
VIII. REFERENCES BUST OS, O., AND A. POMARES-QUIMBAYA. “ST OCK

 MARKET MOVEMENT FORECAST : A SYST EMATIC
A KYILDIRIM , ERDINC, ET AL. “PREDICTION OF
 REVIEW .” EXPERT S YSTEMS WITH APPLICATIONS, VOL .
CRYPT OCURRENCY RETURNS USING MACHINE
 156, 2020.
LEARNING.” ANNALS OF OPERATIONS RESEARCH, VOL.
 CHEN, TIANQI , AND CARLOS GUEST RIN. “XGBOOST :
297, 2021, PP . 3–36.
 A SCALABLE T REE BOOST ING SYST EM.” PROCEEDINGS
A LESSANDRET TI , LAURA, ET AL. “A NTICIPATING
 OF THE 22 ND ACM SIGKDD INTERNATIONAL
CRYPT OCURRENCY PRICES USING MACHINE
 CONFERENCE ON KNOWLEDGE DISCOVERY AND DATA
LEARNING.” C OMPLEXITY, 2018.
 MINING, 2016.
A LKHAT IB, KHALID, ET AL. “ST OCK PRICE
 CHEN, TIANQI , AND TONG HE. XGBOOST: EXTREME
PREDICTION USING K-NEAREST NEIGHBOR (KNN)
 GRADIENT BOOSTING . R PACKAGE VERSION 0.4-2 1.4.
ALGORIT HM.” INTERNATIONAL JOURNAL OF BUSINESS ,
 2015.
HUMANITIES AND TECHNOLOGY, VOL. 3, NO. 3, 2013,
 CHEN, YINGJUN, AND YONGT AO HAO. “A FEAT URE
PP . 32-44.
 WEIGHT ED SUPPORT VECTOR MACHINE AND K-
A LMASHAQBEH, GHADA, ET AL. “M ICROCASH:
 NEAREST NEIGHBOR ALGORITHM FOR ST OCK MARKET
PRACT ICAL CONCURRENT PROCESSING OF
 INDICES PREDICTION .” EXPERT S YSTEMS WITH
M ICROPAYMENTS.” LECTURE NOTES IN COMPUTER
 APPLICATIONS , VOL. 80, 2017, PP . 340-355.
S CIENCE, VOL. 12059, 2020.
 CHEN, ZHESHI , ET AL. “BIT COIN PRICE PREDICTION
A RCHANA, S., AND K. ELANGOVAN. “SURVEY OF
 USING MACHINE LEARNING: A N APPROACH TO
CLASSIFICAT ION T ECHNIQUES IN DAT A MINING.”
 SAMPLE DIMENSION ENGINEERING.” JOURNAL OF
INTERNATIONAL JOURNAL OF COMPUTER S CIENCE AND
 COMPUTATIONAL AND APPLIED MATHEMATICS, VOL.
MOBILE APPLICATIONS, VOL. 2, NO. 2, 2014, PP . 65-71.
 365, 2020.
BAHRAMMIRZAEE , A RASH. “A COMPARATIVE SURVEY
 FIX, AND EVELYN. DISCRIMINATORY ANALYSIS :
OF ART IFICIAL INTELLIGENCE APPLICATIONS IN
 NONPARAMETRIC DISCRIMINATION, CONSISTENCY
FINANCE : ART IFICIAL NEURAL NETWORKS, EXPERT
 PROPERTIES . VOL. 1, USAF SCHOOL OF A VIAT ION
SYST EM AND HYBRID INT ELLIGENT SYST EMS.”
 M EDICINE, 1985.
NEURAL COMPUTING AND APPLICATIONS, VOL. 19, NO.
 FRIEDMAN, JEROME, ET AL. THE ELEMENTS OF
8, 2010, PP . 1165-1195.
 STATISTICAL LEARNING. VOL. 1, NEW YORK, SPRINGER

 SERIES IN ST AT IST ICS, 2001.
FRIEDMAN, JEROME H. “GREEDY FUNCT ION COMPUTATIONAL METHODS IN ENGINEERING, VOL. 28,

APPROXIMATION: A GRADIENT BOOSTING MACHINE .” 2021, PP . 1069–1101.

ANNALS OF STATISTICS, VOL. 29, NO. 5, 2001, PP . 1189- LI, CHENG. A GENTLE INTRODUCTION TO GRADIENT

1232. BOOSTING. COLLEGE OF COMPUT ER AND

FRIEDMAN, JEROME H., ET AL. “10. BOOST ING AND INFORMAT ION SCIENCE, NORT HEAST ERN

A DDIT IVE TREES.” THE ELEMENTS OF S TATISTICAL UNIVERSIT Y,

LEARNING, 2ND ED., SPRINGER, 2009, PP . 337–384. HT T P:// WWW.CHENGLI .IO/TUTORIALS/ GRADIENT _ BOO

HILEMAN, ET AL. GLOBAL CRYPTOCURRENCY ST ING.PDF. A CCESSED 24 4 2021.

BENCHMARKING STUDY. VOL. 33, CAMBRIDGE CENT RE OBT HONG, M EHT ABHORN, ET AL. “A SURVEY ON

FOR A LT ERNATIVE FINANCE , 2017. M ACHINE LEARNING FOR ST OCK PRICE PREDICT ION:

HO, TIN KAM. “RANDOM DECISION FOREST S.” A LGORIT HMS AND TECHNIQUES.” PROCEEDINGS OF

PROCEEDINGS OF 3 RD INTERNATIONAL CONFERENCE ON THE 2 ND INTERNATIONAL CONFERENCE ON FINANCE ,

DOCUMENT ANALYSIS AND RECOGNITION, VOL . 1, 1995, ECONOMICS , MANAGEMENT AND IT BUSINESS , 2020.

PP . 278-282. SCITEPRESS - S CIENCE AND TECHNOLOGY

HO, TIN KAM. “THE RANDOM SUBSPACE MET HOD FOR PUBLICATIONS . A CCESSED 22 4 2021.

CONST RUCT ING DECISION FORESTS.” IEEE PEDREGOSA, FABIAN, ET AL. “SCIKIT-LEARN:

TRANSACTIONS ON PATTERN ANALYSIS AND MACHINE M ACHINE LEARNING IN PYT HON.” THE JOURNAL OF

INTELLIGENCE , VOL. 20, NO. 8, 1998, PP . 832-844. MACHINE LEARNING RESEARCH , VOL . 12, 2011, PP .

JADHAV, SAYALI D., AND H. P. CHANNE. 2825-2830.

“COMPARAT IVE STUDY OF K-NN, NAIVE BAYES AND PIRYONESI , S. M ADEH, AND TAMER E. EL-DIRABY.

DECISION TREE CLASSIFICAT ION TECHNIQUES.” “DAT A A NALYTICS IN A SSET M ANAGEMENT : COST -

INTERNATIONAL JOURNAL OF S CIENCE AND RESEARCH EFFECT IVE PREDICT ION OF THE PAVEMENT

(IJSR), VOL. 5, NO. 1, 2016, PP . 1842 - 1845. CONDIT ION INDEX.” JOURNAL OF INFRASTRUCTURE

JAMES, GARET H, ET AL. AN INTRODUCTION TO S YSTEMS , VOL. 26, NO. 1, 2019.

S TATISTICAL LEARNING WITH APPLICATIONS IN R. NEW PIRYONESI , S. M ADEH, AND TAMER E. EL-DIRABY.

YORK, NY, SPRINGER, 2013. “ROLE OF DAT A A NALYTICS IN INFRAST RUCT URE

KUMAR, GOURAV, ET AL. “ST OCK M ARKET A SSET M ANAGEMENT : OVERCOMING DAT A SIZE AND

FORECAST ING USING COMPUT ATIONAL QUALIT Y PROBLEMS.” JOURNAL OF TRANSPORTATION

INT ELLIGENCE: A SURVEY.” ARCHIVES OF ENGINEERING, VOL. 146, NO. 2, 2020.
PIRYONESI , S. M ADEH, AND TAMER E. EL-DIRABY.

“USING M ACHINE LEARNING T O EXAMINE IMPACT OF

TYPE OF PERFORMANCE INDICATOR ON FLEXIBLE

PAVEMENT DET ERIORATION M ODELING.” JOURNAL

OF INFRASTRUCTURE S YSTEMS , VOL. 27, NO. 2, 2021.

PRADEEPKUMAR, DADABADA, AND VADLAMANI

RAVI. “FORECAST ING FINANCIAL TIME SERIES

VOLAT ILITY USING PARTICLE SWARM OPTIMIZATION

T RAINED QUANTILE REGRESSION NEURAL NETWORK.”

APPLIED S OFT COMPUTING, VOL. 58, 2017, PP . 35-52.

TIMMERMANN, A LLAN, AND CLIVE W.J. GRANGER.

“EFFICIENT MARKET HYPOTHESIS AND

FORECAST ING.” INTERNATIONAL JOURNAL OF

FORECASTIN, VOL. 20, 2004, PP . 15-27.

“TODAY'S CRYPT OCURRENCY PRICES BY M ARKET

CAP .” COIN MARKET CAP,

HT T PS:// COINMARKETCAP.COM/. A CCESSED 21 4

2021.

“TOP CRYPT OCURRENCY SPOT EXCHANGES.” COIN

MARKET CAP,

HT T PS:// COINMARKETCAP.COM/ RANKINGS/ EXCHANGE

S/. A CCESSED 24 4 2021.
APPENDIX A: USED TECHNICAL We have used this indicator in 14 and 30 periods
 in this project.
 INDICATORS AND THEIR FORMULAS

 In this appendix we introduce the technica l Directional Movement Index (DMI):
indicators used in this project and their respective
formulas. | + − − |
 = ( + ) ∗ 100
 | + − |
 where:
 ℎ ( + )
 Commodity Channel Index (CCI): + = ( ) ∗ 100

 −
 ℎ ( − )
 − = ( ) ∗ 100
 =
 0.015 ∗ + ( ) = ℎ − ℎ
 where: −( ) = −
 =

 = ∑(( ℎ + + )/3) ∑
 =1
 =1 ℎ ( ) = ∑ − +
 =
 =1
 = =

 We have used this indicator with period=14 in this
 = (∑ )/ project.
 =1

 = (∑ | − | )/
 =1
 We have used this indicator in 14 and 30 periods Moving Average Convergence Divergence
in this project. (MACD):

 = 12 − 26

 Relative Strength Index (RSI):
 Bollinger Band®:
 100
 = 100 − [ ] +
 =
 1+
 2
 The average gain or loss used in the calculation is = ( , ) + ∗ [ , ]
the average percentage gain or loss during a look- = ( , ) − ∗ [ , ]
back period. The formula uses a positive value for where:
the average loss. =
 Once there is first step data available, the second =
part of the RSI formula can be calculated. The =
second step of the calculation smooths the results: ( ) = ( ℎ + + )/3
 = ℎ ( 20)
 = ( 2)
 [ , ] =
 100
 = 100 − [ ( ∗ ( − 1)) +
 ]
 1+
 −(( ∗ ( − 1)) + )
You can also read