Evaluation of a Parsimonious COVID-19 Outbreak Prediction Model: Heuristic Modeling Approach Using Publicly Available Data Sets - Journal of ...
←
→
Page content transcription
If your browser does not render page correctly, please read the page content below
JOURNAL OF MEDICAL INTERNET RESEARCH                                                                                                           Gupta et al

     Original Paper

     Evaluation of a Parsimonious COVID-19 Outbreak Prediction
     Model: Heuristic Modeling Approach Using Publicly Available Data
     Sets

     Agrayan K Gupta1,2; Shaun J Grannis2,3, MD, MS; Suranga N Kasthurirathne2,3, PhD
     1
      Indiana University, Bloomington, IN, United States
     2
      Center for Biomedical Informatics, Regenstrief Institute, Indianapolis, IN, United States
     3
      School of Medicine, Indiana University, Indianapolis, IN, United States

     Corresponding Author:
     Agrayan K Gupta
     Indiana University
     107 S Indiana Ave
     Bloomington, IN, 47405
     United States
     Phone: 1 812 855 4848
     Email: aggupta@iu.edu

     Abstract
     Background: The COVID-19 pandemic has changed public health policies and human and community behaviors through
     lockdowns and mandates. Governments are rapidly evolving policies to increase hospital capacity and supply personal protective
     equipment and other equipment to mitigate disease spread in affected regions. Current models that predict COVID-19 case counts
     and spread are complex by nature and offer limited explainability and generalizability. This has highlighted the need for accurate
     and robust outbreak prediction models that balance model parsimony and performance.
     Objective: We sought to leverage readily accessible data sets extracted from multiple states to train and evaluate a parsimonious
     predictive model capable of identifying county-level risk of COVID-19 outbreaks on a day-to-day basis.
     Methods: Our modeling approach leveraged the following data inputs: COVID-19 case counts per county per day and county
     populations. We developed an outbreak gold standard across California, Indiana, and Iowa. The model utilized a per capita running
     7-day sum of the case counts per county per day and the mean cumulative case count to develop baseline values. The model was
     trained with data recorded between March 1 and August 31, 2020, and tested on data recorded between September 1 and October
     31, 2020.
     Results: The model reported sensitivities of 81%, 92%, and 90% for California, Indiana, and Iowa, respectively. The precision
     in each state was above 85% while specificity and accuracy scores were generally >95%.
     Conclusions: Our parsimonious model provides a generalizable and simple alternative approach to outbreak prediction. This
     methodology can be applied to diverse regions to help state officials and hospitals with resource allocation and to guide risk
     management, community education, and mitigation strategies.

     (J Med Internet Res 2021;23(7):e28812) doi: 10.2196/28812

     KEYWORDS
     coronavirus; COVID-19; emerging outbreak; modeling disease outbreak; precision public health; predictive modeling

                                                                                  a pandemic with over 118,000 confirmed cases and 4291 deaths
     Introduction                                                                 in over 114 countries [4]. To date, the pandemic has resulted
     Background                                                                   in over 170 million confirmed cases, with over 3.5 million
                                                                                  deaths globally [5]. In the United States, 33 million people have
     The COVID-19 pandemic has impacted the health and                            had COVID-19 and more than 600,000 lives have been lost [5].
     well-being of individuals, communities, and economies
     worldwide at a hitherto unprecedented scale [1-3]. On March                  At the height of the pandemic, waves of viral outbreaks placed
     11, 2020, the World Health Organization declared COVID-19                    health systems across the globe under extended strain, leading

     https://www.jmir.org/2021/7/e28812                                                                    J Med Internet Res 2021 | vol. 23 | iss. 7 | e28812 | p. 1
                                                                                                                         (page number not for citation purposes)
XSL• FO
RenderX
JOURNAL OF MEDICAL INTERNET RESEARCH Gupta et al
to shortages in hospital beds, personal protective equipment, Objective
and health care personnel, which caused significant disruptions We seek to leverage various readily accessible data sets
to health care delivery and loss of life [2,6]. Experts have extracted from multiple states to train and evaluate a
estimated the cumulative financial costs of the COVID-19 parsimonious predictive model capable of identifying the
pandemic related to lost output and health reduction at US $16 county-level risk of COVID-19 outbreaks on a day-to-day basis.
trillion, or approximately 90% of the annual gross domestic
product of the United States [7]. Methods
In contrast with historical pandemics, the availability of public
and population health information systems has enabled Methods Overview
researchers to collaborate on many research activities in We selected 3 states for our efforts in COVID-19 outbreak
response to COVID-19 [8,9]. Since the onset of the pandemic, prediction modeling: California, Indiana, and Iowa. These states
data scientists have collaborated with governmental were selected on the basis of geographical factors, governmental
organizations to create various public-facing COVID-19 regulations, and availability of data sets for public use. For
dashboards that provide easy access to descriptive statistics and example, Indiana and Iowa are similar in the number of counties
other metrics [10,11]. Information on COVID-19–related and total populations [26]. In contrast, California represented
mortality, utilization of health care resources, and recovery has a more populous, urbanized state [26]. We also considered the
been crucial in increasing situational awareness to inform general completeness of reporting, the quality of basic
ongoing pandemic response efforts across communities [12,13]. COVID-19 data sources, and the accuracy of state tracking
systems [27].
Most recently, COVID-19 infection rates have started to
decrease in response to increased vaccination and efforts in Data Extraction and Cleaning
public education [14,15]. To date, 40% of the population of the For each state, we extracted a variety of county-level data
United States is fully vaccinated [16]. These improvements elements captured daily between March 1 and October 31, 2020.
have led to an interest in relaxing or revoking various restrictions Data for Indiana were obtained from the Indiana State
enforced at the state and county levels. While important to the Department of Health, while data for Iowa and California were
well-being of both communities and economies, such decisions obtained from the New York Times web-based repository [5,28].
may be dangerous if undertaken without adequate preplanning We selected March 1, 2020, as a start date as most states began
and awareness of potential risks. As such, effective identification collecting COVID-19 data at this time. October 31, 2020,
of potential outbreaks of COVID-19 offers the ability to inform marked the end of our analysis time period. Each data set was
decision-makers across governmental and public health sectors organized by county, state, and date reported using R [29].
on how to resume normal day-to-day activities in their Several errors or omissions in the data sets were addressed as
communities and deploy limited human and treatment resources follows: days with negative case counts were changed to 0 and
to where they are most needed [17]. a county labeled as “unknown” reported by Iowa and California
Previous studies have demonstrated the potential to apply were removed from further evaluation.
analytical models to identify potential outbreaks in response to
Preparation of a Gold Standard
other diseases [18]. However, these methods rely on large,
complex data sets extracted from a specific health system or We created a gold standard indicating if each county under study
region [19-21]. Such data sets may be challenging and was in an outbreak on any particular day. A human expert
time-consuming to collect, leading to delays in generating timely reviewer created the gold standard by assigning an outbreak
predictions. Further, models trained using locale-specific data label (with responses of “yes” or “no”) to each county or date
sets may not be generalizable across other locations [22], combination, considering the following criteria:
hindering the potential of reusing such models across other 1. How do case counts trend in each county? Is there a general
patient populations and regions. A variety of models are trained baseline of cases over time?
using complex algorithmic approaches such as neural networks 2. How large is the county’s population size (counties with
and deep learning models. Such machine learning approaches more people report more cases)?
may yield superior results but fail to achieve widespread 3. Duration of the outbreak to assign a binary indicator of
acceptance [23] owing to challenges in explainability and “outbreak detected” or “outbreak not detected” to each day
interpretation [24]. and county.
In contrast, a less complex modeling approach that uses a subset Based on our approach, a county could have multiple outbreaks
of easily obtainable key elements widely captured across broad over time. Outbreaks lasted a minimum of 3 days to account
geographic regions may be less challenging to develop. Further, for testing lags as data were not always reported on the same
such models may also deliver adequate predictive performance day, especially during the initial phases of the pandemic [30].
without sacrificing explainability and interpretability. Such Furthermore, lower case counts at the end of an outbreak and
parsimonious models may also present less risk of overfitting on weekends owing to the closure of testing centers were also
on training data sets, thus allowing for greater generalizability considered using 7-day average metrics.
[25].
https://www.jmir.org/2021/7/e28812 J Med Internet Res 2021 | vol. 23 | iss. 7 | e28812 | p. 2
(page number not for citation purposes)
XSL• FO
RenderXJOURNAL OF MEDICAL INTERNET RESEARCH Gupta et al
Model Building detected” days. Our logarithmic graph semiaccurately depicted
We created a heuristic outbreak prediction model using the a horizontal line that separated outbreak days. The following
training data sets obtained from all 3 states and evaluated its steps were undertaken to leverage and apply the trendline results
performance across the holdout test data sets and the gold on states and counties with various populations.
standard. For each county, data collected between March 1 and We started building the model by dividing counties on the basis
August 31, 2020, were considered the training data set, while of population size, initially at 100,000 population intervals.
data collected between September 1 and October 31, 2020, were Since Case Rate is more sensitive to less populated counties,
considered the test data set. As a preliminary step toward model we added intervals for counties with less than 100,000 people.
development, we considered features used in other common Each population interval was allocated an assigned Case Rate
models, including the susceptible-infected-recovered epidemic baseline value that served as a binary indicator for outbreak
[31] and time delay [32] models, severity of lockdown measures determination. We implemented a criterion where an outbreak
[33], cumulative cases (both reported and not reported) [34], was underway in counties if they were 4 SDs above the
and daily test reports [35]. Furthermore, predictive models for cumulative case count mean to account for data lag. As depicted
infectious diseases, such as susceptible-infected-recovered in the system flow diagram (Figure 1), we established these
models, provide guidance on disease transmission and outbreak parameter values and trained the model rules with the training
causation. The State of Wisconsin’s COVID-19 dashboard used data sets (data reported between March 1 and August 31, 2020).
a Case Rate metric defined as a per capita running 7-day sum The train-to-test partition was approximately 71% to 29%,
of the case counts per county per day [36]. Case Rate respectively, which is close to optimal for large data sets [37].
standardizes COVID-19 severity across counties of differing Then, the model was tested against the gold standard with the
populations while also accounting for data lags and providing test data sets (data reported between September 1 and October
insight on transmission. We plotted Case Rate vs Indiana county 31, 2020). Figure 1 shows a flow diagram depicting our study
populations to generate a general trendline that could approach.
differentiate between “outbreak detected” or “outbreak not
Figure 1. Flow diagram providing an overview of the study methodology.
people. However, Indiana has more midsized counties with its
Results largest county having almost 1 million people, while California
Results Overview has several counties having populations of more than 1 million
people. Moreover, California has the highest percentage of the
We collected data on a total of 249 counties from across all 3 urban population (94.95%), with Indiana (72.44%) and Iowa
states. Table 1 presents descriptive statistics for each state, (64.02%) far behind.
including the number of counties, population sizes, and
urbanization to highlight each state’s fundamental differences Figure 2 provides an example visualization of outbreak
[26]. Previous studies have identified multiple factors in determination in Cass County, Indiana, and Santa Barbara
determining urban vs rural areas, including the total population, County, California, for gold standard preparation. Cass and
population density, and commuting flow [38]. Santa Barbara counties have populations of 37,689 and 446,499
people, respectively [26].
Indiana and Iowa have similar county population distributions,
with both having a majority of counties with less than 100,000
https://www.jmir.org/2021/7/e28812 J Med Internet Res 2021 | vol. 23 | iss. 7 | e28812 | p. 3
(page number not for citation purposes)
XSL• FO
RenderXJOURNAL OF MEDICAL INTERNET RESEARCH Gupta et al
Table 1. State and county population sizes and population statistics based on census counts.
Census counts Indiana Iowa California
County-level statistics
Counties, n 92 99 58
Counties where population isJOURNAL OF MEDICAL INTERNET RESEARCH Gupta et al
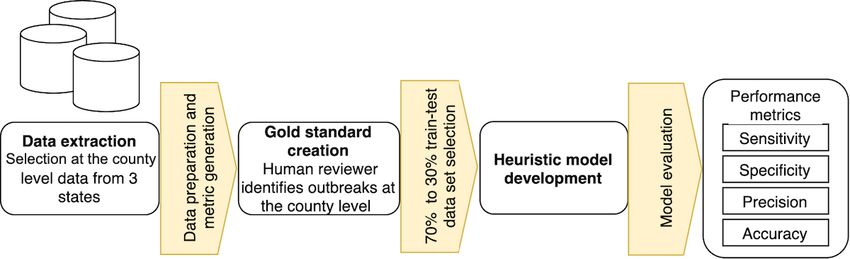
1. For the specified population band, a county’s case rate on 3. If a county met either requirement on a specific day, that
a given day was greater than the minimum case rate county was considered to be “in outbreak.”
assigned to that population.
2.
By combining these rules with the previously developed gold
The county’s case count on a specific day was greater than
standard, a confusion matrix was utilized to analyze the model’s
12 and was 4 SDs above the rolling mean county-level
performance.
COVID-19 case count.
Figure 3. Decision-making process of our heuristic model.
Table 3 shows the results of the confusion matrix when the straightforward to detect than true positives. Model sensitivity
prediction model was applied to the curated gold standard during for Indiana and Iowa was 10% greater than that of California.
the test date range from September 1 to October 31, 2020. However, their precision was 11% and 7% lower, respectively.
Sensitivity is the proportion of correctly identified positives, For Indiana and Iowa, this implies that the model computed
while specificity is the proportion of correctly identified fewer false-negative readings, which could be attributed to
negatives. All 4 key confusion matrix statistics—sensitivity, having increasingly prolonged outbreaks (Table 1). California’s
specificity, precision, and accuracy—were above 80% in each higher precision but lower sensitivity implies that the model
state during the test range. Model specificity and accuracy were was more precise in predicting when outbreaks occurred but
>94% for each state. This was attributed to most days being less successful in capturing all outbreaks.
classified as true negatives, which are fundamentally more
Table 3. Results of the model with the test data set relative to the gold standard.
Performance parameters Indiana Iowa California
Test date range September 1 to October 31, 2020 September 1 to October 31, 2020 September 1 to October 31, 2020
Sensitivity, % 92.33 90.05 80.86
Specificity, % 95.56 97.40 99.57
Precision, % 85.04 89.83 96.96
Accuracy, % 94.86 95.91 96.85
https://www.jmir.org/2021/7/e28812 J Med Internet Res 2021 | vol. 23 | iss. 7 | e28812 | p. 5
(page number not for citation purposes)
XSL• FO
RenderXJOURNAL OF MEDICAL INTERNET RESEARCH Gupta et al
limited reported systems. It is also an understandable and
Discussion accurate method to relay a county’s current state of COVID-19
Principal Findings to the general public, who are not as informed in health metrics.
In addition to public and internal communication, forecasting
Our efforts resulted in the development of a heuristic model models can be applied to aid in outbreak preparation and
capable of detecting COVID-19 outbreaks, with predictive community mitigation methods [45].
measures between 80% and 99%. The model had sensitivities
of 92%, 90%, and 81% for Indiana, Iowa, and California, In addition to a high-performing heuristic model, our efforts
respectively. This indicates that the model was capable of also led to the development of a well-curated gold standard data
identifying a clear majority of outbreaks across each state. The set consisting of outbreak status for each county on a day-to-day
model also reported precision scores of 85%, 89%, and 96% basis. This data set is shown in Multimedia Appendix 2 to
for Indiana, Iowa, and California, respectively, which indicated facilitate additional studies on this important issue.
that most positive predictions made by the model were accurate. Limitations
These performance metrics indicate that the model is fit for use
in real-life settings. Additionally, the training and test periods Our study was impacted by limitations in data collection systems
displayed distinct outbreak characteristics owing to the increased currently deployed by each state. The inconsistency of data
spread of COVID-19. reporting presented a significant systematic challenge for model
building activities. For instance, states closed most COVID-19
These performance metrics are also notable, considering that testing centers on weekends, which led to lower case count
the prevalence of outbreaks in training data sets was values on Saturdays and Sundays. Further, many states did not
considerably low and could have resulted in weak predictive publish most of their own COVID-19 data, which led us to
models had we used more traditional classification-based obtain data on cases per day per county from the New York
modeling approaches, which significantly underperform when Times instead of a state’s Department of Health, the latter being
trained using unbalanced data sets [39,40]. As the pandemic more accurate. The New York Times would retroactively change
progressed, each state attempted to enhance their data reporting case data, making it more unreliable since there were days with
systems. As described by Khakharia et al [41], some regions negative values.
reported sudden and significant changes in case counts, making
it difficult for models to forecast future cases. Though outbreaks The lack of previous studies on curating gold standards on
are not fundamentally different, the training and test data sets disease outbreaks also presents limitations. With no industry
can be characterized separately. Despite the test range being standard on defining an outbreak, we created the gold standard
shorter, Indiana and Iowa both reported twice as many outbreaks on the basis of intuition and the aforementioned specified
during the test period. This can be attributed to the second wave criteria. Therefore, this process could have been subject to
of COVID-19 that occurred during the test period as schools potential confounders, which may have influenced our model’s
resumed, governors relaxed state lockdown laws, and people results. Furthermore, the rule-based model approach is subject
returned to work [42]. For example, California was one of the to several limitations. Since the model incorporated a 7-day
last states to begin lifting restrictions in midsized and large moving Case Rate, there was a lag at the tails of outbreaks as
counties, which may have contributed to relatively fewer the increased case counts were not initially detected. Even with
outbreaks than those in Indiana and Iowa [43,44]. Thus, counties a parsimonious approach, the parameters derived from our
re-entered or for the first time realized outbreak periods during results can greatly differ when applied to other regions. This
the test period. uncertainty, resulting from parameters, social mandates, and
vaccination, is a feature of any prediction model. We helped
California remains a state of interest owing to the lessen this uncertainty through our generalizable approach
characterization of its outbreaks as well as predictive demonstrated in diverse states.
performance results on the holdout test data set. Unlike Indiana
and Iowa, California has several counties with populations of Future Prospects
over 1,000,000 people; furthermore, it was the only state with The ongoing COVID-19 pandemic has led most major
fewer outbreaks and a low percentage of outbreak days between institutions to allocate tremendous resources for its resolution.
the training and test periods. The California model revealed a The model would benefit from a larger sample size of US states,
significantly lower sensitivity but higher precision. Thus, to and possibly regions worldwide, to test its generalizability on
Indiana and Iowa, the California model captured proportionally a more expansive scale. Additionally, we could expand the
fewer outbreaks but predicted the subset with greater precision. model’s data range for the third wave of cases and as the
COVID-19 vaccine is distributed to a majority of the population,
This parsimonious prediction model is easily replicable in other
to determine its functionality beyond the scope of this study.
states, as it only utilizes county population and COVID-19 cases
Our results could also be translated to provide a clearer
per day per county data. States can detect and predict outbreaks
epidemiological outlook of diseases. Since the model can predict
with high accuracy by following the model’s rules. Current
outbreaks with high accuracy, it could be tested on historical
outbreak prediction approaches are based on machine learning
COVID-19 data to determine when most outbreaks occurred
algorithms. Though they generally have very high accuracies,
easily in a particular region. Moreover, trends and patterns were
these models incorporate a variety of data points and can overfit
found across outbreaks among various factors such as lockdown
models [22]. The heuristic model’s data simplicity enables it to
policies, air pollution levels, and civilian obedience.
be easily implemented in other regions, especially those with
https://www.jmir.org/2021/7/e28812 J Med Internet Res 2021 | vol. 23 | iss. 7 | e28812 | p. 6
(page number not for citation purposes)
XSL• FO
RenderXJOURNAL OF MEDICAL INTERNET RESEARCH Gupta et al
Understanding the causes of outbreaks presents interesting minimal data inputs required, creates an explainable and
findings related to public policy adaptation in current and future easy-to-implement model that governments and policymakers
situations. can utilize to assess COVID-19 severity across diverse
geographic regions. Future studies are required to test the model
Conclusions in other states and countries by using more recent data.
This study presents an accurate, generalizable, and explainable Moreover, the model should be used to identify outbreaks to
COVID-19 outbreak prediction model. The model reported investigate correlations among external factors such as
sensitivity scores of >90% in Indiana and Iowa and >80% in socioeconomic risks, air pollution, county-level laws, and
California. Furthermore, model specificity and accuracy scores outbreak development.
were >94% in every state. These results, coupled with the
Conflicts of Interest
None declared.
Multimedia Appendix 1
Population bands with their respective minimum case rates.
[XLS File (Microsoft Excel File), 26 KB-Multimedia Appendix 1]
Multimedia Appendix 2
Outbreak gold standard for each county in California, Indiana, and Iowa per day.
[XLSX File (Microsoft Excel File), 38 KB-Multimedia Appendix 2]
References
1. Estiri H, Strasser ZH, Klann JG, Naseri P, Wagholikar KB, Murphy SN. Predicting COVID-19 mortality with electronic
medical records. NPJ Digit Med 2021 Feb 04;4(1):15 [FREE Full text] [doi: 10.1038/s41746-021-00383-x] [Medline:
33542473]
2. Hartley DM, Perencevich EN. Public Health Interventions for COVID-19: Emerging Evidence and Implications for an
Evolving Public Health Crisis. JAMA 2020 May 19;323(19):1908-1909. [doi: 10.1001/jama.2020.5910] [Medline: 32275299]
3. Baker S, Bloom N, Davis S, Terry S. COVID-Induced Economic Uncertainty. National Bureau of Economic Research.
2020. URL: https://www.nber.org/system/files/working_papers/w26983/w26983.pdf [accessed 2021-07-13]
4. McNeil D. Coronavirus Has Become a Pandemic. The New York Times. URL: https://www.nytimes.com/2020/03/11/
health/coronavirus-pandemic-who.html [accessed 2021-07-13]
5. Coronavirus (Covid-19) Data. The New York Times Developer Network. URL: https://developer.nytimes.com/covid
[accessed 2021-07-13]
6. Liu Q, Luo D, Haase JE, Guo Q, Wang XQ, Liu S, et al. The experiences of health-care providers during the COVID-19
crisis in China: a qualitative study. Lancet Glob Health 2020 Jun;8(6):e790-e798 [FREE Full text] [doi:
10.1016/S2214-109X(20)30204-7] [Medline: 32573443]
7. Cutler DM, Summers LH. The COVID-19 Pandemic and the $16 Trillion Virus. JAMA 2020 Oct 20;324(15):1495-1496
[FREE Full text] [doi: 10.1001/jama.2020.19759] [Medline: 33044484]
8. Rubin R. NIH Launches Platform to Serve as Depository for COVID-19 Medical Data. JAMA 2020 Jul 28;324(4):326.
[doi: 10.1001/jama.2020.12646] [Medline: 32720992]
9. Bennett T, Moffitt R, Hajagos J, Amor B, Anand A, Bissell MM, et al. The National COVID Cohort Collaborative: Clinical
Characterization and Early Severity Prediction. medRxiv. Preprint posted online January 23, 2021 [FREE Full text] [doi:
10.1101/2021.01.12.21249511] [Medline: 33469592]
10. Dixon B, Grannis S, McAndrews C, Broyles AA, Mikels-Carrasco W, Wiensch A, et al. Leveraging Data Visualization
and a Statewide Health Information Exchange to Support COVID-19 Surveillance and Response: Application of Public
Health Informatics. J Am Med Inform Assoc 2021 Jan 22:ocab004 [FREE Full text] [doi: 10.1093/jamia/ocab004] [Medline:
33480419]
11. Dong E, Du H, Gardner L. An interactive web-based dashboard to track COVID-19 in real time. Lancet Infect Dis 2020
May;20(5):533-534 [FREE Full text] [doi: 10.1016/S1473-3099(20)30120-1] [Medline: 32087114]
12. Jewell NP, Lewnard JA, Jewell BL. Caution Warranted: Using the Institute for Health Metrics and Evaluation Model for
Predicting the Course of the COVID-19 Pandemic. Ann Intern Med 2020 Aug 04;173(3):226-227 [FREE Full text] [doi:
10.7326/M20-1565] [Medline: 32289150]
13. Budd J, Miller BS, Manning EM, Lampos V, Zhuang M, Edelstein M, et al. Digital technologies in the public-health
response to COVID-19. Nat Med 2020 Aug;26(8):1183-1192. [doi: 10.1038/s41591-020-1011-4] [Medline: 32770165]
https://www.jmir.org/2021/7/e28812 J Med Internet Res 2021 | vol. 23 | iss. 7 | e28812 | p. 7
(page number not for citation purposes)
XSL• FO
RenderXJOURNAL OF MEDICAL INTERNET RESEARCH Gupta et al
14. Dagan N, Barda N, Kepten E, Miron O, Perchik S, Katz MA, et al. BNT162b2 mRNA Covid-19 Vaccine in a Nationwide
Mass Vaccination Setting. N Engl J Med 2021 Apr 15;384(15):1412-1423 [FREE Full text] [doi: 10.1056/NEJMoa2101765]
[Medline: 33626250]
15. Del Rio C, Malani P. COVID-19 in 2021-Continuing Uncertainty. JAMA 2021 Apr 13;325(14):1389-1390. [doi:
10.1001/jama.2021.3760] [Medline: 33662092]
16. COVID Data Tracker. Centers for Disease Control and Prevention. URL: https://covid.cdc.gov/covid-data-tracker/
#datatracker-home [accessed 2021-07-13]
17. Weissman GE, Crane-Droesch A, Chivers C, Luong T, Hanish A, Levy MZ, et al. Locally Informed Simulation to Predict
Hospital Capacity Needs During the COVID-19 Pandemic. Ann Intern Med 2020 Jul 07;173(1):21-28 [FREE Full text]
[doi: 10.7326/M20-1260] [Medline: 32259197]
18. Dai Y, Wang J. Identifying the outbreak signal of COVID-19 before the response of the traditional disease monitoring
system. PLoS Negl Trop Dis 2020 Oct;14(10):e0008758 [FREE Full text] [doi: 10.1371/journal.pntd.0008758] [Medline:
33001985]
19. Adnan M, Gao X, Bai X, Newbern E, Sherwood J, Jones N, et al. Potential Early Identification of a Large Campylobacter
Outbreak Using Alternative Surveillance Data Sources: Autoregressive Modelling and Spatiotemporal Clustering. JMIR
Public Health Surveill 2020 Sep 17;6(3):e18281 [FREE Full text] [doi: 10.2196/18281] [Medline: 32940617]
20. Tseng Y, Shih Y. Developing epidemic forecasting models to assist disease surveillance for influenza with electronic health
records. Int J Comput Appl 2019 Aug 05;42(6):616-621. [doi: 10.1080/1206212x.2019.1633762]
21. Verma M, Kishore K, Kumar M, Sondh AR, Aggarwal G, Kathirvel S. Google Search Trends Predicting Disease Outbreaks:
An Analysis from India. Healthc Inform Res 2018 Oct;24(4):300-308 [FREE Full text] [doi: 10.4258/hir.2018.24.4.300]
[Medline: 30443418]
22. Dexter G, Grannis S, Dixon B, Kasthurirathne S. Generalization of Machine Learning Approaches to Identify Notifiable
Conditions from a Statewide Health Information Exchange. AMIA Jt Summits Transl Sci Proc 2020;2020:152-161 [FREE
Full text] [Medline: 32477634]
23. Sáez C, Romero N, Conejero J, García-Gómez JM. Potential limitations in COVID-19 machine learning due to data source
variability: A case study in the nCov2019 dataset. J Am Med Inform Assoc 2021 Feb 15;28(2):360-364 [FREE Full text]
[doi: 10.1093/jamia/ocaa258] [Medline: 33027509]
24. Ghorbani A, Abid A, Zou J. Interpretation of Neural Networks Is Fragile. AAAI 2019 Jul 17;33:3681-3688. [doi:
10.1609/aaai.v33i01.33013681]
25. Vandekerckhove J, Matzke D, Wagenmakers E. Model comparisonthe principle of parsimony. In: The Oxford handbook
of computationalmathematical psychology. New York, NY: Oxford University Press; 2015:300-319.
26. County Population Totals: 2010-2019. United States Census Bureau. URL: https://www.census.gov/data/tables/time-series/
demo/popest/2010s-counties-total.html [accessed 2021-07-13]
27. State Reporting Assessments. The COVID Tracking Project. URL: https://covidtracking.com/about-data/
state-reporting-assessments [accessed 2021-07-13]
28. MPH helps Indiana fight COVID-19 with data. State of Indiana. URL: https://www.in.gov/mph/1194.htm [accessed
2021-07-13]
29. Ripley BD. The R Project in Statistical Computing. MSOR Connections 2001 Feb;1(1):23-25. [doi:
10.11120/msor.2001.01010023]
30. Maxmen A. Why the United States is having a coronavirus data crisis. Nature 2020 Sep;585(7823):13-14. [doi:
10.1038/d41586-020-02478-z] [Medline: 32843755]
31. Yoshida N, Hara T. Global stability of a delayed SIR epidemic model with density dependent birth and death rates. J Comput
Appl Math 2007 Apr 23;201(2):339-347 [FREE Full text] [doi: 10.1016/j.cam.2005.12.034]
32. DrugTherapeutics Bulletin. An introduction to patient decision aids. BMJ 2013 Jul 23;347:f4147 [FREE Full text] [Medline:
23881944]
33. Giordano G, Blanchini F, Bruno R, Colaneri P, Di Filippo A, Di Matteo A, et al. Modelling the COVID-19 epidemic and
implementation of population-wide interventions in Italy. Nat Med 2020 Jun;26(6):855-860 [FREE Full text] [doi:
10.1038/s41591-020-0883-7] [Medline: 32322102]
34. Lin Q, Zhao S, Gao D, Lou Y, Yang S, Musa SS, et al. A conceptual model for the coronavirus disease 2019 (COVID-19)
outbreak in Wuhan, China with individual reaction and governmental action. Int J Infect Dis 2020 Apr;93:211-216 [FREE
Full text] [doi: 10.1016/j.ijid.2020.02.058] [Medline: 32145465]
35. Casella F. Can the COVID-19 epidemic be controlled on the basis of daily test reports? 2020. Astrophysics Data System.
2020. URL: https://ui.adsabs.harvard.edu/abs/2020arXiv200306967C [accessed 2020-03-01]
36. COVID-19: Activity Level by Region and County. Wisconsin Department of Health Services. URL: https://www.
dhs.wisconsin.gov/covid-19/disease.htm [accessed 2021-07-13]
37. Dobbin KK, Simon RM. Optimally splitting cases for training and testing high dimensional classifiers. BMC Med Genomics
2011 Apr 08;4:31 [FREE Full text] [doi: 10.1186/1755-8794-4-31] [Medline: 21477282]
38. Hall SA, Kaufman JS, Ricketts TC. Defining urban and rural areas in U.S. epidemiologic studies. J Urban Health 2006
Mar;83(2):162-175 [FREE Full text] [doi: 10.1007/s11524-005-9016-3] [Medline: 16736366]
https://www.jmir.org/2021/7/e28812 J Med Internet Res 2021 | vol. 23 | iss. 7 | e28812 | p. 8
(page number not for citation purposes)
XSL• FO
RenderXJOURNAL OF MEDICAL INTERNET RESEARCH Gupta et al
39. Krawczyk B. Learning from imbalanced data: open challenges and future directions. Prog Artif Intell 2016 Apr
22;5(4):221-232. [doi: 10.1007/s13748-016-0094-0]
40. Kasthurirathne SN, Grannis SJ. Machine Learning Approaches to Identify Nicknames from A Statewide Health Information
Exchange. AMIA Jt Summits Transl Sci Proc 2019;2019:639-647 [FREE Full text] [Medline: 31259019]
41. Khakharia A, Shah V, Jain S, Shah J, Tiwari A, Daphal P, et al. Outbreak Prediction of COVID-19 Patients for Dense and
Populated Countries Using Machine Learning. SSRN Journal 2020. [doi: 10.2139/ssrn.3655759]
42. Maragakis L. Coronavirus Second Wave? Why Cases Increase. Johns Hopkins Medicine. URL: https://www.
hopkinsmedicine.org/health/conditions-and-diseases/coronavirus/first-and-second-waves-of-coronavirus [accessed
2021-07-13]
43. Each State’s COVID-19 Reopening and Reclosing Plans and Mask Requirements. National Academy for State Health
Policy. URL: https://www.nashp.org/governors-prioritize-health-for-all/ [accessed 2021-02-22]
44. Li Y, Zhang R, Zhao J, Molina MJ. Understanding transmission and intervention for the COVID-19 pandemic in the United
States. Sci Total Environ 2020 Dec 15;748:141560 [FREE Full text] [doi: 10.1016/j.scitotenv.2020.141560] [Medline:
32798884]
45. Lutz CS, Huynh MP, Schroeder M, Anyatonwu S, Dahlgren FS, Danyluk G, et al. Applying infectious disease forecasting
to public health: a path forward using influenza forecasting examples. BMC Public Health 2019 Dec 10;19(1):1659 [FREE
Full text] [doi: 10.1186/s12889-019-7966-8] [Medline: 31823751]
Edited by C Basch; submitted 23.03.21; peer-reviewed by R Foraker, S Soshnikov, S Pesälä; comments to author 05.05.21; revised
version received 02.06.21; accepted 12.06.21; published 26.07.21
Please cite as:
Gupta AK, Grannis SJ, Kasthurirathne SN
Evaluation of a Parsimonious COVID-19 Outbreak Prediction Model: Heuristic Modeling Approach Using Publicly Available Data
Sets
J Med Internet Res 2021;23(7):e28812
URL: https://www.jmir.org/2021/7/e28812
doi: 10.2196/28812
PMID: 34156964
©Agrayan K Gupta, Shaun J Grannis, Suranga N Kasthurirathne. Originally published in the Journal of Medical Internet Research
(https://www.jmir.org), 26.07.2021. This is an open-access article distributed under the terms of the Creative Commons Attribution
License (https://creativecommons.org/licenses/by/4.0/), which permits unrestricted use, distribution, and reproduction in any
medium, provided the original work, first published in the Journal of Medical Internet Research, is properly cited. The complete
bibliographic information, a link to the original publication on https://www.jmir.org/, as well as this copyright and license
information must be included.
https://www.jmir.org/2021/7/e28812 J Med Internet Res 2021 | vol. 23 | iss. 7 | e28812 | p. 9
(page number not for citation purposes)
XSL• FO
RenderXYou can also read