Estimations of rip current rescues and drowning in the United States
←
→
Page content transcription
If your browser does not render page correctly, please read the page content below
Nat. Hazards Earth Syst. Sci., 19, 389–397, 2019
https://doi.org/10.5194/nhess-19-389-2019
© Author(s) 2019. This work is distributed under
the Creative Commons Attribution 4.0 License.

Estimations of rip current rescues and drowning in the United States
B. Chris Brewster1 , Richard E. Gould1 , and Robert W. Brander2
1 United   States Lifesaving Association, 1968 South Coast Highway no. 740, Laguna Beach, California 92651, USA
2 School   of Biological, Earth and Environmental Sciences, UNSW Sydney, Sydney, NSW 2052, Australia

Correspondence: B. Chris Brewster (brewster@lifesaver1.com)

Received: 15 May 2018 – Discussion started: 25 June 2018
Revised: 5 December 2018 – Accepted: 17 December 2018 – Published: 22 February 2019

Abstract. Rip currents are the greatest hazard to swimmers        et al., 2016). They are complex and variable features that
on surf beaches, but due to a lack of consistent incident         are manifest as diverse types, which can be both persis-
reporting in many countries, it is often difficult to quan-       tent and transient in occurrence and location, may occupy
tify the number of rip-current-related rescues and drowning       deeper channels between shallower sand banks, or may lack
deaths occurring along surf beaches. This study examines          any morphologic expression at all and can occur along open
this problem using rescue data reported to the United States      stretches of beaches, both oceanic and lacustrine, or against
Lifesaving Association (USLA) by surf beach rescuers from         hard structures such as headlands or piers (Castelle et al.,
1997 through 2016. These data were checked, corrected, and        2016).
culled so that only data from surf beach rescue agencies that        Typical rip currents are on the order of 5–50 m wide and
reported the primary cause of rescue were included. Results       extend to the seaward limit of the surf zone, where they
show that rip currents are the primary cause of 81.9 % of res-    may recirculate, or extend past the surf zone variable dis-
cues on surf beaches, with regional variation from 75.3 %         tances offshore (Castelle et al., 2016). Mean rip current flow
(East Coast) to 84.7 % (West Coast). These values are signif-     speeds over sustained periods (hours) are on the order of 0.3–
icantly higher than those previously reported in the scientific   0.5 ms−1 , but rips can experience short-lived pulsations of
literature (e.g., 36.5 %, 53.7 %). Using this value as a proxy    2 ms−1 or more (MacMahan et al., 2006) making them a sig-
when examining overall surf beach drowning fatalities, it is      nificant hazard to swimmers or waders of all swimming abili-
suggested that more than 100 fatal drownings per year occur       ties who may find themselves caught in them. Inexperienced
due to rip currents in the United States. However, it is clear    surfers and bodyboarders can also be imperiled by rip cur-
that the United States data would benefit by an increase in       rents (Attard et al., 2015).
the number of lifeguard agencies which report surf-related           There has been a significant and recent increase in re-
rescues by primary cause.                                         search relating to both physical and social aspects associ-
                                                                  ated with the rip current hazard (e.g., Hatfield et al., 2012;
                                                                  Brannstrom et al., 2014; McCarroll et al., 2014; Scott et al.,
                                                                  2014; Castelle et al., 2016b; Houser et al., 2017). However,
1   Introduction                                                  an ongoing challenge in addressing the actual societal and
                                                                  economic impact of the rip current hazard for beach safety
On beaches around the world characterized by wave break-          practitioners, governments, and scientists alike is obtaining
ing activity across surf zones (herein referred to as “surf       accurate values of the number of rip-current-related lifeguard
beaches”), it is well established that the primary cause of       rescues and fatal rip current drownings. In terms of the latter,
rescues conducted by lifeguards, as well as fatal drownings,      two key factors make it impossible to determine the number
is rip currents (e.g., Klein et al., 2003; Gensini and Ashley,    of deaths caused by rip currents with complete accuracy.
2010a; Brighton et al., 2013; Brander and Scott, 2016). Rip          First, it is well established that the majority of fatal rip cur-
currents are strong and concentrated flows of water mov-          rent drownings occur on beaches unpatrolled by lifeguards
ing away from the shoreline that are driven by alongshore         or outside of seasonal or daily beach patrol times (Branche
variability in wave breaking and energy dissipation (Castelle

Published by Copernicus Publications on behalf of the European Geosciences Union.
390 B. C. Brewster et al.: Estimations of rip current rescues and Stewart, 2001; Brander and Scott, 2016; SLSA, 2017). In cal training. Others provide more basic services with limited some of these incidents, there are simply no eyewitness ac- technology (Brewster, 2017). counts available to help determine the cause of drowning. In Despite these challenges, several attempts have been made others, drowning deaths are observed, but by people lacking to quantify the number of rip-current-related fatalities on US necessary awareness and understanding to correctly attribute beaches. Lushine (1991) combined documented rip current the role (if any) of a rip current in a drowning. drowning fatalities in Florida, North Carolina, and Alabama Second, in many countries there are no national require- with various nationwide drowning statistic databases to es- ments for reporting the causal factors (such as rip currents) timate that 150 rip-current-related fatalities occur each year in coastal drowning deaths. Even in countries that do, such as nationally. Gensini and Ashley (2010a) used LexisNexis, an Australia (Brighton et al., 2013) and Costa Rica (Arozarena online archive of newspaper articles sourced from local and et al., 2015), the documented number of rip current fatalities national newspapers, combined with the National Climatic is likely underestimated for the reasons previously noted. For Data Center’s (NCDC) Storm Data (now known as Storm example, while Brighton et al. (2013) determined an average Events) database (which uses a wide variety of sources from of 21 rip-current-related fatalities on Australian beaches per emergency management officials to newspaper clipping ser- year, they emphasized that this value was an underestimate as vices), to conclude that on average 35 people die from rip it was based only on confirmed rip-current-related drowning currents in the US each year. In contrast the United States deaths. Lifesaving Association (USLA) has estimated that rip cur- The United States, with thousands of kilometers of coast- rent fatalities in the US can exceed 100 per year. line affected by rip currents and hundreds of millions of The USLA estimate was arrived at internally in 2004 beachgoers each year, presents a challenge in accurately de- through a two-step process outlined in documentation sub- termining the number of rip-current-related drownings that mitted to the National Weather Service that is provided here occur. There are five distinct coastal regions characterized as Supplement. First, the number of deaths each year at surf by different wave climates and physical characteristics, such beaches was estimated based on several published studies. as geologic setting and beach type: (i) the continental Pa- Second, the USLA theorized that the percentage of rescues cific West Coast; (ii) the Atlantic East Coast; (iii) the Gulf from drowning due to rip currents, based on reports by life- Coast; (iv) the coastlines of the Great Lakes; and (v) the guards at surf beaches (then found to be over 80 %), is a Hawaiian Islands. Air and water temperature differences, as proxy for the relative proportion of surf drowning fatalities well as beach user demographics and beach usage, can also due to rip currents (in the absence of rescue) and applied that vary greatly among these regions, creating variable swim- percentage to the total number of estimated surf beach deaths ming seasons throughout the country (see Supplement). The discrepancies among these three esti- The complex forcing mechanisms associated with rip cur- mates bear further evaluation. rent formation, type, and location both within and between Since 1966, the USLA has been soliciting annual data these regions not only lead to exposure to the rip current haz- from beach lifeguard agencies and other water rescue agen- ard being extremely variable spatially and temporally, but cies around the country, including the number of rescues also make it difficult and laborious to provide a gross esti- from drowning, the cause of those rescues, the number of mate of the occurrence and location of rip currents on United medical aids provided, drowning fatalities, estimated atten- States beaches at any given time. Similarly, although some dance, and many other data points. Lifeguard agencies are coastal US National Weather Service (NWS) offices receive managed independently of the USLA, which sets recom- daily reports on rip current activity from lifeguards to assist mended operational guidelines. These agencies are only ob- in evaluating and disseminating their public rip current haz- ligated to report annual statistics to the USLA if they are cer- ard advisory (Houser et al., 2017; Moulton et al., 2017), these tified (accredited) by the USLA, although they are welcome reports do not typically include the specific type, location, or to report regardless of certification status. The USLA is the number of rip currents. only national group collecting these data. Most, though not Perhaps most importantly, as in other countries, the pres- all, water rescue agencies reporting data to the USLA serve ence of lifeguards on US beaches is temporally and spatially surf beaches where rip currents are present. In 2016, the final variable. While some beaches have lifeguard beach patrols year of data included in this study, there were 150 USLA- year round, and two (Los Angeles County and the city of certified agencies nationwide, varying in size from Los An- San Diego) staff lifeguards 24 h a day, year round, others are geles County and California State Parks on the large side staffed seasonally or are completely unstaffed (not patrolled). (over 700 lifeguards each) to very small agencies with as few As such, there are many periods of time and beaches where as 10 lifeguards. There are many other US water rescue agen- lifeguards are absent. The breadth of services provided by US cies (the specific number is unknown) that do not report data lifeguard agencies also varies tremendously. Some are staffed to the USLA. and funded as primary providers of public safety, with a vari- As noted, one of the data points collected by the USLA ety of advanced training and equipment, such as oceangoing is rescues from drowning, including those from rip currents. rescue vessels, 9-1-1 answering points, and advanced medi- Those reporting are surf lifeguards trained to identify and Nat. Hazards Earth Syst. Sci., 19, 389–397, 2019 www.nat-hazards-earth-syst-sci.net/19/389/2019/
B. C. Brewster et al.: Estimations of rip current rescues                                                                     391

rescue people from distress in rip currents. As noted earlier,    much smaller agencies that reported as few as 1 rescue
the USLA, based on an evaluation of the data it collects, has     (USLA, 2018).
consistently reported over many years that the primary cause         The USLA has suggested a variety of metrics that should
of over 80 % of rescues from drowning by lifeguards at surf       be used by beach lifeguard agencies to encourage overall
beaches is rip currents and that in some areas this propor-       consistency of reporting. These metrics include actual work
tion is higher. However, two independent published studies        output, such as rescues from drowning and medical aids per-
have reviewed USLA data and come to different conclusions         formed, drowning deaths, and many other data points. They
from the USLA regarding the percent of rip-current-related        also include estimates of beach attendance. Annual sum-
rescues. Gensini and Ashley (2010b) reviewed the USLA             maries and the underlying data provided to the USLA are
data from 2000 to 2009 and concluded that roughly 36.5 %          published and made freely available at https://www.usla.org/
of rescues reported to the USLA in those years were due to        page/statistics (last access: 14 February 2018).
rip currents. Brighton et al. (2013) reviewed the USLA data          One of the key data points reported to the USLA is the
from 2005 to 2011 and concluded that 53.7 % of the res-           number of rescues from drowning. For purposes of reporting,
cues reported to the USLA were due to rip currents. Thus,         the USLA defines rescues as, “Total persons who are judged
three sources, reviewing similar data, although during differ-    to be in imminent peril and brought to safety by a lifeguard.
ent time periods, have come to widely varying conclusions         Usually involves physical contact. Does not include people
about what the data collected and reported by the USLA            who are given oral instructions to move to a safer location.”
show (Brewster, 2010; Brewster and Gould, 2014).                  (USLA, 2018).
                                                                     The USLA also encourages agencies to document and re-
                                                                  port the primary cause of distress that led to the rescue.
2   Aim of this study                                             The primary cause reporting options for rescues include
                                                                  “surf”, “rip current”, “scuba”, and “swiftwater”. Agencies
Rescues from rip currents at beaches where lifeguards are
                                                                  may choose none of these if they do not categorize the pri-
present and report their data can provide insight into the mag-
                                                                  mary cause of rescue or if none of these categories apply to
nitude of the hazard and may be useful as a proxy for the
                                                                  a given rescue. Surf refers to rescues in response to people
percent of drowning deaths at surf beaches. The primary aim
                                                                  who find themselves in distress due to the action of break-
of this study is, therefore, to accurately evaluate and report
                                                                  ing waves or being out of depth. Rip current refers to rescues
the percentage of rescues from rip currents by lifeguards re-
                                                                  in response to people caught in rip currents. Scuba refers to
porting to the USLA. An additional aim is to determine why
                                                                  rescues involving scuba divers. Swiftwater refers to people
researchers have come to vastly different conclusions as to
                                                                  in distress in inland areas due to, for example, river flooding,
what the USLA data show and comment on the USLA es-
                                                                  and are therefore not rip current related.
timate that rip-current-related drowning fatalities in the US
                                                                     Data on rescues are typically tabulated in rescue reports
exceed 100 per year.
                                                                  by the lifeguards who effect the rescues. USLA training ma-
                                                                  terials include extensive information on identifying rip cur-
3   The United States Lifesaving Association Dataset              rents and rescuing people in peril from rip currents (Brew-
                                                                  ster, 2017). The rescue reports are compiled by the agencies
The USLA refers to itself as “America’s nonprofit profes-         and subsequently reported annually, via an online reporting
sional association of beach lifeguards and open water res-        system, to the USLA. Prior to the initiation of an online re-
cuers” (USLA, https://www.usla.org, last access: 14 Febru-        porting system, reports were submitted manually via mail or
ary 2018). The USLA does not directly train or certify beach      email. The transition to electronic reporting occurred gradu-
lifeguards, but rather promulgates training standards and cer-    ally, beginning in the late 1990s.
tifies (accredits) lifeguard providers (agencies) that choose        One of the challenges for reviewers of data reported to the
to apply and are found to meet USLA requirements. These           USLA is that reporting lifeguard agencies are under no obli-
lifeguard agencies are typically funded by federal, state, and    gation to tabulate or report the primary cause of distress that
local governments, as well as a few private entities, some        led to the rescue. For example, in a given year one agency
working as contractors to governments.                            might report 50 rescues broken down by primary cause, but
    Many public and private beach lifeguard agencies in the       another agency may simply only report 50 rescues (no pri-
United States record work output and beach observations in        mary cause). If the total number of reported rescues for the
a manner similar to that of police and fire agencies. The re-     year is compared to the total number in which rip currents
sulting data offer measures of the services provided and help     were identified as the primary cause, without factoring out
guide staffing and budgeting decisions. Each year many life-      those agencies that failed to report a primary cause, then the
guard agencies report these data to the USLA. In the final        actual proportion of rescues related to rip currents (or other
year of this study (2016), 148 agencies reported. These res-      primary causes) is diluted.
cue reports vary in magnitude from Los Angeles County,               A second challenge for reviewers of USLA data is that
which reported 12 956 rescues from drowning that year, to         some reporting agencies are solely responsible for inland ar-

www.nat-hazards-earth-syst-sci.net/19/389/2019/                            Nat. Hazards Earth Syst. Sci., 19, 389–397, 2019
392 B. C. Brewster et al.: Estimations of rip current rescues
eas, such as reservoirs and rivers, where surf and rip cur- ing a body of water that did not include surf beaches were
rents are not present (the Great Lakes, where rip currents can removed. While the Great Lakes represent one of the five
occur, are an exception). Nevertheless, these agencies’ total coastal regions in the US and are subject to physical forcing
rescue numbers are included in the total number of rescues mechanisms that can generate rip currents, they were not in-
in any given year. For reasons similar to primary cause re- cluded in further analysis since, with one minor exception,
porting, if the total number of reported rescues for a given rescue data from the Great Lakes do not include primary
year is compared to the total number in which rip currents cause of rescue.
were identified as the primary cause, without factoring out Lifeguard agencies in other coastal regions that did not re-
those agencies that serve beaches without rip currents, then port a primary cause of rescues were also removed. This, un-
the proportion of rescues related to rip currents is further di- fortunately, resulted in removal of the entire dataset of Los
luted. Angeles County, which normally reports the largest number
A third challenge for reviewers of the USLA data is that of rescues of any beach agency. It was found that in a typi-
some agencies oversee both surf and inland areas, but re- cal year this is more than 15 % of all rescues reported to the
port totals of all rescues at both venues (and the underlying USLA. However, a random sampling of agencies reporting
causes). One example is the city of San Diego, which re- in Orange County (to the immediate south of Los Angeles
ports thousands of rescues each year including some (albeit County) found rip currents to be the primary cause in 83 % of
a small number) that occur in Mission Bay, which is a low- rescues from drowning. This is comparable to all West Coast
energy estuarine environment with no surf conditions or rip agencies, so it appears likely that if Los Angeles County were
currents. Similarly, California State Parks oversee lifeguards to report, it would report similar values.
at both surf beaches and inland lakes (including reservoirs), Figure 1 shows the total number of agencies reporting for
including them all in a total number of rescues (and underly- each year and the excluded agencies (those with no primary
ing causes). cause being reported or non-surf beach agencies). Agencies
In determining the percent of rescues attributable to rip with both surf and non-surf beaches were included if they re-
currents at surf beaches, it is necessary to exclude rescue re- ported a primary cause, despite the inevitable, unknown de-
ports from agencies that do not identify the primary cause gree of overall dilution of rip currents as a primary cause.
of the rescue and to exclude, to the greatest extent possible, Any reports of rescues due to the swiftwater rescue cause
rescue reports from inland areas where rip currents are not were removed from consideration since, by definition, they
present. If these steps are not taken in data evaluation, the do not occur at surf beaches. In general, the number of in-
percent of rip-current-related rescues will be misrepresented. cluded surf agencies that report primary cause has increased
Avoiding this misrepresentation requires both an in-depth re- over time, while the number of excluded agencies has re-
view of the data and knowledge of which reporting agencies mained relatively constant.
serve only inland areas. Even then, for the hybrid agencies Where scuba was listed as the primary cause, the rescues
that cover both inland and surf, it is not possible to exclude were included, as these rescues can and do take place in surf
the inland rescue data because they are not separately re- environments. In these cases, as in others, the primary cause
ported. A goal of this study is to attempt to eliminate factors is up to the determination of the reporting rescuer. That is,
in the USLA rescue dataset that artificially underrepresent for example, a scuba diver may be rescued due to complica-
the impact of rip currents on rescues and drowning. tions from scuba diving, from being caught in a rip current,
or both. The primary cause is what is to be reported and what
we rely on here.
4 Methodology
Analysis of USLA rescue data was restricted to the most re- 5 Results and discussion
cent 20 years of compiled data from 1997 to 2016. Data were
first checked and corrected for any errors and anomalies. For Primary causes of surf beach rescues conducted for the pe-
example, there were several isolated examples where data riod 1997–2016 for all included reporting agencies in the
from one agency appeared twice in a given year, and in a few US were geographically separated into East, West, and Gulf
other cases, the total addition of yearly rescues was found to coasts, as well as the Hawaiian Islands (Table 1). As de-
be mathematically incorrect. These turned out to be minor scribed previously, the Great Lakes were not included be-
and did not affect the overall data outputs significantly. As cause, with one minor exception, no agency from the Great
a typical example, a double reporting of data by an agency Lakes reported a primary cause. In general, the percent of
in 2002 increased the total number of rescues by 10, but this rescues caused by distress due to rip currents ranged from
was only 0.021 % of the total number of rescues in the year. 75.3 % (East Coast) to 84.7 % (West Coast), with a long-term
The dataset was then culled using objective decision rules. average across all regions of 81.9 %.
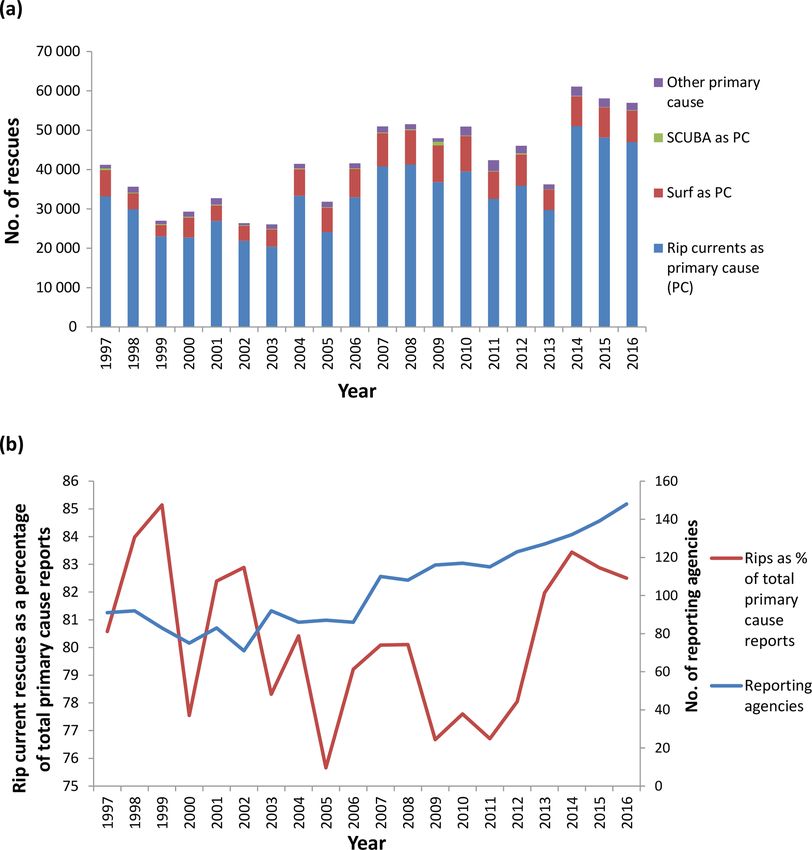
Specifically, as the purpose was to examine rip current res- Figure 2a shows the gross reporting of the primary cause
cues on surf beaches, rescue data from any agency oversee- of rescues for included agencies during the period 1997–
Nat. Hazards Earth Syst. Sci., 19, 389–397, 2019 www.nat-hazards-earth-syst-sci.net/19/389/2019/B. C. Brewster et al.: Estimations of rip current rescues 393
Figure 1. The number of lifeguard agencies reporting to the United States Lifesaving Association (USLA) statistics database between 1997
and 2016. Included surf agencies report primary cause (PC) of rescues.
Table 1. Primary causes of rescues on surf beaches reported to the USLA statistic database in 1997–2016 by coastal region in the US. The
percent of rescues by primary cause are indicated in parentheses. The Great Lakes are not included as, with one minor exception, rescue data
from the Great Lakes do not include primary cause of rescue.
Rescues by region
Region All Rip current Surf Scuba Other
East Coast 233 167 175 572 (75.3) 50 135 (21.5) 227 (0.1) 7 233 (3.1)
West Coast 608 041 514 935 (84.7) 65 349 (10.7) 4288 (0.7) 23 469 (3.9)
Gulf Coast 15 154 11 876 (78.4) 3157 (20.8) 16 (0.1) 105 (0.7)
Hawaiian Islands 47 191 37 632 (79.7) 7262 (15.5) 150 (0.3) 2147 (4.5)
Total 903 553 740 015 (81.9) 125 903 (13.9) 4681 (0.5) 322 954 (3.6)
2016, and while the number of rescues for all primary causes cues. Our examination of the same data in this way yields a
clearly fluctuates temporally, as evident in Fig. 2b, this is result of 54.9 %, which is very close to the value reported by
largely due to the increase in reporting agencies over this Brighton et al. (2013) and suggests that their estimate signif-
time. As is also evident in Fig. 2b, the percentage of total rip icantly underestimates the percent of rescues attributable to
current rescues as the primary cause of all rescues nationally rip currents in the US.
varies annually from 75.7 % (2005) to 85.1 % (1999) with Another aspect of the data reporting by Brighton et
no clear temporal trend apparent. There are many factors in- al. (2013) reveals some of the challenges involved in the re-
volved that can impact the number of rip current rescues that porting of rip current rescues in general. In reviewing Aus-
occur in a given year, including weather conditions, surf con- tralian lifeguard and lifesaver rescue data provided by Surf
ditions, number of rip currents present, and beach visitation Life Saving Australia (SLSA), Brighton et al. (2013) found
numbers. However, overall, even if the rip rescue data are that just 57.4 % were attributable to rip currents. While they
normalized by the number of reporting lifeguard agencies, removed rescue reports “known to be in areas unaffected by
the number of surf rescues attributable to rip currents does rips” (as done in our study), they were only able to report
not vary greatly over time. on data relating to “major rescues,” which are cases where
“treatment is required” post-rescue and only make up 1.4 %
5.1 Underestimating rip current rescues of all rescues reported by SLSA. The reason for this is that
these were the only incidents in the dataset where a pri-
Brighton et al. (2013) reviewed a smaller cohort of USLA mary cause of rescue was sometimes reported (there was no
data (2005–2011) and determined that only 53.7 % of rescues requirement to include this information, so it was presum-
were related to rip currents, which is significantly lower than ably unmentioned in some reports). Thus, they represent un-
the estimates derived here. The difference can be attributed to usual and extreme cases and likely also greatly underestimate
Brighton et al. (2013) using gross rescue totals in the USLA the actual percentage of rescues on Australian surf beaches
data, without excluding agencies that did not report a primary caused by rip currents. Of note, the US data from agencies
cause, agencies at beaches without surf, and swiftwater res-
www.nat-hazards-earth-syst-sci.net/19/389/2019/ Nat. Hazards Earth Syst. Sci., 19, 389–397, 2019394 B. C. Brewster et al.: Estimations of rip current rescues
Figure 2. (a) Total rescues reported to the USLA by primary cause over the period 1997–2016. (b) Percentage of rip current rescues as
primary cause and the number of lifeguard reporting agencies to the USLA over the period 1997–2016.
reporting a primary cause include 100 % of rescues, whether Gensini and Ashley (2010b), and it remains uncertain how
major or routine. their value of 36.5 % was attained.
Other discrepancies involving the USLA dataset are pre-
sented in Gensini and Ashley (2010b), who reviewed USLA
data for the years 2000–2009 and suggested that only 36.5 % 5.2 Rip current rescues and fatalities
of rescues on US beaches were attributed to rip currents,
which is less than half of the 75 %–84 % range reported here.
As described in the Introduction, some discrepancy also ex-
We reviewed the data published on the United States Life-
ists regarding estimates of annual average rip-current-related
saving Association website for these same years. Even when
drowning fatalities in the US, with reported values rang-
using gross data, without excluding data from agencies that
ing from 35 (Gensini and Ashley, 2010a) to more than 100
did not report a primary cause and agencies from areas serv-
(USLA – see Supplement) and as high as 150 (Lushine,
ing areas without surf, we found that 53 % would appear to
1991). It is important to note that all of these values are es-
be attributable to rip currents, which is similar to the value
timates, as there is no comprehensive US national database
reported by Brighton et al. (2013) for overlapping years. We
for surf beach drowning fatalities. The closest attempt at this
then reviewed all of the years of USLA data for our study
is by the US National Weather Service, which posts reports
period without correcting for agencies that did not report a
of US surf zone fatalities at https://www.weather.gov/safety/
primary cause of the rescue and agencies at beaches with-
ripcurrent-fatalities17 (last access: 4 December 2018) and
out surf. The percent of rescues related to rip currents was
includes an annual average number of reported rip-current-
found to be 49 %. This is quite similar to the conclusions of
related drowning fatalities between 2013 and 2017 of 62 per
Brighton et al. (2013), but significantly higher than that of
year.
Nat. Hazards Earth Syst. Sci., 19, 389–397, 2019 www.nat-hazards-earth-syst-sci.net/19/389/2019/B. C. Brewster et al.: Estimations of rip current rescues 395
According to the NWS (John Kuhn, personal communica- isons. If beach lifeguard agencies worldwide used consistent
tion, 2018) the primary source of these data is media reports, reporting data points and reported on the primary cause, in-
with some input from emergency management and water res- cluding rip currents, for all rescues, beach safety practition-
cue officials. Of note, the website states, “Accurately track- ers would be better able to determine the impact of the rip
ing these types of fatalities is difficult because so many go current hazard globally and develop public awareness and
unreported and undocumented.” As an example of this dif- education strategies accordingly (Houser et al., 2017). This
ficulty, in 2016 the NWS reported a total of 108 surf zone is certainly true of the surf beach reporting situation in the
fatalities, but in that same year surf rescue agencies reported United States.
145 drowning fatalities solely within their jurisdictions to the The value of the USLA dataset is that it is the largest single
USLA. This is a global problem. repository in the world of data related to causation of distress
As noted earlier, the USLA has theorized the percent of at surf beaches. For example, an average of 83 436 rescues
rescues from drowning in rip currents as a proxy for the per- from drowning per year were reported to the USLA over the
centage of drowning deaths at surf beaches in the absence of 5-year period 2012–2016 for a total of 417 180 rescues, most
rescue. To examine this approach in more detail, we chose to with a primary cause denoted. While the USLA has shared
review the most recent 5-year period (2012–2016) of drown- these data publicly, this study has shown that without a full
ing fatality reports from surf rescue agencies reporting to understanding of the individual, underlying data sources, re-
the USLA, since during this period the number of report- searchers may have difficulty making necessary and accurate
ing agencies is the highest historically, ranging from 111 in conclusions. In response to values reported in previous stud-
2012 to 136 in 2016 (Fig. 1). Of note, these agencies report ies, it is hoped that this study now provides a clearer rep-
drowning fatalities in both guarded areas (those under active resentation of the USLA dataset in regard to the rip current
lifeguard surveillance at the time of the drowning death) and hazard.
unguarded areas (those within the jurisdiction of the agency,
but not under lifeguard surveillance at the time of the death),
and during this period an average of 109.6 drowning deaths 6 Conclusions and recommendations
per year were reported.
If we apply the long-term national average of 81.9 % of An examination of rescue data reported by surf lifeguards
rip-current-related rescues (Table 1) to the actual reports of in the United States to the United States Lifesaving Asso-
drowning deaths (109.6 per year) from surf rescue agencies, ciation has shown that rip currents are the primary cause of
it can be hypothesized that an average of 89.8 deaths per year between 75.3 % and 84.7 % of all surf rescues on regional
were likely due to rip currents in the jurisdictions of the re- American beaches, with a 20-year average of 81.9 %, a sig-
porting agencies. This value is both higher than the estimate nificantly higher estimate than previously reported in the sci-
of 62 per year from the NWS and close to the previous esti- entific literature. Using the percentage of rip current rescues
mate of “more than 100” by the USLA (see Supplement). as a proxy to estimate the number of annual drowning deaths
The authors estimate that less than 5 % of the US coast- attributable to rip currents in the US suggests a value of 90
line lies within the jurisdiction of surf rescue agencies which solely within the limited jurisdictions of surf rescue agencies
report to the USLA. While these agencies tend to over- reporting to the USLA. Thus, an annual figure of over 100
see highly attended beach areas (e.g., Southern California, nationwide is not unreasonable.
Florida, and Hawaii), many drowning deaths outside these Considering the number of US lifeguard agencies that fail
areas are reported each year. Thus, relying only on drowning to report a primary cause of rescue, it is recommended that
fatality reports from these agencies will understate the num- the United States Lifesaving Association communicates with
ber of surf drowning deaths by an unknown but potentially these lifeguard agencies to endeavor to increase the level of
significant number. reporting of surf-related rescues by primary cause. It would
also be desirable for a range of consistent and comprehen-
5.3 Limitations and value of the USLA dataset sive data, involving both physical, environmental, and beach
conditions and demographic beachgoer characteristics, to be
There are clear limitations in the USLA data, some of which reported by lifeguards. However, it is well established that
have been described here previously. Not all surf beach life- data collection for beach lifeguards is difficult (Williamson
guard agencies in the US report rescue data to the USLA, and et al., 2006; Harada et al., 2011; Morgan et al., 2013) for a
some that do report do not report a primary cause. Addition- variety of logistical and personal factors and is the fundamen-
ally, the dataset is limited in that it cannot be demonstrated tal challenge in balancing the tasks of providing water safety
to represent a proportional exposure, on a per visitor basis, to vigilance, rescue capability, and data collection, the former
rip currents on all beaches of the US. We therefore agree with of which should not be compromised.
Brighton et al. (2013) that the collection of drowning data us- Nevertheless, it is vital to continue to work toward de-
ing consistent categories and the routine collection of rip cur- veloping increasingly accurate estimates of both rip-current-
rent information will allow for more accurate global compar- related rescues and drowning deaths so that local gov-
www.nat-hazards-earth-syst-sci.net/19/389/2019/ Nat. Hazards Earth Syst. Sci., 19, 389–397, 2019396 B. C. Brewster et al.: Estimations of rip current rescues
ernments, public policymakers, tourism authorities, public Brander, R. W. and Scott, T.: Science of the rip current hazard,
health professionals, and funders of mitigation measures un- in: The Science of Beach Lifeguarding: Principles and Practice,
derstand that rip currents are by far the greatest health hazard CRC Press, Boca Raton, 67–85, 2016.
related to those entering the water at surf beaches. Through Brannstrom, C., Trimble, S., Santos, A., Brown, H. L., and Houser,
this awareness, appropriate resources such as the provision of C.: Perception of the rip current hazard on Galveston Island and
North Padre Island, Texas, USA, Nat. Hazards, 72, 1123–1138,
additional lifeguard services and development of public ed-
2014.
ucation programs can be justified and implemented to assist Brewster, B. C.: Rip current misunderstandings, Nat. Hazards, 55,
in drowning prevention. 161–162, 2010.
Brewster, B. C. and Gould, R.: Comment on “Rip current re-
lated drowning deaths and rescues in Australia 2004–2011” by
Data availability. This work relied entirely on data published in a Brighton et al. (2013), Nat. Hazards Earth Syst. Sci., 14, 2203–
publicly available database by the United States Lifesaving Associ- 2204, https://doi.org/10.5194/nhess-14-2203-2014, 2014.
ation on its website at https://www.usla.org/page/statistics (last ac- Brewster B. C. (Ed.): Open Water Lifesaving: The United States
cess: 14 February 2018). Lifesaving Association Manual. New York, NY: Pearson Educa-
tion, Inc., 2017.
Brighton, B., Sherker, S., Brander, R., Thompson, M., and Brad-
Supplement. The supplement related to this article is available street, A.: Rip current related drowning deaths and rescues in
online at: https://doi.org/10.5194/nhess-19-389-2019-supplement. Australia 2004–2011, Nat. Hazards Earth Syst. Sci., 13, 1069–
1075, https://doi.org/10.5194/nhess-13-1069-2013, 2013.
Castelle, B., Scott, T., Brander, R. W., and McCarroll, R. J.: Rip
Author contributions. RG conducted the primary review of the current types, circulation and hazard, Earth Sci. Rev., 163, 1–21,
data, with review and oversight of BCB and RB. BCB and RB pre- 2016a.
pared the manuscript with contributions from RG. Castelle, B., McCarroll, R. J., Brander, R. W., Scott, T., and Dubar-
bier, B.: Modelling the alongshore variability of optimum rip cur-
rent escape strategies on a multiple rip-channelled beach, Nat.
Competing interests. B. Chris Brewster is a long-time volunteer of- Hazards, 81, 664–686, 2016b.
ficial with the United States Lifesaving Association in various un- Gensini, V. and Ashley, W.: An examination of rip current fatalities
paid positions. Richard E. Gould is a long-time volunteer official in the United States, Nat. Hazards, 54, 159–175, 2010a.
with the United States Lifesaving Association, primarily oversee- Gensini, V. and Ashley, W.: Reply to “Rip Current Misunder-
ing the gathering and publication of the statistics referenced herein. standings” (Short Communication), Nat. Hazards, 55, 163–165,
Robert W. Brander declares that he has no conflict of interest. 2010b.
Harada, S. Y., Goto, R. S., and Nathanson, A. T.: Analysis of
lifeguard-recorded data at Hanauma Bay, Hawaii, Wild. Env.
Med., 22, 72–76, 2011.
Acknowledgements. We thank the United States Lifesaving Asso-
Hatfield, J., Williamson, A., Sherker, S., Brander, R. W., and Hayen
ciation for funding the gathering and publishing of statistics over
A.: Development and evaluation of an intervention to reduce rip
many years, as well as funding aspects of this study. We thank the
current related beach drowning Accident, Anal. Prev., 46, 45–51,
beach lifeguards and lifeguard agencies of America, without whose
2012.
meticulous reporting this study would not be possible. We thank
Houser, C., Trimble, S., Brander, R., Brewster, B. C., Dusek, G.,
the reviewers for their insightful comments, which led to valuable
Jones, D., and Kuhn, J.: Public perceptions of a rip current hazard
improvements.
education program: “Break the Grip of the Rip!”, Nat. Hazards
Earth Syst. Sci., 17, 1003–1024, https://doi.org/10.5194/nhess-
Edited by: Mauricio Gonzalez
17-1003-2017, 2017.
Reviewed by: Michael Slattery and one anonymous referee
Klein, A., Santana, C., Diehl, E., and De Menezes, J.: An analysis of
hazards associated with sea bathing: Results of five years work
in oceanic beaches of Santa Catarina State, southern Brazil, J.
Coastal Res., 35, 107–116, 2003.
References Lushine, J. B.: A study of rip current drownings and related weather
factors, Natl. Weather Digest., 16, 13–19, 1991.
Arozarena, I., Houser, C., Echeverria, A. G., and Brannstrom, C.: MacMahan, J., Thornton, E., and Reniers, A.: Rip current review,
The rip current hazard in Costa Rica, Nat. Hazards, 77, 753–768, Coast. Eng., 53, 191–208, 2006.
2015. McCarroll, R. J., Brander, R. W., Macmahan, J. H., Turner, I. L.,
Attard, A., Brander, R. W., and Shaw, W. S.: Rescues conducted by Reniers, A. J. H. M., Brown, J., Bradstreet, A., and Sherker, S.:
surfers on Australian beaches, Accident Anal. Prev., 82, 70–78, Evaluation of swimmer-based rip current escape strategies, Nat.
2015. Hazards, 71, 1821–1846, 2014.
Branche, C. M. and Stewart, S. (Eds.): Lifeguard effectiveness: A Morgan, D. and Ozanne-Smith, J.: Surf lifeguard rescues, Wild.
report of the working group, Atlanta: Centers for Disease Con- Env. Med., 24, 285–290, 2013.
trol and Prevention, National Center for Injury Prevention and
Control, 2001.
Nat. Hazards Earth Syst. Sci., 19, 389–397, 2019 www.nat-hazards-earth-syst-sci.net/19/389/2019/B. C. Brewster et al.: Estimations of rip current rescues 397
Moulton, M., Dusek, G., Elgar, S., and Raubenheimer, B.: Compar- Surf Life Saving Australia (SLSA): National Coastal Safety Report
ison of rip current hazard likelihood forecasts with observed rip 2015, Sydney: Surf Life Saving Australia, 2017.
current speeds, Weather Forecast., 32, 1659–1666, 2017. United States Lifesaving Association (USLA): American Lifeguard
Scott, T., Masselink, G., Austin, M. J., and Russell, P.: Controls on Rescue and Drowning Statistics for Beaches, available at: https:
macrotidal rip current circulation and hazard, Geomorphology, //www.usla.org/page/statistics, last access: 14 February 2018.
214, 198–215, 2014. Williamson, A.: Feasibility study of a water safety data collection
for beaches, J. Sci. Med. Sport, 9, 243–248, 2006.
www.nat-hazards-earth-syst-sci.net/19/389/2019/ Nat. Hazards Earth Syst. Sci., 19, 389–397, 2019You can also read