An Open-source Model for Simulation and Corrective Measure Assessment of the 2021 Texas Power Outage
←
→
Page content transcription
If your browser does not render page correctly, please read the page content below
An Open-source Model for Simulation and Corrective Measure Assessment of the 2021 Texas Power Outage Dongqi Wu Texas A&M University https://orcid.org/0000-0002-0238-6088 Xiangtian Zheng Texas A&M University https://orcid.org/0000-0003-2884-3213 Yixing Xu Breakthrough Energy Daniel Olsen Breakthrough Energy Bainan Xia Breakthrough Energy Chanan Singh Texas A&M University Le Xie ( le.xie@tamu.edu ) Texas A&M University https://orcid.org/0000-0002-9810-948X Article Keywords: 2021 Texas power outage, energy demand, generation capacity outage DOI: https://doi.org/10.21203/rs.3.rs-384535/v1 License: This work is licensed under a Creative Commons Attribution 4.0 International License. Read Full License
1   An Open-source Model for Simulation and
 2   Corrective Measure Assessment of the 2021 Texas
 3   Power Outage
 4   Dongqi Wu1,† , Xiangtian Zheng1,† , Yixing Xu2 , Daniel Olsen2 , Bainan Xia2 ,
 5   Chanan Singh1 , and Le Xie1,3,*

 6
     1 Department   of Electrical and Computer Engineering, Texas A&M University, College Station, Texas, USA
 7
     2 Breakthrough   Energy Sciences, Seattle, Washington, USA
 8
     3 Texas A&M Energy Institute, College Station, Texas, USA

 9
     * Corresponding author: le.xie@tamu.edu

10
     † Co-first author

11   ABSTRACT

     Unprecedented winter storms that hit across Texas in February 2021 have caused at least 4.5 million customers to experience
     load shedding due to the wide-ranging generation capacity outage and record-breaking electricity demand. While much
     remains to be investigated on what, how, and why such wide-spread power outages occurred across Texas, it is imperative
     for the broader research community to develop insights based on a coherent electric grid model and data set. In this paper,
12
     we collaboratively release an open-source large-scale baseline model that is synthetic but nevertheless provides a realistic
     representation of the actual energy grid, accompanied by open-source cross-domain data sets. Leveraging the synthetic grid
     model, we reproduce the blackout event and critically assess several corrective measures that could have mitigated the blackout
     under such extreme weather conditions. We uncover the regional disparity of load shedding. The analysis also quantifies the
     sensitivity of several corrective measures with respect to mitigating the power outage, as measured in energy not served (ENS).
     This approach and methodology are generalizable for other regions experiencing significant energy portfolio transitions.

13   Main
14   The extreme winter storm and associated electricity outages in February 2021 are estimated to have caused more than 70 deaths1
15   and $200 billion economic loss2 in the state of Texas. Besides the official brief review3 and ongoing internal investigation on
16   the Electric Reliability Council of Texas (ERCOT), there have been preliminary reports from non-peer-reviewed articles4–6 and
17   press interviews7, 8 on potential causes and technical solutions for this blackout event. Given the complexity and confidentiality
18   of the actual electric grid model and relevant information, it becomes very challenging for the broader research community to
19   develop analysis and provide credible insights on such major events.
20       While researchers recently have contributed to the creation of large-scale synthetic grid models9 for analysis such as
21   macro-scope energy portfolio transition10, 11 , cross-domain and open-source approaches to reproduce the Texas blackout event
22   and quantify impact from corrective measures against extreme frigid weather are still at a nascent stage, with several gaps in
23   existing research. First, existing open-source large-scale synthetic grid models are not ready-to-use for the event reproduction
24   without rigorous calibration. Second, the lack of aggregated and processed event timeline data prevents exhaustive simulation
25   and further investigation. Last but not least, the lack of consistent quantified criteria renders studies on the effectiveness of
26   potential corrective measures and their combined effect incomparable.
27       Here, we collaboratively develop an open-source large-scale synthetic baseline grid12 , providing a realistic representation
28   of the actual ERCOT electric grid, accompanied by the open-source data set along the event timeline. This ready-to-use
29   multi-platform synthetic grid model is calibrated based on open-source data sets, including generation by source, load by
30   weather zones, generation unit outage timeline, load shedding record, etc. To the best of our knowledge, it is the first fully
31   open-source approach to model, simulate, benchmark, as well as propose corrective measures against the 2021 Texas power
32   outage. The reproduction results transparently replay the timeline of the change of system generation capacity, load demand and
33   load shedding associated with the key events, aiding public researchers in combing the event development process, investigating
34   the event causes, and providing possible technical solutions. Additionally, we propose and evaluate multiple technical solutions
35   that can possibly mitigate the electricity scarcity under such extreme weather conditions, including energy system winterization,
36   interconnected HVDC lines, up-scaled demand response program and strategic energy storage facilities. Leveraging the
37   synthetic grid, we perform quantitative analysis on the corrective measures in the aspect of reducing the extent of blackout
38   events. Our results indicate the strong disparity among the winterization effectiveness for generation units of various source
39   types and geographical regions, the quantitative assessment of certain corrective portfolios, and the interdependence of per-unit
40   performance of corrective measures.

41   Open-source Synthetic Grid Model and Data
42   We first collaboratively develop an open-source, large-scale, synthetic baseline grid that provides a realistic representation of
43   the actual ERCOT electric grid, and then integrate generation and load-related data along the event timeline, which are both
44   publicly available on Github12 . The original sources are detailed in the documentations in the Github repository (see Data and
45   Code Availability). In this paper, the synthetic model creation particularly focuses on feasibility of the direct current optimal
46   power flow (DCOPF) solution without transient stability assessment for the following reasons. First, DCOPF is commonly
47   used for generation dispatch in the real-world system operation under normal conditions, due to its computation efficiency
48   compared to the alternating current optimal power flow (ACOPF). Second, although maintaining the system transient stability
49   affects the system operation under emergency conditions, the major decisions that determine the blackout event thread, such as
50   generation dispatch and load shedding, mostly depend on the power flow solution feasibility. Finally, regulations on critical
51   energy/electric infrastructure information (CEII) limit the disclosure of information about actual power grid components, and
52   hence dynamic model parameter calibration for generators is impractical due to the lack of publicly available information.
53       For the purpose of blackout event reproduction and ‘what-if’ analysis, we create a comprehensive blackout event dataset
54   via collection from publicly available sources3, 13–16 and estimation (see Methods). This dataset integrates actual load by
55   weather zone, actual generation by source, 7-day-ahead load forecast by source, solar and wind generation forecast, generation
56   units outage, actual available generation capacity, actual load shedding and customer power outage into a single ready-to-use
57   format. Here, we define the counterfactual load as the 7-day-ahead load forecast and the simulated load shedding as the gap
58   between the post-shed and counterfactual load, and introduce the estimated generation capacity by weather zone based on
59   rated generation capacity, thermal generation units outage and actual renewable generation (see Methods), all of which play
60   important roles in the event reproduction and what-if analysis.
61       The synthetic ERCOT grid model is adapted from an existing test system17 and rigorously calibrated in several aspects,
62   namely generator units capacity, and transmission line rating (see Methods). The geographical load distribution comes from
63   the existing grid model9 , while their real-time magnitudes in simulation are adjusted according to the real load dataset or
64   calculated ones depending on whether the real load data are available. The generator units capacities are updated to the
65   actual available generation capacity15 in January 2021. Without modifying the network topology, some transmission lines are
66   upgraded to ensure that the model remains feasible in the period leading up to the blackouts and that no renewable generators
67   are unreasonably curtailed due to congestion.
68       Integrating the open-source datasets, the ready-to-use multi-platform synthetic grid model is the first open-source simulation
69   package dedicated to potentially provide firm interdisciplinary insights into the particular real-world blackout event. To give an
70   intuitive impression on the blackout event, we provide an event overview along with regional generation outages and customer
71   power outages (Fig. 1). The timeline of the whole blackout event (Fig. 1-a) that contains the actual total load, actual and
72   estimated generation capacity shows the electricity scarcity due to the high load demand and wide-ranging generation outage.
73   The actual generation and generation outage across eight ERCOT weather zones (Fig. 1-b) show that the generation outage at
74   the darkest hour mainly consists of natural gas thermal generation outages across ERCOT and renewable generation outages in
75   the North, West, Far West and South zones. We also find the regional disparity of load shedding (Fig. 1-c) from the aggregated
76   county-level utility-reported customer outage data16 during the "darkest" period, namely from 8 p.m. February 15 to 11 a.m.
77   February 16. Specifically, the satellite counties around Houston in the Coast zone and several counties distributed in the West
78   zone suffered the most severe outages. We notice the significant gap between the estimated generation capacity and actual
79   online capacity before February 15 and increasing mismatch between them after noon on February 16 that are in line with
80   expectations due to several reasons explained in Supplementary Note 1. We have observed that there exists a substantial
81   mismatch between actual load and either actual online or estimated generation capacity, which is beyond the reserve limit.
82   This mismatch may be attributed to multiple reasons, such as transient stability requirements, reactive power demands, and
83   capped wholesale market price18 , which deserve more investigation but are nevertheless outside the scope of this paper. To
84   show the complex but realistic features of the synthetic grid, we visualize the topology of the whole synthetic grid (Fig. 2),
85   of which load distribution, generation units capacity and transmission lines rating are calibrated based on the static ERCOT
86   grid-related data (see Methods). In the following analysis, we will leverage the synthetic model along with the blackout event
87   dataset to reproduce the blackout event via simulation and perform quantitative assessments of multiple corrective measures
88   against extreme frigid weather.

                                                                                                                                  2/13
89 Reproduction of the 2021 ERCOT Blackout Event
90 To reproduce the ERCOT blackout event from February 15 to February 18, we simulate the synthetic grid model using the
91 aggregated data, where realistic load shedding allocation and DCOPF are key steps. We take the estimated generation capacity
92 (the binding constraint for load shedding) and counterfactual load (the ebb-flow pattern of load) as the simulation inputs. To
93 achieve the fidelity of load shedding, we mimic the guides of load shedding and restoration19, 20 to determine the total load
94 shedding amount at any given moment, and perform appropriate spatial allocation of load shedding to reflect its regional
95 disparity (see Methods). We reproduce the blackout event by iteratively solving DCOPF given the post-shedding load (see
96 Methods), which reveals the hourly change of geographically distributed load, generation and load shedding across the ERCOT
97 in detail.
98 We demonstrate the fidelity of the synthetic grid and the associated simulation methods by the reproduction results of load
99 shedding and generation composition (Fig. 3). To quantify the severity of the blackout event, we use the power system reliability
100 index energy-not-served21 (ENS), defined as the integral of load shedding over the event timeline, to quantitatively evaluate
101 the load shedding throughout the rest of this paper. We first demonstrate the fidelity of the geographical load distribution and
102 the designed load shedding algorithm by the good match between the actual and simulated total load shedding (Fig. 3-a) that
103 respectively represent a total of 998.8 GWh and 929.6 GWh ENS. The unavoidable mismatch attributes to the combined effects
104 of errors in synthetic grid modelling and system operation under emergency conditions (see Supplementary Note 2 for the
105 remark on the mismatch). We then validate that the simulation well captures the regional disparity of load shedding across eight
106 weather zones22 by comparing the simulated zone-level normalized load shedding with the real one (Fig. 3-b). It shows that Far
107 West experienced the most disproportional load shedding among all zones and Coast has suffered from a significantly worse
108 condition compared to the other two most populous zones: North Central and South Central. Finally, we validate the fidelity of
109 generation units capacity by type and generation cost curves used for DCOPF by showing the almost perfect match between
110 actual and simulated generation composition throughout the event (Fig. 3-c). The reproduction results validate the synthetic
111 baseline model, the related data and the associated simulation methods, which provide a reliable basis for the following what-if
112 analysis. Additionally, the reproduction results can transparently show the change of load, generation and load shedding along
113 the timeline, aiding public multidisciplinary researchers in combing the event development process, investigating the event
114 causes and providing possible technical solutions. The transparency and reproducibility of the synthetic grid model also allow
115 public researchers to contribute to further model development and calibration.
116 Quantitative Assessment of Corrective Measures against Extreme Frigid Weather
117 In order to provide firm insights into potential solutions against problems revealed by extreme frigid weather, we start from
118 investigating four possible corrective measures, namely, generation units winterization, interconnection HVDC lines, up-
119 scaled demand response program, and strategic energy storage facility (see Supplementary Figure 2 for conceptual diagram).
120 Generation units winterization only refers to the adapted winterization treatments for electric energy generation units, assuming
121 no winterization is currently applied for any units. Particularly, we reserve the impacts of wide-ranging natural gas scarcity6
122 due to failures in the non-winterized natural gas supply chain (see Methods and Supplementary Note 4). Additional HVDC
123 interconnections, besides two existing HVDC ties, respectively connect from the Western Interconnection to the West zone and
124 from the Eastern Interconnection to the Coast zone, require necessary transmission lines upgrade around the locations of their
125 converter stations (see Methods). Up-scaled demand response refers to various incentive programs distributed across ERCOT
126 that require voluntary reduction of electric energy demand. Energy storage refers to the large utility scale storage facilities
127 that absorb the excessive energy during off-peak hours and release it at high power during emergency hours. Here we treat
128 the energy storage as the first-aid measure while taking the other three as the sustained electricity supply measure, especially
129 viewing the generation units winterization as the primary preventive measure. Therefore, we conduct quantitative assessment of
130 all corrective measures from different perspectives in the following analysis.
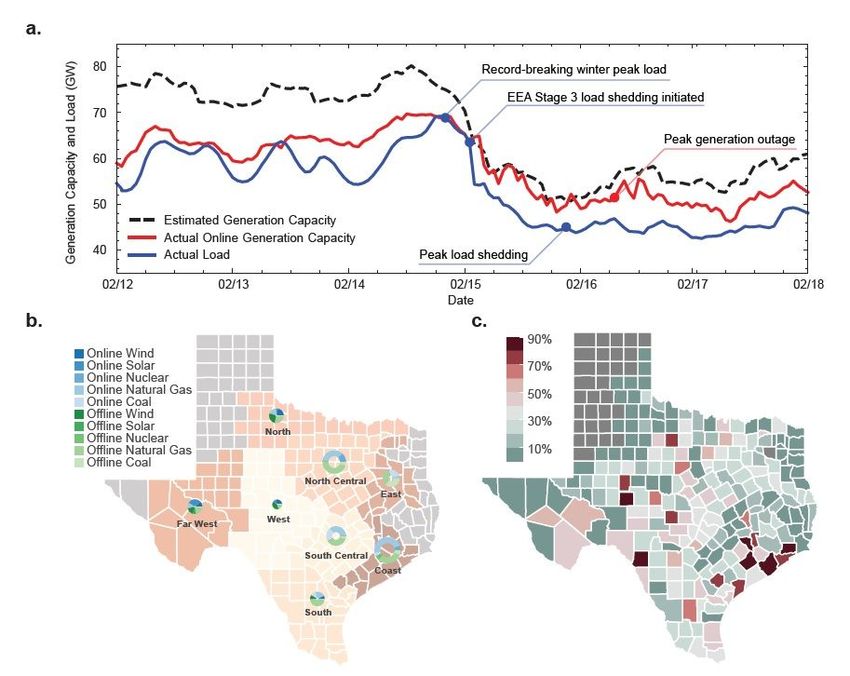
131 Taking these corrective measure settings into account, we first quantify the impacts of each single sustained electricity
132 supply measure of distinct extents in load shedding (Fig. 4). We find that 60% generation units winterization can effectively
133 reduce the ENS from 929.6 GWh to 40.8 GWh (Fig. 4-a), and about 80% generation units winterization can prevent the
134 blackout entirely, where we reserve the impacts of non-winterized natural gas supply chain. We also find that HVDC lines and
135 up-scaled demand response of equal capacity have similar but different effectiveness on mitigating the electricity scarcity (Fig.
136 4-b,c), which respectively reduces the ENS by 64.1 GWh and 67.5 GWh per 1 GW capacity (see Supplementary Note 6 for
137 more details). Since energy system winterization is the most straightforward solution against extreme frigid weather, we attach
138 additional importance to prioritizing the winterization of generation units of specific source types in different regions. We
139 perform the quantitative assessment of the effectiveness of facility winterization by source and region on the electricity scarcity
140 mitigation. The results indicate the distinct performance of per-GW generation units winterization (see Supplementary Note 7
141 for more details). Based on this, we suggest the priority of winterization for the disabled nuclear generation units located in the
3/13
142 South Central, natural gas generation units across ERCOT, coal generation units in the Coast and wind generation units in the
143 West.
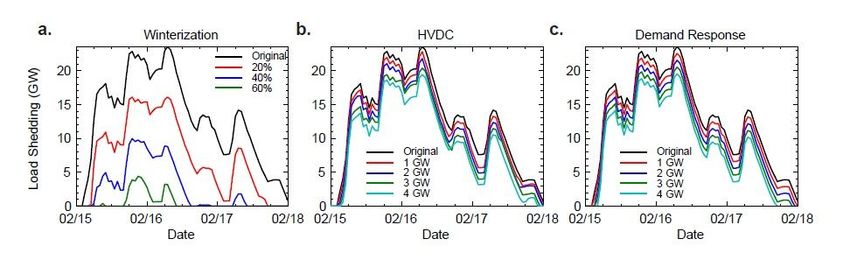
144 Given the quantitative assessment of single sustained electricity supply measure, we investigate the performance of several
145 sustained electricity supply portfolios and assess the first-aid capability of energy storage on the basis of sustained sources. We
146 have selected three appropriate winterization portfolios based on the foregoing priority analysis (see Supplementary Table 1) to
147 provide a quantitative assessment in terms of additional ENS reduction contributed by both HVDC and demand response (Fig.
148 5). First, we find that the performance of HVDC and demand response are slightly different but almost equivalent under certain
149 cases of winterization portfolio. Second, we find the per-GW performance of HVDC and demand response decreases as the
150 winterization capacity increases. For first-aid outage mitigation at the load shedding peak hour, we focus on load shedding
151 peak clipping by the strategic energy storage facilities on top of sustained corrective measure portfolios, each refers to one of
152 the three winterization portfolios (see Supplementary Table 1) together with HVDC and demand response of 2 GW. We find
153 that the performance of per-GWh capacity reduces as the total energy storage capacity increases, or along with increasingly
154 sufficient sustained supply corrective measures (Fig. 6).
155 To summarize the key findings obtained in the foregoing quantitative analysis, we find the strong disparity of generation
156 units winterization of various source types in multiple regions, and the interdependence of per-unit performance of corrective
157 measures, based on the quantitative assessment of certain corrective portfolios.
158 Discussion
159 We introduced an open-source cross-domain synthetic ERCOT grid model associated with the blackout event-related data,
160 which is the first-of-its-kind for broader energy researchers to provide insights into the 2021 Texas power outage event.
161 Simulation results based on this open synthetic model are shown to have captured key characteristics of the real-world event,
162 uncovering the key regional disparity of load shedding. The quantitative assessment of the corrective measures and portfolios
163 has indicated the strong disparity of winterization effectiveness among generation units of various types in multiple regions
164 and the interdependence of per-unit performance among corrective measures. It can immediately inform policy makers of
165 the priority of generation units winterization, the quantitative assessment of certain portfolios on mitigating the blackout and
166 the necessity of launching systematic investigations on the combined effects of corrective measures, which can potentially be
167 generalized for other regions around the world which are experiencing the dual challenge of energy portfolio transition and
168 extreme weather conditions.
169 This open-source, cross-domain, data-driven approach to analyzing a real-world power grid during extreme events provides
170 a fresh perspective to allow broader climate and energy research communities to have high fidelity characterization of what
171 exactly happened and what could have been corrected in a large power system, as nations and regions aggressively tackle
172 energy and climate challenges. The transparency and reproducibility of the synthetic grid model will contribute its unique value
173 to the future energy policy making and technological solution discussion in the broader context of energy portfolio transition
174 and frequent extreme climate, which otherwise are mostly closed-door research in a few government agencies and transmission
175 organizations on confidential real-world models.
176 For the future public research and internal ERCOT investigation, it will be fruitful to provide solid and reasonable
177 explanations to the following observations that are unanswered in this paper. First, we notice the wide-ranging natural gas
178 generation capacity outage and de-rating are not simply due to the freezing temperature, but also to natural gas scarcity and
179 interruption in the supply chain. It is particularly important to estimate and predict the impacts of interdependence between two
180 energy infrastructure systems on the overall energy system reliability and energy market stability on both sides under extreme
181 weather conditions. Second, we notice the price-ceiling-hitting whole-sale electricity price18 at $9,000 per MW, that lasted for
182 three days ending on February 18. Its quantified impacts on generation dispatch and load restoration still remain unknown.
183 More investigation is necessary for demonstrating and developing a benign power market mechanism that can encourage
184 improving the reliability and resiliency of power grids. Last but not least, the interdependence of per-unit performance among
185 corrective measures emphasizes the necessity of systemic assessment on the combined cost-effectiveness of technical solution
186 bundles.
187 Methods
188 Data Aggregation
189 In order to reproduce the blackout event and perform quantitative what-if analysis, we integrate the blackout related data during
190 the event period between February 14 to February 18. The original sources for all datasets are provided in the Data and Code
191 Availability section. We integrate the datasets via two ways, namely data collection from multiple resources13–16 and data
192 estimation.
4/13193 • Data Collection: We collect actual load, actual generation, 7-day-ahead load forecast and 7-day-ahead solar generation
194 forecast data from the ERCOT regular data channel13 . We collect generation units outage data from the source14 dedicated
195 for the blackout event, which specifies the outage period, outaged capacity, source type, and location of outaged and
196 de-rated generator units. Note that only part of all generation outages are included in this source, since some resource
197 entities do not provide ERCOT consent to disclose, and outages shorter than two hours may not be included. We obtain
198 generation capacity data from the Energy Information Admission (EIA) generation inventory data source15 . Additionally,
199 we get the customer power outage data16 from PowerOutage, which has city-level utility-reported number of customers
200 suffering power outage.
201 • Data Estimation: We define the estimated generation capacity as the sum of total maximum online capacity of thermal
202 and nuclear generation and total real-time varying available wind and solar generation capacity. Here the maximum online
203 capacity of thermal and nuclear generation are equal to the seasonal maximum capacity15 subtracted by the generation
204 units outage14 , while the real-time varying capacity of wind and solar generation is the aforementioned collected wind
205 and solar generation data13 . We define the load shedding as the gap between the actual and counterfactual load data. Here
206 the counterfactual load data refer to the 7-day-ahead load forecast. We also estimate the counterfactual wind generation
207 as described in the literature10 using the associated weather data23 during the blackout event period. Wind generation
208 estimation in this way can achieve the highest granularity. Due to the lack of weather data required by solar generation
209 estimation model, the 7-day-ahead forecast solar generation is the alternative way for the counterfactual estimation. Great
210 matches between actual and counterfactual wind and solar generation profiles before February 9 (see Supplementary
211 Figure 1) demonstrates the accuracy of counterfactual generation, and it also indicates that the impacts of the winter
212 storm on renewable generation approximately started from February 9.
213 Synthetic Grid Creation
214 The synthetic ERCOT grid model is adapted from the existing test system17 , and rigorously calibrated in several aspects,
215 namely, system topology, geographical load distribution, generation units capacity and transmission lines rating. Note that
216 although the latest released synthetic Texas 7,000-bus grid24 offers more granularity in terms of buses and zones, the zones do
217 not line up with the data available from ERCOT, rendering remarkable difficulty for model calibration. Therefore, we still
218 choose this 2,000-bus case as the base model.
219 • Load distribution: The geographical load distribution comes from the original design of the synthetic grid model9 , of
220 which the relative sizes are reasonably determined by the demographic and geographical information. The real-time sizes
221 of loads in simulation are further adjusted to the real hourly load dataset or calculated counterfactual ones. As the public
222 datasets only disclose aggregated load of each weather zone, all loads within each weather zone are proportionally scaled
223 such that the sum of all loads in each area equals the published numbers.
224 • Generation units capacity: The existing test system contains generation capacity inventory up to 20169 plus the largest
225 generators added in the period from 2017 to 2019, with the entire generator fleet scaled to match totals by type and
226 zone at the start of 202017 . To update this dataset to 2021 conditions, we add eight new generators: two natural gas
227 generators (a total of 427 MW), one biomass generator (100 MW), four solar generators (742 MW), and one wind
228 generator (220 MW). These generators were added at high-voltage buses in the synthetic network closest to their real
229 locations. Finally, the generation fleet was scaled such that totals by type and weather zone match the totals from EIA
230 Form 860-M, December 2020 (to account for any uncaptured additions, retirements, de-ratings, etc.).
231 • Transmission lines rating: The topology of the system is adopted from the synthetic Texas 2,000-bus grid as described
232 in the literature9 . Without modifying the topology of the transmission network, their capacity ratings and imdepances
233 are tuned to emulate transmission expansion to accommodate the additional generation resources, additional HVDC
234 interconnections and 2021 demand. Transmission lines are upgraded as necessary to ensure network feasibility and
235 to avoid unrealistic curtailment of variable renewable generators. Specifically, 59 out of 3,206 branches are upgraded,
236 representing 108.4 GW-miles of transmission lines upgrades (out of a total of 19,374 GW-miles in the base grid. These
237 transmission upgrades are mostly in the Far West (29) and North (14) weather zones, where growth of demand and
238 generation resources has been greatest relative to the 2016 transmission network capacities.
239 Simulation based on Synthetic Grid Model
240 Load Shedding and Restoration Operation Principles
241 In ERCOT operation protocols, when the system-wide reserve drops to a dangerous level that qualifies for Energy Emergency
242 Alert (EEA) conditions, the grid operator will use different resources from various participants of the ERCOT market to
243 maintain grid security. In EEA levels 1 and 2, ERCOT will first contact industrial loads that agreed to be disconnected during
5/13244 emergencies and call upon available demand response programs. In EEA level 3 events during which the operating reserve
245 capacity is below 1000 MW, ERCOT will ask transmission companies to shed load, typically done through rotating outages. In
246 our simulations, we aim to follow a similar process in determining the total amount of load to shed while maintaining simplicity
247 and generality. For each snapshot, we start by applying the counterfactual load and try to find a feasible power flow solution. If
248 the available capacity cannot satisfy the full demand or the supply is limited by transmission line congestion, DCOPF will be
249 infeasible. In that case, we then gradually reduce the load across the network until a feasible solution is found. Similarly, if the
250 system-wide reserve is high enough and there is active load shedding from the past hours, we attempt to slowly reconnect them
251 back until the operation reserve has been depleted. The full logic flow of load shed in simulation is listed in Algorithm 1.
Algorithm 1: Iterative Load Shedding in Simulation
Load renewable generation profile of hour t, Pgt into model
Modify thermal generator capacity based on unit outage data
Load counterfactual load of hour t, Plt into model
Apply load shedding from the past hour Plst−1 to load buses
Compute system-wide capacity reserve Prt = ∑i (Pg,i t − Pt ) + Pt−1 ∀i ∈ [list of all buses]
l,i ls
Attempt to solve DCOPF on the base profile
if DCOPF is infeasible or Prt < Pr,min then
while DCOPF is infeasible or Prt < Pr,min do
Increase load shedding: Plst = Plst + ∆Pls
Update Prt = Prt + ∆Pls
end while
else if Operation reserve Prt > Pr,min and Plst > 0 then
while OPF is feasible and Prt > Pr,min and Plst > 0 do
Decrease load shedding: Plst = Plst − ∆Pls
Update Prt = Prt − ∆Pls
end while
end if
Save Plst as the minimum load shedding for hour t
252 Details of Blackout Event Reproduction
253 • Load and Load Forecast Profile: In the reproduction of the outage event, we apply the real historic load during the period
254 between February 12 and February 18 to the synthetic Texas network. The ERCOT load data are divided into eight
255 weather zones in Texas, each containing a specific set of counties. In the simulation, we scale the base value of every
256 load bus within each weather zone such that the total load capacity in the zone equals the ERCOT load forecast data on
257 the same hour, which is used as the counterfactual load profile.
258 • Renewable Generator Capacity: We have estimated the unit-level wind and solar capacity data during the event periods
259 using the combination of available weather data and ERCOT generation-mix data. In the reproduction of the outage
260 event, the unit-level data are all scaled according to the total actual renewable generation data published on EIA15 . These
261 data are set to be the maximum real power output for renewable generators and is subject to further curtailments, should
262 congestion in the lines occur. The renewable generators are set to have zero cost in the DCOPF formulation to prioritize
263 them over thermal energy sources.
264 • Dispatch-able Generator Capacity: We use the ERCOT unit-level outage report14 to determine the maximum real power
265 output capacity for thermal generators. Although the maximum rate capacity for thermal plants is fixed through the event,
266 many thermal generators have experienced outage or de-rating due to various reasons, including limited fuel supply,
267 facility freezing and planned maintenance. As the generators in the synthetic networks are equivalent generators, exacting
268 matching with the outage report is not possible. Instead, the outage data are first aggregated to county-level and used to
269 set the maximum capacity of all thermal generators of the same fuel type in each county.
270 • Formulation of DCOPF: Using deterministic system demand and renewable generation data, the actual output of
271 dispatchable generators (coal, natural gas and nuclear) and the power flow pattern in the network is determined by
272 Direct-Current Optimal Power Flow (DCOPF). DCOPF is an optimization formulation that computes the most economic
273 real power output assignment for all dispatch-able generators in a network, such that all transmission line flow is below
274 their thermal limit and the total real power generation equals the total demand across the network. The Matlab package
6/13275 Matpower is used to solve DCOPF for all simulations. A detailed description and formulation of DCOPF implemented
276 by Matpower can be found in their documentation25 .
277 • Cost Curve: The cost curves of generators in the original synthetic network9 are revised to make an even closer match
278 with reality. We have run a year-round multi-period DCOPF simulation using 2016 ERCOT renewable and load profile
279 data to confirm that the total generation from each of the fuel sources is sufficiently closely matching historical data. A
280 detailed experiment procedure and result comparison can be found in the literature10 .
281 Generator Outage and Corrective Measure Modelling
282 To quantitatively assess the impact of generator outage on the severity of the outage event and evaluate the effectiveness of
283 potential corrective measures such as the additional HVDC interconnections, generation units weatherization, up-scaled demand
284 response programs and energy storage, it is necessary to model each of these elements appropriately in our synthetic grid. The
285 detailed modelling method is documented below:
286 • Generator Outage: The unit-level generator outage data is retrieved from the ERCOT public report14, 26 . As detailed
287 generator information is not available to the public (especially for natural gas, wind and solar generators), we have 606
288 equivalent generators across the network such that the area-wide aggregated generation capacity and profile can match
289 real ERCOT records. To match the real outage data with synthetic equivalent generator, we pre-process the data by
290 aggregating the total outage capacity for each county and fuel type. The county-level outage data are used to scale the
291 maximum real power output of all corresponding generators in the same county and of the same fuel type in the synthetic
292 network.
293 • Generator Weatherization: Weatherization is a preventive measure to reduce the impact of extreme weather conditions
294 on the functionality of infrastructures. Different types of generators require different types of weatherization treatments:
295 wind turbines require blade and gearbox heating while gas plants may need anti-frost treatment for facilities. Despite the
296 potentially big difference in weatherization cost and complexity, our focus is more about evaluating the effectiveness
297 of weatherization among different generator types and geographical regions. To this end, we only specify the amount
298 of MW of weatherized generators for each fuel type in each weather zone and try to compare the effectiveness on the
299 reduction of ENS as a result of weatherization. We have also considered the scarcity of natural gas supply before and
300 during the winter storm by approximating the de-rating of the winterized generators caused by gas supply shortage,
301 using disclosed unit de-rating data from ERCOT (see Supplementary Note 5). When computing the area-level available
302 capacity during counterfactual simulation, we only apply weatherization to generators that were completely out, as the
303 de-rating of the running generators was highly likely caused by lack of gas supply. The weatherized generators are also
304 de-rated based on the extent of de-rating of running gas generators in the same county.
305 • HVDC Ties: We have included two existing HVDC ties to the Eastern Interconnection in our synthetic network model.
306 These two existing conveter stations are modelled as fixed equivalent loads for DCOPF computation. In each hour, the
307 real tie flow data from ERCOT is assigned as real power demand for the equivalent loads and the sign is determined by
308 the direction of DC tie flow. This is meant to make the DC tie flow exactly the same as real data. For counterfactual
309 studies, we have included two additional HVDC ties, one to the Western Interconnection and another to the Eastern
310 Interconnection. We have adopted a commonly used design27 in determining the location for the converter stations and
311 upgrade the transmission lines around the converter stations (see Supplementary Method 1). As the additional HVDC ties
312 are introduced to be counterfactual corrective measures to supply any extra power during the event, their actual output
313 power needs to be adjusted according to the ERCOT system demand. Hence, the new DC ties are modelled differently as
314 equivalent generators with a cost function representing the hypothetical cost to buy power from neighboring states. The
315 magnitude and direction of their tie flow is determined by OPF result.
316 • Demand Response: Demand response refers to various incentive programs that encourage voluntary reduction of electric
317 energy demand during peak or emergency hours. Although most demand response programs in ERCOT are still in
318 development at the current stage and mostly target large industrial, commercial or aggregated customers, it has the
319 potential to scale up quickly and provide a valuable demand side resource during similar energy emergencies. In our
320 simulation, the effect of a demand response program is modelled as a form of voluntary load reduction with prior
321 agreement between load serving entities and customers which does not count to ENS. During energy emergencies, load
322 resources from demand response programs are the first to be committed before all of the other more costly steps. Hence,
323 we also prioritize available demand response capacity over storage and forced load shedding. When the system reserve is
324 below 2300 MW which corresponds to ERCOT EEA level 1, the loads across the synthetic network are reduced up to the
325 maximum allowed demand response capacity.
7/13326 • Energy Storage: The purpose of energy storage is to absorb excessive energy from renewable sources during off-peak
327 hours and release stored energy during peak and emergency hours. Unlike other types of corrective measures that are
328 more suitable in reducing the overall severity of the outage by providing sustained additional power supply, the advantage
329 of energy storage lies in its ability to provide relatively large power output during a short period, which can be used to
330 bridge through "most difficult" hours. To emphasize this, we assume all storage capacities are fully charged prior to the
331 event and commit them during the hours when the level of forced load shed is around the highest. The contribution of
332 energy storage is reflected in the reduction of peak load shed capacity.
333 Data and Code Availability
334 The open-source synthetic ERCOT model and the corresponding dataset used for blackout event reproduction and quantified
335 what-if analysis are publicly available on Github12 . A tutorial and examples for running the code using provided dataset are
336 also available in the Github repository.
337 References
338 1. I. Ivanova. Texas winter storm costs could top $200 billion — more than hurricanes Harvey and Ike (Available: https:
339 //www.cbsnews.com/news/texas-winter-storm-uri-costs/ [Online], 2021).
340 2. J. Stengle and M. Renault. Suspected hypothermia deaths in homes mount in Texas (Available: https://apnews.com/article/
341 houston-hypothermia-weather-conroe-texas-8323ab5f5c1612e632f7f2e6c2c20358 [Online], 2021).
342 3. B. Magness. Review of February 2021 extreme cold weather event – ERCOT presentation (Available: https://apnews.com/
343 article/houston-hypothermia-weather-conroe-texas-8323ab5f5c1612e632f7f2e6c2c20358 [Online], 2021).
344 4. L. Xie, M. Bareau, C. Singh and E. Pistikopoulos. Opinions: What went wrong with Texas’s
345 power failure and how to fix it (Available: https : / / www . houstonchronicle . com / opinion / outlook / article /
346 Opinion-Texas-s-power-wipe-out-what-went-15954733.php [Online], 2021).
347 5. International Energy Agency. Severe power cuts in Texas highlight energy security
348 risks related to extreme weather events (Available: https : / / www . iea . org / commentaries /
349 severe-power-cuts-in-texas-highlight-energy-security-risks-related-to-extreme-weather-events [Online], 2021).
350 6. Takahashi, Paul and Blackman, Jeremy. Regulators knew of freeze risk to Texas’ natural gas system.
351 it still crippled power generation. (Available: https : / / www . houstonchronicle . com / business / energy / article /
352 freeze-risk-texas-natural-gas-supply-system-power-16020457.php [Online], 2021).
353 7. W. Englund, S. Mufson and D. Grandoni. Texas, the go-it-alone state, is rattled by the failure to keep the lights on
354 (Available: https://www.washingtonpost.com/business/2021/02/18/texas-electric-grid-failure/ [Online], 2021).
355 8. A. Taylor. Texas’s cold-weather catastrophe is a global warning (Available: https://www.washingtonpost.com/world/2021/
356 02/18/texas-cold-global-climate-change/ [Online], 2021).
357 9. Birchfield, A. B., Xu, T., Gegner, K. M., Shetye, K. S. & Overbye, T. J. Grid structural characteristics as validation criteria
358 for synthetic networks. IEEE Transactions on power systems 32, 3258–3265 (2016).
359 10. Xu, Y. et al. US test system with high spatial and temporal resolution for renewable integration studies. In 2020 IEEE
360 Power & Energy Society General Meeting (PESGM), 1–5 (IEEE, 2020).
361 11. Breakthrough Energy Sciences. A 2030 United States macro grid: Unlocking geographical diversity to accomplish clean
362 energy goals (Available: https://science.breakthroughenergy.org/publications/MacroGridReport.pdf [Online], 2021).
363 12. D. Wu et al. Github repository for analysis of the 2021 Texas power outages (Available: https://github.com/
364 tamu-engineering-research/2021TXPowerOutage [Online], 2021).
365 13. The Electric Reliability Council of Texas. Grid information (Available: http://www.ercot.com/gridinfo [Online], 2021).
366 14. The Electric Reliability Council of Texas. Generation resource and energy storage resource outages and derates, feb 10-19,
367 2021 (Available: http://www.ercot.com/content/wcm/lists/226521/Unit_Outage_Data_20210312.pdf [Online], 2021).
368 15. U.S. Energy Information Administration. Preliminary monthly electric generator inventory (Available: https://www.eia.
369 gov/electricity/data/eia860m/ [Online], 2021).
370 16. Bluefire Studios LLC. PowerOutage.US products (Available: https://poweroutage.us/products [Online], 2021).
371 17. Breakthrough Energy Sciences. U.S. test system with high spatial and temporal resolution for renewable integration studies.
372 DOI: 10.5281/zenodo.4538590 (Available: http://doi.org/10.5281/zenodo.4538590).
8/13373 18. Public Utility Commission of Texas. Second order directing ERCOT to take action and granting exception to commission
374 rules (Available: https://www.puc.texas.gov/51617WinterERCOTOrder.pdf [Online], 2021).
375 19. The Electric Reliability Council of Texas. Nodal operating guides (Available: http://www.ercot.com/mktrules/guides/
376 noperating/current [Online], 2019).
377 20. The Electric Reliability Council of Texas. ERCOT fundamentals training manual (Available: http://mis.ercot.com/
378 misapp/GetReports.do?reportTypeId=13217&reportTitle=ERCOT%20Fundamentals$%$20Training$%$20Manual$&
379 $showHTMLView=$&$mimicKey [Online], 2016).
380 21. Singh, C., Jirutitijaroen, P. & Mitra, J. Electric power grid reliability evaluation: models and methods (John Wiley & Sons,
381 2018).
382 22. The Electric Reliability Council of Texas. Maps (Available: http://www.ercot.com/news/mediakit/maps [Online], 2011).
383 23. National Oceanic and Atmospheric Administration. Rapid refresh (RAP) (Available: https://www.ncdc.noaa.gov/
384 data-access/model-data/model-datasets/rapid-refresh-rap [Online], 2021).
385 24. Texas A&M Engineering Experiment Station. Datasets for ARPA-E PERFORM program (Available: https://electricgrids.
386 engr.tamu.edu/electric-grid-test-cases/datasets-for-arpa-e-perform-program/ [Online], 2011).
387 25. R. D. Zimmerman, C. E. Murillo-Sánchez and R. J. Thomas. MATPOWER’s extensible optimal power flow architecture
388 (Available: https://matpower.org/docs/MATPOWER-OPF.pdf [Online]).
389 26. W. Rickerson. Generator outages during February 2021 cold weather event (Available: http://www.ercot.com/content/
390 wcm/lists/226521/ERCOT_Letter_Re_Feb_2021_Generator_Outages.pdf [Online], 2021).
391 27. Osborn, D. L. Designing self-contingent HVDC systems with the AC systems. In 2016 IEEE Power and Energy Society
392 General Meeting (PESGM), 1–4 (IEEE, 2016).
9/13393 Figures & Tables
a. Generation Capacity and Load (GW)
80 Record-breaking winter peak load
EEA Stage 3 load shedding initiated
70
Peak generation outage
60
50
Estimated Generation Capacity
Actual Online Generation Capacity
40 Actual Load Peak load shedding
02/12 02/13 02/14 02/15 02/16 02/17 02/18
Date
b. c.
90%
Online Wind
Online Solar 70%
Online Nuclear
Online Natural Gas 50%
Online Coal
Offline Wind
Offline Solar 30%
North
Offline Nuclear
Offline Natural Gas 10%
Offline Coal
North Central
East
West
Far West
South Central
Coast
South
Figure 1. Overview of the 2021 ERCOT blackout event from the perspective of generation capacity and load
shedding. a, Blackout event overview in terms of generation capacity and actual load associated with the key event labels. The
significant gap between the estimated generation capacity and actual online capacity before February 15 and increasing
mismatch between them after noon on February 16 are in line with expectations due to several reasons explained in
Supplementary Note 1. b, Online and offline generation capacity by source in ERCOT weather zones at 12:00 p.m. February 16.
The ring size is determined by the zone-level total generation capacity and its color represents the type of generation capacity.
The block color represents the weather zone where the county is located (grey blocks are not within eight weather zones). c,
Normalized county-level customer outage percentage during the "darkest" period. The block color represents the county-level
customer outage percentage16 , where the ERCOT average outage percentage is 31% (grey blocks mean no data available). The
"darkest" period is ranging from 8 p.m. February 15 to 11 a.m. February 16, possessing the largest load shedding amount.
10/13North
North Central
East
Far West West
South Central
Coast
South
Figure 2. Visualization of the large-scale synthetic ERCOT grid. Here the branch width is proportional to the
transmission line rating. This synthetic grid contains 606 generators, 1,350 loads and 3,206 branches, of which the generation
units capacity, transmission line rating and load distribution are calibrated based on the available ERCOT grid-related data.
a. b. c.
Actual 60 Actual
20000 4
Simulated Simulated
Normalized Load Shedding
50
Load Shedding (MW)
3
Generation (%)
15000
40
2 30
10000
20
1
5000
Simulated Load Shedding 10
Actual Load Shedding
0
0 0
02/15 02/16 02/17 02/18 FW North West South NC SC Coast East Natural Gas Coal Nuclear Wind Solar
Date Weather Zones Source Type
Figure 3. Blackout event reproduction via simulation on the synthetic grid in comparison with the real data. a,
Comparison between the simulated and actual total load shedding curves. b, Zone-level normalized load shedding with 95%
confidence interval (CI) during the period between 8 p.m. February 15 and 12 p.m. February 16 that has the highest load
shedding. FW, NC and SC respectively represent Far West, North Central and South Central zones. Here the normalized load
shedding refers to the ratio of load shedding percentage over online load percentage for each zone. We use the estimated load
shedding data based on the counterfactual and actual load data from ERCOT rather than customer outage data16 as the real
benchmark (See Supplementary Note 3). c, Comparison between actual and simulated percentage of generation compositions
of various source types throughout the event.
11/13a. Winterization b. HVDC c. Demand Response
Original
20 20% 20 20
Load Shedding (GW)
40%
60%
15 15 15
10 10 10
Original Original
1 GW 1 GW
5 5 2 GW 5 2 GW
3 GW 3 GW
4 GW 4 GW
0 0 0
02/15 02/16 02/17 02/18 02/15 02/16 02/17 02/18 02/15 02/16 02/17 02/18
Date Date Date
Figure 4. Quantitative assessment of each single sustained supply measure in terms of load shedding (GW). a, The
impacts of additional facility winterization on load shedding with different percentages from 20% to 60%. These percentages
correspond to the winterization for generation capacity of 21.7 GW, 43.4 GW and 65.1 GW. b, The impact of additional HVDC
lines on load shedding with the capacity ranging from 1 to 4 GW. c, The impact of up-scaled demand response program on load
shedding with the capacity ranging from 1 to 4 GW. Note that winterized generator units and demand response programs are
deployed across ERCOT without priority in any specific area. Here the original curve refers to the load shedding in the event
reproduction with no corrective measures.
Source Type Far West West North East Coast North Central South Central South
Nuclear — — — — — — 38,205 —
Natural Gas 37, 058 12, 338 18, 993 16, 908 25, 129 29, 236 18, 905 23, 279
Coal — — — 266 18, 719 1, 967 266 5, 768
Wind 6, 865 15, 178 4, 479 5, 188 795 — — —
Table 1. Quantitative assessment of generation units winterization by source and region in terms of ENS reduction
(MWh). Each entry in the table shows the resulting reduction of ENS (in MWh) for 1 GW generation capacity winterization of
each source type in each weather zone. A crossed-out entry means that the lack of associated generation outage data renders the
evaluation of this certain winterization non-applicable.
a. b. c.
Winterization 10 GW Winterization 20 GW Winterization 30 GW
Additional ENS Reduction (GWh)
400
Demand Response (GW)
4 4 4
360
3 3 3
240
2 2 2
160
1 1 1
80
0 0 0
0
0 1 2 3 4 0 1 2 3 4 0 1 2 3 4
HVDC (GW) HVDC (GW) HVDC (GW)
Figure 5. Additional ENS reduction (GWh) by HVDC and demand response given different winterization portfolios.
a, b, c, respectively show the additional ENS reduction contributed by HVDC and demand response that is represented by both
bubble size and color, given different total winterized generation capacity. Here the winterization portfolios in three cases are
determined based on the results in Table 1 (see Supplementary Table 1 for more details). The ENS reduction contributed by
winterization portfolio alone are respectively 266.2 GWh, 467.0 GWh and 628.9 GWh for the case of 10 GW, 20 GW and 30
GW winterized capacity.
12/13Load Shedding Peak Clipping (GW)
Baseline
Portfolio 1
1.5 Portfolio 2
Portfolio 3
1.0
0.5
0
0 2 4 6 8
Energy Storage (GWh)
Figure 6. Load shedding peak clipping of energy storage facility. The baseline refers to the model without other
corrective measures, while the portfolio 1, 2 and 3 respectively consist of one of three winterization portfolios in
Supplementary Table 1 together with HVDC and demand response of 2 GW capacity.
13/13Figures Figure 1 Overview of the 2021 ERCOT blackout event from the perspective of generation capacity and load shedding. a, Blackout event overview in terms of generation capacity and actual load associated with the key event labels. The signi cant gap between the estimated generation capacity and actual online capacity before February 15 and increasing mismatch between them after noon on February 16 are in line with expectations due to several reasons explained in Supplementary Note 1. b, Online and o ine generation capacity by source in ERCOT weather zones at 12:00 p.m. February 16. The ring size is determined by the zone-level total generation capacity and its color represents the type of generation capacity. The block color represents the weather zone where the county is located (grey blocks are not within eight weather zones). c, Normalized county-level customer outage percentage during the "darkest" period. The block color represents the county-level customer outage percentage16, where the ERCOT
average outage percentage is 31% (grey blocks mean no data available). The "darkest" period is ranging
from 8 p.m. February 15 to 11 a.m. February 16, possessing the largest load shedding amount. 10/

Figure 2

Visualization of the large-scale synthetic ERCOT grid. Here the branch width is proportional to the
transmission line rating. This synthetic grid contains 606 generators, 1,350 loads and 3,206 branches, of
which the generation units capacity, transmission line rating and load distribution are calibrated based on
the available ERCOT grid-related data.

Figure 3
Blackout event reproduction via simulation on the synthetic grid in comparison with the real data. a,
Comparison between the simulated and actual total load shedding curves. b, Zone-level normalized load
shedding with 95% con dence interval (CI) during the period between 8 p.m. February 15 and 12 p.m.
February 16 that has the highest load shedding. FW, NC and SC respectively represent Far West, North
Central and South Central zones. Here the normalized load shedding refers to the ratio of load shedding
percentage over online load percentage for each zone. We use the estimated load shedding data based
on the counterfactual and actual load data from ERCOT rather than customer outage data16 as the real
benchmark (See Supplementary Note 3). c, Comparison between actual and simulated percentage of
generation compositions of various source types throughout the event.

Figure 4

Quantitative assessment of each single sustained supply measure in terms of load shedding (GW). a, The
impacts of additional facility winterization on load shedding with different percentages from 20% to 60%.
These percentages correspond to the winterization for generation capacity of 21.7 GW, 43.4 GW and 65.1
GW. b, The impact of additional HVDC lines on load shedding with the capacity ranging from 1 to 4 GW. c,
The impact of up-scaled demand response program on load shedding with the capacity ranging from 1 to
4 GW. Note that winterized generator units and demand response programs are deployed across ERCOT
without priority in any speci c area. Here the original curve refers to the load shedding in the event
reproduction with no corrective measures.

Figure 5
Additional ENS reduction (GWh) by HVDC and demand response given different winterization portfolios.
a, b, c, respectively show the additional ENS reduction contributed by HVDC and demand response that is
represented by both bubble size and color, given different total winterized generation capacity. Here the
winterization portfolios in three cases are determined based on the results in Table 1 (see Supplementary
Table 1 for more details). The ENS reduction contributed by winterization portfolio alone are respectively
266.2 GWh, 467.0 GWh and 628.9 GWh for the case of 10 GW, 20 GW and 30 GW winterized capacity.

Supplementary Files
This is a list of supplementary les associated with this preprint. Click to download.

    ERCOTOutageSupplementaryNatureEnergy.pdf
You can also read