Evaluating the Economic Fairways for Hydrogen Production in Australia
←
→
Page content transcription
If your browser does not render page correctly, please read the page content below
Evaluating the Economic Fairways for Hydrogen
                   Production in Australia
 Stuart D.C. Walsha,∗, Laura Eastonb , Zhehan Wenga , Changlong Wanga ,
                    Joseph Moloneyb , Andrew Feitzb
        a
            Department of Civil Engineering, Monash University, Melbourne, Australia
                          b
                            Geoscience Australia, Canberra, Australia

Abstract
    Assessments of hydrogen project viability typically focus on evaluating
specific sites for development, or providing generic cost-estimates that are
independent of location. In reality, the success of hydrogen projects will
be intimately linked to the availability of local energy resources, access to
key infrastructure and water supplies, and the distance to export ports and
energy markets. In this paper, we present an economic model that incorpo-
rates assessments of these regional factors to identify areas of high economic
potential for hydrogen production – the so-called “Economic Fairways” for
such projects. In doing so, the model provides a tool that can be used to
inform investors and policy makers on the available opportunities for hydro-
gen development and their infrastructure requirements. The model includes
analysis of the regional economic potential for both blue and green hydrogen
projects. It accounts for hydrogen production from renewable (wind and so-
lar) sources, as well as non-renewable sources (steam-methane reformation
and coal gasification) combined with carbon capture and storage. Results
from case studies conducted with the tool are presented, illustrating the po-
tential for hydrogen production across Australia.
Keywords: Economic Fairways, Green Hydrogen, Blue Hydrogen,
Integrated Economic Assessment, Numerical Cost Modelling

  ∗
      Corresponding Author
      Email address: stuart.walsh@monash.edu (Stuart D.C. Walsh)

Preprint submitted to EarthArXiv (Non-peer reviewed)                         May 18, 2021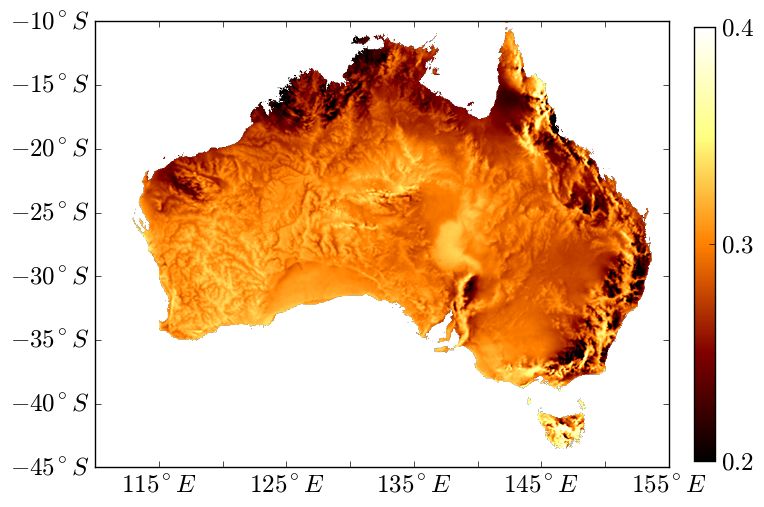
1. Introduction
    Australia, with its abundant natural resources and established energy ex-
port supply chains, appears well placed to participate in a new international
hydrogen-energy market. Involvement in such a market promises a myriad
of potential benefits: from reduced global CO2 emissions, in particular, from
several sectors that have otherwise proven difficult to decarbonise (e.g. in-
dustrial heat, steel and cement production, heavy transport and large-scale
machinery: Bataille et al., 2018; Kato and Kurosawa, 2019; National Hydro-
gen Strategy Taskforce, 2019a; Friedmann et al., 2019); to helping to stabilize
electricity grids reliant on intermittent renewable-energy sources (Gutiérrez-
Martı́n and Guerrero-Hernández, 2012; Bennoua et al., 2015; National Hy-
drogen Strategy Taskforce, 2019a); to increasing diversification and energy
independence through the addition of a new fuel into the energy supply (US
DOE, 2002; Ball and Wietschel, 2009; Ren et al., 2014; Scita et al., 2020).
However, the unprecedented scale and complexity of this new industry calls
for careful planning – requiring the creation of economic models and datasets
capable of assisting policy makers and industry members to implement new
hydrogen projects and supporting regional infrastructure (e.g. Bruce et al.,
2018; ARUP, 2019).
    To date, economic assessments of hydrogen project viability have largely
concentrated on estimating the performance of individual projects or com-
paring the applicability of different technologies. Such analyses are either
insensitive to location or primarily concerned with evaluating outcomes at
specific sites. Nevertheless, at least initially, the success of hydrogen projects
will be intimately linked to a conjunction of several geospatial factors. These
include proximity to transportation infrastructure, distance to export ports,
ready access to water, and the quality of the energy resource required to
produce hydrogen (Feitz et al., 2019; ARUP, 2019). Thus, economic assess-
ments of hydrogen project viability must also account for these factors when
selecting appropriate development locations. Regions with a confluence of
these features will have a greater likelihood of giving rise to hubs for hydro-
gen production, and should therefore be targets for investment to promote
this industry.
    In collaboration with Geoscience Australia, Monash University has devel-
oped an open-source software platform, known as Bluecap, to estimate the
regional economic potential for resource development (Walsh et al., 2020;
Haynes et al., 2020). Originally created to determine regional potential for

                                        2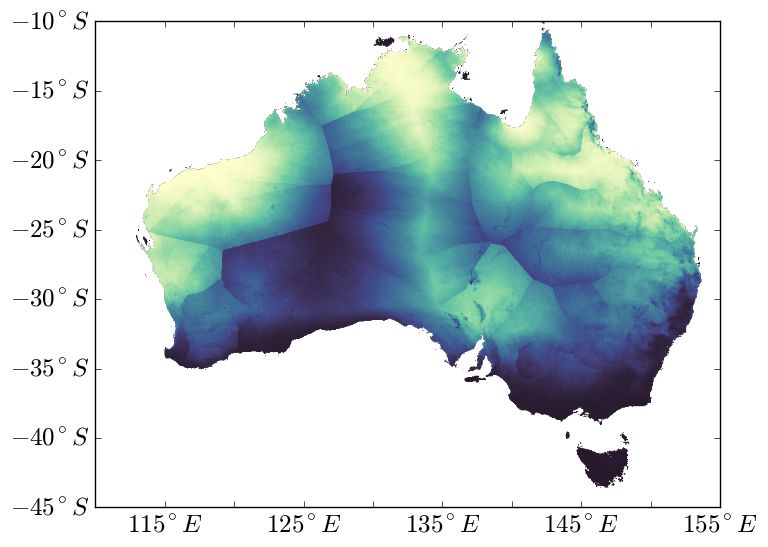
mineral projects, the software platform has recently been extended to eval-
uate the economic potential for blue and green hydrogen.1 Output from
the Bluecap code supports the Hydrogen Economic Fairways Tool hosted on
Geoscience Australia’s Hydrogen Opportunities portal (AusH2) (Geoscience
Australia, 2021).
    In this paper, we describe how the Bluecap software conducts its hy-
drogen project assessments. The hydrogen extension estimates the regional
potential for the development of hydrogen projects across Australia by first
creating a detailed model of hydrogen project value. The model is then
applied to maps detailing the associated energy-resource distributions and
infrastructure availability. In so doing, it identifies strategic areas of high
economic potential for hydrogen production – the “Economic Fairways” of
such projects. In the following sections, we outline the model used to evalu-
ate hydrogen plant economics, and then describe how these calculations are
extended to the regional scale. We also provide examples of case studies
using the code to determine the potential for different classes of large-scale
hydrogen projects.

2. Economic Model
    The Bluecap code can be used to estimate the economic potential of a
project either at a single location or over a prescribed region. A detailed
description of the underlying software, in particular how it is applied to
mineral projects, can be found in Walsh et al. (2020). This section gives an
overview of how the economic analysis is extended to hydrogen projects.
    Bluecap bases its predictions of economic potential on estimates of the
after-tax Net Present Value (NPV) for a potential project. This is calculated
by first assessing the energy required to support a hydrogen plant of a given
annual output. Next, the required power plant capacity is determined based
on the estimated capacity factor for the accompanying energy source at each
location. From these estimates, the code then evaluates the infrastructure
required to support the hydrogen plant and its power source: the water
supply, the cost of transportation, and additional infrastructure to connect

  1
    Here we define blue hydrogen as hydrogen production from non-renewable sources
combined with carbon capture and storage (steam-methane reformation and coal gasifica-
tion), whereas green hydrogen is defined as hydrogen production from renewable sources
(presently limited to wind and solar in the Bluecap code).

                                          3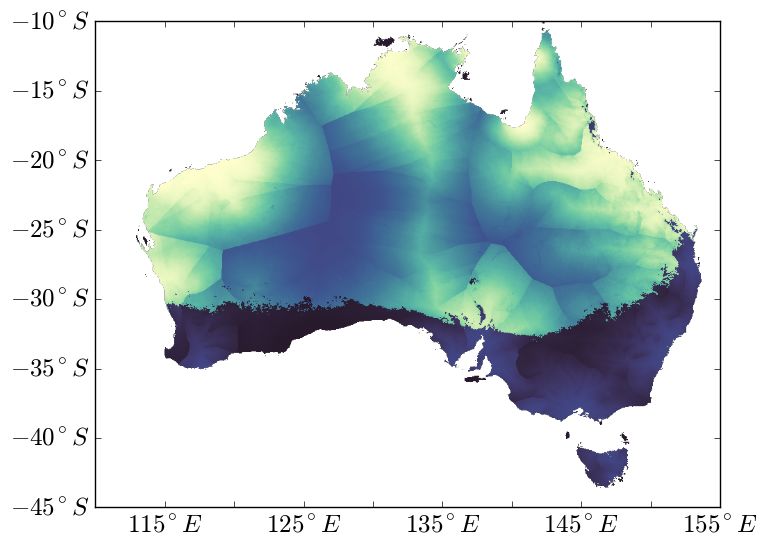
the plant to the electricity grid or to a carbon storage facility if required.
The revenue from the plant and the associated startup and sustaining cost
are then used to determine the before tax and after tax cash flows for the
operation. An estimate of the after-tax NPV of the project is then found from
these cash flows, and used to rank the relative potential for hydrogen project
development. Key stages in this calculation are illustrated in Figure 1.
    The Bluecap code allows the user to select between different development
options for hydrogen projects. In particular, the user has several options for
the means of hydrogen production and the associated power supply. Sup-
ported methods of hydrogen production include electrolysis from wind and
solar (green hydrogen), as well as production from steam-methane reforma-
tion and coal gasification with carbon capture and storage (blue hydrogen).
Default cost models are provided for each method of production. In par-
ticular, a number of different electrolysis cost models are included based
on those given in the Bloomberg New Energy Frontier (Bloomberg New
Energy Finance, 2020), as well as those reported in the CSIRO Hydrogen
Roadmap (Bruce et al., 2018). The figures shown in this paper for renewable
hydrogen were produced using cost models based on the BNEF estimates for
electrolysis from established suppliers. The cost models associated with blue
hydrogen production are provided based on the estimated costs provided in
the CSIRO Hydrogen Roadmap (Bruce et al., 2018). These default models
can be overridden by the user’s own cost models as desired.
    For steam-methane reformation and black- and brown-coal gasification,
the power required for hydrogen production is assumed to be part of the
process of hydrogen production. However, in the case of hydrogen produced
by electrolysis, the user may select from different renewable sources of power
for the power plant. At present three different categories of renewable power
are supported by the model: wind power, photovoltaic solar power, and
Concentrating Solar Power (CSP). In addition, the user can specify hybrid
plants that combine wind and solar power sources.
    By definition blue-hydrogen plants are assumed to operate in conjunc-
tion with carbon capture and storage. While the estimated costs of capture
and storage are included in the original CSIRO-Roadmap, CO2-transmission
costs are not (Bruce et al., 2018). Instead, the Bluecap model calculates these
transmission costs based on the distance between the hydrogen plant loca-
tion and the nearest potential storage reservoir. Likewise, steam-methane
reformation projects must account for transmission costs from the nearest
gas pipeline to the plant location, while coal gasification plants include the

                                      4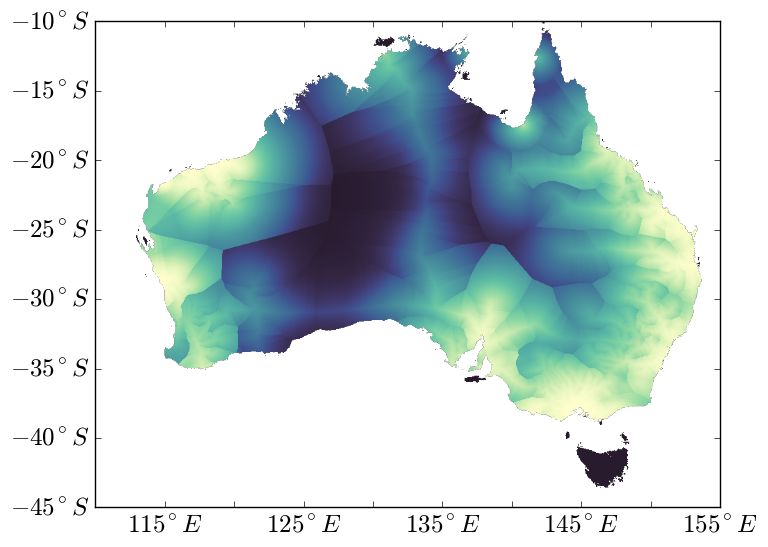
Inputs                       Hydrogen Plant               Power Plant     Infrastructure                                                            Cash Flow    Value
                Discount Factor

             Hydrogen Production                                               Hydrogen
                                                 Hydrogen Plant                                                                          G&A
                    Rate                                                        Capex
                                                   Capacity                                                                              Capex
                                                                                                                         Power
             Hydrogen Production                                                                                                                                        Net Capex
                                                                                                                         Capex
                  Method                                                                                                                                                             NPV
                                                                                                                                                                        Revenue
               Energy resource:
                Types, Quality                                                                 Power Plant:                                               Plant
                                                                                                 Source                                                   Life
                                                                  Hydrogen      Energy
                                                                  Produced     Required        Max Capacity              Power
                                                                                                                         Opex                                           Net Opex
                                                                                                                                         G&A
                                                                                                                                         Opex
                                                                                                                       Water Use
                                                                                                                                          Water       Infrastructure

5
                                                                                                                                          Opex            Opex
                                                                               Hydrogen
                                                                                Opex
                                                                                                                      Transportation
                                                                                                                          Opex            Water
                                                                                                                                          Capex       Infrastructure
                                                                                            Distance to Road/Rail     Transportation                      Capex
                                                                                           Transportation Distances       Capex
                Plant Location
                                                                                                                                       Transmission
                                                                                                                                          Capex
           Existing Infrastructure:
    Road, Rail, Pipelines, Transmission lines                                                Distance to Power
          Ports, Processing Facilities
                                                                                              Distance to Water

              Figure 1: Flowchart illustrating key stages in the economic fairways calculation for hydrogen projects.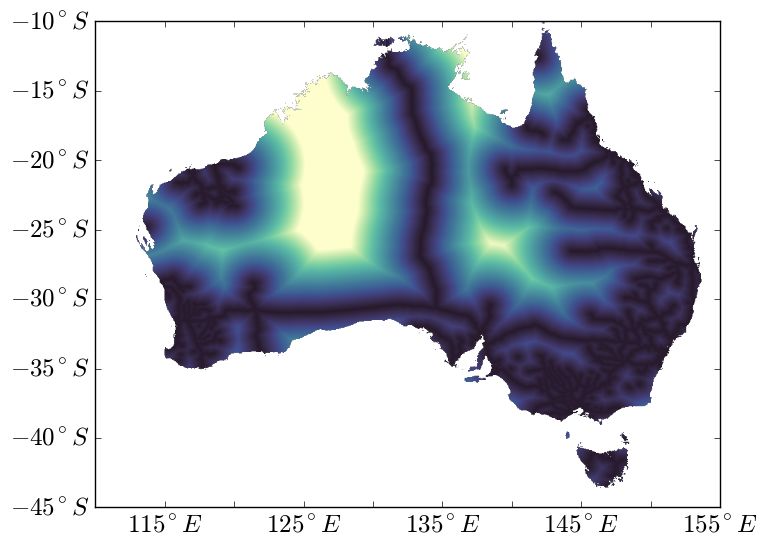
cost of coal transportation from the closest mine.
    Capital and operating costs are determined for each of the renewable
plants as a function of their scale and location. Cost estimates for the wind
and photovoltaic plants are based on data gathered from feasibility studies,
financial reports and company websites for Australian operations. Several
key reports and their databases were used to establish the cost model for
CSP. Specifically, Lovegrove et al. (2018) provide a comprehensive overview of
Australia’s CSP potential, while Hinkley et al. (2016), Bruce et al. (2018) and
International Energy Agency (IEA) (2019) were used to validate several key
assumptions such as cost factors, CSP and thermal storage system coefficient,
location and sizing factor, land use, and water consumption.
    Each plant requires additional infrastructure to operate. Transportation,
water and even power transmission may be required depending on the nature
of the plant. For example, all forms of hydrogen production require some
form of water source, though the amount may vary depending on the water
quality, the nature of the hydrogen plant and its associated power source.
Transportation infrastructure, either road or rail, is needed to supply the
construction material for the plant. Hydrogen produced for export must also
include the cost of transportation to the closest of a select number of ports.
The hydrogen transportation is assumed by the cheapest of three options
(pipeline, road or rail) based on the levelized cost over the lifetime of the
plant.
    Many of these calculations depend not only on the size of the plant, but
also on the proximity of local infrastructure and the quality of the available
energy sources. The details of these considerations, which vary depending
on the plant’s location, are described in the following section.

3. Regional Calculation
    While the economic model outlined in the previous section provides an
estimate of the cost of hydrogen production at a single location, a distin-
guishing feature of the Bluecap model is its ability to estimate the regional
economic potential for particular types of projects. These regional calcula-
tions are performed by combining the plant’s cash flow model with maps of
the capacity factor of the associated power supply, the distance to infrastruc-
ture and transportation distance.
    To do so, the net present value of the hydrogen plant is first calculated
as a function of the capacity factor of the underlying power-supply, ignoring

                                      6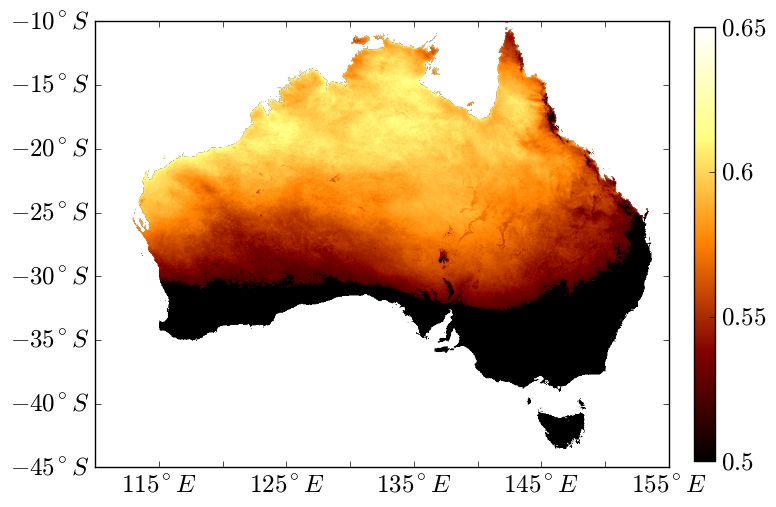
the infrastructure costs. This function is then applied to the map of plant
capacity factors. Next the net present cost of each infrastructure component
is calculated and subtracted from the net present value map. This allows the
code to conduct regional analysis in a matter of seconds – helping to enable
rapid regional scenario modelling and large-scale infrastructure planning.
The solar capacity factor maps used for the figures shown in this paper are
determined from an empirical method based on the average solar exposure.
Capacity factors from existing solar plants are matched against their total
average irradiance determined by the Bureau of Meteorology. This relation-
ship is then used to generate a map of solar capacity factors. User-generated
capacity factor maps may be employed instead if required. Additional restric-
tions are placed on CSP plants, which require a minimum level of irradiance
for successful operation. For example, the International Renewable Energy
Agency (IRENA) (2012), Krarti (2018) and Wang (2019), suggest that a min-
imum 1,600-2,000 kWh per square metre of annual direct normal irradiance
exposure is required to ensure functioning CSP power systems. As such, we
limit the use of CSP to regions with greater than 2,000 kWh exposure per
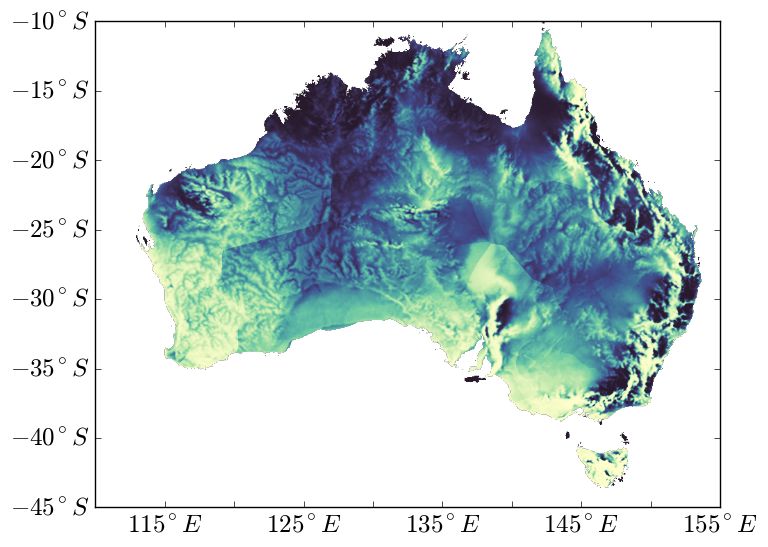
square metre. The resulting capacity maps for photovoltaic plants and CSP
plants are shown in Figure 2a and Figure 2b.
Wind capacity factors are a function of both the available resource and
the type of turbine (the hub-height and turbine model). To this end, tur-
bine manufacturers release power-wind speed curves that relate the output
of the turbine to the speed of the prevailing winds. This data can be used
to determine the expected output when combined with the wind speed dis-
tribution at a given location. While individual power-wind speed curves for
specific turbines can be used to generate capacity factors for those turbines,
in practice no single turbine is optimal for all wind conditions or locations.
To account for the range of turbine specifications, we estimate the capacity
factor using a bounding curve that encompasses the power-wind speed rela-
tionship of 57 different turbines (illustrated in Figure 3). These power-wind
speed relationships were taken from the wind turbine library maintained at
the Open Energy Platform (Open Energy Platform, 2020). For the present
calculation, only turbines with a maximum capacity of 3,600 MW or less were
considered to match the maximum capacity of typical onshore windfarms in
Australia.
Local average wind speed distributions are determined from a 5 km-
resolution mesoscale wind atlas for Australia produced by Garrad Hassan
Pacific Pty Ltd (2015). The variation in the wind speed is determined by
7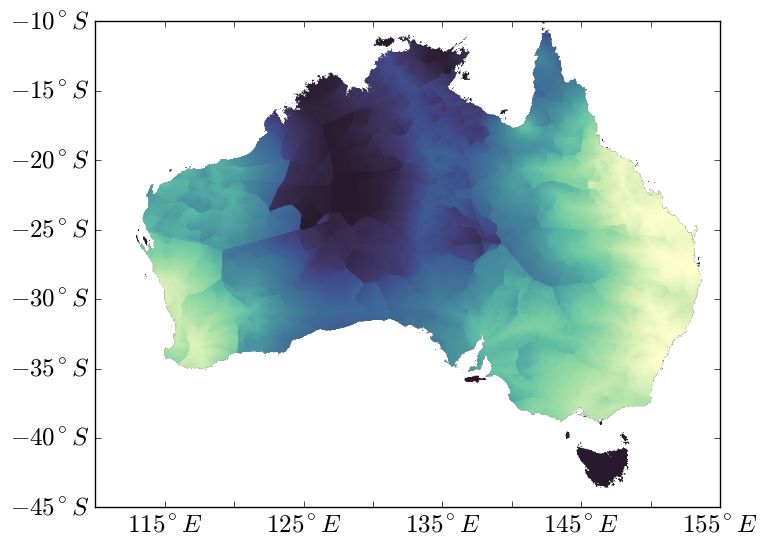
taking the local standard deviation of wind speeds given in the MERRA-
2.0 database (Global Modeling and Assimilation Office, 2015a), normalized
by the average wind speed. From this data, local distributions in the wind
speed are modelled as Weibull functions with the same mean and scaled stan-
dard deviation. The local wind speed capacity is then estimated from this
data and the bounding power-wind speed relationship for the turbines. The
resulting map is show in Figure 2c.

a)                                         b)

                     c)

Figure 2: Capacity-factor maps for a) Photovoltaic solar; b) Concentrated solar power;
and c) Wind power (150m hub-height). Note differences in scale between plots.

    Hybrid power plants that combine wind and solar sources are also con-
sidered in the model. For these resources, we fix the ratio of wind and solar
to the nameplate capacity of the plant as a whole. Next from the MERRA2
datasets for hourly wind speed and solar exposure (Global Modeling and As-
similation Office, 2015a,b), we calculate the hourly output from each power
source as a fraction of their total capacity. In so doing, we must decide
on the amount of curtailed energy. Rather than adopt a fixed curtailment
rate (for example as done in Bloomberg New Energy Finance, 2020), instead
we assume that the larger of the power plants is scaled to meet the energy

                                          8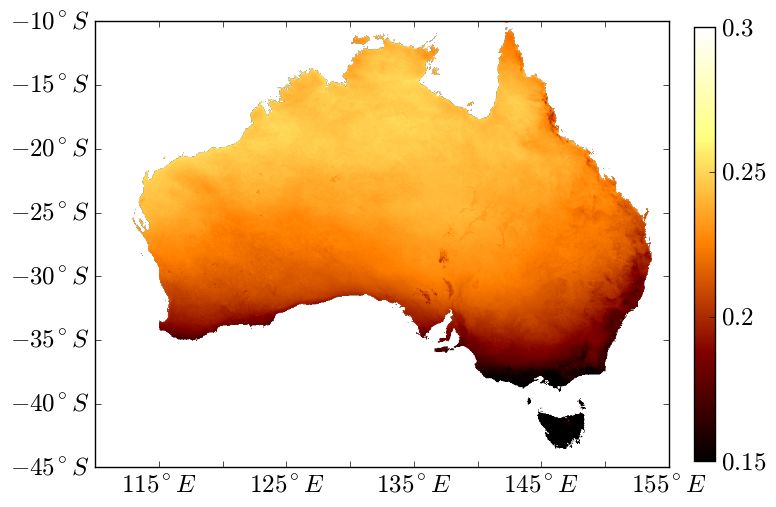
4.0
                                                                                           1.0
              3.5

                                                              Fraction of Maximum Output
              3.0                                                                          0.8
              2.5
     Power (MW)

                                                                                           0.6
              2.0
              1.5                                                                          0.4

              1.0
                                                                                           0.2
              0.5
              0.00   5   10     15 20 25       30   35                                     0.0
                                                                                             0   5   10     15      20   25   30   35
   a)                         Velocity (m/s)             b)                                               Velocity (m/s)

Figure 3: Wind capacity factors are determined using a bounding power-wind speed curve:
a) Published power profiles of 57 turbines based on data from Open Energy Platform
(2020); b) The profiles are scaled between 0 and 1 and the bounding curve (red dashed
line) is used in conjunction with the wind speed distribution to estimate the regional
capacity factors.

demands of hydrogen production when running at maximum capacity. How-
ever, the power plant will run below this capacity much of the time. When
it does so, its power will be supplemented by the output from the second
power station. Excess energy produced when the combined output exceeds
the hydrogen plant’s maximum capacity is assumed to be curtailed.
    We also include an assessment of hydrogen production from non-renewable
resources, namely coal-gasification and steam-methane reformation from nat-
ural gas. These projects involve separate considerations to those employed
in the renewable energy calculation. For these models, we again assume that
the hydrogen plant may be located at any point within Australia, but that a
supply of coal or gas is required to operate. For steam-methane reformation,
we assume that gas is supplied from any of the existing major gas pipelines
around Australia (Geoscience Australia, 2014; OpenStreetMap contributors,
2018; WAPPIPE, 2020). For coal-gasification, we assume that the coal is
transported by truck from an existing coal mine (based on data in Hughes,
2019) to the hydrogen plant. The locations of the mines and pipelines con-
sidered in the model are shown in Figure 4.
    For steam-methane-reformation projects, gas-pipeline connection costs
are determined based on the distance from the hydrogen plant location to the
closest gas-pipeline. We assume that gas is supplied to the plant with stan-
dard 8-inch pipelines, using costs based on those provided by the Core En-
ergy Group (2015). The cost of hydrogen-production for the steam-methane-

                                                         9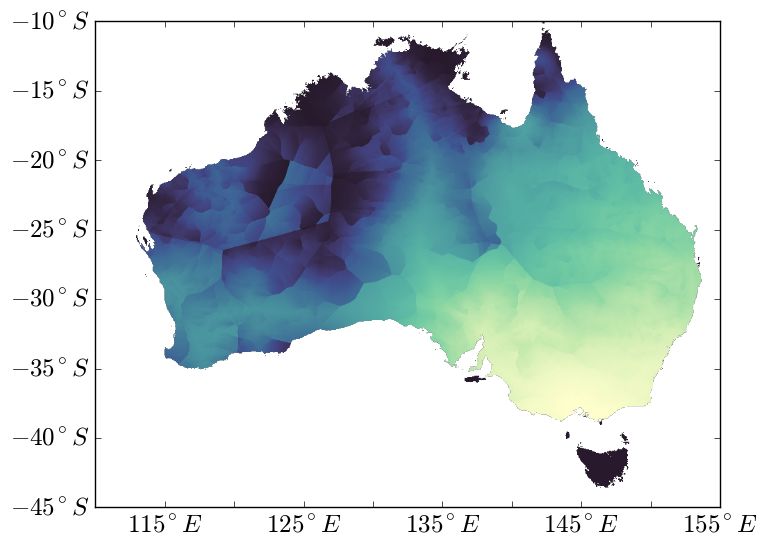
Figure 4: Locations of carbon sequestration reservoirs, gas pipelines and mines considered
when determining hydrogen production from nonrenewable sources.

reformation plant is based on estimates given in the CSIRO Hydrogen Roadmap (Bruce
et al., 2018). Coal for coal-gasification is likewise assumed to be sourced from
currently-operating black-or-brown coal mines from around Australia. The
cost of coal transportation is based on the distance traveled, the fleet costs
and the mass transported using estimates in the AusIMM mine cost estima-
tion handbook (Burt et al., 2012) adjusted to present-day prices (Australian
Bureau of Statistics, 2020).
    Both steam-methane reformation and coal gasification produce carbon
dioxide that must be sequestered for the production of blue hydrogen. Based
on work conducted under the National Carbon Mapping and Infrastructure
Plan (Carbon Storage Taskforce, 2009), Geoscience Australia has identified
several potential reservoirs at an advanced stage of development for long-term
CO2 sequestration (Feitz et al., 2019). Again, while the CSIRO Hydrogen
Roadmap (Bruce et al., 2018) includes the costs of sequestration in its esti-
mates, it does not account for the transmission cost. Instead, these expenses
are represented using a model of CO2-transmission costs developed for the
Australian market (Wiley et al., 2015). The transmission-cost model requires
an estimate of the amount of CO2 that must be sequestered at the site. The
amount of carbon dioxide sequestered depends on the type of plant and the
mass of hydrogen produced.
    For steam-methane reformation, the equations governing hydrogen pro-
duction can be summarized as a steam-methane reforming reaction:

                             CH4 + H2 O → CO + 3H2 ,                                  (1)

                                           10
followed by a water-gas shift reaction:
CO + H2 O → CO2 + H2 , (2)
i.e. four molecules of hydrogen (H2 ) are produced for each molecule of carbon
dioxide. This amounts to approximately 5.5 kg CO2 /kg H. However, rates
of 10-11 kg CO2 /kg H may be more typical of real systems due to process
inefficiencies (Bruce et al., 2018).
Production of hydrogen from coal may be approximated by the following
(unbalanced) coal gasification reaction:
CH0.8 + O2 + H2 O → H2 + CO2 + CO . (3)
Carbon monoxide produced in this reaction can then be employed in a water-
gas shift reaction as above (Tidball and Knoke, 2009). In practice, different
sources of coal contain different proportions of hydrogen and carbon, as well
as additional elements such as sulfur, nitrogen, and oxygen. Likewise, process
inefficiencies will again affect conversion ratios. National Renewable Energy
Laboratory (NREL) assessments of hydrogen production that account for re-
action thermodynamics and multiple chemical species estimate a ratio of ap-
proximately 22-25 kg CO2 /kg H (Steward et al., 2008), while estimated CO2
outputs from industrial trial-facilities are substantially higher (e.g. HESC
Project Partners, 2019). Accordingly, we provide the user with the ability
to set both the amount of CO2 produced and fuel consumed per kilogram of
hydrogen generated.
Additional infrastructure (e.g. water, power and transportation) is re-
quired to support the production of hydrogen. The nature of this infras-
tructure depends on the form of the plant and the intended market for the
produced hydrogen. These infrastructure costs are determined by combin-
ing cost models for each component (typically expressed as functions of the
amount of hydrogen produced and the distance required) with maps of the
distances to existing assets or transportation distances to export ports – for
example, a) distance to the nearest water source (wastewater or seawater);
b) pipeline distance to export ports; c) distance to road transportation; and
d) distance to rail. Examples of such regional distance maps are shown in
Figure 5.
In particular, a water source is required for all hydrogen plants – although
the amount will vary depending on the mode of production and as water may
11a) b)
c) d)
Figure 5: Examples of infrastructure-distance maps: a) distance to the nearest water
source (wastewater or seawater); b) pipeline distance to export ports; c) distance to road
transportation; and d) distance to rail. Maps derived from Australian Bureau of Statistics
(2016), ARUP (2019) and the Open Street-Maps database (OpenStreetMap contributors,
2018)
12be required for cooling. Water transmission costs are estimated from a lin-
ear fit of cost estimates for 54 pipelines (Miriam Vale Shire Council, 2007;
Tonkin Science Engineering, 2011; Wise and Raft, 2013; Gao et al., 2016), as
detailed in Walsh et al. (2020). It should be noted that there is considerable
community concern in Australia over freshwater use for large-scale hydrogen
production (National Hydrogen Strategy Taskforce, 2019b). Thus, water is
assumed to be obtained from either seawater through desalination or from
wastewater sources from high density urban areas or regional townships for
large-scale hydrogen production (Feitz et al., 2019). Here, towns listed as
having populations above 10,000 on the ABS 2016 UCL (urban center and
localities) list are used as a proxy for high density urban areas with wastew-
ater recycling facilities (Australian Bureau of Statistics, 2016).
Road or rail connections are required to construct each plant, and addi-
tional transportation costs may need to be accounted for if the hydrogen is
intended for the export market. These road and rail infrastructure require-
ments and transportation distances are determined from the Open Street-
Maps database (OpenStreetMap contributors, 2018). The maps are used to
calculate both the distance to the closest road or rail line and the shortest
route to the nearest export port. Not all ports will be suited to hydrogen
export due to the need for a liquid berth, as well as minimum channel and
berth specifications. Thus we base our list of export locations on the ports
compiled in the Australian Hydrogen Hubs Study (ARUP, 2019). Transport
infrastructure costs (road and rail connections) are determined from those
given in the AusIMM cost estimation handbook (Burt et al., 2012), while
ongoing costs are taken from the estimates in the CSIRO Roadmap (Bruce
et al., 2018). Pipeline transmission costs are based on estimates in Kan and
Shibata (2018) for hydrogen pipeline transmission in Australia, which in-
clude both capital and ongoing cost-estimates. At each point in the regional
calculation, we determine the net present cost of each transportation option
and select the method that results in the minimum overall net present cost.
4. Case studies
In this section, we present the results of example assessments generated
by the Bluecap model. The Hydrogen Economic Fairways Tool is used to
estimate the potential for hydrogen production from large scale solar and
wind farms, steam-methane reformation and coal production.
13The first case study considers the economic potential of hydrogen produc-
tion from a large-scale photovoltaic solar facility. For this study, we consider
an export-scale plant with a capacity of 0.5 Mt.yr−1 . We assume produced
hydrogen is sold at the export port for a price of $5.50 AUD/kg H2 . Results
are shown in Figure 6, which presents the regional NPV for this particular
project. Nevertheless, it should be noted that the absolute NPV is sensitive
to the assumed export price which is somewhat speculative. Instead, we fo-
cus on the relative value of each region by mapping the percentile ranking of
each location in Figure 7a.
The results in both Figure 6 and Figure 7a suggest significant prospects
for the development of such a facility in the northern states and territories,
as well as the central southern parts of the mainland (in the state of South
Australia). It should be noted that many of these areas also rank highly
for development of CSP projects (Figure 7b). It is evident from the earlier
capacity maps given in Figure 2a and b, that these regions benefit from
excellent solar resources. However, it is also clear that the high cost of
hydrogen transmission is influential in determining which locations are best
suited for hydrogen production. Proximity to export ports and ready access
to transportation infrastructure are also key factors in determining regional
rankings.
Figure 6: Predicted regional NPV for a large-scale solar-powered hydrogen plant.
Next we consider the economic fairways for hydrogen and wind develop-
ment. Sites appropriate for large-scale production of renewable energy from
wind are found in all states. However, only a few are located close to trans-
portation routes and export ports. In addition, as illustrated in Figure 2c,
wind speeds show greater spatial variation compared to solar irradiance. As
14a) b)
c)
Figure 7: Regional percentile-rankings (0% worst, 100% best) for hydrogen production
from renewable resources: a) Photovoltaic solar power; b) CSP; and c) Wind power.
15a result the economic fairways for hydrogen produced from wind power are
sparser and more widely distributed. Nevertheless, there are notable pockets
of high potential for wind production in north-eastern Australia, and across
the southern parts of the mainland and Tasmania. It should be noted that
under the present model, wind power typically has a higher break-even hydro-
gen price (i.e. the minimum price required to achieve a positive NPV) than
solar-powered projects - particularly for large-scale operations. Although
wind power benefits from higher capacity factors, the economies of scale dis-
advantage wind production over solar developments. While there appear
to be economic advantages to larger solar plants, the reported cost of wind
farms changes little per unit capacity as a function of the scale of the oper-
ation (perhaps due to the discrete nature of individual turbine installation).
Nevertheless, there are other reasons to consider hydrogen production in con-
junction with wind power – for example as a means of energy storage or as
an alternative revenue stream to offset periods of low electricity prices.
a) b)
c)
Figure 8: Regional percentile-rankings (0% worst, 100% best) for hydrogen production
from non-renewable resources with carbon capture and storage: a) Steam-methane refor-
mation; b) Black-coal gasification; and c) Brown-coal gasification.
In Figure 8, we consider the results of the economic fairways analysis for
16blue hydrogen production. The figures show the results for steam-methane
reformation (Figure 8a) and black and brown coal-gasification projects com-
bined with carbon capture and storage (Figures 8b & c).
The economics of hydrogen production from steam-methane reformation
are dictated by the existing gas infrastructure and proximity to likely carbon
capture and storage locations. North-western Western Australia is again
highlighted as a particularly prospective region for hydrogen production. The
existing ports and transportation infrastructure supporting gas production,
and the close proximity of potential CO2 storage sites make the region an
extremely attractive location for large-scale hydrogen production.
Similarly for black and brown coal mines, the proximity of a carbon stor-
age reservoir is a key factor in determining the greatest prospectivity for
hydrogen production. Existing coal mines are already serviced by roads and
are in many cases relatively close to port. However, due to the amount
of CO2 produced, the costs of sequestration are comparable to the costs of
hydrogen transportation. The distance to sequestration sites in advanced
stages of development currently inhibits competitive hydrogen production
from black-coal mining in south western Australia (Figure 9b), while favour-
ing production in the east that lie closer to CO2 storage basins.
The maps presented in Figure 9 show the spatial distribution of the re-
gions predicted to be in the upper 95th percentile for each form of hydro-
gen production. Figure 9a shows those regions most favourable to hydrogen
production from renewable sources, while Figure 9b presents the equivalent
for non-renewable sources combined with carbon capture and storage. Di-
rect comparisons between projected values for different resources should be
treated with caution, due to the uncertainties associated with cost estima-
tion for each project type. Nevertheless, the Bluecap model can be used to
identify areas with high potential for success from not just one, but a number
of different production methods. This is important from the perspective of
infrastructure planning. At the most basic level, export, transmission and
storage facilities should be located close to regions best able to take advan-
tage of multiple potential hydrogen suppliers. Moreover, identifying regions
with high potential for multiple production methods is also necessary under
bridging scenarios, in which non-renewable sources initiate industry develop-
ment and establish trading pipelines, while technological developments make
prices for renewable/green hydrogen more competitive.
17a) b)
Figure 9: Regions ranked in the 95th percentile for different categories of hydrogen pro-
duction from (a) renewable sources and (b) non-renewable sources with carbon capture
and storage.
5. Conclusion
Hydrogen provides a potential solution to the problems of decarboniz-
ing large-scale transportation, steel and cement production, and industrial
heat. It also offers benefits in the form of energy security and grid stability.
However, producing a new energy supply of a similar magnitude to existing
energy pipelines will involve a monumental engineering effort.
Successful hydrogen development will require a combination of factors:
sufficient energy and water resources, proximity to markets, as well as sup-
porting infrastructure. Identifying locations with a concentration of these
factors will help governments to direct funding and plan infrastructure to
better support the nascent industry, as well as recognise opportunities for
investors.
Here, we have presented one such tool for determining the economic fair-
ways for hydrogen production, i.e. those regions favoured to succeed from an
economic perspective. The tool assesses regional economic potential by com-
bining economic models of hydrogen production with regional assessments
of resource potential and access to infrastructure. Its rapid analysis enables
scenario testing, helping to prioritize future research and investment. In so
doing, it provides a novel platform to highlight areas of strategic importance
for hydrogen project development for the benefit of industry, government and
the community.
18Acknowledgements
We gratefully acknowledge the support for this project provided under
Geoscience Australia’s Exploring for the Future program. We also thank
Marcus Haynes for his guidance on implementing the Hydrogen Economic
Fairways tool’s user interface, creating a publicly accessible platform for
user’s to interact with the Bluecap code. We also acknowledge the sup-
port provided by individuals, industry groups and government organisations
which enabled this work. L. Easton, J. Moloney and A. Feitz publish with
the permission of the CEO of Geoscience Australia.
References
ARUP, 2019. Australian Hydrogen Hubs Study: Technical Study. Technical
Report. COAG Energy Council Hydrogen Working Group.
Australian Bureau of Statistics, 2016. 1270.0.55.004 - Australian Statistical
Geography Standard, Volume 4 - Significant Urban Areas, Urban Centres
and Localities.
Australian Bureau of Statistics, 2020. Cat. No. 6427.0 - Producer Price
Indexes, Australia, Sep 2020. Table 11. Input to the Coal mining industry,
index numbers and percentage changes .
Ball, M., Wietschel, M., 2009. The future of hydrogen–opportunities and
challenges. International Journal of Hydrogen Energy 34, 615–627.
Bataille, C., Åhman, M., Neuhoff, K., Nilsson, L.J., Fischedick, M., Lecht-
enböhmer, S., Solano-Rodriquez, B., Denis-Ryan, A., Stiebert, S., Wais-
man, H., et al., 2018. A review of technology and policy deep decar-
bonization pathway options for making energy-intensive industry produc-
tion consistent with the paris agreement. Journal of Cleaner Production
187, 960–973.
Bennoua, S., Le Duigou, A., Quéméré, M.M., Dautremont, S., 2015. Role
of hydrogen in resolving electricity grid issues. International Journal of
Hydrogen Energy 40, 7231–7245.
Bloomberg New Energy Finance, 2020. Hydrogen – the economics of pro-
duction from renewables, full report. Technical Report. Bloomberg.
19Bruce, S., Temminghoff, M., Hayward, J., Schmidt, E., Munnings, C., Pal-
freyman, D., Hartley, P., 2018. National hydrogen roadmap. Australia:
CSIRO .
Burt, K., Lockyer, C., McShane, K., Fong, O.T. (Eds.), 2012. Cost estimation
handbook, Second Edition, Monograph 27. Australasian Inst. of Mining
and Metallurgy.
Carbon Storage Taskforce, 2009. National Carbon Mapping and Infrastruc-
ture Plan–Australia: Full Report. Technical Report. Department of Re-
sources Energy and Tourism, Canberra.
Core Energy Group, 2015. Gas Production and Transmission Costs Eastern
and South Eastern Australia. Technical Report. Core Energy Group.
Feitz, A.J., Coghlan, R., Tenthorey, E., 2019. Prospective Hydrogen Produc-
tion Regions of Australia. Technical Report. Geoscience Australia.
Friedmann, S.J., Fan, Z., Tang, K., 2019. Low-carbon heat solutions for
heavy industry: sources, options, and costs today. Columbia University
Center on Global Energy Policy .
Gao, L., Hou, C., Chen, Y., Barrett, D., Mallants, D., Li, W., Liu, R., 2016.
Potential for mine water sharing to reduce unregulated discharge. Journal
of Cleaner Production 131, 133–144.
Garrad Hassan Pacific Pty Ltd, 2015. DNV-GL Wind speed at 150m, in:
AREMI National Map portal.
Geoscience Australia, 2014. National onshore gas pipelines database.
Geoscience Australia, 2021. AusH2 - Australia’s Hydrogen Opportunities
Tool (AusH2.ga.gov.au). URL: AusH2.ga.gov.au.
Global Modeling and Assimilation Office, 2015a. MERRA-2
inst1 2d asm Nx: 2d,1-Hourly, Instantaneous, Single-Level, Assimi-
lation, Single-Level Diagnostics V5.12.4 doi:10.5067/3Z173KIE2TPD.
Global Modeling and Assimilation Office, 2015b. MERRA-
2 tavg1 2d rad Nx: 2d,1-Hourly,Time-Averaged,Single-
Level,Assimilation,Radiation Diagnostics V5.12.4
doi:10.5067/Q9QMY5PBNV1T.
20Gutiérrez-Martı́n, F., Guerrero-Hernández, I., 2012. Balancing the grid loads
by large scale integration of hydrogen technologies: The case of the spanish
power system. International journal of hydrogen energy 37, 1151–1161.
Haynes, M., Walsh, S., Czarnota, K., Northey, S., Yellishetty, M., 2020.
Economic fairways assessments across northern Australia. Exploring for
the Future: extended abstracts, Geoscience Australia, Canberra , 1–4.
HESC Project Partners, 2019. Submission to National Hydrogen Strategy
Taskforce: HESC case study.
Hinkley, J., Hayward, J., McNaughton, R., Gillespie, R., Matsumoto, A.,
Watt, M., Lovegrove, K., 2016. Cost assessment of hydrogen produc-
tion from PV and electrolysis. Report to ARENA as part of Solar Fuels
Roadmap, Project A-3018 , 1–4.
Hughes, A., 2019. Australian Operating Mines Map. Technical Report.
Geoscience Australia.
International Energy Agency (IEA), 2019. The Future of Hydrogen: Seizing
Today’s Opportunities. Technical Report. International Energy Agency.
International Renewable Energy Agency (IRENA), 2012. Renewable energy
technologies: Cost analysis series. Technical Report.
Kan, S., Shibata, Y., 2018. Evaluation of the economics of renewable hydro-
gen supply in the apec region, in: 34th Conference on Energy, Economy,
and Environment, Japan Society of Energy and Resources (JSER).
Kato, E., Kurosawa, A., 2019. Evaluation of Japanese energy system toward
2050 with TIMES-Japan–deep decarbonization pathways. Energy Procedia
158, 4141–4146.
Krarti, M., 2018. Optimal design and retrofit of energy efficient buildings,
communities, and urban centers. Butterworth-Heinemann.
Lovegrove, K., Bader, R., Fernandez, D., Urkalan, K., 2018. Concentrat-
ing Solar Thermal Technology Status - Informing A CSP Road Map for
Australia. Technical Report. Turner, ACT, Australia.
21Miriam Vale Shire Council, 2007. Engineering estimates and financial im-
plication of pipeline and desalination options for Agnes water and 1770.
Technical Report. Prepared by Burns Bridge Transactions.
National Hydrogen Strategy Taskforce, 2019a. National hydrogen industry
– Issues paper series – Developing a hydrogen export industry. Technical
Report. Department of Industry, Innovation and Science.
National Hydrogen Strategy Taskforce, 2019b. National hydrogen industry
– Issues paper series – Understanding community concerns for safety and
the environment. Technical Report. Department of Industry, Innovation
and Science.
Open Energy Platform, 2020. Wind turbine library. URL:
https://openenergy-platform.org/dataedit/view/supply/wind turbine library.
OpenStreetMap contributors, 2018. Planet data retrieved from
https://planet.osm.org, 2018. https://www.openstreetmap.org .
Ren, J., Andreasen, K.P., Sovacool, B.K., 2014. Viability of hydrogen path-
ways that enhance energy security: a comparison of China and Denmark.
International journal of hydrogen energy 39, 15320–15329.
Scita, R., Raimondi, P.P., Noussan, M., 2020. Green Hydrogen: the Holy
Grail of Decarbonisation? An Analysis of the Technical and Geopolitical
Implications of the Future Hydrogen Economy. Fondazione Eni Enrico
Mattei Working Papers .
Steward, D., Ramsden, T., Zuboy, J., 2008. H2A production model, version
2 user guide. Technical Report. National Renewable Energy Lab.(NREL),
Golden, CO (United States).
Tidball, R., Knoke, S., 2009. Hydrogen and Our Energy Future.
Technical Report. US Department of Energy Hydrogen Program.
doi:10.2172/950018.
Tonkin Science Engineering, 2011. Pipeline to the Sea, Feasibility Study -
Phase 1. Technical Report. Murray-Darling Basin Authority.
US DOE, 2002. A National Vision of America’s Transition to a Hydrogen
Economy—To 2030 and Beyond. Technical Report. US DOE.
22Walsh, S.D., Northey, S.A., Huston, D., Yellishetty, M., Czarnota, K., 2020.
Bluecap: A geospatial model to assess regional economic-viability for min-
eral resource development. Resources Policy 66, 101598.
Wang, Z., 2019. General design of a solar thermal power plant, in: Wang, Z.
(Ed.), Design of Solar Thermal Power Plants. Academic Press, pp. 117 –
224. doi:https://doi.org/10.1016/B978-0-12-815613-1.00003-1.
WAPPIPE, 2020. Western Australian Petroleum Pipelines. Technical Re-
port. Government of Western Australia Department of Mines, Industry
Regulation and Safety.
Wiley, D., Neal, P., Ho, M., Fimbres Weihs, G., 2015. Carbon dioxide trans-
port and storage, in: Australian Power Generation Technology Report.
Electric Power Research Institute, Inc., pp. 179–201.
Wise, N., Raft, S., 2013. Final Report, Pipeline NSW Program. Technical
Report. NSW Office of Water, Department of Primary Industry NSW.
23You can also read