Trend Analysis of Air Quality Index (AQI) and Greenhouse Gas (GHG) Emissions in Taiwan and Their Regulatory Countermeasures
←
→
Page content transcription
If your browser does not render page correctly, please read the page content below
environments

Article
Trend Analysis of Air Quality Index (AQI) and
Greenhouse Gas (GHG) Emissions in Taiwan and Their
Regulatory Countermeasures
Wen-Tien Tsai * and Yu-Quan Lin

                                          Graduate Institute of Bioresources, National Pingtung University of Science and Technology,
                                          Pingtung 912, Taiwan; wsx55222525@gmail.com
                                          * Correspondence: wttsai@mail.npust.edu.tw; Tel.: +886-8-770-3202

                                          Abstract: A reduction in the energy-related emissions of air pollutants would not only mitigate
                                          climate change but would also improve local air quality and public health. This paper aimed to
                                          analyze the trends of air quality index (AQI) and greenhouse gas (GHG) emissions in Taiwan by
                                          using the latest official statistics. In addition, this study also summarized regulatory measures for
                                          controlling air pollution from the energy sector with relevance to sustainable development goals
                                          (SDGs). With the joint efforts by the public and private sectors, the change in the total GHG emissions
                                          did not vary much with the exception of 2009, ranging from 250 to 272 million metric tons of CO2
                                          equivalent from 2005 through 2019. Based on the data on AQI, the percentage of AQI by station-day
                                          with AQI > 100 has decreased from 18.1% in 2017 to 10.1% in 2020, indicating a decreasing trend

                                   for all criteria air pollutants. On the other hand, the coronavirus disease (COVID-19) lockdown, in
                                          2019, has positively impacted Taiwan’s urban air quality, which was consistent with those observed
Citation: Tsai, W.-T.; Lin, Y.-Q. Trend
                                          in other countries. This consistent situation could be attributed to the climate change mitigation
Analysis of Air Quality Index (AQI)
                                          policies and promotional actions under the revised Air Pollution Control Act and the Greenhouse
and Greenhouse Gas (GHG)
Emissions in Taiwan and Their
                                          Gas Reduction and Management Act of 2015. In response to the SDGs launched by the Taiwan
Regulatory Countermeasures.               government in 2018, achieving the relevant targets by 2030 can be prospective.
Environments 2021, 8, 29. https://
doi.org/10.3390/environments8040029       Keywords: greenhouse gas emission; air quality index; trend analysis; climate change mitigation;
                                          sustainable development goal
Academic Editors: Zulema Varela Río,
Hector Morillas and
Patricia Sanmartín
                                          1. Introduction
Received: 1 March 2021
                                               Global warming in connection with the anthropogenic emissions of greenhouse gases
Accepted: 7 April 2021
                                          (GHG) has been recognized by the Kyoto Protocol in 1997. More seriously, extreme climate
Published: 8 April 2021
                                          events such as heatwaves, tropical cyclones, and heavy rainfall have made the weather
                                          patterns unpredictable, causing disasters and damage. According to the protocol, the target
Publisher’s Note: MDPI stays neutral
                                          GHG included carbon dioxide (CO2 ), methane (CH4 ), nitrous oxide (N2 O), and fluorinated
with regard to jurisdictional claims in
                                          gases (F-gases). At the global scale, about 50 billion metric tons in terms of carbon dioxide
published maps and institutional affil-
iations.
                                          equivalents (CO2eq ) were emitted from anthropogenic activities each year [1], which mostly
                                          came from the energy sector using fossil fuels for the production of electricity, heat, or steam.
                                          In this regard, a reduction in the emissions of air pollutants from energy, transportation,
                                          and industry would not only mitigate climate change but would also improve local air
                                          quality and public health.
Copyright: © 2021 by the authors.
                                               It is well known that burning fossil fuels release both air pollutants and GHG (i.e.,
Licensee MDPI, Basel, Switzerland.
                                          CO2 , CH4, and N2 O). These air pollutants like ozone (O3 ) and particulate matter (PM)
This article is an open access article
                                          also involve global warming because they are also climate-relevant and thus known as
distributed under the terms and
conditions of the Creative Commons
                                          short-lived climate pollutants (SLCPs) [2–8]. For example, ozone is a powerful oxidant
Attribution (CC BY) license (https://
                                          and thus plays a vital role in the formation of photochemical compounds like peroxyalkyl
creativecommons.org/licenses/by/          nitrates (PAN) [9]. The health effects of PM (especially in fine PM, or called PM2.5 ), ozone,
4.0/).                                    and its resulting chemicals are closely connected with the lung functions and respiratory

Environments 2021, 8, 29. https://doi.org/10.3390/environments8040029                                  https://www.mdpi.com/journal/environments
Environments 2021, 8, 29 2 of 14
system [10,11]. In addition, black carbon, a component of PM, may cause local warming or
cooling if it deposits on ice and snow, or suspends in the air. Poor air quality is also caused
by the combustion products of fossil fuels, including nitrogen oxides, methane, and other
volatile organic compounds (VOCs). By photochemical reactions, these air pollutants will
combine in the troposphere to form ozone [9]. As mentioned above, climate change and air
pollutants share common sources, implying that reducing air pollution (or improving air
quality) and mitigating climate change in an integrated way would be the most effective
approach [12–15].
In Taiwan, the central competent authority (i.e., Environmental Protection Adminis-
tration, abbreviated as TEPA) is responsible for the issues of air quality and climate change.
According to the Greenhouse Gas Reduction and Management Act of 2015 [16], the TEPA
should submit the National Inventory Report (NIR) each year in response to climate change
mitigation and adaptation. Furthermore, the National Climate Change Action Guidelines
and Greenhouse Gas Reduction Action Plan shall develop with the considerations of the
economy, energy supplies, environments, international situation, and the assignment of
responsibilities by the relevant central government agencies. On the other hand, the TEPA
shall take control of measures for reducing the emissions of air pollutants from stationary
and mobile pollution sources based on the Air Pollution Control Act recently revised in
2018 [16]. These air pollutants are closely related to air quality, which is beneficial to public
health.
Obviously, air quality and climate change exist in their interconnected relationship
with each other through complex interactions in the atmosphere. Regarding the interactive
trend analysis of air quality and climate change in Taiwan, few discussions on the issue were
thus addressed in the academic journals. In a study by Liu et al. [17], they investigated the
sensitivity of ground-level ozone concentrations to temperature variation in Taiwan using
multiple regression models, indicating a positive correlation between ozone sensitivity and
temperature. In order to improve air quality by planting trees, Wang et al. [18] reported
the benefits of air quality enhancement zone establishments in Taiwan, including CO2
capture, carbon storage, and global warming mitigation. On the other hand, Li et al. [19]
evaluated the prospective impacts of electric vehicle (EV) penetration on the air quality
in Taiwan because the traditional fuel-based vehicles greatly contributed to the emissions
of criteria air pollutants. It was also found that ambient air pollutants (i.e., CO and NO2 )
and temperature were positively associated with dry eye disease [20]. On the other hand,
the coronavirus disease (COVID-19) lockdown, in 2019, has positively impacted urban air
quality, thus indicating a better ambient air quality in various countries like China [21],
India [22], South Korea [23], UK [24], and USA [25]. Some researchers recently investigated
the relationship between (renewable) energy consumption, air pollution concentration (e.g.,
NO2 ), and economic growth during the COVID-19 pandemic through a model of artificial
neural networks (ANN) [26–28]. For instance, the study by Mele and Magazzino [27]
confirmed the causal link between PM2.5 , CO2 , NO2 , and COVID-19 deaths for 25 major
Indian cities. Regarding the impact of the COVID-19 outbreak on AQI in 2020, it may be
not discussed yet in the literature.
Therefore, this paper is structured around three key issues. First, we addressed
the trend analysis of air quality index (AQI) and GHG emissions in Taiwan, which was
extracted from the official (TEPA) data from the Taiwan Air Quality Monitoring Network
and the NIR, respectively. In addition, the record changes in air quality in 2020 due
to the COVID-19 crisis were preliminarily addressed in the present study. Second, the
regulatory countermeasures for air quality management in recent years for coupling with
GHG emission mitigation during this period were summarized and discussed. Finally, this
work will provide valuable policy implications for the TEPA due to the promulgation of the
Air Pollution Control Act and other public policy issues, including global warming, GHG
emission standards, and revised AQI for PM2.5 . In response to the sustainable development
goals (SDGs) announced by the United Nations (UN) in 2015 [29], the Taiwan SDGs forEnvironments 2021, 8, 29 3 of 14
air quality and climate change mitigation by 2030 was compiled to show the Taiwan
government’s policy blueprint under the efforts of central competent authorities.
2. Data Mining and Methodology
In this work, the main purposes were to analyze the trend of air quality index (AQI)
and relevant GHG emissions in Taiwan. Using these trend variations, the sustainable devel-
opment goals in Taiwan were further summarized to align with the Taiwan government’s
efforts in improving air quality and mitigating GHG emissions from the energy sector. The
statistical data and regulatory policies are briefly summarized below.
2.1. AQI in Taiwan
In the early 1990s, the Taiwanese Environmental Protection Administration (TEPA)
established the Taiwan Air Quality Monitoring Network, which collected the information
and data regarding the concentrations of criteria air pollutants (i.e., PM10 , PM2.5 , CO, SO2 ,
NO2 , O3, and non-methane hydrocarbons) and meteorological parameters. At the end
of 2020, the TEPA set up 85 air quality observation stations nationwide for the network.
The principles of observation instruments in the network include CO by non-dispersive
infrared, SO2 by ultraviolet fluorescence, NO2 by chemiluminescence, O3 by ultraviolet
absorption, hydrocarbons by flame ionization detector, and PM10 /PM2.5 by screening
device and mass calculation. In order to ensure the accuracy and reliability of the data
provided by the network, the TEPA referred to the Quality Assurance (QA) program of the
US EPA, which was incorporated into the design of the observation network. According
to the QA program, the air quality observation stations conducted monthly checks and
an annual performance check on its pollutant analysis instruments to achieve the Data
Quality Objectives (DQO) of accuracy (deviation) within ±15% and ±10% for gaseous air
pollutants and particulates (PM10 and PM2.5 ), respectively. In addition, this network has
been operating for about thirty years and its data are open to the public. The updated data
on the statistics and status of AQI in Taiwan were obtained from the official yearbook [30]
and the website of the central competent agency (i.e., TEPA) [31].
2.2. Inventory of GHG Emissions from the Energy Sector
Taiwan’s statistics on GHG emissions were compiled from the updated NRI, which
was based on the methodology by the Intergovernmental Panel on Climate Change
(IPCC) [32]. In this work, the updated NIR was used to analyze the trends of total emissions
of CO2 , CH4, and N2 O and their major sources since 2005 [33].
2.3. Regulatory Measures for Controlling the Emissions of Air Pollutants and Relevant GHG
The relevant information about the regulatory measures for improving air quality
and also mitigating the emissions of GHG from the energy sector was based on the laws
by accessing the official website [16]. The most relevant laws included the Air Pollution
Control Act and the Greenhouse Gas Reduction and Management Act, which are executed
by the TEPA and local governments.
3. Results and Discussion
3.1. Trend Analysis of Air Quality Index (AQI)
3.1.1. Air Quality Standards in Taiwan
According to Article 5 of the Air Pollution Control Act, the central competent authority
(i.e., TEPA) in consultation with relevant agencies shall announce the air quality standards
(AQS) [16]. These standards need to be reviewed every four years based on the current
air quality levels in Taiwan, the improvement plans of the government, and the standard-
setting trends of developed countries. In this regard, Taiwan’s AQS was first announced on
10 April 1992, and subsequently revised four times (21 July 1999; 13 October 2004; 14 May
2012; 18 September 2020). In the revised AQS in 2020, the TEPA eliminated the standard
for total suspended particulates (TSP) and also revised stricter standards for suspendedEnvironments 2021, 8, 29 4 of 14
particle (PM10 , particles with a diameter of less than 10 µm), sulfur dioxide (SO2 ), nitrogen
dioxide (NO2 ), and lead. For instance, the maximum one-hour average concentration of
SO2 was lowered from 250 ppb to 75 ppb and the maximum annual average concentration
from 30 ppb to 20 ppb. Table 1 listed the levels of AQS in Taiwan.
Table 1. Ambient air quality standards in Taiwan.
Pollutant Averaging Time Level
24 h 1 35 µg/m3
PM2.5
1 year 2 15 µg/m3
Particle matter (PM)
24 h or 1 day 3 100 µg/m3
PM10
1 year 50 µg/m3
1h4 0.075 ppm
Sulfur dioxide (SO2 )
1 year 0.02 ppm
1h 0.1 ppm
Nitrogen dioxide (NO2 )
1 year 0.03 ppm
1h 35 ppm
Carbon monoxide (CO)
8h 5 9 ppm
1h 0.12 ppm
Ozone (O3 )
8h 0.06 ppm
Rolling 3-month
Lead (Pb) 0.15 µg/m3
average 6
1 Continuous sampling for 24 h. 2 Arithmetic average of the average of each day within one year. 3 Arithmetic
average of the average of each hour within one day. 4 Arithmetic average of each measured value within one hour.
5 Arithmetic average of the average of each hourly measured value in a consecutive 8 h. 6 Arithmetic average of
the average of valid data for three consecutive months.
3.1.2. Trend Analysis of Air Quality Index (AQI) in Taiwan
In order to communicate with the public regarding the healthy conditions of ambient
air quality, the central competent authority (i.e., TEPA) shall issue the AQI daily based on
the data from 77 air quality monitoring stations. In Taiwan, the AQI shall be calculated as
follows: the concentrations of ozone (O3 ), fine suspended particulates (PM2.5 ), suspended
particulates (PM10 ), carbon monoxide (CO), sulfur dioxide (SO2 ), and nitrogen dioxide
(NO2 ) in a day are converted into their corresponding sub-indicators based on their impacts
on human health by six scales [34–37]. The largest value of the sub-indicators is the AQI
of the monitoring station on the day. Table 2 listed the scaled levels of AQI and their
corresponding colors that are easy for the public in Taiwan to understand.Environments 2021, 8, 29 5 of 14
Table 2. Scaled levels of Taiwan’s air quality index (AQI) and corresponding colors.
AQI
O3 (ppm) PM2.5 (µg/m3 ) PM10 (µg/m3 ) CO (ppm) SO2 (ppm) NO2 (ppm)
(Scale/Color)
Statistical methods 8h Real-time 12 h 1 12 h 1 8h Real-time Real-time
Good
0.000–0.054 - 0.0–15.4 0–54 0–4.4 0–35 0–53
(0–50/Green)
Moderate
0.055–0.070 - 15.5–35.4 55–125 4.5–9.4 36–75 54–100
(51–100/Yellow)
Unhealthy for
sensitive groups 0.071–0.085 0.125–0.164 35.4–54.4 126–254 9.5–12.4 76–185 101–360
(101–150/Orange)
Unhealthy
0.086–0.105 0.165–0.204 54.5–150.4 255–354 12.5–15.4 186–303 361–649
(151–200/Red)
Very unhealthy
0.106–0.200 0.205–0.404 150.5–250.4 355–424 15.5–30.4 305–604 650–1249
(201–300/Purple)
Hazardous
- 0.405–0.604 250.5–500.4 425–604 30.5–50.4 605–1004 1250–2049
(301–500/Maroon)
1 0.5 × average of the first 12 h + 0.5 × average of the first 4 h.
In Taiwan, the air quality can be affected by several reasons, including rapid urban-
ization, industrial pollution sources, coal-fired power plants, meteorological conditions,
numerous motor vehicles, and foreign pollution sources (e.g., dust storm from China).
Many regulations and administrative measures have been taken by the TEPA in the past
two decades. Table 3 listed the data on the annual average concentrations of suspended
particulates (PM10 ), sulfur dioxide (SO2 ), carbon monoxide (CO), nitrogen dioxide (NO2 ),
and ozone (O3 ) during the period of 2014–2020 [30]. Except for O3 , it indicated a decreasing
trend for all air pollutants with relevance to Taiwan’s AQI. As listed in Table 3, the annual
average concentrations of O3 decreased from 58.36 ppb in 2014 to 53.89 ppb in 2016, but
increased to 56.43 ppb in 2017 and then indicated a decreasing trend from 2017 to 2020.
This result was similar to the characterization of the AQI from 2015 to 2017 in Southwestern
Taiwan [38]. The inconsistent trend could be attributed to the sunshine UV radiation
and global warming (average temperature rise), thus leading to the variations in the O3
concentrations. In order to coincide with the new AQI adopted in December 2016, Table 4
summarizes the statistics of AQI by station-day from 2017 to 2020 [30]. The statistics in
2020 for Taiwan’s AQI showed that the percentage of days with AQI > 100 (indicating poor
air quality) was 10.1%, while the percentage of days with good air quality was 54.20%.
Based on the data trend in Tables 3 and 4, the impact of COVID-19 on ambient air quality
in Taiwan was not subject to economic or mobility restrictions. Consistently, the statistics
showed that the percentage of AQI by station-day with AQI > 100 has decreased from 18.1%
in 2017 and 16.0% in 2018 to 13.1% in 2019. As studied by Maurer et al. [39], they confirmed
the air quality improvement (PM10 ) in the cities of Taiwan from 1985 to 2016, causing a
better trend in visibility. Cheng and Hsu [40] also indicated an apparent decline in the data
on NO2 , SO2, and PM2.5 concentrations from 2006–2017, supporting the positive effect on
air quality improvement by emission control measures with the promulgation of the Air
Pollution Control Act in Taiwan. These figures clearly indicated that the nation’s air quality
has been greatly improved in recent years due to the successful efforts for stationary and
mobile air pollution control. For example, the vigorous implementation of the Air Pollution
Control Action Plan by the TEPA during this period has led to boiler replacements (i.e.,
changing from liquid fuels to natural gas), smoke control equipment installation for the
food and beverage industry, less or less widespread burning of joss paper, audits and
controls for construction projects, promotion of electric vehicle, smoke filtration equipment
installation on diesel-engined vehicles, and other measures for reducing fugitive air pol-
lution (e.g., fugitive dust control in riverside areas) and open-burning incidents. These
measures for improving air quality will be subsequently summarized in Section 3.3. These
improved AQI results were empirically consistent with the statistical data on the publicEnvironments 2021, 8, 29 6 of 14
nuisance petition cases by air pollutants (excluding unusual smell pollutants). The number
by petitioning for air pollutants showed a declining trend in the past decade, decreasing
from 15,015 cases in 2010 to 10,725 cases in 2020 [30].
Table 3. Anual average concentrations of fine suspended particulates (PM2.5 ), suspended particulates
(PM10 ), sulfur dioxide (SO2 ), carbon monoxide (CO), nitrogen dioxide (NO2 ) and ozone (O3 ) during
the period of 2014–2020 in the Taiwan area 1 .
Year PM2.5 (µg/m3 ) PM10 (µg/m3 ) SO2 (ppb) CO (ppm) NO2 (ppb) O3 (ppb) 3
2014 –2 52.0 3.40 0.41 14.37 58.36
2015 – 47.1 3.13 0.40 13.62 56.13
2016 – 42.9 2.97 0.39 13.53 53.89
2017 20.5 44.0 2.88 0.35 12.86 56.43
2018 19.0 42.6 2.71 0.35 12.20 55.34
2019 17.3 35.7 2.30 0.35 11.57 54.91
2020 15.1 30.1 2.14 0.31 10.73 54.77
1Source [30]. The data from the monitoring stations less than 6000 h were not included in calculating the annual
average concentration. 2 Not available for the measurement data. 3 Average of daily hourly highest values.
Table 4. Status of Taiwan’s air quality index (AQI) in recent years (2017–2020) 1 .
AQI by Station-Day (Percentage)
Total Unhealthy for
Year Station-Day Good Moderate Very Unhealthy Hazardous
Sensitive Groups Unhealthy(151–200)
(0–50) (51–100) (201–300) (301–500)
(101–150)
8690 9231 3334 610 11 0
2017 21,876
(39.72) (42.20) (15.24) (2.79) (0.05) (0.00)
9299 9083 2955 540 8 0
2018 21,885
(42.49) (41.50) (13.50) (2.47) (0.04) (0.00)
10,423 8543 2423 383 3 0
2019 21,775
(47.87) (39.23) (11.13) (1.76) (0.01) (0.00)
11.902 7845 1976 225 10 0
2020 21,958
(54.20) (35.73) (9.00) (1.03) (0.04) (0.00)
1 Source [30].
3.2. Trend Analysis of Greenhouse Gas Emissions with Relevance to Air Quality
Based on the report by the International Energy Agency (IEA) [41], the energy sector is
the most important sector in the inventories of GHG emissions for most countries or regions.
In Taiwan, the central competent authority (i.e., TEPA) shall establish strategies to mitigate
GHG emissions according to the Greenhouse Gas Reduction and Management Act passed
in July 2015. In this regard, the TEPA must publish the NIR periodically on its website for
free downloading. Based on the latest NRI [33], more than 90% of GHG emissions came
from the energy sector, which mainly included energy industries, industrial manufacturing
& construction industries, and transportation. Therefore, the mitigation strategies and
actions for mitigating the emission of GHG from the energy sector become more important
and urgent because the accompanying combustion pollutants (i.e., particulate matters, SO2 ,
NO2 , CO) emitted from the stationary sources and mobile sources are relevant to the air
quality. In this regard, carbon dioxide (CO2 ), methane (CH4 ), and nitrous oxide (N2 O) are
responsible for the GHG emissions in the energy sector due to the fuel combustion for heat,
steam, electricity, or transportation. Table 5 listed the variations in the emissions of CO2 ,
CH4, and N2 O in Taiwan’s energy sector since 2005. In terms of the major sources in the
energy sector [33], Table 6 further showed their total emissions of CO2 , CH4, and N2 O from
the energy industries, industrial manufacturing & construction industries, transportation,
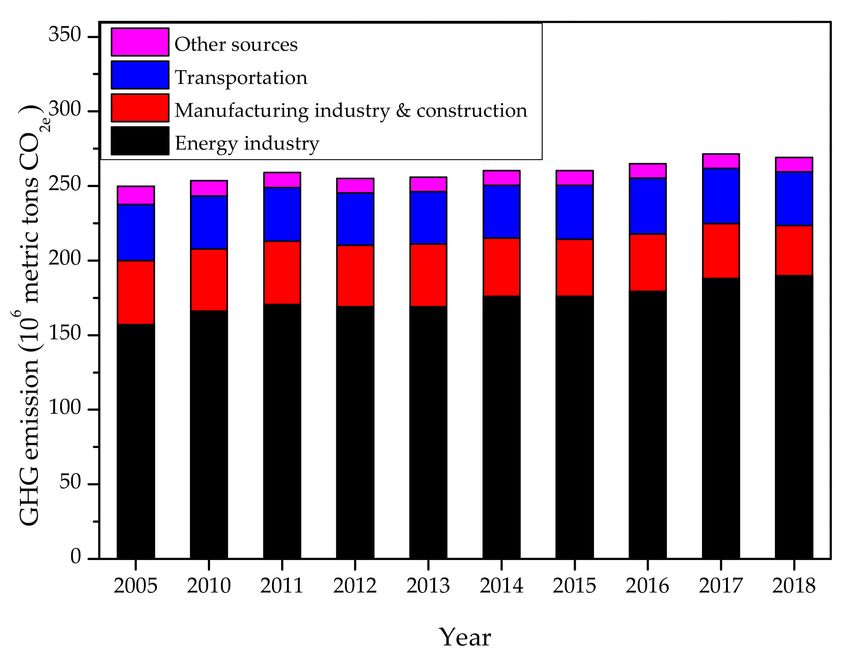
and other sources [33], which were depicted in Figure 1 to see the variations since 2005.Environments 2021, 8, 29 7 of 14
Based on the data in Tables 5 and 6, the important features were briefly addressed as
follows:
1. During the period of 2005–2019, the change in the total emissions did not vary much
with the exception in 2009, ranging from 249.9 to 269.1 MtCO2eq . An increase of 7.68%
in the GHG emission was obtained at an average annual growth rate of 0.57%. The
total GHG emission in 2018 was slightly lower than the previous year by 0.88%. This
stable situation was mainly due to the regulatory measures and promotional actions,
including renewable energy development, improvement of energy efficiency, and
energy conservation [42–44]. For example, the electricity generation by renewable
energy sources significantly increased from 7808 GWh in 2009, to 15,247 GWh in
2019 [45]. Herein, the data in 2019 were estimated by the authors based on the energy
statistics in 2019 [45].
2. In terms of the emission sources in the energy sector, the contribution percentage of
GHG emissions from the energy (electricity generation from power plants using fossil
fuels) industry indicated a slight increase from 62.8% in 2005, to 70.6% in 2018. On
the other hand, the contribution percentages of GHG emissions from the industrial
manufacturing & construction industries, transportation, and other sources showed a
decreasing trend.
3. Among these sources in the energy sector, the contribution percentage of GHG emis-
sions from the industrial manufacturing and construction industries significantly
reduced from 42.9 MtCO2eq in 2005, to 32.8 MtCO2eq in 2019. This decline should
be attributed to the industrial policy for shifting to high-tech industries and energy
management policy for enhancing energy efficiencies during this period. For example,
the data on energy intensity decreased from 6.38 in 2005, to 4.44 L of oil equivalent
per NT$1000 (about US$35) in 2019 [45].
Table 5. Taiwan’s GHG emissions from the energy sector since 2005 1 .
Year
GHG
2005 2010 2011 2012 2013 2014 2015 2016 2017 2018 2019 2
Carbon dioxide (CO2 ) 248.0 251.7 257.1 253.2 254.1 258.5 258.5 263.0 269.5 267.1 258.7
Methane (CH4 ) 0.6 0.6 0.6 0.7 0.7 0.7 0.7 0.7 0.7 0.7 0.7
Nitrous oxide (N2 O) 1.3 1.3 1.3 1.2 1.2 1.2 1.2 1.3 1.3 1.3 1.3
Total emission 249.9 253.6 259.0 255.1 256.0 260.4 260.4 265.0 271.5 269.1 260.7
1 Source [45]; unit: 106 metric tons based on CO2 equivalent. 2 Estimated.
Table 6. Taiwan’s GHG (CO2 /CH4 /N2 O) emissions from various sources in the energy sector since 2005 1 .
Year
GHG
2005 2010 2011 2012 2013 2014 2015 2016 2017 2018 2019 2
Energy industry 157.0 166.2 170.6 169.0 169.0 175.9 175.9 179.3 187.9 189.9 182.0
Manufacturing industry
42.9 41.6 42.5 41.2 42.2 39.2 38.3 38.5 36.9 33.6 32.8
& construction
Transportation 37.7 35.4 35.9 35.1 35.0 35.4 36.3 37.4 37.0 36.0 36.2
Other sources 12.3 10.4 10.0 9.8 9.8 9.9 9.9 9.8 9.7 9.6 9.7
Total 249.9 253.6 259.0 255.1 256.0 260.4 260.4 265.0 271.5 269.1 260.7
1 Source [45]; unit: 106 metric tons based on CO2 equivalent. 2 Estimated.Environments 2021, 8, 29 8 of 14
Figure 1. Variations on Taiwan’s GHG emissions from various sources in the energy sector [45].
3.3. Air Quality Management Measures for Combating Climate Change in Taiwan
Based on the trend analysis in Section 3.1, Taiwan’s AQI for the percentage of days
with AQI > 100 showed a decreasing trend, while the percentage of days with good air
quality was increased. These figures clearly indicated that the current status of air quality
in recent years has been greatly improved and that efforts to control air pollution have paid
off. In addition, the findings from this work have provided valuable policy implications
for the TEPA due to the promulgation of the Air Pollution Control Act. In Taiwan, the legal
framework for air quality management is based on the act, which was enacted to control
ambient air pollution, maintain the living environment and public health, and enhance
the quality of life. This act was first promulgated in May 1975, and subsequently revised
several times because the nature of air pollution control engenders continual public policy
issues, including global warming, GHG emission standards, revised AQI for PM2.5, and
health-oriented regulations. In recent years, the public is increasingly concerned about the
impact of air quality on health. According to the latest amendment in August 2018, the
TEPA was authorized more efforts on the exposure to PM (PM10 and PM2.5 ) and VOC in a
variety of urban areas due to their toxic components. One of the most important issues is
to get sufficient data on the exposure-response relationships to adopt adequate emission
control measures for these toxic components, including heavy metals, dioxins, and other
hazardous air pollutants (HAPs).
According to the act amendment in 2018, the TEPA thus accelerated the total air
quantity control plan amendment schedule to facilitate the control measures for mobile
sources and stationary sources of air pollution, which will be summarized in the following
section [31].
3.3.1. Control Measures for Mobile Sources of Air Pollution
The transportation sector is one of the major GHG emission sources and contributes
significantly to urban air pollution quality [46]. In Taiwan, the registered number of motor
vehicles on the road has been showing an increasing trend along with economic growth in
the past decades. At the end of 2019, the number in Taiwan totaled 22.11 million, including
13.99 million vehicles of motorcycles and 8.12 million automobiles [30]. Compared to
the figures in 1991 (7.41 million vehicles of motorcycles and 3.20 million automobiles), it
indicated the average annual growth rates of 2.30% and 3.38%, respectively. However,
the emissions of combustion products from motor vehicles (i.e., mobile pollution sources)
are the main source of air contaminants in urban areas in Taiwan with limited land and a
highly dense population, posing a negative impact on air quality and public health. In thisEnvironments 2021, 8, 29 9 of 14
regard, the TEPA took the following control measures for curbing the growth of registered
motor vehicles and also reducing the emissions of air pollutants from them.
1. New vehicle control measures
- Phased implementation of stricter vehicle emission standards
- New vehicle model inspection and testing system in compliance with emission
standards
2. On-road vehicle emissions control measures
- Routine exhaust emissions inspection and testing program
- Motorcycles and diesel engine automobile spot check
- Remote sensing of emissions from gasoline engine automobiles
- Urging the public to identify and report on-road gross polluters or other high-
emission vehicles
- Eliminating old vehicles and two-stroke engine motorcycles
- Enhancing the quality of exhaust emissions inspection and testing of in-use
gasoline and diesel engine automobiles
3. Clean alternative fuel promotion measures
- Subsidizing the price of liquefied petroleum gas (LPG)
- Setting control measures of automobile gasoline and diesel fuels (e.g., setting
more stringent standards for the sulfur content of automobile fuels)
- Enforcing the air pollution control fee program
- Cracking down on illegal fuel
- Adding more LPG vehicles and LPG filling stations
- Promoting the use of bio-diesel fuel and ethanol gasoline
4. Low-pollution vehicles promotion measures
- Advocating the use of low-pollution motorcycles
- Subsidizing the purchase of electric auxiliary bicycles
- Promoting the use of hybrid vehicles
- Advocating bike lanes
5. Traffic management measures
- Promoting the use of public transportation
- Expanding paid motorcycle parking areas
- Revising the traffic code to curb the growth of motor vehicles
- Designating clean air zones that prohibit the entry of any motor vehicles
3.3.2. Control Measures for Stationary Sources of Air Pollution
According to the definition of the act, the stationary sources of air pollution refer to the
pollution sources which are not able to change location under their own power. Therefore,
this could include the vents or stacks in the factories, refineries, boilers, and power plants,
emitting a variety of air pollutants. These emitted pollutants may belong to criteria air
pollutants and hazardous air pollutants. Under the authorization of the act, the TEPA
took the following regulatory measures for controlling the emissions of air pollutants from
stationary sources.
- Evaluation of the total quantity control zones
- Stationary pollution source installation and operating permit management
- Air pollution control fee system
- Improved control of fugitive dust pollution sources
- Reinforcing control of dioxins and other hazardous air pollutants
- Boiler replacement subsidy
- Control of volatile organic compounds (VOCs) from consumer products
- Continuous emission monitoring system
- Response to air pollution emergency
- Control, monitoring, and improvement of volatile organic air pollutantsEnvironments 2021, 8, 29 10 of 14
3.4. Sustainable Development Goals for Air Quality and GHG Emissions in Taiwan
In order to provide a target-oriented blueprint for peace and prosperity to all countries
in the near future (2030), the United Nations (UN) announced 17 Sustainable Development
Goals (SDGs) on 25 December 2015. In 2016, the Taiwan government advanced its efforts
by referring to the UN SDGs, including goals for 2030 and targets for 2020. Among these
efforts, renewable energy development in the past two decades may be the most significant
progress. One of the purposes was to improve air quality in Taiwan [47]. Furthermore, the
Taiwan government announced Taiwan’s Sustainable Development Goals in July 2019 [48].
Regarding air quality issues, the third goal is “Good Health and Well-being”, which
involves Target 3.9: “By 2030, substantially reduce the number of deaths and illnesses from
hazardous chemicals and air, water and soil pollution and contamination”. On the other
hand, the 11th goal aims at taking urgent action to combat climate change and its impacts.
3.4.1. Sustainable Development Goals for Air Quality by 2030 in Taiwan
According to Target 3.9.1 (“air quality improvement for maintaining people’s health”),
in the third goal of Taiwan’s SDGs, the baseline (2016) and goals by 2020/2030 were listed
in Table 7. It should be noted that the concentrations of sulfur dioxide (SO2 ) and nitrogen
dioxide (NO2 ) have met the Air Quality Standards (AQS) for all counties and municipalities
in the baseline year (2016).
Table 7. The goals of Taiwan’s SDGs for air quality by 2020 and 2030.
SDG’s Targets for Air Quality Baseline (2016) 2020 2030
20 µg/m3 15 µg/m3 12 µg/m3
Fine suspended particulate matter (PM2.5 ) 1
874 times 2 499 times 140 times
Suspended particulate matter (PM10 ) 1 43.5 µg/m3 37 µg/m3 35 µg/m3
Ozone (O3 ) 462 times 3 350 times 140 times
Sulfur dioxide (SO2 ) Meeting AQS 4 Meeting AQS Meeting AQS
Nitrogen dioxide (NO2 ) Meeting AQS Meeting AQS Meeting AQS
1 2
Based on national annual average concentration. ≥54 µg/m3 based on national daily average concentration in
total by all monitoring stations. 3 ≥86 ppb based on national daily maximum 8 h average in total by all monitoring
stations. 4 Referred to Table 1.
3.4.2. Sustainable Development Goals for GHG Emissions by 2030 in Taiwan
Under Article 4 of the Greenhouse Gas Reduction and Management Act passed by
Taiwan’s Congress in 2015 [16], the core target is to reduce GHG emissions to less than 50%
of 2005 levels, by 2050. With the promulgation of the act in 2015, the phase control goals
were definitely made once every five years. The first period for GHG emission control
was set in the range of 2016–2020. The net GHG emission in the previous year (2015)
was 263.139 million metric tons in terms of carbon dioxide equivalent (263.139 MtCO2eq ).
On the other hand, the net GHG emission (i.e., 266.038 MtCO2eq ) in 2005 was set as the
baseline level. According to Target 13.2.1 (“Achieving phase control goals of every period
for greenhouse gas emissions”) in the 13th goal of Taiwan’s SDGs [48], the goals by 2020
and 2030 were summarized below.
1. Goals by 2020 According to the first period for GHG emission control goals approved
by the Taiwan government in January 2018, the net GHG emissions by 2020 must
reduce by 2%, as compared to the baseline year (2016); that is, 260.717 MtCO2eq .
Furthermore, the goals for the GHG emissions by various sectors were given below:
• Energy sector: 32.305 MtCO2eq (reduced by 3% compared to the 2005 level).
- Carbon emission factor: 0.492 kg CO2eq /kWh (exclusive of own use by
power plants and line loss).
- The total installed capacity of renewable energy will be 10,875 MW. In
parallel with this, electricity generation will be 25,200 GWh.Environments 2021, 8, 29 11 of 14
• Industrial processes sector: 146.544 MtCO2eq (reduced by 3% compared to the
2005 level).
- Energy intensity in 2020 (reduced by 43% compared to the 2005 level; that is,
6.83 L of oil equivalent/1000 NT$).
• Transportation sector: 37.211 MtCO2eq (reduced by 2% compared to the 2005 level).
- Public transport by 2020 will grow more than 7% compared to that of
2015 level.
- The promotional target for the sales of electric motorcycles during the period
of 2018–2020 will increase by 121,000.
• Residential and commercial sector: 57.530 MtCO2eq (reduced by 2.5% compared
to the 2005 level).
- As compared to that in 2017, the building shells of new architects constructed
by the design basis levels (e.g., energy saving) will increase by 10%.
- As compared to that in 2017, the electricity efficiency in the public sector
buildings will improve by 5%.
• Agriculture sector: 5.318 MtCO2eq (reduced by 25% compared to the 2005 level).
- Total organic and friendly farming land area: 15,000 hectares.
- The biogas-to-power production by valorizing manure with 250 × 104 heads
swine (about 50% of total swine heads on farms).
- The forest land area via afforestation and reforestation: 3636 hectares.
2. Goals by 2030 According to the legal norms under the Greenhouse Gas Reduction
and Management Act, the net GHG emission by 2030 must reduce 20% compared to
the baseline year (2005). Furthermore, the sector goals for the GHG emissions were
described as follows:
• Energy sector
- The total installed capacity of renewable energy will be 31,000 MW.
• Industrial processes sector
- Energy intensity will be reduced by 50%, compared to the 2005 level.
• Transportation sector: 37.211 MtCO2eq (reduced by 2% compared to the 2005 level).
- Public transport will grow more than 20% compared to that of 2015 level.
- Official vehicles and city buses will be electrified totally.
- Motorcycles using new energy accounted for 35% of new sales.
• Residential and commercial sector: 57.530 MtCO2eq (reduced by 2.5% compared
to the 2005 level).
- The electricity efficiency in the public sector buildings will improve by 10%
and meet the announced specifications of the energy usage index (EUI).
- Planning for the establishment of building energy database and the devel-
opment of building energy passport.
• Agriculture sector
- Total organic and friendly farming land area: 30,000 hectares.
- The biogas-to-power production by valorizing manure with 375 × 104 heads
swine (about 75% of total swine heads on farms).
- The forest land area via afforestation and reforestation: 7080 hectares.
• Waste management sector
- The national sewage treatment rate will reach 70%.
4. Conclusions and Prospects
As a member of the global village, Taiwan has actively taken part in the international
response to climate change in the past three decades. In this paper, the trend analysesEnvironments 2021, 8, 29 12 of 14
of AQI and GHG emissions in Taiwan’s energy sector were carried out. It was revealed
that the total GHG emissions seemed to show no more increase since 2005, showing a
decoupling trend between the air pollution emission and the economic growth. Based on
the data on AQI, the percentage of AQI by station-day with AQI > 100 has decreased from
18.1% in 2017, to 10.1% in 2020 (the year of COVID-19), indicating a decreasing trend for
all criteria air pollutants. In addition, the findings from this work have provided valuable
policy implications for the TEPA due to the promulgation of the Air Pollution Control
Act. In 2018, the act was revised to adopt continual regulatory policy measures, including
global warming, GHG emission standards, revised AQI for PM2.5, and health-oriented
regulations. More significantly, the TEPA was authorized more efforts on the exposure to
PM (PM10 and PM2.5 ) and VOC in a variety of urban areas due to their toxic components
like heavy metals, dioxins, and other hazardous air pollutants (HAPs). In line with the
sustainable development goals (SDGs) launched by the Taiwan government in 2018, the
central competent agency (i.e., TEPA) set the SDGs of air quality and net GHG emissions
by 2020 and 2030. Although the COVID-19 has caused global, multi-dimensional effects,
including economic activities, lifestyle patterns, air quality, and public health, its impacts
in Taiwan were not significant in 2020. Therefore, achieving the relevant SDGs can be
prospective in the near future.
Author Contributions: Conceptualization, W.-T.T.; data collection, Y.-Q.L.; data analysis, Y.-Q.L.;
writing—original draft preparation, W.-T.T.; writing—review and editing, W.-T.T. Both authors have
read and agreed to the published version of the manuscript.
Funding: This research received no external funding.
Data Availability Statement: Not applicable.
Conflicts of Interest: The authors declare no conflict of interest.
References
1. Our World in Data–Emission by Sector. Available online: https://ourworldindata.org/emissions-by-sector (accessed on 6
November 2020).
2. Bowerman, N.H.A.; Frame, D.J.; Huntingford, C.; Lowe, J.A.; Smith, S.M.; Allen, M.R. The role of short-lived climate pollutants in
meeting temperature goals. Nat. Clim. Chang. 2013, 3, 1021–1024. [CrossRef]
3. Haines, A.; Amann, M.; Borgford-Parnell, N.; Leonard, S.; Kuylenstierna, J.; Shindell, D. Short-lived climate pollutants mitigation
and sustainable development goals. Nat. Clim. Chang. 2017, 7, 863–869. [CrossRef]
4. Kallbekken, S.; Aakre, S. The Potential for Mitigating Short-lived Climate Pollutants. Rev. Environ. Econ. Policy 2018, 12, 264–283.
[CrossRef]
5. Wang, G.; Shen, F.; Yi, H.; Hubert, P.; Deguine, A.; Petitprez, D.; Maamary, R.; Augustin, P.; Fourmentin, M.; Fertein, E.; et al. Laser
absorption spectroscopy applied to monitoring of short-lived climate pollutants (SLCPs). J. Mol. Spectrosc. 2018, 348, 142–151.
[CrossRef]
6. Zhang, H.; Xie, B.; Wang, Z. Effective Radiative Forcing and Climate Response to Short-Lived Climate Pollutants under Different
Scenarios. Earth’s Futur. 2018, 6, 857–866. [CrossRef]
7. Hanaoka, T.; Masui, T. Exploring effective short-lived climate pollutant mitigation scenarios by considering synergies and
trade-offs of combinations of air pollutant measures and low carbon measures towards the level of the 2 ◦ C target in Asia. Environ.
Pollut. 2020, 261, 113650. [CrossRef]
8. Nakajima, T.; Ohara, T.; Masui, T.; Takemura, T.; Yoshimura, K.; Goto, D.; Hanaoka, T.; Itahashi, S.; Kurata, G.; Kurokawa, J.;
et al. A development of reduction scenarios of the short-lived climate pollutants (SLCPs) for mitigating global warming and
environmental problems. Prog. Earth Planet. Sci. 2020, 7, 33. [CrossRef]
9. Seinfeld, J.H.; Pandis, S.N. Atmospheric Chemistry and Physics: From Air Pollution to Climate Change, 3rd ed.; John Wiley & Sons:
New York, NY, USA, 2016.
10. Liu, S.K.; Cai, S.; Chen, Y.; Xiao, B.; Chen, P.; Xiang, X.D. The effect of pollutional haze on pulmonary function. J. Thorac. Dis.
2016, 8, E41–E56. [PubMed]
11. Kurt, O.K.; Zhang, J.; Pinkerton, K.E. Pulmonary health effects of air pollution. Curr. Opin. Pulm. Med. 2016, 22, 138–143.
[CrossRef]
12. Bollen, J.; van der Zwaan, B.; Brink, C.; Eerens, H. Local air pollution and global climate change: A combined cost-benefit analysis.
Resour. Energy Econ. 2009, 31, 161–181. [CrossRef]
13. Ramanathan, V.; Feng, Y. Air pollution, greenhouse gases and climate change: Global and regional perspectives. Atmos. Environ.
2009, 43, 37–50. [CrossRef]Environments 2021, 8, 29 13 of 14
14. Department for Environment, Food and Rural Affairs (DEFRA). Air Pollution: Action in a Changing Climate; DEFRA: London, UK,
2010; Available online: https://www.defra.gov.uk/environment/quality/air/airquality/strategy/index.htm (accessed on 15
November 2020).
15. Ravindra, K.; Rattan, P.; Mor, S.; Aggrawal, A.N. Generalized additive models: Building evidence of air pollution, climate change
and human health. Environ. Int. 2019, 132, 104987. [CrossRef]
16. Laws and Regulation Retrieving System. Available online: https://law.moj.gov.tw/Eng/index.aspx (accessed on 15 November
2020).
17. Liu, P.W.G.; Tsai, J.H.; Lai, H.C.; Tsai, D.M.; Li, L.W. Establishing multiple regression models for ozone sensitivity analysis to
temperature variation in Taiwan. Atmos. Environ. 2013, 79, 225–235. [CrossRef]
18. Wang, Y.C.; Liu, W.Y.; Ko, S.H.; Lin, J.C. Tree species diversity and carbon storage in air quality enhancement zones in Taiwan.
Aerosol Air Qual. Res. 2015, 15, 1291–1299. [CrossRef]
19. Li, N.; Chen, J.P.; Tsai, I.C.; He, Q.Y.; Chi, S.Y.; Lin, Y.C.; Fu, T.M. Potential impacts of electric vehicles on air quality in Taiwan. Sci.
Total Environ. 2016, 566, 919–928. [CrossRef]
20. Zhong, J.Y.; Lee, Y.C.; Hsieh, C.J.; Tseng, C.C.; Yiin, L.M. Association between dry eye disease, air pollution and weather changes
in Taiwan. Int. J. Environ. Res. Public Health 2018, 15, 2269. [CrossRef] [PubMed]
21. Xu, K.; Cui, K.; Young, L.H.; Wang, Y.F.; Hsieh, K.; Wan, S.; Zhang, J. Air quality index, indicatory air pollutants and impact of
COVID-19 event on the air quality near Central China. Aerosol Air Qual. Res. 2020, 20, 1204–1221. [CrossRef]
22. Sharma, S.; Zhang, Z.; Anshika; Gao, J.; Zhang, H.; Kota, S.H. Effect of restricted emissions during COVID-19 on air quality in
India. Sci. Total Environ. 2020, 728, 138878. [CrossRef] [PubMed]
23. Koo, J.H.; Kim, J.; Lee, Y.G.; Park, S.S.; Lee, S.; Chong, H.; Cho, Y.; Kim, J.; Choi, K.; Lee, T. The implication of the air quality
pattern in South Korea after the COVID-19 outbreak. Sci. Rep. 2020, 10, 22462. [CrossRef]
24. Jephote, C.; Hansell, A.L.; Adams, K.; Gulliver, J. Changes in air quality during COVID-19 “lockdown” in the United Kingdom.
Environ. Pollut. 2021, 272, 116011. [CrossRef] [PubMed]
25. Berman, J.D.; Ebisu, K. Changes in U.S. air pollution during the COVID-19 pandemic. Sci. Total Environ. 2020, 739, 139864.
[CrossRef] [PubMed]
26. Magazzino, C.; Mele, M.; Morelli, G. The relationship between renewable energy and economic growth in a time of Covid-19: A
machine learning experiment on the Brazilian economy. Sustainability 2021, 13, 1285. [CrossRef]
27. Mele, M.; Magazzino, C. Pollution, economic growth, and COVID-19 deaths in India: A machine learning evidence. Environ. Sci.
Pollut. Res. 2021, 28, 2669–2677. [CrossRef] [PubMed]
28. Mele, M.; Magazzino, C.; Schneider, N.; Strezov, V. NO2 levels as a contributing factor to COVID-19 deaths: The first empirical
estimate of threshold values. Environ. Res. 2021, 194, 110663. [CrossRef] [PubMed]
29. United Nations (UN), Take Action for the Sustainable Development Goals. Available online: https://www.un.org/
sustainabledevelopment/sustainable-development-goals/ (accessed on 15 November 2020).
30. Environmental Protection Administration (EPA). Yearbook of Environmental Protection Statistics 2020; EPA: Taipei, Taiwan, 2021.
31. Environmental Protection Administration (TEPA), Air Quality. Available online: https://www.epa.gov.tw/ENG/CA5A19075
AF6D985/ (accessed on 15 November 2020).
32. Intergovernmental Panel on Climate Change (IPCC). 2006 IPCC Guidelines for National Greenhouse Gas Inventories; Institute for
Global Environmental Strategies: Hayama, Japan, 2006.
33. Environmental Protection Administration (TEPA). Taiwan Greenhouse Gases Inventory: 1990–2018; EPA: Taipei, Taiwan, 2020.
34. Liu, C.M. Effects of PM2.5 on AQI in Taiwan. Environ. Modell. Softw. 2002, 17, 29–37. [CrossRef]
35. Cheng, W.L.; Chen, Y.S.; Zhang, J.; Lyons, T.J.; Pai, J.L.; Chang, S.H. Comparison of the revised air quality index with the PSI and
AQI indices. Sci. Total Environ. 2007, 382, 191–198. [CrossRef]
36. Antonella, P.; Mariantonietta, R. Air quality indices: A review. Rev. Environ. Sci. Biotechnol. 2011, 10, 165–179.
37. Kanchan, K.; Gorai, A.K.; Goyal, P. A Review on air quality indexing system. Asian J. Atmos. Environ. 2015, 9, 101–113. [CrossRef]
38. Lee, Y.Y.; Hsieh, Y.K.; Chang-Chien, G.P.; Wang, W. Characterization of the air quality index in southwestern Taiwan. Aerosol Air
Qual. Res. 2019, 19, 749–785. [CrossRef]
39. Maurer, M.; Klemm, O.; Lokys, H.L.; Lin, N.H. Trends of fog and visibility in Taiwan: Climate change or air quality improvement?
Aerosol Air Qual. Res. 2019, 19, 896–910. [CrossRef]
40. Cheng, F.Y.; Hsu, C.H. Long-term variations in PM2.5 concentrations under changing meteorological conditions in Taiwan. Sci.
Rep. 2019, 9, 9935. [CrossRef]
41. International Energy Agency (IEA), Global Energy and CO2 Emissions in 2020. Available online: https://www.iea.org/reports/
global-energy-review-2020/global-energy-and-co2-emissions-in-2020 (accessed on 19 November 2020).
42. Huang, J.J.; Chang, W.R. Policy progress in mitigation of climate change in Taiwan. Energy Policy 2011, 39, 1113–1122.
43. Tsai, W.T. Feed-in tariff promotion and innovative measures for renewable electricity: Taiwan case analysis. Renew. Sustain.
Energy Rev. 2014, 40, 1126–1132. [CrossRef]
44. Kung, C.C.; Zhang, L.; Chang, M.C. Promotion policies for renewable energy and their effects in Taiwan. J. Clean. Prod. 2017, 142,
965–975. [CrossRef]
45. Ministry of Economic Affairs (MOEA). Energy Statistics Handbook-2019; MOEA: Taipei, Taiwan, 2020.Environments 2021, 8, 29 14 of 14
46. Gunawan, H.; Bressers, H.; Mohlakoana, N.; Hoppe, T. Incorporating air quality improvement at a local level into climate policy
in the transport sector: A case study in Bandung City, Indonesia. Environments 2017, 4, 45. [CrossRef]
47. Tsai, W.T.; Chou, Y.H. Overview of environmental impacts, prospects and policies for renewable energy in Taiwan. Renew. Sustain.
Energy Rev. 2005, 9, 119–147. [CrossRef]
48. Council for Sustainable Development. Annual Review Report on the Taiwan’s Sustainable Development Goals (in Chinese); Environ-
mental Protection Administration: Taipei, Taiwan, 2020.You can also read