Investigating Ambient Air Quality in Arrowtown using ODINs (2019) - A "CONA" Progress Report - NIWA
←
→
Page content transcription
If your browser does not render page correctly, please read the page content below
Investigating Ambient Air Quality
in Arrowtown using ODINs (2019)
        A "CONA" Progress Report

                May 2020
© All rights reserved. This publication may not be reproduced or copied in any form without the permission of
the copyright owner(s). Such permission is only to be given in accordance with the terms of the client’s
contract with NIWA. This copyright extends to all forms of copying and any storage of material in any kind of
information retrieval system.

Whilst NIWA has used all reasonable endeavours to ensure that the information contained in this document is
accurate, NIWA does not give any express or implied warranty as to the completeness of the information
contained herein, or that it will be suitable for any purpose(s) other than those specifically contemplated
during the Project or agreed by NIWA and the Client.
Prepared by:
Ian Longley

For any information regarding this report please contact:
Ian Longley
Programme Leader - Air Quality

+64-9-375 2096
i.longley@niwa.co.nz

National Institute of Water & Atmospheric Research Ltd
Private Bag 99940
Viaduct Harbour
Auckland 1010

Phone +64 9 375 2050

NIWA CLIENT REPORT No:   2020047AK
Report date:             May 2020
NIWA Project:            CAAP2002

 Quality Assurance Statement

                             Reviewed by:                   Guy Coulson

                             Formatting checked by:

                             Approved for release by: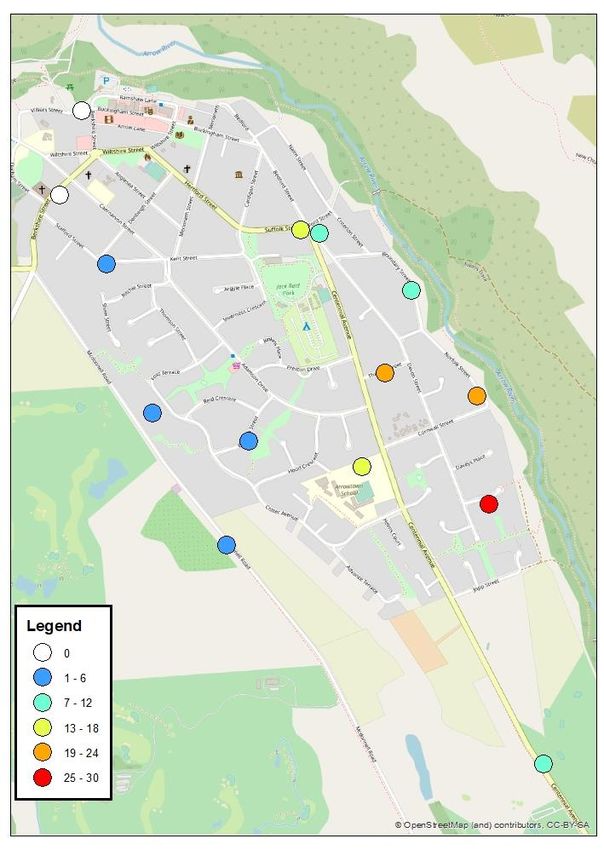
Contents

Executive summary ............................................................................................................. 5

1       Introduction .............................................................................................................. 7
        1.1      Air quality in Arrowtown .......................................................................................... 7
        1.2      NIWA’s role ............................................................................................................... 7
        1.3      Community Observation Networks for Air ............................................................... 7
        1.4      Scope of this report .................................................................................................. 8

2       Arrowtown measurement campaign, 2019 ................................................................. 9
        2.1      Overview and goals ................................................................................................... 9
        2.2      ODINs ........................................................................................................................ 9
        2.3      The Arrowtown ODIN Network 2019 ..................................................................... 10
        2.4      Air quality in winter 2019 – the “official” record.................................................... 10

3       Findings part 1 – Performance and validity of the ODINs ........................................... 13
        3.1      ODIN status and known issues................................................................................ 13
        3.2      ODIN performance .................................................................................................. 13
        3.3      ODIN validity ........................................................................................................... 14

4       Findings part 2 – Air quality in Arrowtown (winter 2019) .......................................... 16
        4.1      Temporal variation in air quality............................................................................. 16
        4.2      Spatial variation in air quality ................................................................................. 18

5       Discussion and outstanding research issues .............................................................. 22
        5.1      Gross emitters......................................................................................................... 22
        5.2      Processes determining temporal variation – can we predict when poor air quality
                 will occur? ............................................................................................................... 22
        5.3      Processes determining spatial variation – why is there a pollution gradient?....... 23
        5.4      Agricultural and other emission sources ................................................................ 24
        5.5      Summary of ongoing and future research needs ................................................... 24

6       Implications for stakeholders ................................................................................... 26
        6.1      The official (ORC) monitoring record and its interpretation .................................. 26
        6.2      Risk of exceeding the current and proposed National Environmental Standards for
                 Air Quality ............................................................................................................... 26
        6.3      The public health risk posed by poor ambient air quality in Arrowtown ............... 28

Investigating Ambient Air Quality in Arrowtown using ODINs (2019)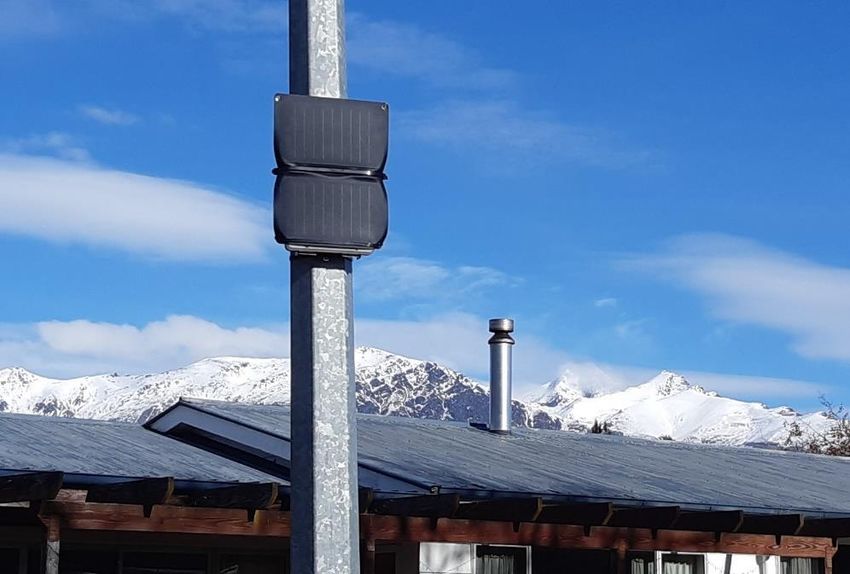
6.4     Concentrated versus dispersed intervention ......................................................... 29

7     Summary of conclusions .......................................................................................... 30

8     Acknowledgements ................................................................................................. 31

Tables
Table 1-1:        CONA field projects to date.                                                  8
Table 2-1:        The 4 phases of the study.                                                  10
Table 2-2:        Range of PM10 concentrations (ORC) during each of the 4 phases of this study.
                                                                                              11
Table 3-1:        ODIN data recovery for each phase of the study.                             14

Figures
Figure 2-1:       Location of the regulatory air quality monitor operated by Otago Regional
                  Council (ORC).                                                                10
Figure 2-2:       Daily PM10 measured by ORC, and the four phases of this study (coloured
                  bands).                                                                       11
Figure 3-1:       Daily PM10 from the ORC monitor (blue) and PM10 and PM2.5 from the nearest
                  ODIN (#063) during July.                                                      15
Figure 4-1:       Distributions of 24 hr mean (midnight-midnight) PM2.5 concentrations across
                  network for each day in July.                                                 16
Figure 4-2:       Distributions of 24 hr mean (midnight-midnight) PM2.5 concentrations across
                  network for each day in August.                                               16
Figure 4-3:       Distributions of 24 hr mean (midnight-midnight) PM2.5 concentrations across
                  network for each day in September.                                            17
Figure 4-4:       Distributions of 24 hr mean (midnight-midnight) PM2.5 concentrations across
                  network for each day in October.                                              17
Figure 4-5:       Range of PM2.5 concentrations across the whole ODIN network for each hour
                  during phase 2 only.                                                          18
Figure 4-6:       Ratio of average night-time PM2.5 concentrations at each site relative to the
                  reference site (black box).                                                   19
Figure 4-7:       Estimated interpolated surface of the ratio of average night-time PM2.5
                  concentrations at each site relative to the reference site.                   20
Figure 5-1:       Sketch of how possible terrain-following “drainage” air flows across
                  Arrowtown on high pollution nights could transport smoke towards the south-
                  east of Arrowtown.                                                            24
Figure 6-1:       Number of exceedences of the current National Environmental Standard for
                  PM10 during July.                                                             27
Figure 6-2:       Number of exceedences of the proposed National Environmental Standard for
                  PM2.5 during July.                                                            28

                                                  Investigating Ambient Air Quality in Arrowtown using ODINs (2019)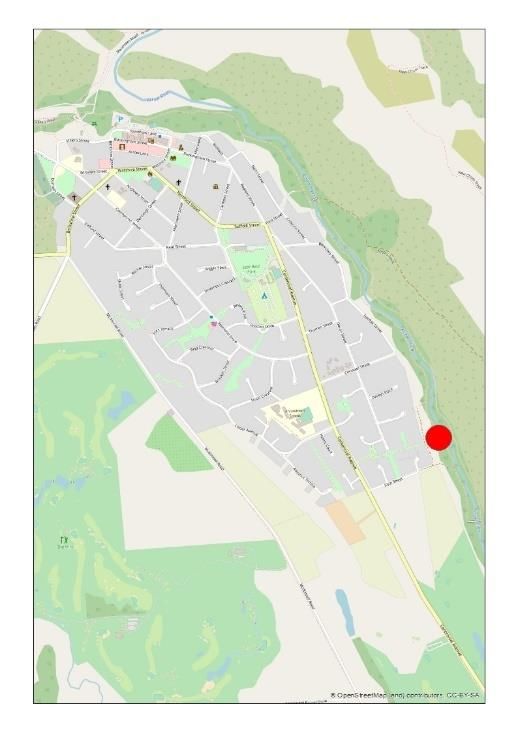
Executive summary
Over a decade’s worth of monitoring by Otago Regional Council has shown that whilst air quality in
Arrowtown in summer is amongst the best anywhere in New Zealand, during winter it is amongst the
worst. Whereas air quality in other towns has improved over that time, poor air quality persists in
Arrowtown, and several other towns like it where solid fuel burning for home heating is common.

“Community Observation Networks for Air”, or CONA, is a NIWA research initiative begun in 2015. It
aims to explore how enhanced community-scale air monitoring networks, enabled by new low-cost
technologies, and monitoring in the home in particular, can increase engagement with air quality
issues, improve public understanding of the science, and promote or accelerate reductions in
emissions or other actions to improve air quality in places like Arrowtown.

After pilot studies elsewhere, NIWA brought the CONA project to Arrowtown in 2019. This report is
the first in a series covering this field study. It covers the results of an initial analysis of data from a
network of prototype ambient air quality sensors (“ODINs”) developed by NIWA. A companion report
(Part Two) covers indoor air quality.

22 prototype ambient air quality sensors (ODINs) were deployed in a distributed grid across the town
between June and mid-August. More sensors were added in August and September, reaching a
maximum of 48. Although the data capture rate was moderate, sufficient high-quality data was
captured to gain new insights into spatial patterns in air quality, whereas the study also provided
valuable insight into instrument failures that will be used to inform future upgrades.

We draw the following conclusions with a high certainty:

          ▪    Although the official (ORC) record shows that on cold winter nights Arrowtown has
               some of the most polluted air in the country, exceeding National Environmental
               Standards multiple times per year, NIWA’s network of distributed monitors has shown
               that air quality varies hugely across the town.

          ▪    Our data confirms that air quality during the early afternoon period is excellent at all
               locations.

          ▪    Persistent and predictable poor air quality is limited to cold winter nights, with a
               smaller, secondary impact on subsequent mornings.

          ▪    During these conditions, air quality remains generally remains good in the north-west
               of the town, gradually deteriorating towards the south-east. A “high risk” zone for air
               quality exists in an area approximately to the east of Centennial Ave and south of
               Boundary Street.

          ▪    At the time of writing a proposal exists to introduce a new National Environmental
               Standard for PM2.5. Should that Standard be adopted, and air quality does not change,
               the proportion of the town that fails to meet the Standard will substantially increase
               compared to now, and the number of exceedances will more than double.

          ▪    Our findings to date are entirely consistent with smoke from home heating being the
               overwhelmingly dominant source of particulate matter in the air during winter in
               Arrowtown. A preliminary inspection of the data shows no evidence of a major
               contribution from agricultural burning, although this will be investigated further.

Investigating Ambient Air Quality in Arrowtown using ODINs (2019)                                         5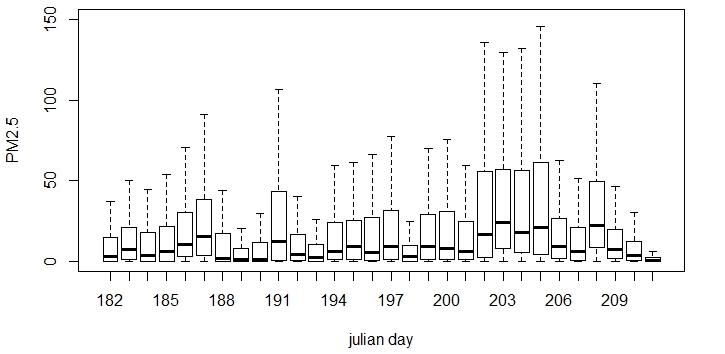
The following conclusions have a degree of uncertainty and will be the subject of ongoing research.

         ▪    The data captured suggests that the dominant (and maybe only) cause of the
              differences in air quality across the town is the gentle flow of smoke downhill and its
              collection in the Arrow River valley, probably driven by cold air sinking down the slopes
              of the adjacent hills. Alternative explanations – including higher emissions in the
              south-east of the town due to colder conditions, more, older, mis-used or poorly
              maintained wood-burners – cannot be ruled out but appear less significant.

         ▪    The monitoring technology and approach has the potential to be used to identify
              locations containing homes with persistently abnormally high emissions (“gross
              emitters”) and quantify their impact. To date, one such area has been identified, and
              this will be the subject of further analysis.

         ▪    Results imply that actions to reduce emissions that were concentrated in the south-
              east of the town would be relatively more effective in reducing pollution
              concentrations where they are worst, reducing risk inequality and the number of
              exceedances of the National Environmental Standard for air quality. However,
              achieving the same emission reduction spread evenly across the town may be a more
              efficient way of reducing total exposure, and hence health risk, across the whole town.

6                                       Investigating Ambient Air Quality in Arrowtown using ODINs (2019)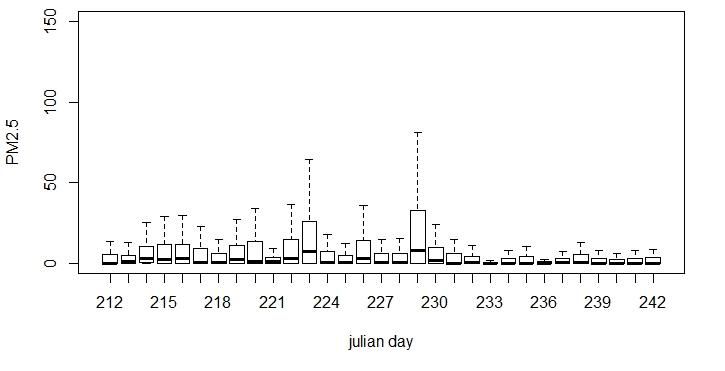
1       Introduction
1.1     Air quality in Arrowtown
Air quality has been measured continuously in Arrowtown by Otago Regional Council (ORC) since
2006, with the monitoring site moving from Arrowtown School to Arrowtown Recreational Reserve in
2014. These measurements have shown that whilst air quality in Arrowtown in summer is amongst
the best anywhere in New Zealand, during winter it is amongst the worst. Over the last decade air
quality has exceeded the National Environmental Standard between 16 and 46 days per winter every
year.

Studies to date have indicated that Arrowtown’s poor air quality is overwhelmingly caused by
emissions from burning wood for home heating. Consequently, demanding rules for woodburning
appliances have been established for Arrowtown (and other towns) by Otago Regional Council.
Despite this, whereas long-term improving trends in air quality are apparent in many New Zealand
towns and cities over the last decade and a half, this is not so in Arrowtown where air quality has
changed little in that time.

1.2     NIWA’s role
NIWA (the National Institute for Water and Atmospheric Research) is a Crown Research Institute that
carries out scientific research into a range of environmental topics related to water and air. It has no
official role in air quality monitoring or management, but often acts as a scientific advisor.

However, NIWA does use part of the MBIE Strategic Science Investment Fund to conduct a research
programme entitled “Impacts of Air Pollutants”. This programme aims to help Regional Councils,
agencies, businesses and the NZ public in developing understanding of air quality, expanding the
scope and utility of air quality monitoring and improving the scientific evidence base for
policymaking and everyday decision-making.

1.3     Community Observation Networks for Air
“Community Observation Networks for Air”, or CONA, is a NIWA research initiative begun in 2015. It
aims to explore how enhanced community-scale air monitoring networks, enabled by new low-cost
technologies, can increase engagement with air quality issues, improve public understanding of the
science, and promote or accelerate reductions in emissions or other actions to improve air quality.

Although the principles developed in CONA are designed to be applied to any air quality issue, to
date the initiative has focussed on domestic home heating emissions as New Zealand’s priority air
quality issue. The struggle to effect real improvements in air quality in towns like Arrowtown is most
likely due to financial barriers, with other political and cultural forces at work. However, a hypothesis
underlying the CONA approach is that these barriers may be compounded by lack of clear evidence
on effective and successful solutions, particularly for householders and owners. The CONA initiative
aims to develop means to generate more localised and accessible information for the community.
The aim is to better inform and motivate actions that the community can take, providing rapid
feedback to evaluate and refine those actions.

Investigating Ambient Air Quality in Arrowtown using ODINs (2019)                                       7
The heart of the CONA initiative is a series of winter field studies in small New Zealand towns. Each
study has used its host town to develop new technologies or methods, whilst simultaneously
improving the understanding of air quality in that town. As CONA has developed, “daughter” projects
have emerged where some of the better developed CONA technologies have been used either on a
research or commercial basis (Table 1-1).

Table 1-1:    CONA field projects to date.

                                              Main CONA project                   “Daughter” projects

    2015                              Rangiora

    2016                              Rangiora

    2017                              Rangiora

    2018                              Alexandra                            Gisborne, Hobart

    2019                              Arrowtown                            Motueka, Christchurch, Kellogg
                                                                           (Idaho)

1.4        Scope of this report
This progress report covers the Arrowtown 2019 CONA field study. This was the first year that a
CONA study was conducted in Arrowtown. It covers the results of an initial analysis of data from a
network of prototype ambient (outdoor) air quality sensors (“ODINs”) developed by NIWA within the
‘CONA’ initiative. A separate report will cover indoor air quality.

8                                            Investigating Ambient Air Quality in Arrowtown using ODINs (2019)
2 Arrowtown measurement campaign, 2019
2.1 Overview and goals
The Arrowtown 2019 campaign featured the following elements:
▪ Up to 48 prototype ambient air quality sensors (ODINs) deployed in a grid across the
town to better understand variation in air quality
▪ 30 prototype indoor air quality sensors (HauHaus) deployed for up to 3 weeks inside
86 homes.
▪ Measurements of woodburner use in selected homes.
This report covers the ODINs only.
The main goals relating to the ODINs and ambient air quality were:
▪ Technical:
• Test a new approach to telemetry and collection of real-time data
• Deploy the densest ODIN network to date to enable research into spatial
variation, mutual sensor validation, optimal interpolation and anomaly detection
▪ Local air quality:
• Map spatio-temporal variation in air quality in Arrowtown at the maximum
resolution possible with current resources
• Gain insight into the representativeness of the ORC regulatory air quality monitor
2.2 ODINs
The Outdoor Dust Information Node (ODIN) is a low-cost air quality monitor. It is developed by NIWA
and at the time of writing should be considered as an advanced prototype. The ODIN design is
continually evolving and have been progressively developed and deployed through all the CONA field
studies listed in Table 1-1. The version used in Arrowtown in 2019 had the following characteristics:
▪ Simultaneously measures particulate matter in three size ranges: PM10, PM2.5 and PM1
(i.e. particles with an average size smaller than 10 m, 2.5 m and 1 m respectively)
▪ Makes measurements at a user-defined time interval, usually every 1 – 5 minutes.
▪ Also measures air temperature and relative humidity.
▪ Stores data to an onboard SD card.
▪ Where adequate mobile phone coverage is available, data is sent immediately to a
cloud server.
▪ Powered by a combination of solar panel and lithium-ion battery.
Investigating Ambient Air Quality in Arrowtown using ODINs (2019) 92.3 The Arrowtown ODIN Network 2019
The Network was deployed in four phases over winter 2019. ODINs were installed on streetlight
poles as a preference (courtesy of Queenstown-Lakes District Council), with wooden power poles
(courtesy of Aurora Energy) and private property also being used. The aim was to install a regular
rectangular grid with even coverage across the town, insofar as available infrastructure and
permissions made this possible. Table 2-1 summarises the network in each phase.
Table 2-1: The 4 phases of the study.
Phase Start End Number of Average
ODINs installed spacing
between
ODINs
1 29th May 2nd July 22 340 m
2 3rd July 20th Aug 22 340 m
3 21st Aug 10th Sep 37 240 m
4 11th Sep 24th Oct 47 170 m
2.4 Air quality in winter 2019 – the “official” record
ORC operate an air quality monitor in Arrowtown continuously measuring PM10. The monitor is
located in the Arrow River valley at the south-east corner of the town (Figure 2-1). It is used to
provide an official record of air quality in the town, and whether the airshed breeches the National
Environmental Standards (NES).
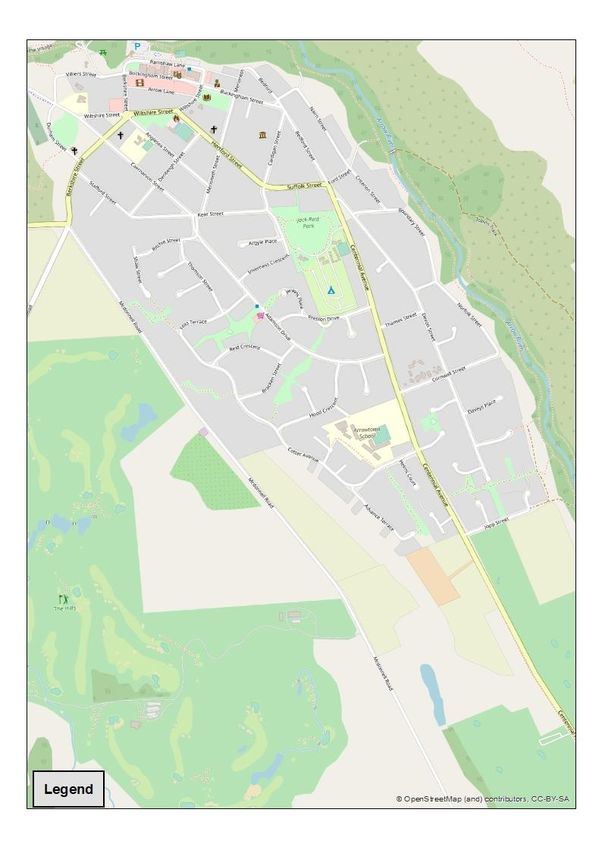
Figure 2-1: Location of the regulatory air quality monitor operated by Otago Regional Council (ORC).
10 Investigating Ambient Air Quality in Arrowtown using ODINs (2019)In winter 2019, the monitor recorded 20 exceedances of the NES – fewer than in the previous 5 years
(ranging from 29 to 46) but more than any other location in New Zealand in 2019. The first
exceedance occurred on 2nd June and the last on 18th August. High concentrations are usually
associated with low winds and low temperatures that occur during anti-cyclonic conditions, which
often persist for several days. Consequently, NES exceedances often occur in clusters of consecutive
days. That is what happened in 2019, with all but 5 exceedances occurring in two clusters. The largest
episode was in late June (10 exceedances over 13 days), with the highest concentration of 108 g m-3
(double the NES) on the 19th June. The second episode was in late July (5 consecutive exceedances).
One of the 20 exceedances occurred before our campaign began. 11 of the 20 exceedances occurred
during phase 1 of our campaign, with the large cluster towards the end of that phase. 8 exceedances
occurred during phase 2 of our campaign, with the second cluster in the middle of that phase. No
exceedances occurred during phases 3 or 4 (Figure 2-2).
150
24 hr average PM10 / g m-3
100
50
0
29-May-19
3-Jul-19
7-Aug-19
10-Jul-19
17-Jul-19
24-Jul-19
31-Jul-19
14-Aug-19
21-Aug-19
28-Aug-19
5-Jun-19
4-Sep-19
12-Jun-19
19-Jun-19
26-Jun-19
11-Sep-19
18-Sep-19
25-Sep-19
2-Oct-19
9-Oct-19
16-Oct-19
23-Oct-19
Figure 2-2: Daily PM10 measured by ORC, and the four phases of this study (coloured bands).
Table 2-2: Range of PM10 concentrations (ORC) during each of the 4 phases of this study.
Phase 24-hr average PM10 / g m-3 Number of NES
exceedances
Mean Min max
1 42 9 108 11
Investigating Ambient Air Quality in Arrowtown using ODINs (2019) 11Phase 24-hr average PM10 / g m-3 Number of NES
exceedances
Mean Min max
2 32 9 81 8
3 18 7 26 0
4 11 4 21 0
12 Investigating Ambient Air Quality in Arrowtown using ODINs (2019)3 Findings part 1 – Performance and validity of the ODINs
3.1 ODIN status and known issues
The ODIN is still a device in active development and during 2019 several upgrades were performed to
the hardware, firmware and processing software. The biggest change, compared to the 2018 version
of the devices, was the upgrade on the firmware that allowed it to more reliably use the GSM
network for sending data to the cloud, and to recover from unsuccessful connections.
Some upgrades were made on only part of the fleet and these included more control over the
telemetry options and a different communication path between the sensing element and the device
controller. These upgrades were only implemented on the devices used for the final phase of the
campaign.
There are a few steps in the operation of the ODIN where faults could arise that lead to data loss:
1. Sensor fault. On rare occasions, the dust sensor fan stops working but the device continues
to communicate, in which case the ODIN reports unusually low values with little or no
temporal variation. A more common fault is the ingress of a foreign object to the sensor’s
optical chamber, typically a spider or an insect, which results in the ODIN reporting very high
values with large variations but none of the typical day/night structure. In both cases, the
data is suspect and removed during the quality control process.
2. Sensor communication fault. On rare occasions, the sensor could fail to communicate its
readings to the ODIN microcontroller, in which case the ODIN would record the value –999
which is removed during the quality control process.
3. Internal memory fault + GSM connectivity loss. In some cases, possibly related to
overheating, the internal memory card becomes corrupted and data is no longer locally
backed up. This can lead to data loss when the GSM connectivity is lost at the same time.
4. Power failure. The ODIN has an internal battery that allows it to operate usually for about 7
days without any re-charge. The 10W solar panel is intended to provide enough power to
charge the battery fully within those 7 days. However, if the recording interval is too short
(less than one minute) or the GSM signal is too low, then the power requirements of the
ODIN increase and the battery is depleted much faster which leads to gaps in the data.
Fortunately, once the solar panel receives enough sunlight, then the ODIN will re-start but
this means that in poor GSM coverage areas it is possible that there will be data gaps
between sunset and sunrise.
3.2 ODIN performance
The main failure modes during the Arrowtown winter 2019 campaign were:
▪ Corrupt SD cards or other hardware faults. This was diagnosed to be the result of
aging memory cards coupled with recurrent power cycles that originated from higher
than expected power consumption.
• Solution: Replace the memory card.
Investigating Ambient Air Quality in Arrowtown using ODINs (2019) 13▪ Blockages or failure of the fan (rare). On two units, the optics chamber of the PM
sensor was blocked by a spider, possibly attracted to the warm area inside the sensor.
Also, on another unit, the internal fan stopped working but the cause remains unclear.
• Solution: Replace the dust sensor.
▪ Mismatch between the power demand of the devices and the output of the solar
panel. The most common failure was the situation where the power consumption of
the unit was more than the battery and solar panel could provide. This manifested
itself as data loss between dusk and dawn.
• Solution 1: Re-orientate the unit to face north so that the solar panel has a clearer
view of the sun.
• Solution 2: Replace the battery.
• Solution 3: A new firmware was developed that reduced power consumption
further.
By the end of the campaign it became apparent that the current version of the ODIN was more likely
to lose power if it was located at the edge or outside the town, where 2G coverage is weaker and the
devices needed to provide more power to the modem to achieve connectivity. This lesson will inform
future upgrades to the ODIN.
Table 3-1: ODIN data recovery for each phase of the study.
Phase Number of ODINs
installed >10 % data >90 % data
1 22 17 (77%) 10 (45%)
2 22 19 (86%) 8 (36%)
3 37 34 (92%) 26 (70%)
4 47 39 (83%) 29 (62%)
3.3 ODIN validity
3.3.1 Relationship to ORC PM10 data
We were unable to set up an ODIN at the long-term air quality monitoring station operated by ORC
this winter, so a direct comparison between ODINs and a regulatory-grade instrument was not
possible. However, ODINs have been co-located with similar instruments at other locations during
other projects (Alexandra, Rangiora, Christchurch, Glen Eden) with results indicating very good
agreement.
Figure 3-1 shows the 24-average PM10 from ORC for the month of July, together with 24-hr average
PM10 and PM2.5 from the nearest ODIN (#63), located approximately 400 m away on Norfolk Street.
14 Investigating Ambient Air Quality in Arrowtown using ODINs (2019)This figure indicates a general agreement between the ODIN and the ORC data. There is some
evidence of the ODIN data having a wider range (reading higher at high concentrations and lower at
low concentrations), but this might be influenced by each instrument being in different locations. It
also indicates how the difference between PM10 and PM2.5 is small. The difference is the contribution
of “coarse” particles between 2.5µm and 10µm, most likely to be composed of mineral dust and soil.
While the ODIN is not intended to be used for regulatory compliance, we are confident that the data
it creates is broadly comparable to regulatory instruments.
120
100
80
PMx / g m-3
ORC_PM10
60
ODIN63 PM10
ODIN63 PM2.5
40
20
0
29-Jun 4-Jul 9-Jul 14-Jul 19-Jul 24-Jul 29-Jul 3-Aug
Figure 3-1: Daily PM10 from the ORC monitor (blue) and PM10 and PM2.5 from the nearest ODIN (#063)
during July.
3.3.2 Co-location data
Whereas in previous NIWA studies, ODINs have been co-located for a period to check their response
relative to each other, this was not logistically possible for the Arrowtown 2019 campaign. However,
previous and concurrent studies have shown good agreement between ODINs, such that they do not
typically deviate from each other by more than 20%.
As the ODIN fleet grows, however, co-location becomes a relatively inefficient means of quality
control. Current and future NIWA research is aiming to develop alternative methods exploiting dense
networks – i.e. each ODIN is near several others. Our primary goal is to identify instruments that are
over- or under-reading.
Investigating Ambient Air Quality in Arrowtown using ODINs (2019) 154 Findings part 2 – Air quality in Arrowtown (winter 2019) 4.1 Temporal variation in air quality The plot in Figure 4-1 shows the range in 24-hour concentrations (midnight to midnight) across the whole ODIN network for each day of the study during July. Figures 4-2 to 4-4 show the same for August, September and October respectively. Figure 4-1: Distributions of 24 hr mean (midnight-midnight) PM2.5 concentrations across network for each day in July. Figure 4-2: Distributions of 24 hr mean (midnight-midnight) PM2.5 concentrations across network for each day in August. 16 Investigating Ambient Air Quality in Arrowtown using ODINs (2019)
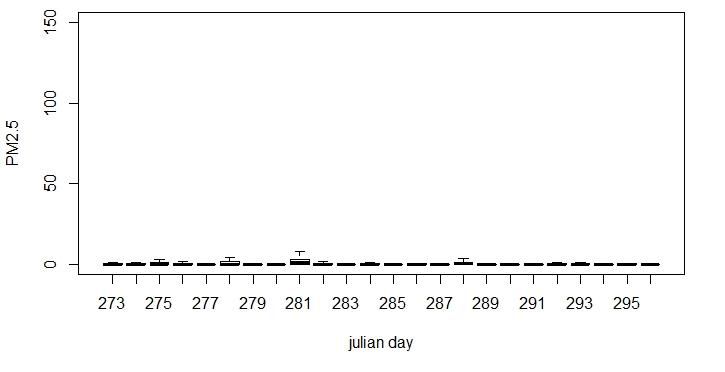
Figure 4-3: Distributions of 24 hr mean (midnight-midnight) PM2.5 concentrations across network for each
day in September.

Figure 4-4: Distributions of 24 hr mean (midnight-midnight) PM2.5 concentrations across network for each
day in October.

These figures confirm that, although more ODINs were deployed in the later stages of the winter,
concentrations had significantly reduced. For this reason, some of the analyses below focus only on
certain phases or months of the campaign.

Figure 4-5 shows the diurnal range of concentrations across the whole network during phase 2 only.
This figure shows that the data can be split into three periods:

          ▪    Night-time (4pm – 5am) – highest concentrations

          ▪    Morning (5 am – 12 noon) – intermediate concentrations

Investigating Ambient Air Quality in Arrowtown using ODINs (2019)                                      17
▪ Afternoon (12 noon – 4 pm) – consistently low concentrations. Figure 4-5: Range of PM2.5 concentrations across the whole ODIN network for each hour during phase 2 only. As can be seen from Figure 4-5, over the course of phase 2, on average, concentrations rose to a peak between 8 and 9am and covered a similar range to those between 5 and 6 pm. However, after this morning peak the concentrations would then fall, whereas in the evening high concentrations would persist or slightly increase further for the next 6 hours. The consequence was that concentrations averaged over the whole of phase 2 in the morning were typically 50 – 60 % of the concentrations averaged over the whole night-time period. In phase 4 the difference had fallen to 36 % on average. On average, afternoon concentrations were a tenth of night-time concentrations. The very low concentrations every afternoon means that air quality effectively ‘resets’ every day. 4.2 Spatial variation in air quality 4.2.1 Technical note – method for producing maps of air quality If data were available from every ODIN for all periods, maps summarising air quality could be easily produced by averaging up the data over whatever period is of interest. However, this is not easily done with the 2019 dataset due to different numbers of ODINs being deployed during different phases and data losses as described in sections 2 and 3 above. To compensate for this, different techniques have been used to produce summary maps of the data captured. The main technique used is to compare concentrations measured at each ODIN with those measured at one chosen as a reference unit. For this report ODIN #179 has been chosen as the reference. This is because it was deployed through all four phases at a site which is relatively central in the town 18 Investigating Ambient Air Quality in Arrowtown using ODINs (2019)
(Thames Street). It had one of the highest rates of data recovery and consistently recorded high
concentrations relative to other sites.

In Figure 4-6 and Figure 4-7 below, concentrations for other sites are presented as the ratio of that
site to the reference site, i.e. a value of 0 denotes clean air, a value of 0 – 1 is below the reference
site, and a value above 1 is more polluted than the reference site. This technique allows data from
different phases and different days to be combined without introducing bias. It is valid only if the
spatial pattern is relatively stable and consistent between periods. Our analysis has confirmed this to
be true at least for phases 1, 2 and 3. During phase 4 a slightly modified spatial pattern was observed
(discussed further below).

4.2.2 Air quality patterns on winter nights
Figure 4-6 shows the pattern in average air quality during the night-time (4pm to 5am) for all nights
in phases 2 and 3 (3rd July – 10th September). It only shows data from sites with more than 50 % data
recovery each night to reduce bias. Phase 1 (June) has not been included due to significant data gaps.
Phase 4 (late September and October) has not been included due to it exhibiting a slightly different
spatial pattern.

Figure 4-6: Ratio of average night-time PM2.5 concentrations at each site relative to the reference site
(black box). Data for phases 2 and 3 only (3rd July - 10th September).

Investigating Ambient Air Quality in Arrowtown using ODINs (2019)                                          19
Figure 4-7 shows an interpolation of these data using kriging. The validity of this approach is yet to be
confirmed through further research and as such this image should be considered indicative rather
than definitive. In particular, the extent of the red and orange ‘high concentration’ zones may be an
over- or under-estimate.

Figure 4-7: Estimated interpolated surface of the ratio of average night-time PM2.5 concentrations at each
site relative to the reference site.

20                                        Investigating Ambient Air Quality in Arrowtown using ODINs (2019)
Figure 4-6 and Figure 4-7 show a very strong spatial gradient. Concentrations to the west of
Centennial Avenue and Bedford Street ranged from 0 - 40 % of those at the reference site. To the
east concentrations ranged from 40 – 105 % relative to the reference site.

There are three exceptions to this general pattern:

          ▪    The ODIN at the Arrowtown School car park recorded average concentrations 95 %
               relative to the reference site.

          ▪    The ODIN on Alexander Place recorded average concentrations 158 % relative to the
               reference site.

          ▪    The ODIN on the corner of Bedford Street and Suffolk Street recorded average
               concentrations 77 % relative to the reference site, which is higher than would be
               expected based on neighbouring ODINs.

Analysis to date has indicated that these anomalies are more likely due to localised high emissions,
but instrumental error cannot yet be ruled out.

4.2.3 Air quality patterns on winter mornings
During phase 2, morning-average concentrations exhibited a spatial pattern with the same main
features as during the night-time – principally a north-west to south-east gradient. However, there is
some evidence that the shape of the pattern is slightly modified with relatively higher concentrations
in the north and centre of the town and lower around the southern edges. On average, morning
concentrations were approximately half of those in the night-time.

During phases 3 and 4, morning concentrations were generally low and relatively poorly correlated
between ODINs. This suggests that either emissions had significantly reduced by this time (phase 3
began in mid-August), or that more increased winds or air turbulence (not measured during this
study) associated with an earlier sunrise and warmer temperatures had increased dispersion, or
(more likely), a combination of both.

4.2.4 Persistence/repeatability of patterns
Only a limited number of sites were monitored successfully during all four phases preventing a
detailed analysis of the changes in spatial patterns across the course of the winter. However, initial
analysis indicates that:

          ▪    Broadly, the average spatial pattern in concentrations was the same during each phase
               with a clear NW-SE gradient.

          ▪    There is some indication that there was a subtle shift in the spatial gradient during the
               campaign with long-term average concentrations falling faster at peripheral sites as
               the home heating season came to an end, relative to within the town’s core.

Investigating Ambient Air Quality in Arrowtown using ODINs (2019)                                        21
5 Discussion and outstanding research issues
5.1 Gross emitters
A “gross emitter” is a term used to describe an emission source (in this case a wood-burning heater)
that creates much higher emissions than is normal. Gross emitters can make a disproportionately
large contribution to a local air quality problem. In principle, an appliance can be a temporary gross
emitter (e.g. wet wood is occasionally used, instead of the normal dry wood), or a persistent gross
emitter (due to poor maintenance, persistent misuse, persistent use of wet or otherwise
inappropriate fuel, etc). Identifying gross emitters is of great value for regulators as mitigation of a
single fireplace might make a large difference to local air quality, and especially the nuisance and risk
posed to immediate neighbours.
In principle, gross emitters will create an anomalous local hotspot of poor air quality. With a dense
enough ODIN network these localised hotspots may be detectable.
Throughout phases 1 to 3 of this study it was apparent that concentrations reported by ODIN #53,
located on Alexander Place, were significantly higher than all other ODINs. An instrument error was
suspected. Subsequently, this ODIN was duplicated in phase 4, when ODIN #209 was placed
immediately above it. Unfortunately, ODIN #53 failed after 8 days. However, this was sufficient to
show that the new ODIN recorded the same concentrations as the original, ruling out instrument
error. This leaves the possibility of a genuine air quality hot spot in that area. Whether this means
one or more gross emitters lie nearby is currently unknown. However, this area has now been
identified as worthy of further investigation.
Research is ongoing to further develop a method for routine gross emitter detection.
5.2 Processes determining temporal variation – can we predict when poor air
quality will occur?
High night-time concentrations were broadly associated with low air temperatures or rapidly falling
temperatures in the late afternoon – consistent with rapid heat loss under clear skies and the
formation of nocturnal inversions. High morning concentrations are currently being investigated.
However, analysis has yet to identify a set of predictor variables that can reliably predict high
concentrations, indicating that either a complex combination of variables is required, or that the
necessary data is either unavailable, or has yet to be included in the analysis. Ongoing research is
investigating external sources of observed and virtual meteorological data.
Afternoon concentrations were very low. This indicates that polluted air is not accumulated in
Arrowtown but replaced, with air quality effectively ‘reset’ every day.
22 Investigating Ambient Air Quality in Arrowtown using ODINs (2019)5.3 Processes determining spatial variation – why is there a pollution
gradient?
In principle there are two types of possible explanations for the high concentrations in the south-east
of the town and low in the north-west: higher density of emissions towards the south-east, or
transport of polluted air to the south-east where it accumulates, or both.
The observational study is not able, on its own, to give a definite explanation. Two pieces of evidence
suggest differences in emissions may play a role:
▪ The 2013 census indicates a somewhat lower density of homes using wood as the
principle source of home heating in the north of the town, with a higher density in the
centre and south-east.
▪ Visible checks by ORC staff have indicated slightly higher frequency of observations of
visibly smoking chimneys east of Centennial Ave, and in the town’s centre (ORC,
personal comms.).
▪ One ODIN in the south-east recorded anomalously high concentrations which may
indicate one or more gross emitters nearby. This aspect will be researched further and
reported elsewhere.
However, the limited analysis to date has identified several clues that also indicate a significant role
for the transport and accumulation of polluted air:
▪ In the early evening concentrations stop rising, peak and begin falling earlier in the
west (on the ridge) than in the east (in the valley). Some ODINs – mainly situated
towards the Arrow River valley or along McDonnel Road - observed ‘double peaks’,
consistent with the arrival of transported smoke after locally-generated smoke levels
had peaked.
▪ The NW-SE gradient appears to be somewhat reduced in the morning relative to the
night-time.
▪ The difference in PM2.5 concentrations between the north-west of the town and the
south-east is much greater than the difference in the proportion of homes who
responded as using wood-burning for home heating in the Census.
These latter three observations are consistent with smoke being emitted relatively evenly across the
town (except maybe in the north-west), but that smoke is then slowly transported on light winds that
generally follow the terrain downhill. Although not directly observed in this study, it is well
established in hilly terrain that when winds are light, air will slowly sink downhill in what are known
as ‘drainage flows’. These flows are strongest shortly after sunset and then weaken during the night.
It is likely that drainage flows will regularly flow along the Arrow River valley from the NW towards
the SE at night. This might be added to by weak flows off the ridge along the west of Arrowtown
(Figure 5-1). In principle this would have the effect of transporting smoke emitted in the western side
of town towards the eastern side of town where it will join the general flow along the river valley. In
this way, the south-east corner of the town may well be exposed to smoke emissions from most or
all the operating chimneys in the town. By the morning the drainage flows are weaker and – once the
sun has risen – vertical mixing becomes more effective meaning there is less opportunity for smoke
to flow and accumulate towards the south-east.
Investigating Ambient Air Quality in Arrowtown using ODINs (2019) 23Figure 5-1: Sketch of how possible terrain-following “drainage” air flows across Arrowtown on high
pollution nights could transport smoke towards the south-east of Arrowtown. These air flows are based on
expert opinion and have not been verified by observation.
5.4 Agricultural and other emission sources
Agricultural smoke is more likely to be emitted in the daylight hours and particularly in the
afternoon. Our initial analysis has not led us to suspect that agricultural sources have had a
significant impact on our measurements. Future analyses will particularly focus on this issue.
A small network of ODINs was left behind at the end of phase 4 and has been operating continuously
through summer 2019/20. The data generated during this period may be better suited to
investigating non-heating emission sources. To date, it is notable that the network detected the
impact of Australian bushfire smoke on 1st January 2020.
5.5 Summary of ongoing and future research needs
▪ Exploring whether the ODIN network can be used to detect temporary or persistent
gross emitting chimneys.
24 Investigating Ambient Air Quality in Arrowtown using ODINs (2019)▪ Exploring the degree to which temporal and spatial patterns in air quality can be
predicted based on weather conditions, including exploration of existing
meteorological data, or the need for new meteorological observations.
▪ Observational validation of the importance of drainage flows and the degree to which
smoke is transported across the town, relative to spatial variations in emission density
and strength.
▪ Developing methods to investigate the impact of agricultural burning as a contributing
factor to air quality in Arrowtown.
Investigating Ambient Air Quality in Arrowtown using ODINs (2019) 256 Implications for stakeholders
6.1 The official (ORC) monitoring record and its interpretation
Regulation 15 of the Resource Management Regulations 2004 state that Regional Councils must
conduct air quality monitoring if the Air Quality National Environmental Standard (NES) is breached
in “that part of the airshed where… the standard is breached by the greatest margin or the standard
is breached most frequently.”
This study has confirmed that the permanent ORC air quality monitoring site meets that regulation in
that it is located in the south-east of Arrowtown where PM concentrations are highest in mid-winter.
However, our results also show that data from this site substantially over-represents concentrations
found in the rest of the town. This is relevant when data from the site is used to represent
population exposure, as (for instance) in health risk assessments such as found in the Ministry for the
Environment’s environmental reporting. A full winter’s monitoring with a full ODIN grid will be able
to quantify the degree of over-representation.
6.2 Risk of exceeding the current and proposed National Environmental
Standards for Air Quality
At the time of writing there is a National Environmental Standard (NES) based on PM10, of 50 g m-3
as a 24-hour average. The current Air Quality Regulations require that if any location within the
airshed exceeds the NES, then the whole airshed is declared to have exceeded. As noted above, in
terms of these Regulations, Arrowtown exceeded the PM10 standard 20 times in winter 2019, 7 times
in July, based on regulatory monitoring at the ORC site.
Using the ODIN data from July, Figure 6-1 shows the number of days on which PM10 concentrations
measured by the ODINs exceeded the current Standard. This value is zero everywhere, except at 4
sites in the south-east (including the reference site) where three values range from 6 – 8 days (i.e.
similar to the official ORC record), and a fourth (Alexander Place) had 14 exceedances.
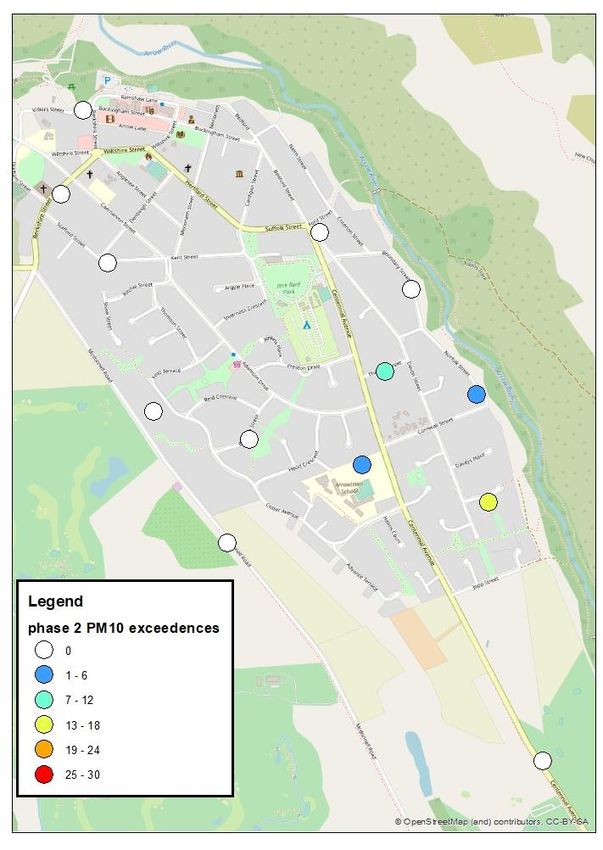
At the time of writing there is a proposal that a new National Environmental Standard will be
introduced, based on PM2.5, of 25 g m-3 as a 24-hour average. Figure 6-2 shows the number of days
on which PM2.5 concentrations exceeded this proposed National Environmental Standard during the
month of July. Values range from zero at only two sites in the north-west corner of the town, to 21
times at the reference site and a peak of 25.
From our data we can conclude that if the PM2.5 NES is adopted, then the number of days for which
Arrowtown does not comply with the standard during mid-winter will increase from approximately 1-
in-4 to 3-in-4.
Although not pertinent to the execution of the Regulations, our data also shows that the proportion
of the town where air quality will exceed the NES will increase from perhaps one-quarter or less (the
south-east corner) to nearly the whole town.
26 Investigating Ambient Air Quality in Arrowtown using ODINs (2019)Figure 6-1: Number of exceedances of the current National Environmental Standard for PM 10 during July. Investigating Ambient Air Quality in Arrowtown using ODINs (2019) 27
Figure 6-2:   Number of exceedances of the proposed National Environmental Standard for PM2.5 during
July.

6.3     The public health risk posed by poor ambient air quality in Arrowtown
Our data has shown that, whilst every residence in the main part of Arrowtown is exposed to
polluted air in winter, the degree varies hugely, with the highest risk in the south-east quadrant of
the town (approximately east of Centennial Ave and south of Boundary Street). Whereas air quality

28                                        Investigating Ambient Air Quality in Arrowtown using ODINs (2019)
in this quadrant is likely to breech the current National Environmental Standard for air quality (PM10),
all the town (except the far north-west corner) is likely to breech the anticipated future Standard for
PM2.5.

However, the Standards do not imply a threshold for public health risk, but merely offer a set level of
protection. Rather, the health risk is believed to be effectively proportional to the long-term
exposure. Our data shows that this long-term exposure is approximately four times greater in the
south-east than in the north-west of Arrowtown.

6.4     Concentrated versus dispersed intervention
Given the limited resources available to spend on reducing emissions, and the discovery of a localised
hot-spot of poor air quality in Arrowtown, it is pertinent to consider whether it is better to attempt
to focus efforts on reducing emissions over the town as a whole, or to concentrate efforts where
they will have the most benefit. According to the 2013 census, the area we have identified as
possessing the poorest air quality (east of Centennial Ave, south of Boundary Lane) contains around
165 homes which reported using wood as the primary source of home heating. A further 345 homes
using wood heating lie outside of that area (a total of 510).

The data from this observational study alone is insufficient to quantify the likely outcome of different
interventions. However, in principle there will be a trade-off. A more targeted intervention focussed
on the 165 homes, or a subset of them, would most likely have a large impact over a small area (the
hot-spot) – reducing the peak concentrations and reducing risk inequality across the town.
Meanwhile a more evenly distributed intervention (aiming at all 510 homes) will tend to have a
smaller impact over a larger area – reducing total exposure (and implied health burden) across the
town because more people and homes are downwind of the intervention.

The data collected in this study can be used in a modelling study to attempt to quantify these effects.
However, any predictions will remain uncertain. Greater certainty can be gained experimentally by
conducting a spatially concentrated intervention within a CONA-style monitoring network.

Investigating Ambient Air Quality in Arrowtown using ODINs (2019)                                     29
7      Summary of conclusions
The following conclusions have a high certainty.

         ▪    Although the official (ORC) record shows that on cold winter nights Arrowtown has
              some of the most polluted air in the country, exceeding National Environmental
              Standards multiple times per year, NIWA’s network of distributed monitors has shown
              that air quality varies hugely across the town.

         ▪    Our data confirms that air quality during the early afternoon period is excellent at all
              locations.

         ▪    Persistent and predictable poor air quality is limited to cold winter nights, with a
              smaller, secondary impact on subsequent mornings.

         ▪    During these conditions, air quality remains generally remains good in the north-west
              of the town, gradually deteriorating towards the south-east. A “high risk” zone for air
              quality exists in an area approximately to the east of Centennial Ave and south of
              Boundary Street.

         ▪    Our findings to date are entirely consistent with smoke from home heating being the
              overwhelmingly dominant source of particulate matter in the air during winter in
              Arrowtown. A preliminary inspection of the data shows no evidence of a major
              contribution from agricultural burning, although this will be investigated further.

The following conclusions have a degree of uncertainty and will be the subject of ongoing research.

         ▪    The data captured suggests that the dominant (and maybe only) cause of the
              differences in air quality across the town is the gentle flow of smoke downhill and its
              collection in the Arrow River valley, probably driven by cold air sinking down the slopes
              of the adjacent hills. Alternative explanations – including higher emissions in the
              south-east of the town due to colder conditions, more, older, mis-used or poorly
              maintained wood-burners – cannot be ruled out but appear less significant.

         ▪    The monitoring technology and approach has the potential to be used to identify
              locations containing homes with persistently abnormally high emissions (“gross
              emitters”) and quantify their impact. To date, one such areas has been identified, and
              this will be the subject of further analysis.

         ▪    Results imply that actions to reduce emissions that were concentrated in the south-
              east of the town would be relatively more effective in reducing pollution
              concentrations where they are worst, reducing risk inequality and the number of
              exceedances of the NES. However, achieving the same emission reduction spread
              evenly across the town may be a more efficient way of reducing total exposure, and
              hence health risk, across the whole town.

30                                       Investigating Ambient Air Quality in Arrowtown using ODINs (2019)
8 Acknowledgements Regulatory monitoring data was provided by Otago Regional Council. Permission to install ODINs on streetlights was provided by Queenstown-Lakes District Council. Permission to install ODINs on power poles was provided by Aurora Energy. Investigating Ambient Air Quality in Arrowtown using ODINs (2019) 31
You can also read