A feasible high spatiotemporal resolution breast DCE-MRI protocol for clinical settings
←
→
Page content transcription
If your browser does not render page correctly, please read the page content below
Available online at www.sciencedirect.com

                                              Magnetic Resonance Imaging xx (2012) xxx – xxx

 A feasible high spatiotemporal resolution breast DCE-MRI protocol for
                            clinical settings
           Luminita A. Tudoricaa, b, c, d, 1 , Karen Y. Oha, 1 , Nicole Roya , Mark D. Kettler a ,
           Yiyi Chend, e , Stephanie L. Hemmingsonb , Aneela Afzal b , John W. Grinstead f ,
                               Gerhard Laubg , Xin Lib , Wei Huangb, d,⁎
                                    a
                                      Diagnostic Radiology, Oregon Health & Science University, Portland, OR, USA
                             b
                             Advanced Imaging Research Center, Oregon Health & Science University, Portland, OR, USA
                                      c
                                       Radiation Medicine, Oregon Health & Science University, Portland, OR, USA
                                   d
                                     Knight Cancer Institute, Oregon Health & Science University, Portland, OR, USA
                           e
                            Public Health and Preventive Medicine, Oregon Health & Science University, Portland, OR, USA
                                                         f
                                                           Siemens Healthcare, Portland, OR, USA
                                                     g
                                                       Siemens Healthcare, San Francisco, CA, USA
                                        Received 31 January 2012; revised 7 April 2012; accepted 18 April 2012

Abstract

    Three dimensional bilateral imaging is the standard for most clinical breast dynamic contrast-enhanced (DCE) MRI protocols. Because of
high spatial resolution (sRes) requirement, the typical 1–2 min temporal resolution (tRes) afforded by a conventional full-k-space-sampling
gradient echo (GRE) sequence precludes meaningful and accurate pharmacokinetic analysis of DCE time-course data. The commercially
available, GRE-based, k-space undersampling and data sharing TWIST (time-resolved angiography with stochastic trajectories) sequence
was used in this study to perform DCE-MRI exams on thirty one patients (with 36 suspicious breast lesions) before their biopsies. The
TWIST DCE-MRI was immediately followed by a single-frame conventional GRE acquisition. Blinded from each other, three radiologist
readers assessed agreements in multiple lesion morphology categories between the last set of TWIST DCE images and the conventional GRE
images. Fleiss’ κ test was used to evaluate inter-reader agreement. The TWIST DCE time-course data were subjected to quantitative
pharmacokinetic analyses. With a four-channel phased-array breast coil, the TWIST sequence produced DCE images with 20 s or less tRes
and ~ 1.0×1.0×1.4 mm 3 sRes. There were no significant differences in signal-to-noise (P=.45) and contrast-to-noise (P=.51) ratios between
the TWIST and conventional GRE images. The agreements in morphology evaluations between the two image sets were excellent with the
intra-reader agreement ranging from 79% for mass margin to 100% for mammographic density and the inter-reader κ value ranging from 0.54
(Pb.0001) for lesion size to 1.00 (Pb.0001) for background parenchymal enhancement. Quantitative analyses of the DCE time-course data
provided higher breast cancer diagnostic accuracy (91% specificity at 100% sensitivity) than the current clinical practice of morphology and
qualitative kinetics assessments. The TWIST sequence may be used in clinical settings to acquire high spatiotemporal resolution breast DCE-
MRI images for both precise lesion morphology characterization and accurate pharmacokinetic analysis.
© 2012 Elsevier Inc. All rights reserved.

Keywords: Breast cancer; Dynamic contrast-enhanced (DCE) MRI; TWIST; Temporal resolution; Spatial resolution

                                                                            1. Introduction

                                                                               Magnetic resonance imaging (MRI) plays an important
                                                                            role in clinical care of breast patients. It is increasingly used
   ⁎ Corresponding author. Advanced Imaging Research Center, Oregon
                                                                            for high-risk population screening, dense breast diagnosis,
Health & Science University, Portland, OR 97239 USA. Tel.: +1 503 418
1534; fax: +1 503 418 1543.
                                                                            diagnostic problem solving, preoperative staging, therapy
   E-mail address: huangwe@ohsu.edu (W. Huang).                             monitoring, and residual disease evaluation. Dynamic
   1
     equal contribution.                                                    contrast-enhanced MRI (DCE-MRI) is a critical part of a
0730-725X/$ – see front matter © 2012 Elsevier Inc. All rights reserved.
doi:10.1016/j.mri.2012.04.009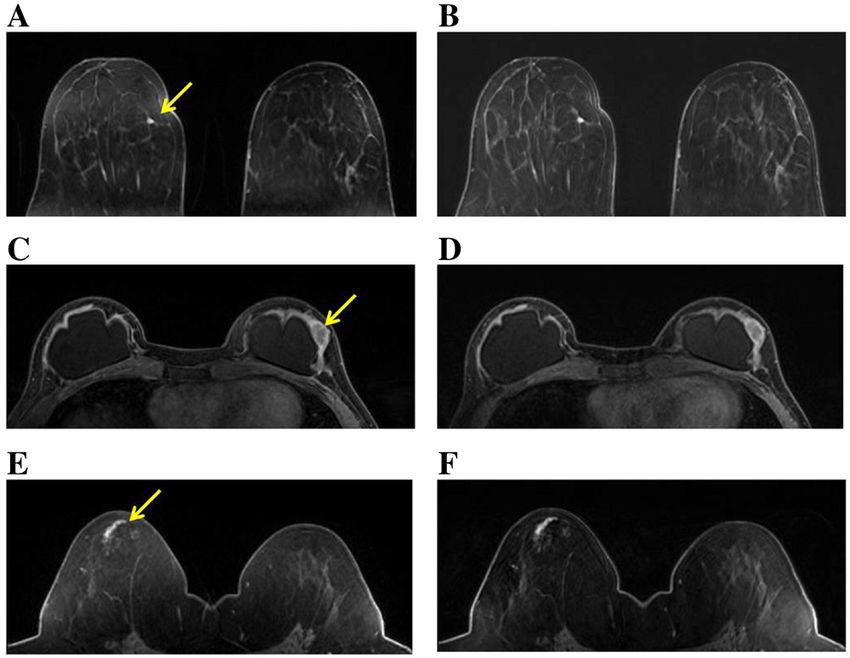
2                                   L.A. Tudorica et al. / Magnetic Resonance Imaging xx (2012) xxx–xxx

routine clinical breast MRI examination protocol. DCE-MRI                image data can be collected with high sRes and tRes
images provide both tumor morphology and contrast kinetics               simultaneously: the former for precise tumor morphology
information, which are decisive in image interpretation and              evaluation and the latter for accurate quantitative pharmaco-
follow-up recommendation by a radiologist. Tumor mor-                    kinetic analysis.
phology assessment has been shown to play an important                      To shorten acquisition time in 3D MRI, such as a breast
role in breast cancer diagnosis [1–3]. Post-contrast DCE-                DCE-MRI exam, one strategy is to abandon the approach of
MRI images are often used for such purposes. Contrast                    uniformly sampling the entire k-space at every time point.
kinetics features in a tumor are extracted from the DCE-MRI              Random partial k-space updating [24] is a good example of
signal intensity time course.                                            such method and half k-space sampling like the HASTE
    Three-dimensional (3D) bilateral imaging is the standard             sequence [25] is now routinely used in clinical MRI.
for breast DCE-MRI protocols at most clinical sites.                     However, these methods come at a cost of reduced signal-
Typically, DCE images are acquired with a conventional                   to-noise ratio (SNR). There have been significant research
gradient echo (GRE) pulse sequence, which employs full k-                efforts in recent years to improve breast DCE-MRI tRes while
space sampling strategy. The trade-off between spatial and               preserving adequate SNR and sRes. Han et al [26] speeded up
temporal resolution (sRes and tRes) in such an acquisition               bilateral breast DCE-MRI by combining spiral imaging with
scheme and the radiologist's preference for high sRes in a               TSENSE (adaptive sensitivity encoding incorporating tem-
clinical protocol result in a typical tRes of 1–2 min, even              poral filtering) acceleration and achieved 1.1×1.1×3.0 mm 3
with the use of parallel imaging acceleration methods [4].               sRes with a tRes of 11 s. Dougherty et al [27] combined
Consequently, the standard clinical approach to describe                 SENSE parallel imaging [4] with a weighted radial view-
contrast kinetics from the DCE signal intensity time-course              sharing scheme – KWIC (k-space weighted image contrast) –
data is either qualitative evaluation of curve shapes [5] or             to obtain an effective tRes of 15 s for 0.5×0.5×3.0 mm 3 sRes.
semi-quantitative assessment of empirical quantities, such as            Several groups [28–30] have demonstrated up to 10x
signal enhancement ratio [6], maximum slope [7,8], washout               acceleration for DCE-MRI (without employing parallel
ratio [9], etc.. However, the results from either approach are           imaging) by using the compressed sensing concept for
often dependent on the MRI scanner (magnetic field                        image reconstruction [31], which allows filling of missing
strength, vendor), data acquisition details (pulse sequence              k-space data by constrained optimization. Simulations using
and parameters), contrast dose and/or injection rate,                    k-spaced-fully-sampled breast DCE-MRI data have shown
personnel skills, etc., and these factors vary site-to-site.             that the DCE signal time-course and derived pharmacokinetic
This contributes to limited specificity and lack of high                  parameters can be faithfully reproduced using the com-
reproducibility for breast DCE-MRI [10].                                 pressed sensing reconstruction method [28–30]. Though
    It has been shown that quantitative analysis of DCE-MRI              promising, the above mentioned techniques are not ready for
time-course data, i.e., pharmacokinetic modeling to extract              implementation at clinical sites. In addition, the computation
pharmacokinetic parameters, can potentially improve accu-                time for reconstruction of the usually large breast DCE-MRI
racy in breast cancer detection [11–15] and is valuable for              image volume is demanding for the compressed sensing
monitoring therapeutic response to neoadjuvant chemother-                method [29,30]. For clinical practice, the impact of
apy [16–18]. Furthermore, one recent study [19] showed that              quantitative breast DCE-MRI would be immediate and
the threshold value of a pharmacokinetic parameter for                   significant if a commercially available pulse sequence were
discrimination of benign and malignant breast lesions was                able to accomplish the goal of high spatiotemporal resolution.
largely independent of scanner platform, field strength, data             The solution may lie in the time-resolved MR angiography
acquisition parameters, and contrast agent selection. This is            (MRA) sequences recently introduced by the major MR
precisely one of the main reasons why DCE-MRI should be                  instrument manufacturers. These include General Electric's
performed quantitatively. However, the 1–2 min tRes of most              TRICKS (time resolved imaging of contrast kinetics) [32,33],
current clinical breast DCE-MRI protocols is inadequate for              Philips’ 4D-TRAK (4D-time resolved MRA with keyhole)
quantitative data analysis. High tRes is required for accurate           [34,35], and Siemens’ TWIST (time-resolved angiography
and meaningful pharmacokinetic analysis [20]. By down-                   with stochastic trajectories) [36,37]. Generally using the
sampling the acquired DCE-MRI time-courses, a recent study               keyhole imaging approach, these sequences have, while
[21] has demonstrated that as tRes decreases, the derived                preserving SNR, readily addressed the sRes and tRes trade-
pharmacokinetic parameters K trans and ve are progressively              off problem that is typical for conventional MRA.
under- and over-estimated, respectively. With regard to breast              The potential of the TRICKS sequence for high
DCE-MRI, the results from simulations show that the cancer               spatiotemporal resolution DCE-MRI has recently been
detection accuracy suffers if the tRes is degraded to the range          evaluated with encouraging results [38,39]. In this study,
of current clinical protocols, regardless of whether the                 we investigated the feasibility of using the GRE-based, 3D
quantitative [22] or semi-quantitative [23] data analysis                TWIST sequence for high sRes and tRes breast DCE-MRI in
approach is used. Therefore, in order for quantitative breast            a pre-biopsy patient cohort with suspicious lesions. The SNR
DCE-MRI to be adopted as a useful and practical imaging                  and CNR (contrast-to-noise ratio) of the TWIST images, as
modality in clinical settings, it must be demonstrated that the          well as lesion morphology assessments, were compared to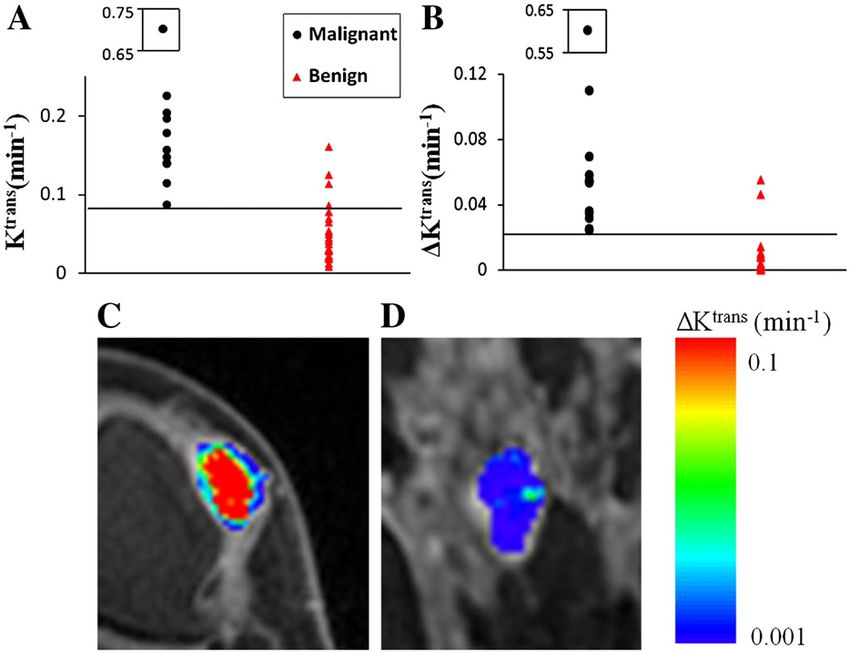
L.A. Tudorica et al. / Magnetic Resonance Imaging xx (2012) xxx–xxx 3
those of the conventional GRE images with full k-space sampled data points relative to the total data points in B. B%
sampling. Quantitative analyses of the TWIST DCE time is equal to 1/3 in the example shown in Fig. 1B. All k-space
courses were performed for the purpose of differentiating points are sorted according to their radial distances from the
benign and malignant lesions. k-space center, and the k-space orders in A and B are defined
such that a spiral-like trajectory occurs with k-space distance
going from the outer to the inner edge of the B region, and
2. Materials and methods from the outer edge to the center in the A region,
respectively. To reconstruct 3D image data for each
2.1. The TWIST sequence
measurement (or time frame) of a dynamic scan, the missing
The TWIST pulse sequence is a GRE type sequence with portions of the B region are copied from the neighboring B
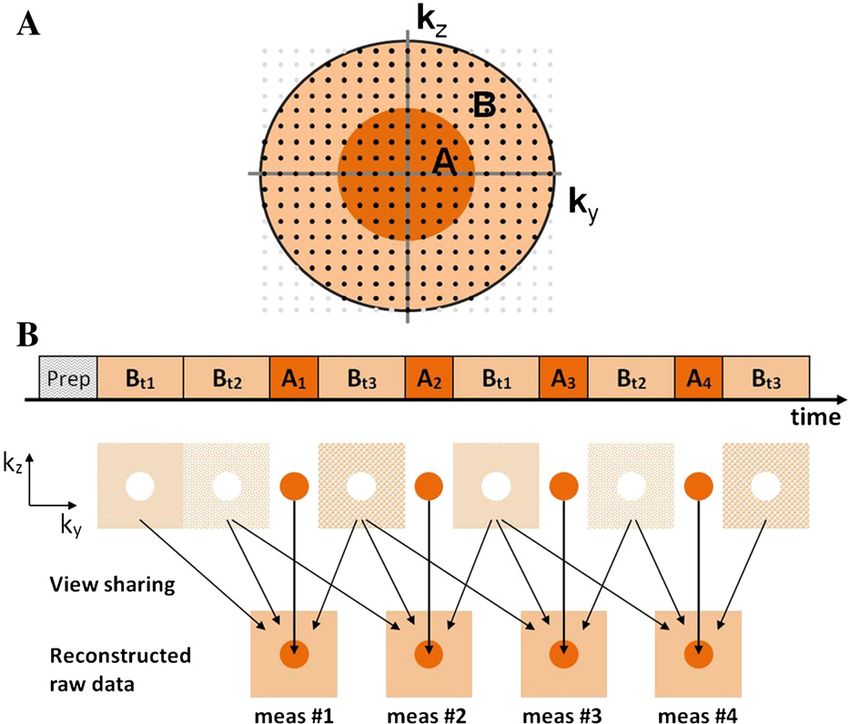
3D k-space data acquisition [36,37]. During a dynamic scan, acquisitions, as shown in Fig. 1B. Assuming it takes time TA
it performs partial k-space undersampling, with emphasis on and TB to measure all k-space points in regions A and B,
more frequent sampling of the k-space center, which governs respectively, the tRes of a dynamic scan using a conventional
image signal intensity and contrast, relative to the k-space GRE sequence is TA+TB. For a dynamic TWIST scan, with
periphery, which governs image fine detail. The TWIST A% of all k-space points and only B% of the k-space points
sequence separates the ky-kz plane into two regions: an inner in the B region are acquired in each repetition, the effective
central region A and an outer peripheral region B (Fig. 1A). tRes is (TA+ TB)[A%+B%(1–A%)]. The smaller the A%
After an initial “Prep” phase of two seconds to bring the and/or the B% values, the shorter the time interval between
magnetization into steady state, the TWIST sequence two consecutive measurements, leading to higher tRes. In
acquires full k-space data only at the beginning (meas #1 addition, the TWIST sequence can be combined with parallel
in Fig. 1B). From here on, the A region is fully sampled in imaging techniques to further improve tRes.
each repetition with A% defining the percentage of the data 2.2. Study population
points in A relative to the total data points in the ky-kz plane,
while the B region is sampled using a k-space trajectory with This research study was approved by the Institutional
a reduced density with B% defining the percentage of the Review Board and was Health Insurance Portability and
Fig. 1. A. The TWIST sequence 2D k-space coverage is displayed. Each dot represents a read-out line in the 3rd k-space dimension. The TWIST acquisition
divides k-space into a center region A and a periphery region B. B. Example of a TWIST dynamic scan with B%=1/3. After a full k-space acquisition for the first
measurement (meas #1), each following measurement acquires all of A and a pseudostochastically determined B portion. The missing portions of the B region
are copied from the neighboring B acquisitions for image reconstruction. An: acquisition of k-space data points in region A for measurement #n; Bt1, Bt2, and Bt3:
k-space trajectory 1, 2, and 3 in region B with equal portion of data points.4 L.A. Tudorica et al. / Magnetic Resonance Imaging xx (2012) xxx–xxx
Accountability Act (HIPAA) compliant with written in- MRI image volume was acquired immediately after the
formed consent. The thirty-one enrolled subjects (mean age: TWIST DCE-MRI scan with the same prescription of the
49 years, range: 32–85 years) are patients who had TWIST acquisition (including the same parallel imaging
mammography- and/or sonography-detected suspicious le- acceleration factor), except that a conventional full-k-space-
sions and were referred for stereotactic or ultrasound-guided sampling 3D GRE sequence was used, resulting in a tRes
core needle biopsies as standard care. A total of 36 of ~ 60 s.
suspicious lesions were detected in the 31 patients (three
2.4. SNR and CNR measurement and comparison
with 2 lesions each and one with 3 lesions), which were all
rated in the BIRADS (Breast Imaging Reporting And Data In the last TWIST DCE image set, a circular region of
System) 4 – suspicious – category. According to the clinical interest (ROI) was drawn in non-enhanced normal paren-
imaging interpretation reports, the mean tumor size (in the chyma area, a second ROI was placed within contrast-
longest dimension) of this cohort was 13.4 mm, with a 3.0 – enhanced tumor region (except for tumor of focus type (b 5
32.0 mm range. Each enrolled subject underwent a research mm)) in an image slice with the brightest contrast
MRI session prior to the biopsy procedure. enhancement (in comparison to adjacent slices that also
contained contrast-enhanced tumor areas) by visual inspec-
2.3. MRI data acquisition tion, and a third ROI was placed in the background noise
(Fig. 2). All three ROIs had the same size (6 pixels), and
The MRI data acquisitions were conducted using a 3T were spatially registered to the conventional GRE images.
MR system (Tim Trio; Siemens Healthcare, Erlangen, The mean and standard deviation (SD) of the ROI signal
Germany) with a body transmit and four-channel phased- intensities were recorded, and the SNR and CNR were
array bilateral breast receive RF coils. Following pilot scans calculated for both image sets for comparison purpose. The
and routine axial multi-slice T2-weighted MRI (with fat SNR was defined as
saturation) and 3D T1-weighted MRI (without fat saturation),
axial bilateral breast DCE-MRI images with fat-saturation SNR = SP = SDN ð1Þ
and full breast coverage were acquired with the TWIST
where SP was the mean signal intensity of the normal
sequence. Fat saturation in the TWIST acquisition was
parenchyma ROI, and SDN was the SD of the noise. The
achieved with a 1-2-1 binomial water excitation pulse. For
CNR was defined as
this study, the A% and B% values of the TWIST sequence
were set at 0.15 and 0.2, respectively, corresponding to a CNR = ðST −SP Þ = SDN ð2Þ
3.125-fold acceleration compared to a conventional GRE
sequence. These numbers were selected based on findings where ST was the mean signal intensity of the ROI in the
from a recent kidney MRA study [37] that showed less than contrast-enhanced tumor region.
5% errors in a TWIST DCE-MRI signal intensity time- 2.5. MRI lesion morphology evaluation and comparison
course when A% and B% were both set at 0.2, compared to a
full-k-space-sampling acquisition. Other acquisition param- All 36 mammography- and/or sonography-detected
eters included 10 o flip angle, 2.9/6.2 ms TE/TR, a parallel lesions exhibited MRI contrast enhancement. To determine
imaging acceleration factor of two, 30–34 cm FOV, whether tumor morphology characterization obtained from
320x320 matrix size, and 120 or 128 slices with 1.4 mm
slice thickness, resulting in ~ 1.0×1.0×1.4 mm 3 sRes. The
acquisition times for the first TWIST DCE-MRI frame (full-
k-space-sampling) were 57 s and 63 s, while those for the
rest of the frames, the de facto DCE-MRI tRes, were 18
and 20 s for the 120-slice and 128-slice image volumes,
respectively. The total DCE-MRI acquisition time was
~ 10 min. At the beginning of the third DCE-MRI frame
acquisition, gadolinium-based contrast agent, ProHance
(Bracco Diagnostics Inc., Princeton, NJ, USA), was
administered intravenously (0.1 mmol/kg at 2 mL/s) through
an antecubital vein by a programmable power injector,
followed by 20 mL saline flush.
For pre-contrast T1 determination - for the purpose of
pharmacokinetic modeling of the DCE-MRI data, proton
density-weighted images were collected immediately before Fig. 2. An axial image from a last set of TWIST DCE-MRI images, showing
a contrast-enhanced tumor in the right breast. Three circular ROIs of equal
DCE-MRI with the same acquisition setup except for 5 o flip size (6 pixels) were placed in the tumor region (red), non-enhancing normal
angle and 50 ms TR. For the purpose of TWIST vs. parenchyma region (yellow), and background noise (green) for image signal
conventional GRE image comparison, a single-frame DCE- intensity measurements.L.A. Tudorica et al. / Magnetic Resonance Imaging xx (2012) xxx–xxx 5
the TWIST DCE-MRI scan is equivalent to that from the of the SM and SSM analyses have been previously described
conventional DCE-MRI scan, three experienced breast in great detail [41–43]. The lesion ROI pharmacokinetic
radiologists (KYO, NR, and MDK, each with at least five parameter value was reported as the weighted (by ROI pixel
years experience in reading breast MRI) compared the last numbers) average of that from each image slice where a
set of TWIST DCE-MRI images with the conventional full- contrast-enhanced lesion ROI was drawn.
k-space-sampling GRE images in multiple morphology
categories based on the American College of Radiology 2.7. Statistical analysis
(ACR) BIRADS MRI Lexicon [40], and gave “yes” or “no”
Paired t test was used to determine if the SNR and CNR of
decisions to indicate whether or not the morphology
the last TWIST DCE image set were significantly different
assessments agreed with each other. These categories
from those of the conventional GRE image set. The
included lesion enhancement type (focus, mass, or non-
proportion of agreement in morphology evaluations between
mass), shape (of mass), margin (of mass), internal enhance-
the TWIST and the conventional GRE images was calculated
ment pattern (of mass and non-mass), tissue mammographic
for each radiologist reader and presented with the exact 95%
density, background parenchymal enhancement, and lesion
confidence limits. The κ statistics was computed to assess
size. The exception is in the tissue mammographic density
inter-reader agreement among the three readers in morphol-
category, for which the radiologists rated “E” for “extremely
ogy comparison, qualitative kinetics curve shape description,
dense”, “H” for “heterogeneously dense”, “S” for “scattered”,
and MRI BIRADS score. κ statistics is a widely used
and “F” for “fatty”. The comparisons conducted by the three
measurement of inter-rater agreement for categorical data
radiologists were blinded from each other.
because it accounts for the agreement occurring by chance.
κ=1 implies full agreement, while κ=0 implies agreement
2.6. Qualitative and quantitative analyses of TWIST only by chance. The κ statistics reported here is the Fleiss’ κ,
DCE-MRI data the most commonly reported κ statistics for multiple raters
[45]. Since the Fleiss’ κ statistics does not incorporate the
One pre- (the baseline image set acquired immediately
ordinal feature of mammographic density and BIRADS
before contrast injection) and five post-contrast image sets
score, Kendall's coefficient of concordance was calculated
were selected from the TWIST DCE series to form a new
for these two categories. The Kendall's coefficient of
dynamic series with a time interval (effective tRes) of 72
concordance is typically used in evaluating raters’ agreement
(120-slice image volume) or 80 (128-slice image volume) s
for ordered responses. It ranges from 0 (no agreement) to 1
between two consecutive image sets, essentially replicating
(complete agreement). For all the variables of interest, a two-
the tRes and number of measurements of the institutional
sized z test was used to evaluate whether the inter-reader
clinical DCE-MRI protocol using a conventional GRE
agreement was significantly greater than by chance at a
sequence. These six image sets were submitted to a computer
significance level of P=.05. All the statistical analyses were
aided diagnosis (CAD) system (DynaCad, Invivo, Gaines-
conducted using the SAS 9.2 software (SAS Institute Inc.,
ville, FL, USA) for qualitative contrast kinetics evaluations.
Cary, NC, USA).
The three radiologist readers classified the DCE curve shapes
as “washout”, “plateau”, and “persistent”, and assigned
BIRADS scores to the enhanced lesions based on both 3. Results
morphology and qualitative kinetics assessments [40]. In
case of disagreement in morphology evaluation between the 3.1. SNR and CNR comparison
TWIST and conventional GRE images, the more suspicious
The SNR values in normal appearing, non-enhancing
evaluation was taken into account in determining the
breast parenchyma were calculated for all 31 patients. The
BIRADS score.
SNR measured from the last set of TWIST DCE images
On an off-line computer workstation, the radiologists drew
(mean±SD: 95±71) was not significantly (P=.45, paired t
ROIs circumscribing the contrast-enhanced lesions. The
test) different from that measured from the conventional
lesion ROI and pixel (within the ROI) TWIST DCE time-
GRE images (104±64). The CNR values were calculated for
course data were then subjected to the Standard Model (SM,
26 of the 36 lesions, because the other 10 lesions were focus
or Tofts model) [41] and Shutter-Speed Model (SSM)
type and too small for reliable tumor ROI signal intensity
[11,42,43] pharmacokinetic analyses – the latter accounts
measurement. The CNR of the last set of TWIST DCE
for intercompartmental water exchange kinetics. For the
images (mean±SD: 58±39) was not significantly (P=.51,
quantitative data analysis, pre-contrast T1 values were
paired t test) different from that of the conventional GRE
calculated by comparing signal intensities between the proton
images (62±41).
density-weighted images and the baseline images from the
DCE series [44]. A population-averaged arterial input function 3.2. Comparison of lesion morphology
(AIF), which was determined from a previous breast DCE-
MRI study with the same contrast injection protocol [11], was The types of enhanced lesions were classified by the
used in this study. The theory and mathematical formulations radiologists as focus, mass, and non-mass. Fig. 3 shows6 L.A. Tudorica et al. / Magnetic Resonance Imaging xx (2012) xxx–xxx
Fig. 3. Three pairs of post-contrast axial images from three women show three enhanced lesions (pointed by the arrows): a focus (A and B), a mass (C and D), and
a non-mass (E and F). The images in the left column (A, C, and E) are from the last TWIST DCE-MRI image sets, while those in the right column (B, D, and F)
are from the conventional GRE image sets. The two images in each pair had the same spatial location in the head-to-foot direction. For each woman, the TWIST
DCE-MRI and the conventional GRE images were acquired with the same flip angle (10o), TE/TR (2.9/6.2 ms), FOV (34 cm for A and B; 32 cm for C and D, and
E and F), in-plane matrix size (320×320), and slice thickness (1.4 mm).
examples of the same image slices from the last TWIST DCE morphology category, as well as the Fleiss’ κ values for inter-
image set and the conventional GRE image set, depicting the reader agreement. The intra-reader agreement in morphology
three lesion types. All three readers answered “yes” in type between the two image sets ranged from 79% for mass
classifications of these three lesions when comparing the two margin to 100% for mammographic density. The κ value
image sets. The focus lesion (Fig. 3A and B) was ranged from 0.54 (Pb.0001) for lesion size to 1.00 (Pb.0001)
pathologically proven to be a benign lesion with fibrocystic for background parenchymal enhancement. Besides κ=0.82
changes, while the mass (Fig. 3C and D) and non-mass (Pb.0001), Kendall's coefficient of concordance was 0.96
(Fig. 3E and F) lesions were pathologically proven to be a (Pb.0001) for mammographic density evaluation.
malignant invasive ductal carcinoma and a malignant ductal The average MRI lesion size in the longest dimension was
carcinoma in situ, respectively. calculated for each lesion based on the three readers’
The percentages of the lesions that had the same measurements. The mean (13.8 mm) and range (3.6 – 32.0
morphologic feature interpretations when comparing the mm) of the MRI lesion size were in excellent agreement with
two image sets are listed in Table 1 for each reader and each those of the mammographic/sonographic lesion size.
Table 1
Agreement in lesion morphology assessment between TWIST and conventional GRE images
Type Mass Non-Mass MD BPE Lesion Size
Shape Margin IE IE
Reader 1 97% (85%, 100%) 96% (79%, 100%) 83% (63%, 95%) 96% (79%, 100%) 100% 100% 94% (81%, 99%) 94% (81%, 99%)
Reader 2 97% (85%, 100%) 96% (79%, 100%) 79% (58%, 93%) 96% (79%, 100%) 100% 100% 94% (81%, 99%) 92% (78%, 98%)
Reader 3 97% (85%, 100%) 96% (79%, 100%) 83% (63%, 95%) 92% (73%, 99%) 100% 100% 94% (81%, 99%) 89% (74%, 97%)
κ statistics 1.00 (Pb.0001) 1.00 (P b0.0001) 0.72 (P b0.0001) 0.74 (P b0.0001) 1.00 0.82 (Pb.0001) 1.00 (P b0.0001) 0.54 (Pb.0001)
IE: internal enhancement; MD: mammographic density; BPE: background parenchymal enhancement.
The numbers in parentheses for each reader are 95% exact confidence limits. They were not calculated for the non-mass IE and MD categories because, when
comparing the two image sets, each reader considered these two morphologic features equivalent for every lesion.
The P values were from z test. It was not calculated for non-mass IE category because there was not sufficient number of non-masses (2 in the 36-lesion cohort).L.A. Tudorica et al. / Magnetic Resonance Imaging xx (2012) xxx–xxx 7
3.3. Comparison of diagnoses by clinical MRI protocol and Table 2
quantitative DCE-MRI Lesion pathologies (N=36)
Pathology Number and Grade
The biopsy pathology analyses revealed that thirteen
Malignant a
lesions were malignant and the other 23 lesions were invasive ductal carcinoma 10 (3 grade III, 4 grade II, 3 grade I)
benign (Table 2), resulting in a positive predictive value invasive lobular carcinoma 2 (1 grade I, 1 grade II)
(PPV) for biopsy of 36% for the clinical mammographic/ ductal carcinoma in situ 1 (grade III)
sonographic diagnoses. Benign
lobular carcinoma in situ b 1
The readers had excellent agreement in qualitative contrast
atypical ductal hyperplasia b 2
kinetics assessments using the CAD system, with к=0.78 benign parenchyma 5
(Pb.0001, z test). The lesion MRI BIRADS scores, based on fibroadenoma 5
the readers’ interpretations of both morphology and qualita- fibrocystic changes 6
tive kinetics, are given in Table 3. Again, the three readers intraductal papilloma b 1
fibroadenomatous lesion 1
had considerable agreements in giving BIRADS scores, with
fibroepithelial lesion 1
к=0.87 (Pb.0001, z test) and Kendall's coefficient of sclerosing adenosis 1
concordance equal 0.95 (Pb.0001). None of the readers a
Core biopsy pathologies were confirmed by subsequent surgical
made a false negative diagnosis, attaining 100% diagnostic biopsy pathologies.
sensitivity each. Their diagnostic specificities and PPVs were b
High risk benign lesions. Subsequent surgical biopsies of these high
in the ranges of 65-69% and 62-65%, respectively (Table 3). risk lesions as standard care found no malignancies.
Fig. 4 shows the ROI K trans (SSM) (Fig. 4A) and ΔK trans
(Fig. 4B) scatter plots for the 36 lesions. ΔK trans, which is are collected and processed. Furthermore, this study,
defined as ΔK trans≡ K trans(SSM) - K trans (SM), measures the together with other studies [11–15], shows that the approach
effects of water exchange on K trans estimation [11,42]. Using of quantitative DCE-MRI improves diagnostic accuracy for
K trans(SSM) as the diagnostic marker, a cut-off value of breast cancer compared to the current standard approaches of
0.08 min - 1 (Fig. 4A) gave an improved specificity (compared clinical breast MRI. These are some of the main reasons why
to the radiologists’ diagnoses) of 83% at 100% sensitivity. quantitative imaging is the future for clinical cancer imaging,
With the same cut-off value obtained from another patient whether for diagnosis or treatment planning and monitoring.
cohort [42], 0.024 min - 1 (Fig. 4B), the ΔK trans marker Adaptation of quantitative DCE-MRI in a clinical breast
provided an even higher specificity of 91% at 100% MRI protocol implies the need for imaging speed acceler-
sensitivity. Fig. 4C and D demonstrate the ΔK trans maps of ation while preserving high sRes, which is an essential
a malignant invasive ductal carcinoma and a benign requirement by radiologists for image interpretation.
fibroadenoma, respectively. With the same color scale, the The TWIST breast DCE-MRI protocol used in this study
malignant lesion exhibited large areas of hot spots, while generated high sRes bilateral axial images with near
none was observed in the benign lesion. With 74% specificity isotropic 1 mm voxel size, which is well above the minimum
and 100% sensitivity at a cut-off value of 0.05 min - 1, the requirement for sRes by the ACR for breast DCE-MRI [40].
diagnostic accuracy of the K trans (SM) marker was not as good The intra- and inter-radiologist reader agreements in
as the K trans(SSM) and ΔK trans markers. The sensitivity, comparisons of all categories of tumor morphologic features
specificity, and PPV values of the K trans(SM), K trans(SSM), between the TWIST and the conventional full-k-space-
and ΔK trans parameters are listed in Table 3. sampling GRE images were excellent, indicating that it is
feasible to achieve, without sacrificing sRes, high tRes for
breast DCE-MRI with the TWIST sequence – 20 s or 18 s
4. Discussion with the data acquisition schemes employed in this study.
Though full k-space data were not acquired in TWIST DCE-
It is gratifying to observe that the ROI ΔK trans cut-off MRI (except for the first time frame), the DCE images at each
value which achieved 100% sensitivity and specificity in a time frame were reconstructed with full k-space data [36,37].
cohort of mainly mammography-occult lesions [42] attained Thus, not surprisingly, the SNR of the non-enhancing normal
91% specificity and 100% sensitivity in this study of a breast parenchyma in the last set of TWIST DCE images was
mammography-visible lesion population. These two DCE- not significantly different from that in the conventional GRE
MRI studies were conducted at different field strength and images. For lesion morphology comparisons, it would have
with different scanner platform, data acquisition details been ideal if the extent of contrast enhancement had been the
(pulse sequence and parameters), and gadolinium contrast same for the two image sets. We fitted the tumor ROI signal
agent. The fact that one single cut-off value performed intensities of the last six DCE time frames with a straight line
similarly well in two different patient cohorts undergoing and calculated its slope and angle relative to a horizontal line.
different DCE-MRI protocols demonstrates the essence of The angles ranged from + 2.9 o to −7.4 o for the 36-lesion
quantitative imaging – the imaging biomarkers are biolog- cohort. Thus, insignificant differences in the extent of
ical quantities, in principle independent of how imaging data contrast enhancement can be assumed between the last8 L.A. Tudorica et al. / Magnetic Resonance Imaging xx (2012) xxx–xxx
Table 3
Breast cancer diagnostic accuracy: sensitivity, specificity, and PPV
BIRADS 2 BIRADS 3 BIRADS 4 BIRADS 5 Sensitivity Specificity PPV
Reader 1 13 2 19 2 100% 65% 62%
Reader 2 12 3 20 1 100% 65% 62%
Reader 3 13 3 18 2 100% 69% 65%
Ktrans(SM) - - - - 100% 74% 68%
Ktrans(SSM) - - - - 100% 83% 76%
ΔKtrans - - - - 100% 91% 87%
BIRADS 2: benign; BIRADS 3: probably benign; BIRADS 4: suspicious abnormality; BIRADS 5: highly suggestive of malignancy. BIRADS 4 and 5 are
positive diagnoses, resulting in biopsy recommendations. PPV: positive predictive value for biopsy. ΔKtrans ≡ Ktrans(SSM) – Ktrans(SM).
TWIST DCE and conventional GRE images, i.e., there was malignant and benign breast lesions. Similar results were
no significant contrast agent wash-in or wash-out occurring in obtained from full-k-space-sampling breast DCE-MRI data
the tumor between the acquisitions of the two image sets. In with comparable tRes (albeit with much lower sRes and
addition, the fact that the CNR was not significantly different single breast coverage) [11,42]. When the intravascular
between the two image sets provides further evidence that this compartment is included in the pharmacokinetic model to fit
was the case (see Eq. [2]) and our approach of morphology the data, the estimation of the additional parameter vp,
comparison was valid. plasma volume fraction, is unlikely to be accurate at ~ 20 s
The results from this study suggest that the use of the tRes [43,46]. This is because the MRI signal contribution
TWIST sequence, and possibly similar keyhole approach from the plasma occurs mainly during the early rising phase
time-resolved MRA sequences from other major vendors, of the DCE time course, which can be accurately captured
may provide a shortcut for rapid translation of quantitative only with sufficient data sampling rate. Additionally, ~ 20 s
breast DCE-MRI in clinical settings. The 20 s or shorter tRes tRes is not adequate for precise direct AIF measurement [20].
achieved in this TWIST DCE-MRI study appears adequate This problem can be resolved by using population averaged
for pharmacokinetic modeling of the time-course data and AIF determined from similar studies (using the same contrast
extracting the K trans (and ΔK trans when both the SM and injection protocol) with higher tRes, as is the case in this
SSM analyses are used) parameter that characterizes study, or using reference-region [47,48] or blinded estima-
Fig. 4. Scatter plots of lesion ROI Ktrans(SSM) (A) and ΔKtrans (B) values for thirteen malignant (black circles) and twenty three benign (red triangles) lesions.
The insets show the outlier malignant lesion relative to the displayed scales. The horizontal lines represent 100% diagnostic sensitivity cut-off values of 0.08 min- 1
(A) and 0.024 min- 1 (B) for Ktrans(SSM) and ΔKtrans, respectively. The latter was determined from another patient cohort with mainly mammography-occult
lesions [42]. Zoomed pixel-by-pixel ΔKtrans color maps of a malignant invasive ductal carcinoma (C) and a benign fibroadenoma (D) are shown overlaid onto the
corresponding post-contrast TWIST DCE-MRI images.L.A. Tudorica et al. / Magnetic Resonance Imaging xx (2012) xxx–xxx 9
tion [49] methods. A four-channel phased-array receive coil space-sampling dynamic scan on static signals. However, for
and a parallel imaging acceleration factor of two were used DCE-MRI studies with varying signal intensities due to
in this study. With 16-channel phased-array breast coil contrast agent uptake and washout, the potential of the
currently commercially available and at least 3X faster TWIST sequence for high sRes and tRes quantitative DCE-
parallel imaging acceleration (in comparison to a 4-channel MRI can be fully realized only after its sampling strategy is
coil) achievable, sub-10 s tRes for TWIST breast DCE-MRI, optimized to maintain signal intensity time course and fine
and therefore more accurate direct AIF measurement and vp image details that are afforded by a conventional full-k-
estimation, is feasible. space-sampling GRE sequence. For TWIST DCE-MRI data
Unlike other sophisticated data acquisition methods acquisition in this study, the fraction of k-space region A and
[26,27] for improving breast DCE-MRI tRes, the TWIST the reduced sampling density in region B were set at fixed
sequence is commercially available and can be readily values that have been shown in a MRA study [37] to incur
implemented in a clinical breast MRI protocol. Other minimal errors in signal intensity (b 5%). Optimization of the
commercially available, keyhole approach pulse sequences combined A% and B% values through simulations should be
include the TRICKS and 4D-TRAK sequences. Though it explored in future research to potentially further improve the
has been shown that signal intensity time course from a tRes of TWIST breast DCE-MRI, while ensuring the
TRICKS DCE-MRI acquisition closely matches that from a reliability of signal intensity time course and minimizing
full-k-space-sampling acquisition [38], the effects of the image artifacts.
TRICKS k-space undersampling strategy on tumor mor- In conclusion, with appropriate k-space undersampling
phology assessment have not been evaluated. In comparison strategy, the TWIST sequence can be used in clinical settings
to the TRICKS sequence which uses linear trajectory when to acquire breast DCE-MRI data with both high sRes and
sampling one central and one of several periphery k-space tRes: the former for precise tumor morphology assessment;
sections, the TWIST sequence uses a spiral and pseudos- the latter for accurate pharmacokinetic analysis of the time-
tochastic trajectory to traverse a full range of k-space with course data.
theoretical advantage in image quality and artifacts reduction
[36]. For broader adoption of high spatiotemporal resolution
Acknowledgments
breast DCE-MRI in clinical settings, it may be beneficial to
investigate, as in this study, the feasibilities of using the
The authors thank Mr. William Woodward for assistance
TRICKS and 4D-TRAK sequences for breast DCE-MRI.
in MRI data acquisition and Mr. Ian Tagge for initial help
Recently, the compressed sensing method for image
with pharmacokinetic analysis of the DCE-MRI data. This
reconstruction from undersampled k-space data has emerged
study was supported in part by National Institutes of Health
to be a potentially ground-breaking technique for high speed
grants RO1-CA120861 and UO1-CA154602.
imaging without sacrificing sRes. Through simulations using
full-k-space-sampled data, several studies [28–30] demon-
strated the potential of the compressed sensing method for References
high spatiotemporal resolution breast DCE-MRI. However,
in these studies compressed sensing image reconstructions [1] Goto M, Ito H, Akazawa K, Kubota T, Kizu O, Yamada K, et al.
were performed at the same DCE time points as the actually Diagnosis of breast tumors by contrast-enhanced MR imaging:
acquired, low tRes full-k-space data. Even though the comparison between the diagnostic performance of dynamic enhance-
ment patterns and morphologic features. J Magn Reson Imaging
resulting, simulated signal intensity time courses have been 2007;25:104–12.
shown to closely match those of the actually acquired data, [2] Kuhl CK, Schild HH, Morakkabati N. Dynamic bilateral contrast-
whether compressed sensing reconstruction of an actually enhanced MR imaging of the breast: trade-off between spatial and
acquired, k-space-undersampled, high tRes DCE-MRI data temporal resolution. Radiology 2005;236:789–800.
set can closely reproduce the time course of a full-k-space [3] Schnall MD, Blume J, Bluemke DA, De Angelis GA, DeBruhl N,
Harms S, et al. Diagnostic architectural and dynamic features at breast
data set is yet to be investigated. Moreover, the effects of this MR imaging: multicenter study. Radiology 2006;238:42–53.
reconstruction method on tumor morphology characteriza- [4] Friedman PD, Swaminathan SV, Smith R. SENSE imaging of the
tion have not been evaluated. Another recent study [50] breast. AJR Am J Roentgenol 2005;184:448–51.
shows that the choice of k-space undersampling schemes can [5] Kuhl CK, Mielcareck P, Klaschik S, Leutner C, Wardelmann E,
Gieseke J, et al. Dynamic breast MR imaging: are signal intensity time
influence both quality and temporal fluctuation of the final
course data useful for differential diagnosis of enhancing lesions?
DCE images reconstructed using the compressed sensing Radiology 1999;211:101–10.
algorithm. Therefore, further investigations need to be [6] Kaiser WA, Zeitler E. MR imaging of the breast: fast imaging
conducted before compressed sensing can be used as a sequences with and without Gd-DTPA. Preliminary observations.
commercial product in clinical settings to perform high Radiology 1989;170:681–6.
spatiotemporal resolution breast DCE-MRI. [7] Moate PJ, Dougherty L, Schnall MD, Landis RJ, Boston RC. A
modified logistic model to describe gadolinium kinetics in breast
Since the images at each time frame are reconstructed tumors. Magn Reson Imaging 2004;22:467–73.
with full-k-space data, the signal intensity time course of a [8] Buadu LD, Murakami J, Murayama S, Hashiguchi N, Sakai S, Masuda
dynamic TWIST scan perfectly reproduces that of a full-k- K, et al. Breast lesions: correlation of the contrast medium10 L.A. Tudorica et al. / Magnetic Resonance Imaging xx (2012) xxx–xxx
enhancement patterns on MR images with histopathologic findings and [25] Semelka RC, Kelekis NL, Thomasson D, Brown MA, Laub GA.
tumor angiogenesis. Radiology 1996;200:639–49. HASTE MR imaging: description of technique and preliminary results
[9] Ikeda O, Yamashita Y, Morishita S, Kido T, Kitajima M, Okamura in the abdomen. J Magn Reson Imaging 1996;6:698–9.
K, et al. Characterization of breast masses by dynamic enhanced MR [26] Han M, Daniel BL, Hargreaves BA. Accelerated bilateral dynamic
imaging. A logistic regression analysis. Acta Radiol 1999;40: contrast-enhanced 3D spiral breast MRI using TSENSE. J Magn Reson
585–92. Imaging 2008;28:1425–34.
[10] Jansen SA, Shimauchi A, Zak L, Fan X, Wood AM, Karczmar GS, [27] Dougherty L, Isaac G, Rosen MA, Nunes LW, Moate PJ, Bostan RC,
et al. Kinetic curve of malignant lesions are not consistent across MRI et al. High frame-rate simultaneous bilateral breast DCE-MRI. Magn
systems: need for improved standardization of breast dynamic contrast- Reson Med 2007;57:220–5.
enhanced MRI acquisition. Am J Roentgen 2009;193:832–9. [28] Smith DS, Welch EB, Li X, Arlinghaus LR, Loveless ME, Koyama T,
[11] Huang W, Tudorica LA, Li X, Thakur SB, Chen Y, Morris EA, et al. et al. Quantitative effects of using compressed sensing in dynamic
Discrimination of benign and malignant breast lesions by using shutter- contrast enhanced MRI. Phys Med Biol 2011;56:4933–46.
speed dynamic contrast-enhanced MR imaging. Radiology 2011;261: [29] Wang H, Miao Y, Zhou K, Yu Y, Bao S, He Q, et al. Feasibility of high
394–403. temporal resolution breast DCE-MRI using compressed sensing
[12] Schabel MC, Morrell GR, Oh KY, Walczak CA, Barlow RB, theory. Med Phys 2010;37:4971–81.
Neumayer LA. Pharmacokinetic mapping for lesion classification in [30] Chen L, Schabel MC, DiBella EVR. Reconstruction of dynamic
dynamic breast MRI. J Magn Reson Imaging 2010;31:1371–8. contrast enhanced magnetic resonance imaging of the breast with
[13] Eyal E, Badikhi D, Furman-Haran E, Kelcz F, Kirshenbaum KJ, temporal constraints. Magn Reson Imaging 2010;28:637–45.
Degani H. Principal component analysis of breast DCE-MRI [31] Lustig M, Donoho D, Pauly JM. Sparse MRI: the application of
adjusted with a model-based method. J Magn Reson Imaging compressed sensing for rapid MR imaging. Magn Reson Med 2007;58:
2009;30:989–98. 1182–95.
[14] Vincensini D, Dedieu V, Eliat PA, Vincent C, Bailly C, de Certaines J, [32] Petkova M, Gauvrit JY, Trystram D, Nataf F, Godon-Hardy S, Munier
et al. Magnetic resonance imaging measurements of vascular T, et al. Three-dimensional dynamic time-resolved contrast-enhanced
permeability and extracellular volume fraction of breast tumors by MRA using parallel imaging and a variable rate k-space sampling
dynamic Gd-DTPA-enhanced relaxometry. Magn Reson Imaging strategy in intracranial arteriovenous malformations. J Magn Reson
2007;25:293–302. Imaging 2009;29:7–12.
[15] Brix G, Kiessling F, Lucht R, Darai S, Wasser K, Delorme S, et al. [33] Kunishima K, Mori H, Itoh D, Aoki S, Kabasawa H, Koga T, et al.
Microcirculation and microvasculature in breast tumors: pharmacoki- Assessment of arteriovenous malformations with 3-Tesla time-
netic analysis of dynamic MR image series. Magn Reson Med resolved, contrast-enhanced, three-dimensional magnetic resonance
2004;52:420–9. angiography. J Neurosrug 2009;110:492–9.
[16] Ah-See MW, Makris A, Taylor NJ, Harrison M, Richman PI, [34] Willinek WA, Hadizadeh DR, von Falkenhausen M, Urbach H,
Burcombe RJ, et al. Early changes in functional dynamic magnetic Hoogeveen R, Schild HH, et al. 4D time-resolved MR angiography
resonance imaging predict for pathologic response to neoadjuvant with keyhole (4D-TRAK): more than 60 times accelerated MRA using
chemotherapy in primary breast cancer. Clin Cancer Res 2008;14: a combination of CENTRA, keyhole, and SENSE at 3.0T. J Magn
6580–9. Reson Imaging 2008;27:1455–60.
[17] Yankeelov TE, Lepage M, Chakravarthy A, Broome EE, Niermann [35] Parmar H, Ivancevic MK, Dudek N, Gandhi D, Mukherji SK. Dynamic
KJ, Kelley MC, et al. Integration of quantitative DCE-MRI and ADC MRA with four-dimensional time-resolved angiography using keyhole at
mapping to monitor treatment response in human breast cancer: initial 3 tesla in head and neck vascular lesions. J Neuroophthalmol 2009;29:
results. Magn Reson Imaging 2007;25:1–13. 119–27.
[18] Pickles MD, Lowry M, Menton DJ, Gibbs P, Turnbull LW. Role of [36] Lim RP, Shapiro M, Wang EY, Law M, Babb JS, Rueff LE, et al. 3D
dynamic contrast enhanced MRI in monitoring early response of time-resolved MR angiography (MRA) of the carotid arteries with
locally advanced breast cancer to neoadjuvant chemotherapy. Breast time-resolved imaging with stochastic trajectories: comparison with
Cancer Res Treat 2005;91:1–10. 3D contrast-enhanced bolus-chase MRA and 3D time-of-flight MRA.
[19] Springer CS, Tudorica LA, Li X, Thakur S, Morris EA, Oh KY, et al. Am J Neuroradiol 2008;29:1847–54.
Meta-population breast cancer screening with the ΔKtrans DCE-MRI [37] Song T, Laine AF, Chen Q, Rusinek H, Bokacheva L, Lim RP, et al.
parameter. Book of abstract: Nineteenth Annual Meeting of the Optimal k-space sampling for dynamic contrast-enhanced MRI with an
International Society for Magnetic Resonance in Medicine. Berkeley application to MR renography. Magn Reson Med 2009;61:1242–8.
(Calif): ISMRM; 2011. p. 3097. [38] Kershaw LE, Cheng HLM. A general dual-bolus approach for
[20] Henderson E, Rutt BK, Lee TY. Temporal sampling requirements for quantitative DCE-MRI. Magn Reson Imaging 2011;29:160–6.
the tracer kinetics modeling of breast disease. Magn Reson Imaging [39] Ramsay E, Causer P, Hill K, Plewes D. Adaptive bilateral breast MRI
1998;16:1057–73. using projection reconstruction time-resolved imaging of contrast
[21] Heisen M, Fan X, Buurman J, van Riel NAW, Karczmar GS, ter Haar kinetics. J Magn Reson Imaging 2006;24:617–24.
Romeny BM. The influence of temporal resolution in determining [40] American College of Radiology (ACR). Breast Imaging Reporting and
pharmacokinetic parameters from DCE-MRI data. Magn Reson Med Data System (BI-RADS), 4th ed; 2003.
2010;63:811–6. [41] Tofts PS, Brix G, Buckley DL, Evelhoch JL, Henderson E, Knopp
[22] Tagge IJ, Li X, Tudorica LA, Chen Y, Hemmingson S, Morris EA, MV, et al. Estimating kinetic parameters from dynamic contrast-
et al. Effects of temporal resolution on breast cancer diagnostic enhanced T1-weighted MRI of a diffusable tracer: standardized
accuracy by quantitative dynamic contrast-enhanced MRI. Book of quantities and symbols. J Magn Reson Imaging 1999;10:223–32.
abstract: Eighteenth Annual Meeting of the International Society for [42] Huang W, Li X, Morris EA, Tudorica LA, Seshan VE, Rooney WD,
Magnetic Resonance in Medicine. Berkeley (Calif): ISMRM; 2010. et al. The magnetic resonance shutter speed discriminates vascular
p. 4748. properties of malignant and benign breast tumors in vivo. Proc Natl
[23] El Khouli RH, Macura KJ, Barker PB, Habba MR, Jacobs MA, Acad Sci 2008;105:17943–8.
Bluemke DA. Relationship of temporal resolution to diagnostic [43] Li X, Huang W, Morris EA, Tudorica LA, Seshan VE, Rooney WD,
performance for dynamic contrast enhanced MRI of the breast. et al. Dynamic NMR effects in breast cancer dynamic-contrast-
J Magn Reson Imaging 2009;30:999–1004. enhanced MRI. Proc Natl Acad Sci 2008;105:17937–42.
[24] Parrish T, Hu X. Continuous update with random encoding (CURE): a [44] Huang W, Wang Y, Panicek DM, Schwartz LH, Koutcher JA.
new strategy for dynamic imaging. Magn Reson Med 1995;33:326–36. Feasibility of using limited-population-based average R10 forL.A. Tudorica et al. / Magnetic Resonance Imaging xx (2012) xxx–xxx 11
pharmacokinetic modeling of osteosarcoma dynamic contrast-en- [48] Yang C, Karczmar GS, Medved M, Stadler WM. Multiple reference
hanced MRI data. Magn Reson Imaging 2009;27:852–8. tissue method for contrast agent arterial input function estimation.
[45] Fleiss JL. Statistical methods for rates and proportions. 2nd Ed. New Magn Reson Med 2007;58:1266–75.
York: Wiley; 1981. [49] Fluckiger JU, Schabel MC, DiBella EVR. Model-based blind estimation of
[46] Sourbron SP, Buckley DL. On the scope and interpretation of the Tofts kinetic parameters in dynamic contrast enhanced (DCE)-MRI. Magn Reson
models for DCE-MRI. Magn Reson Med 2011;66:735–45. Med 2009;62:1477–86.
[47] Yankeelov TE, Luci JJ, Lepage M, Li R, Debusk L, Lin PC, et al. Quantitative [50] Chan RW, Ramsay EA, Cheung EY, Plewes DB. The influence of
pharmacokinetic analysis of DCE-MRI data without an arterial input radial sampling schemes on compressed sensing reconstruction in
function: a reference region model. Magn Reson Imaging 2005;23:519–29. breast MRI. Magn Reson Med 2012;67:363–77.You can also read


