Quantitative STAU2 measurement in lymphocytes for breast cancer risk assessment - Nature
←
→
Page content transcription
If your browser does not render page correctly, please read the page content below
www.nature.com/scientificreports

                OPEN             Quantitative STAU2 measurement
                                 in lymphocytes for breast cancer
                                 risk assessment
                                 Charoenchai Puttipanyalears1, Sikrit Denariyakoon2, Phonthep Angsuwatcharakon1,
                                 Vitavat Aksornkitti1, Mawin Vongsaisuwan3, Sutasinee Asayut4, Somchai Thanasitthichai4,
                                 Narisorn Kongruttanachok5, Chatchawit Aporntewan1,6 & Apiwat Mutirangura1*
                                 Although mammograms play a key role in early breast cancer detection, the test is not applicable
                                 to all women, for example, women under the age of 40. The development of a noninvasive blood
                                 test with high sensitivity and accessibility will improve the effectiveness of breast cancer screening
                                 programmes. Secretory factors released from cancer cells can induce the expression of certain genes
                                 in a large number of white blood cells (WBCs). Therefore, cancer-dependent proteins in WBCs can
                                 be used as tumour markers with high sensitivity. Five proteins (LMAN1, AZI2, STAU2, MMP9 and
                                 PLOD1) from a systemic analysis of a variety of array data of breast cancer patients were subjected
                                 to immunofluorescence staining to evaluate the presence of fixed WBCs on 96-well plates from
                                 363 healthy females and 358 female breast cancer patients. The results revealed that the average
                                 fluorescence intensity of anti-STAU2 and the percentage of STAU2-positive T and B lymphocytes in
                                 breast cancer patients (110.50 ± 23.38 and 61.87 ± 12.44, respectively) were significantly increased
                                 compared with those in healthy females (56.47 ± 32.03 and 33.02 ± 18.10, respectively) (p = 3.56 × 10–71,
                                 odds ratio = 24.59, 95% CI = 16.64–36.34). The effect of secreted molecules from breast cancer cells
                                 was proven by the increase in STAU2 intensity in PBMCs cocultured with MCF-7 and T47D cells at 48 h
                                 (p = 0.0289). The test demonstrated 98.32%, 82.96%, and 48.32% sensitivity and 56.47%, 83.47%, and
                                 98.62% specificity in correlation with the percentage of STAU2-positive cells at 40, 53.34 and 63.38,
                                 respectively. We also demonstrated how to use the STAU2 test for the assessment of risk in women
                                 under the age of 40. STAU2 is a novel breast cancer marker that can be assessed by quantitative
                                 immunofluorescence staining of fixed WBCs that are transportable at room temperature via mail,
                                 representing a useful risk assessment tool for women without access to mammograms.

                                 Abbreviations
                                 WBCs	White blood cells
                                 MRI	Magnetic resonance imaging
                                 CTCs	Circulating tumour cells
                                 LINE-1	Long interspersed element 1
                                 MUC-1	Mucin 1
                                 NCBI	National Center for Biotechnology Information
                                 GEO	Gene Expression Omnibus
                                 CU-DREAM	Connection Up- or Downregulation Expression Analysis of Microarrays
                                 STAU2	Staufen protein 2
                                 PBMCs	Peripheral mononuclear cells
                                 DCIS	Ductal carcinoma in situ
                                 CI	Confidence interval

                                 1
                                  Center of Excellence in Molecular Genetics of Cancer and Human Diseases, Department of Anatomy,
                                 Faculty of Medicine, Chulalongkorn University, 1873 Rama IV Road, Pathumwan, Bangkok 10330,
                                 Thailand. 2The Queen Sirikit Center for Breast Cancer, King Chulalongkorn Memorial Hospital, The Thai Red
                                 Cross Society, Bangkok 10330, Thailand. 3Department of Surgery, Faculty of Medicine, Chulalongkorn University,
                                 Bangkok 10330, Thailand. 4Research and Technology Assessment Department, National Cancer Institute,
                                 Bangkok 10400, Thailand. 5Department of Laboratory Medicine, Faculty of Medicine, Chulalongkorn University,
                                 Bangkok 10330, Thailand. 6Department of Mathematics and Computer Science, Faculty of Science, Chulalongkorn
                                 University, Bangkok 10330, Thailand. *email: mapiwat@chula.ac.th

Scientific Reports |   (2021) 11:915                | https://doi.org/10.1038/s41598-020-79622-2                                             1

                                                                                                                                         Vol.:(0123456789)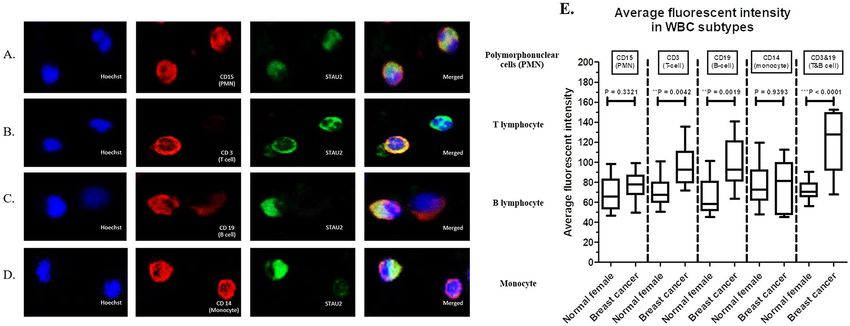
www.nature.com/scientificreports/
ROC Receiver operating characteristic
ER Oestrogen receptor
PR Progesterone receptor
HER2 Human epidermal growth factor receptor 2
A highly sensitive and specific biomarker has benefited a number of clinical applications, especially cancer
screening and treatment m onitoring1–3. The early detection of breast cancer using an effective approach in cancer
screening will contribute to successful treatment and reduce the mortality rate, disease burden and treatment
expense4,5. Breast cancer is the most common cancer in females w orldwide6. Currently, mammography is a
widely available population-based technique used to detect breast cancer at an early stage and has been proven
to decrease the mortality r ate7. Routine mammography provides 68–85% sensitivity and 72–86% specificity, but
inconsistencies in sensitivity and specificity have been reported8,9. The sensitivity is considerably reduced in
highly dense breasts by 50%10. The most effective but expensive techniques for breast cancer diagnosis are breast
magnetic resonance imaging (MRI), which is also known as MRI mammography and exhibits > 92% sensitiv-
ity and specificity11,12. However, one study indicated that the sensitivity of MRI mammography is decreased in
women with high breast density13. To date, breast MRI is recommended as an adjunct to mammograms in the
case of screening high genetic risk individuals.
Mammography screening has been suboptimally accessible in many populations and even in a population of
female healthcare w orkers14. Moreover, awareness of radiation exposure limits mammogram screening in young
women (below 40) even though the risk of breast cancer is 0.5%15. There are a number of barriers that prevent
females worldwide from accessing the current breast cancer screening programme. First, the female must be
exposed to radiation. Second, the test is painful, causing screening avoidance. Third, many facilities are required,
i.e., machines and mammogram readers, making accessibility to mammogram testing d ifficult16–19.
Thus, many researchers focus on the development of tumour markers in blood samples as a less invasive and
easy-to-access approach20–23. Unfortunately, most current circulating breast cancer markers, including serum
tumour markers (CA15-3, CA27.29, CEA), circulating cancer DNA or cell-free DNA (mutation of TP53, KRAS,
PIK3CA and promoter methylation of APC, BRCA1, TWIST) and circulating tumour cells (CTCs), exhibit low
sensitivity24–26.
Recent studies have demonstrated that changes in white blood cells (WBCs) of cancer patients exhibit promis-
ing sensitivity27–30. Our previous study found that breast cancer cells can secrete factors to regulate gene expres-
sion profiles and epigenetic changes in surrounding WBCs, especially gene-containing long interspersed element
1 (LINE-1)27. Mucin 1 (MUC-1)-positive plasma cells were identified as a potential marker in the micrometastatic
lymph nodes of breast cancer patients with high efficiency. This study will apply the knowledge of secreted factors
on induced WBC changes in blood circulation as a cancer-screening tool (Supplementary data 1). In addition,
we previously demonstrated that LINE-1 hypermethylation and upregulation of genes containing LINE-1 are
unique characteristics of breast cancer WBCs27,31. Therefore, to select unique breast cancer markers in WBCs,
we concentrated on genes containing LINE-1. For future screening or diagnosis purposes, upregulated genes
were selected. We disregarded downregulated genes because it is more practical to determine the presence of a
marker or its increased levels in patients compared with its absence or decreased levels.
Accessibility is the key to success in nationwide screening programmes. The ability to transfer samples by mail
is a well-known effective approach for mass screening for inborn errors of m etabolism32. Here, we tested for breast
cancer-inducing proteins in fixed WBCs. Samples prepared by this method are stable and transportable by mail.
Materials and methods
Bioinformatics approach (CU‑DREAM and CU‑DREAM extra). First, three Gene Expression Omni-
bus (GEO) datasets were collected from the National Center for Biotechnology Information (NCBI) database,
including GSE901433, GSE31138 and G SE2756234. The GSE9014 gene expression microarray, which included
stromal cells and invasive breast cancer tissues, was compared with the list of genes containing LINE-1. GEO
datasets were analysed for the expression levels of genes containing LINE-1 using the CU-DREAM-extra (Con-
nection Up- or Down- Regulation Expression Analysis of Microarrays Extra, website: http://pioneer.netse
rv.chula.ac) program35 (1462 genes containing LINE-1 in the library), and p values and odds ratios were cal-
culated. GSE31138 and GSE27562 gene expression microarrays that assessed healthy female WBCs and breast
cancer WBCs were compared. GEO datasets were analysed for gene expression levels using the CU-DREAM
(Connection Up- or Downregulation Expression Analysis of Microarrays, website: http://pioneer.netserv.chula
.ac) program, which calculates p values and odds ratios. All upregulated genes containing LINE-1 from GSE9014
and upregulated genes from GSE31138 & GSE27562 were analysed, and protein expression in each candidate
gene was compared using the Protein Atlas database (https://www.proteinatlas.org/). We manually observed the
data from the Protein Atlas compared with the significantly upregulated genes. The protein expression levels
of the 14 upregulated genes (Supplement data 3) obtained from intersecting data were evaluated in the Protein
Atlas. Five candidate genes with significant p values and moderate levels of protein expression in tissue sections
of the Protein Atlas database were selected from the list of upregulated genes to observe gene expression by
immunofluorescence staining in blood samples.
Blood sample collection. Two millilitres of ethylene diamine (EDTA) blood samples were collected from
358 breast cancer patients and 363 healthy females from September 2016 to March 2018. All cancer cases were
staged according to the revised TNM classification c riteria36 by a pathologist. All healthy females were recruited
from patients without immune disorders, chronic diseases, and family history of cancer and negative mam-
mography examination results. The mammogram results of all participants were graded by a radiologist. EDTA
Scientific Reports | (2021) 11:915 | https://doi.org/10.1038/s41598-020-79622-2 2
Vol:.(1234567890)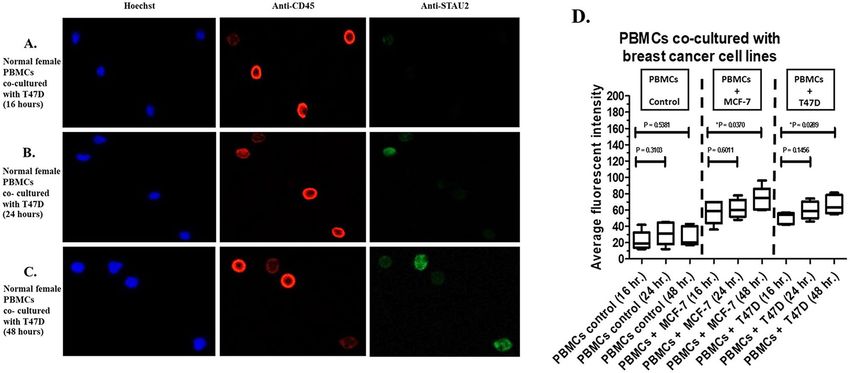
www.nature.com/scientificreports/
blood samples were provided by the National Cancer Institute, Thailand and King Chulalongkorn Memorial
Hospital. All samples were centrifuged for 15 min at 3000 rpm to separate the WBC layer (buffy coat). Then,
100 µl of the WBC layer was transferred to a 1.5-ml Eppendorf tube. All subjects participating in blood collec-
tion were given a self-administered questionnaire to collect their medical history, which was carefully recorded.
All samples were obtained under a protocol approved by the Ethics Committee, Faculty of Medicine, Chulalong-
korn University, Thailand (approval number: IRB 034/59), and National Cancer Institute, Thailand (approval
number: 157_2016RC_OUT487). Thai Clinical Trials Registry number is TCTR20180804002. The collection of
blood samples from all participants was performed based on the WHO guidelines. This study was conducted
in accordance with the Declaration of Helsinki. Supplementary data 2 provides the STROBE checklist. Signed
informed consent was obtained.
Peripheral blood mononuclear cells (PBMCs) separation. The PBMC fraction, including lympho-
cytes and monocytes, was separated by standard Ficoll-Hypaque gradient centrifugation following the manu-
facturer’s protocol (Amersham Pharmacia, Uppsala, Sweden). Briefly, 5 ml of Ficoll-Hypaque gradient was pre-
pared in 15-ml centrifuge tubes. EDTA blood was diluted 1:1 in phosphate-buffered saline (PBS) and carefully
layered over a Ficoll-Hypaque gradient (9–10 ml/tube). The sample tubes were centrifuged for 20 min at 1000g.
The cells in the upper layer were carefully collected and washed twice with PBS for 10 min at 650 g. The cells were
resuspended in RPMI 1640 medium with GlutaMAX supplemented with penicillin (50 U/ml)-streptomycin
(50 g/ml) and 10 mM HEPES (complete RPMI medium) before counting.
Cell lines and coculture conditions. In this study, the human carcinoma cell lines, which were provided
by the American Type Culture Collection (ATCC, VA, USA), included two mammary carcinoma cell lines:
MCF-7 [ATCC-HTB22, ER+ , PR+ , HER2−] and T47D [ATCC-HTB133, ER+ , PR+ , HER2+]. The cell lines
were cultured with DMEM supplemented with 10% FBS (Gibco BRL, Life Technologies) at 37 °C in a humidi-
fied atmosphere (95% air: 5% CO2). The medium was changed every three days, and cell lines were subcultured
twice a week. All cell lines were mycoplasma free as determined using the Boehringer Mannheim BM-Cyclin test
(F. Hoffmann-La Roche Ltd.). The cells grown in culture flasks (CytoOne T225 flask, USA Scientific Inc.) were
collected at 60–65% confluence using 0.05% trypsin and 0.5 mM EDTA and washed in PBS.
The coculture experiments between cancer cells and PBMCs were performed in Transwell culture plates
(Costar, Dutscher, Brumath, France) to allow secretory molecule exchange between both cell types as previously
described24. Breast cancer cell lines were seeded in 24-well culture plates (5 × 10⁴ cells/well) and permitted to
attach to serum-free DMEM overnight. Next, the PBMCs were seeded in permanent membrane culture inserts
that were 6.5 mm in diameter, and the tissue culture-treated polycarbonate membranes had a 0.4-mm pore size
(1 × 10⁵ cells/well). Culture inserts containing PBMCs were placed in wells containing breast cancer cells. PBMCs
were harvested, and immunofluorescence staining was performed after cocultivation for 16, 24, and 48 h.
Immunofluorescence staining. Five microlitres of buffy coat from all blood samples were smeared in
96-well plates. The cells were dried at room temperature for 20 min. Next, 100 µl of 3.7% formaldehyde in
PBS was added to the sample for 20 min at room temperature to fix WBCs to assess morphology. The cells
were washed 5 times with 100 µl of PBS. The cells were permeabilized with 2% Triton X solution for 10 min
at room temperature. All antibodies, including 5 primary antibodies for WBCs (anti-CD45+ primary mouse
antibody (ab8216) for leukocytes, anti-CD15+ primary mouse antibody (ab20137) for polymorphonuclear cells
(neutrophils, eosinophils and basophils), anti-CD3+ primary mouse antibody (ab8671) for T lymphocytes,
anti-CD19 + primary mouse antibody (ab31947) for B lymphocytes, and anti-CD14+ primary mouse antibody
(ab182032) for monocytes), 5 primary antibodies for candidate proteins (anti-STAU2 primary rabbit antibody
(ab184009), anti-AZI2 primary rabbit antibody (ab232654), anti-LMAN1 primary rabbit antibody (ab125006),
anti-MMP9 primary rabbit antibody (ab38898) and anti-PLOD1 primary rabbit antibody (ab2647)) and 2 sec-
ondary antibodies (goat anti-mouse secondary antibody-Cy3 (ab97035) and goat anti-rabbit secondary anti-
body-FITC (ab6717)) (Abcam Co., Ltd., Cambridge, England) were prepared in 1:1000 dilution with binding
buffer (2% FBS and 0.5% Tween20 in PBS).The primary antibodies were incubated with samples overnight at
37 °C, and the secondary antibodies were incubated for 3 h at 37 °C. The cells were washed 5 times with PBS.
Finally, Hoechst nuclear stain (1 µg/µl) was added to the cells and incubated for 15 min at 37 °C. The fluorescent
signal from the cells was observed with a confocal microscope (20×).
The fluorescent signals were detected in 3 colours, including blue (Hoechst, 510–540 nm), red (Cy3,
560–570 nm) and green (FITC, 500–520 nm), using a motorized fluorescence microscope type IX83 (Olympus
Co., Ltd., USA). The protocol for signal intensity detection and the number of positive cells was operated by
CellSens imaging software (Olympus Co., Ltd., USA). Briefly, 12 fields of 20× objective lenses (4 columns × 3
rows) at the centre of each well were captured with specific exposure times as follows: Hoechst (25.5 ms), Cy3
(700 ms) and FITC (316 ms). The signals with 25–200 µm perimeter and 140–300 mean grey intensity values were
counted and exported to apply the CancerScreen.exe program (Please contact author for program requirement),
which was developed by Aporntewan C. The positive signal in each colour was identified by CancerScreen.exe
based on 2 criteria, including the range of perimeter (25–150 µm) and mean grey intensity value in pixels/cell
volume units (150–280). The positive cells showed red and green signals in the same position, and the negative
cells showed only red signals. Then, the average fluorescence intensity of anti-STAU2 in each sample was cal-
culated from the intensity of positive cells divided by the intensity of positive and negative cells. Moreover, the
percentage of STAU2-positive cells was calculated by the number of positive cells divided by the total number
of cells. Positive samples from cocultured PBMCs were applied as interassay variation adjustments.
Scientific Reports | (2021) 11:915 | https://doi.org/10.1038/s41598-020-79622-2 3
Vol.:(0123456789)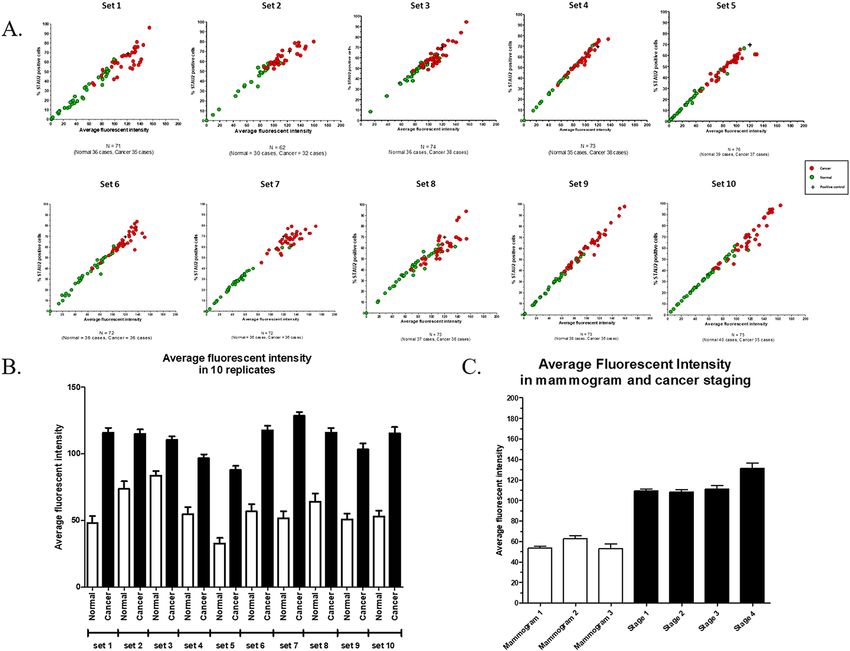
www.nature.com/scientificreports/
Fluorescent intensity STAU2 positive cells
Sample groups N Age (Average ± SD) (Average ± SD) (Average ± SD)*
Normal female (T and B cells) 363 61.20 ± 14.14 56.47 ± 32.03 33.02 ± 18.10
Mammogram 1 197 61.30 ± 19.29 53.44 ± 30.96 32.03 ± 18.00
Mammogram 2 118 63.45 ± 14.80 62.81 ± 33.11 36.56 ± 17.66
Mammogram 3 48 58.33 ± 4.09 53.30 ± 32.04 28.34 ± 18.46
Breast cancer (T and B cells) 358 61.47 ± 13.09 110.50 ± 23.38 61.87 ± 12.44
Stage 1 189 65.63 ± 17.10 109.51 ± 21.50 61.94 ± 11.96
Stage 2 102 62.50 ± 13.62 108.07 ± 25.47 61.81 ± 13.30
Stage 3 47 55.86 ± 5.08 111.34 ± 22.98 62.24 ± 12.58
Stage 4 19 60.60 ± 13.45 131.24 ± 22.31 59.83 ± 13.39
Table 1. The demographic data of all samples in this study included normal female WBCs (N = 363) from
mammograms 1 to 3 and breast cancer WBCs (N = 358) from stage 1 to 4 disease. The average fluorescence
intensity and the percentage of STAU2-positive cells are presented as the average ± SD. Abbreviation: STAU2,
staufen-2. *Data are presented as %.
Statistical analysis and risk assessment. Statistical analyses were performed using SPSS (Statistical
Package for the Social Sciences) software for Windows version 17.0.1 (SPSS Inc., Chicago, IL). Data are expressed
as the average ± SD, and independent sample t-tests were performed to calculate significant differences among
all sample groups. All p values are two-sided, and p values less than 0.05 are considered statistically significant.
Receiver operating characteristic (ROC) curve analysis was performed using MedCalc (Statistical software) for
Windows version 11.3.0.0 (Ostend, Belgium). Risk assessment was evaluated by the posterior probability calcu-
lation based on Bayes’ theorem.
Ethics statement. All samples were obtained under a protocol approved by the Ethics Committee, Faculty
of Medicine, Chulalongkorn University, Thailand (approval number: IRB 034/59) and the National Cancer Insti-
tute, Thailand (approval number: 157_2016RC_OUT487). The collection of blood samples from all participants
was performed in accordance with the WHO guidelines. This study was conducted in accordance with the
Declaration of Helsinki. The participants provided their written informed consent to participate in this study.
Results
Bioinformatics analysis. The GEO datasets were extracted from the NCBI database. The datasets
included expression microarrays from breast cancer stromal cells (GSE9014) and breast cancer blood samples
(GSE31138 and GSE27562). The intersection results between GSE9014 and the list of genes containing LINE-1
were analysed by CU-DREAM extra, which revealed 709 significantly upregulated genes (p = 1.34 × 10–08, odds
ratio = 1.39). The intersection results between GSE31138 and GSE27562 were analysed by CU-DREAM, which
revealed 262 significantly upregulated genes (p = 2.62 × 10–65, odds ratio = 3.64). The lists of upregulated genes
from both intersection results were analysed, and 14 commonly upregulated genes were identified: DENND1B,
STAU2, CAMTA1, LPP, PLEKHB2, MTMR2, LMAN1, PHACTR2, EPHA3, COL8A1, DTNBP1, AZI2, MMP9
and PLOD1 (Supplementary data 3). The 14 upregulated genes in breast cancer lymph nodes were assessed using
the tissue microarray database from the Protein Atlas (https://www.proteinatlas.org). Then, five upregulated
genes with the highest p value and positive staining results in the tissue section of the Protein Atlas database
were selected as candidate genes to perform immunofluorescence staining for LMAN1, AZI2, STAU2, MMP9
and PLOD1. Only STAU2 exhibited positive results for application as a breast cancer screening marker. The
immunofluorescence staining results of other candidate genes are presented in Supplementary data 4.
Immunofluorescence staining. WBCs from breast cancer patients (N = 358) and healthy females
(N = 363) were subjected to immunofluorescence staining. The demographic data of all patients are presented in
Table 1. The following 3 fluorescent signals were observed: (1) Hoechst (blue) is a nuclear stain used to identify the
WBC position; (2) anti-CD45+ (red) binds to a CD45+ molecule, which is a general protein expressed in WBCs;
and (3) anti-STAU2 (green) is an antibody that binds to a candidate protein marker for breast cancer screening.
Anti-CD45+ (red) was observed in WBCs from both breast cancer patients and healthy females (Fig. 1A). The
fluorescent signals from anti-STAU2 were indicated in WBCs from breast cancer patients. (Fig. 1B).
Secretory effect in coculture model. To observe the effect of secretory molecule release from breast
cancer cells, PBMCs were obtained from normal females (N = 5) and cocultured with 2 breast cancer cell lines,
MCF-7 and T47D. The average fluorescence intensity of anti-STAU2 from PBMCs cocultured with T47D cells
(Fig. 2A–C) was significantly increased at 16, 24, and 48 h (p = 0.0289). Increased anti-STAU2 fluorescence
intensity was observed in PBMCs cocultured with both MCF-7 and T47D cells (Fig. 2D).
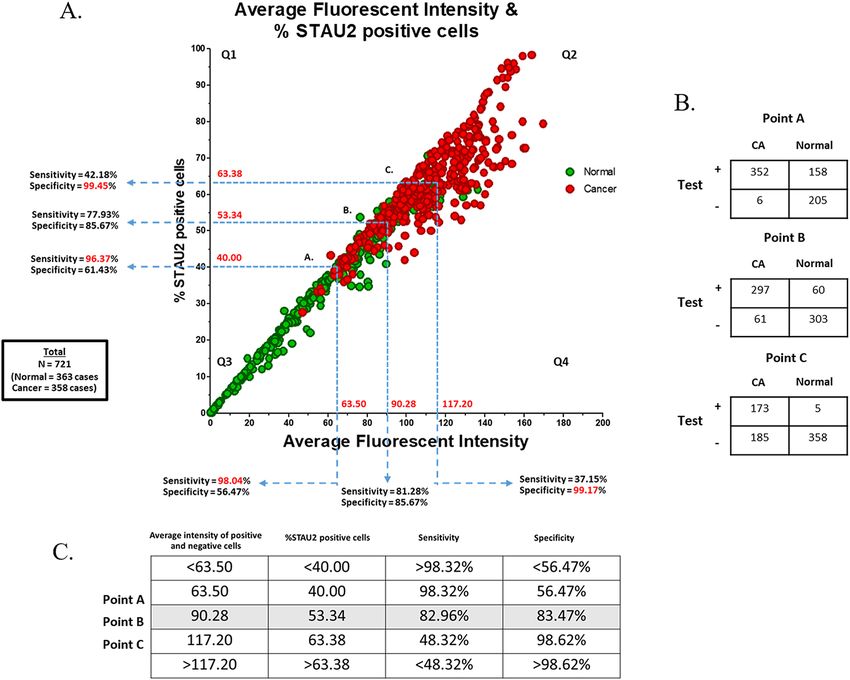
Cell subtypes. Next, four WBC subtypes from breast cancer patients were identified using specific antibod-
ies, including (1) anti-CD15+ for polymorphonuclear cells (Fig. 3A), (2) anti-CD3+ for T lymphocytes (Fig. 3B),
Scientific Reports | (2021) 11:915 | https://doi.org/10.1038/s41598-020-79622-2 4
Vol:.(1234567890)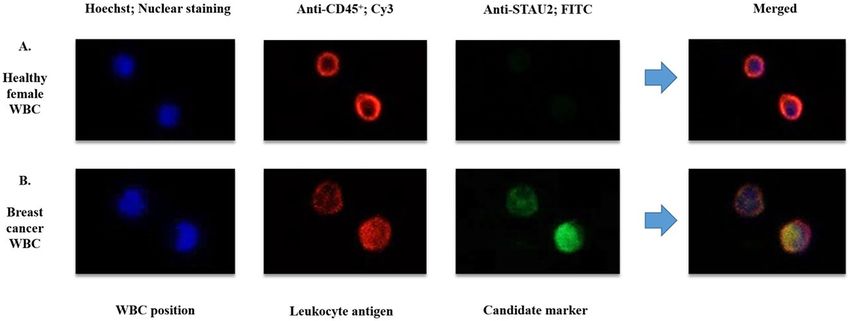
www.nature.com/scientificreports/
Figure 1. Immunofluorescence signal from WBCs from (A) breast cancer patients and (B) healthy females
observed by confocal microscopy (20×). Hoechst was applied to locate WBC position. Anti-CD45+ was used as
a positive control for WBCs. The merged group refers to the combination of 3 fluorescent signals. The positive
fluorescent signal from anti-STAU2 was exclusively observed in breast cancer WBCs.
Figure 2. Fluorescent signals were increased in PBMCs cocultured with breast cancer cells. (A) The fluorescent
signal from PBMCs cocultured with T47D cells at 16 h. (B) The fluorescent signal from PBMCs cocultured with
T47D cells at 24 h. (C) The fluorescent signal from PBMCs cocultured with T47D cells at 48 h. (D) An increase
in the intensity of the anti-STAU2 fluorescent signal was observed in PBMCs cocultured with both MCF-7
(p = 0.0370) and T47D (p = 0.0289) cells compared with control PBMCs. The intensity detection was operated by
CellSens imaging software (Olympus Co., Ltd., USA).
(3) anti-CD19+ for B lymphocytes (Fig. 3C), and (4) anti-CD14+ for monocytes (Fig. 3D). Immunofluorescent
staining for WBC subtypes was performed in breast cancer patients (N = 15) and healthy females (N = 15). A
positive fluorescent signal from anti-STAU2 was observed in all WBC subtypes. Among the four WBC subtypes,
D3+ (p = 0.0042) and CD19+
the average fluorescence intensity of anti-STAU2 was significantly increased in C
+ +
(p = 0.0019) cells. Moreover, the combination of C
D3 and C D19 , which serves as a marker of the group of T
and B lymphocytes, showed a strong increase in the average fluorescence intensity (p < 0.0001) (Fig. 3E). The
combination of CD3+ and CD19+ was applied in immunofluorescence staining and fluorescent signal analysis.
The blood samples in the coculture model and cell subtype experiment were randomly selected from the whole
cohort.
Fluorescent signal analysis (replicative test). Then, we performed immunofluorescent staining and
obtained the average fluorescence intensity and the percentage of STAU2-positive T and B cells in normal
females (N = 363) and breast cancer patients (N = 358). All WBC samples were divided into 10 replicates (sets
Scientific Reports | (2021) 11:915 | https://doi.org/10.1038/s41598-020-79622-2 5
Vol.:(0123456789)www.nature.com/scientificreports/
Figure 3. Subtypes of WBCs from breast cancer patients were identified based on specific antibodies, including
(A) anti-CD15+ for polymorphonuclear cells (PMNs); (B) anti-CD3+ for T lymphocytes; (C) anti-CD19+ for
B lymphocytes; and (D) anti-CD14+ for monocytes. A positive fluorescent signal was observed in all WBC
D3+ T-cells
subtypes. (E) The intensity of the anti-STAU2 fluorescent signal was significantly increased in C
(p = 0.0042) and CD19+ B-cells (p = 0.0019). The combination of CD3+ and CD19+, which refers to the group
of T and B lymphocytes, exhibited a notable increase in the average fluorescence intensity (p < 0.0001). The
intensity detection was operated by CellSens imaging software (Olympus Co., Ltd., USA).
1–10) with a double-blinded test. Positive samples from cocultured PBMCs were applied as interassay variation
adjustments. Interestingly, a similar pattern of results, which revealed high replicative capacity, was found in
all replicates. First, the average fluorescence intensity and the percentage of STAU2-positive cells displayed a
linear correlation ( R2 > 0.9) (Fig. 4A). Second, the average fluorescence intensity of anti-STAU2 in breast cancer
patients was significantly increased compared with that in healthy females (p < 0.0001) (Fig. 4B). Mammogram
(1–3) reports from normal females and breast cancer stage 1–4 patients were obtained to identify potential
correlations with the average fluorescence intensity of anti-STAU2. The average fluorescence intensity of anti-
STAU2 was not significantly different among WBCs obtained from normal females with 1 to 3 mammograms,
but an increasing trend was noted from early-stage to late-stage breast cancer patients (p = 0.0008) (Fig. 4C).
Cut‑off point evaluation (sensitivity and specificity). The average fluorescence intensity and the
percentage of STAU2-positive cells in all samples are summarized in Fig. 5A (N = 721). To distinguish nor-
mal controls and breast cancer patients, receiver operating characteristic (ROC) curve analysis was per-
formed, revealing the following values: the average fluorescent intensity, 63.50 (Sensitivity = 98.04%, Specific-
ity = 56.47%, NPV = 0.9670, PPV = 0.6896), 90.28 (Sensitivity = 81.28%, Specificity = 85.67%, NPV = 0.8223,
PPV = 0.8459), 117.20 (Sensitivity = 37.15%, Specificity = 99.17%, NPV = 0.6154, PPV = 0.9779) and the per-
centage of positive cells, 40.00 (Sensitivity = 96.37%, Specificity = 61.43%, NPV = 0.9526, PPV = 0.7096), 53.34
(Sensitivity = 77.93%, Specificity = 85.67%, NPV = 0.7974, PPV = 0.8429), 63.38 (Sensitivity = 42.18%, Specific-
ity = 99.45%, NPV = 0.6356, PPV = 0.9869) (Fig. 5A and Supplementary data 5). The combination of the aver-
age fluorescence intensity (X-axis) and the percentage of positive cells (Y-axis) was applied as cut-off points,
including A (X = 63.50, Y = 40.00), B (X = 90.28, Y = 53.34) and C (X = 117.20, Y = 63.38) (Fig. 5A). The data were
separated into 4 quarters (Q1–Q4), including positive (Q1, Q2, Q4) and negative (Q3) areas. The positive and
negative cases based on cut-off points A, B and C were counted and classified in a 2 × 2 table (Fig. 5B). The details
of the sensitivity and specificity for cut-off points A, B and C are described in Fig. 5C. The sensitivity of the test
(98.32%, 82.96% and 48.32%) and specificity (56.47%, 83.47% and 98.62%) were correlated with the percent-
age of STAU2-positive cells (40, 53.34 and 63.38, respectively). The highest sensitivity (98.32%) was found at
cut-off point A (NPV = 0.9716, PPV = 0.6902), and the highest specificity (98.62%) was found at cut-off point C
(NPV = 0.6593, PPV = 0.9719). Then, balanced sensitivity (82.96%) and specificity (83.47%) were presented at
cut-off point B (NPV = 0.8324, PPV = 0.8319). The average fluorescence intensity of anti-STAU2 and the per-
centage of positive cells in breast cancer patients (110.50 ± 23.38 and 61.87 ± 12.44) were significantly increased
compared with those in healthy females (56.47 ± 32.03 and 33.02 ± 18.10) (p = 3.56 × 10–71, odds ratio = 24.59,
95% CI = 16.64–36.34) at cut-off point B. In addition, all WBC samples (N = 721) were obtained and subjected
to double-blind experiments. The results revealed that STAU2 was a potential marker to identify breast cancer
samples with high accuracy = 83.22%. Breast cancer prevalence in the United States (15) was applied to calculate
the posterior probability of women under 40 years (prevalence = 1 in 220, 0.455%) to determine whether the risk
was approximately equal to or greater than the risk of women > 40 years old (prevalence = 4 in 165, 2.42%) at
cut-off point B (posterior probability = 2.25%) (Supplementary data 6).
The fluorescent signals from breast cancer T and B cells were analysed and classified based on the type of
cellular receptor, including oestrogen receptor (ER), progesterone receptor (PR) and human epidermal growth
factor receptor 2 (HER2). The percentage of fluorescently stained cells exhibited a slightly significant increase
Scientific Reports | (2021) 11:915 | https://doi.org/10.1038/s41598-020-79622-2 6
Vol:.(1234567890)www.nature.com/scientificreports/
Figure 4. The results of the STAU2 fluorescent signal are presented as the average fluorescence intensity and
the percentage of positive cells. (A) The replicative test of STAU2 staining, which was performed with a double-
blinded test including 10 replicates (sets 1 (N = 71), 2 (N = 62), 3 (N = 74), 4 (N = 73), 5 (N = 76), 6 (N = 72), 7
(N = 72), 8 (N = 73), 9 (N = 73), 10 (N = 75)). Positive samples from cocultured PBMCs were applied as interassay
variation adjustments. The average fluorescence intensity and the percentage of STAU2-positive cells exhibited
a linear correlation (R2 > 0.9). (B) Increases in fluorescence intensity and the percentage of positive cells were
observed in all replicates (p < 0.0001). (C) The average fluorescence intensity was not significantly different
among WBCs obtained from normal females with 1 to 3 mammograms, but an increasing trend was found from
early-stage to late-stage breast cancer patients (p = 0.0008). The intensity detection and the percentage of STAU2-
positive cells were operated by CellSens imaging software (Olympus Co., Ltd., USA).
between the ER+ , PR+ , HER2− and ER+ , PR−, HER2− groups (p = 0.0369) (Supplementary data 7). Moreover, to
test the specificity of anti-STAU2, high percentages of positive T and B cells were not observed in various cancer
types, including colon, bladder, oesophageal, liver, thyroid, ovarian, prostate and stomach cancer. Therefore,
STAU2-positive cells were exclusively identified in breast cancer T and B cells (p = 0.0005) (Fig. 6). These results
reveal that STAU2 can be used as a potential marker in breast cancer screening.
Discussion
Herein, we report a blood test that is useful for breast cancer screening, particularly for women who are unable
to access or have a contraindication for mammography. For example, women under the age of 40 must weigh
the risk of radiation exposure with the risk of having breast cancer37. The STAU2 blood test can be applied for
risk assessment for this group. Supplementary data 6 demonstrates an example of risk calculation and STAU2
results that may indicate further breast imaging tests.
The sensitivity of this tumour marker in T and B cells is high because induction via tumour secretion requires
only a few cancer cells. However, the percentages of STAU2 in T and B cells were minimally different among
different breast cancer subtypes and stages. Therefore, STAU2 provides minimal benefit for tumour classification
and prognosis prediction.
One crucial concern for most patients was residual cancer or recurrence after treatment. Because STAU2 in
T and B cells is positive even with a low number of cancer cells, monitoring treatment outcomes using the test
Scientific Reports | (2021) 11:915 | https://doi.org/10.1038/s41598-020-79622-2 7
Vol.:(0123456789)www.nature.com/scientificreports/
Figure 5. The fluorescent signal of STAU2 in all samples (N = 721) for cut-off point evaluation. (A) Three
cut-off points (A, B, C) were evaluated. High sensitivity (82.96%) and high specificity (83.47%) were noted at
cut-off point B. The intensity detection and the percentage of STAU2-positive cells were operated by CellSens
imaging software (Olympus Co., Ltd., USA). (B) The 2 × 2 table of positive and negative cases based on cut-off
points A, B and C for sensitivity and specificity calculation. (C) The sensitivity and specificity details for cut-off
points A, B and C showed that cut-off point B was the balanced cut-off point (p = 3.56 × 10–71, odds ratio = 24.59,
95% CI = 16.64–36.34) with low false positive and negative rates (high accuracy = 83.22%, NPV = 0.8324,
PPV = 0.8319).
will provide information on whether the patients are completely cured from cancer. Nevertheless, the potential
use of STAU2 in T and B cells for treatment monitoring requires further research. The secretion of breast cancer-
related cells may be distributed throughout the entire body, including bone marrow, and information on the
half-life of STAU2 in T and B cells after treatment is not currently available.
WBC protein detection by immunofluorescence techniques provides at least two advantages. First, the tech-
nique can distinguish cell types and the intensity of each cell. This information may benefit future diagnosis
applications. In addition, the technique is noninvasive, and fixed WBCs in 96-well plates can be transported at
room temperature via mail. This benefit makes STAU2 in WBCs a promising biomarker for breast cancer screen-
ing public health programmes, including populations with limited resources and radiology experts.
The specific upregulation of STAU2 in WBCs in breast cancer makes the protein a potential target for breast
cancer immunotherapy. STAU2 is a staufen double-stranded RNA-binding protein 2, and its gene is located
on chromosome 8q21. This protein can interact with zinc finger protein 346 (ZNF346)38, which can bind to
double-stranded RNA molecules. STAU2 can form a complex with DICER1 and UPF1 RNA h elicase39 that may
be involved in RNA degradation processes and mRNA and protein transport; however, the function of STAU2
protein remains unclear40. The upregulated levels of STAU2 protein only in T and B cells might be related to the
RNA transport mechanism to produce various inflammatory cytokine (IL-10, TNF-α) molecules that are required
to promote tumour growth in the cancer m icroenvironment41,42. Some studies have reported that STAU2 is an
anti-apoptotic protein involved in DNA replication and maintenance of genome integrity43.
Scientific Reports | (2021) 11:915 | https://doi.org/10.1038/s41598-020-79622-2 8
Vol:.(1234567890)www.nature.com/scientificreports/
Figure 6. The percentage of fluorescently labelled T and B-cells in various types of cancer, including breast,
colon, bladder, oesophageal, liver, thyroid, ovarian, prostate and stomach cancer. The results from normal female
and breast cancer samples were randomized into groups I–III. The results demonstrate that STAU2-positive cells
were exclusively identified in breast cancer samples (p = 0.0005). However, some cancers exhibit a low level of
STAU2-positive cells, such as liver, thyroid, ovarian and prostate cancer.
Conclusion
Our study identified STAU2 protein as a novel breast cancer marker in T and B cells. The quantitative nature
of the test provides useful information for risk assessment for a large number of individuals for whom mam-
mograms are not feasible. The other advantages of the use of a cancer marker from a blood sample include its
noninvasive nature, ease of accessibility and sample transportation. Therefore, the STAU2 protein in T and B cells
represents a promising breast cancer marker for improving breast cancer screening programmes.
Received: 14 August 2020; Accepted: 8 December 2020
References
1. Mutirangura, A. et al. Epstein-Barr viral DNA in serum of patients with nasopharyngeal carcinoma. Clin. Cancer Res. 4(3), 665–669
(1998).
2. Lo, Y. M. Quantitative analysis of Epstein-Barr virus DNA in plasma and serum: applications to tumor detection and monitoring.
Ann. N. Y. Acad. Sci. 945, 68–72 (2001).
3. Chan, K. C. A. et al. Analysis of plasma Epstein-Barr virus DNA to screen for nasopharyngeal cancer. N. Engl. J. Med. 377(6),
513–522 (2017).
4. Schoor, G. V. et al. Increasingly strong reduction in breast cancer mortality due to screening. Br. J. Cancer 104, 910–914 (2011).
5. Unger-Saldana, K. Challenges to the early diagnosis and treatment of breast cancer in developing countries. World J. Clin. Oncol.
5(3), 465–477 (2014).
6. Ferlay, J. et al. Cancer incidence and mortality worldwide: sources, methods and major patterns in GLOBOCAN 2012. Int. J. Cancer
136, E359–E386 (2015).
7. Tabar, L. et al. Reduction in mortality from breast cancer after mass screening with mammography. Randomised trial from the
Breast Cancer Screening Working Group of the Swedish National Board of Health and Welfare. Lancet 1(8433), 829–832 (1985).
Scientific Reports | (2021) 11:915 | https://doi.org/10.1038/s41598-020-79622-2 9
Vol.:(0123456789)www.nature.com/scientificreports/
8. Raikhlin, A. et al. Breast MRI as an adjunct to mammography for breast cancer screening in high-risk patients: retrospective
review. AJR Am. J. Roentgenol. 204(4), 889–897 (2015).
9. Jacobsen, K. K. et al. Comparing sensitivity and specificity of screening mammography in the United States and Denmark. Int. J.
Cancer 137(9), 2198–2207 (2015).
10. Berg, W. A. et al. Combined screening with ultrasound and mammography vs mammography alone in women at elevated risk of
breast cancer. JAMA 299(18), 2151–2163 (2008).
11. Urbain, J. Breast cancer screening, diagnostic accuracy and health care policies. CMAJ 172(2), 210–211 (2005).
12. Elmore, J. G. et al. Screening for breast cancer. JAMA 293(10), 1245–1256 (2005).
13. Kriege, M. et al. Factors affecting sensitivity and specificity of screening mammography and MRI in women with an inherited risk
for breast cancer. Breast Cancer Res. Treat. 100(1), 109–119 (2006).
14. Nazzal, Z. et al. Motivators and barriers to mammography screening uptake by female health-care workers in primary health-care
centres: a cross-sectional study. Lancet 391(Suppl 2), S51 (2018).
15. American Cancer Society. Breast Cancer Facts & Figures 2017–2018 (American Cancer Society, Inc., Atlanta, 2017).
16. Lord, S. J. et al. A systematic review of the effectiveness of magnetic resonance imaging (MRI) as an addition to mammography
and ultrasound in screening young women at high risk of breast cancer. Eur. J. Cancer 43(13), 1905–1917 (2007).
17. Houssami, N. et al. Accuracy and surgical impact of magnetic resonance imaging in breast cancer staging: systematic review and
meta-analysis in detection of multifocal and multicentric cancer. J. Clin. Oncol. 26(19), 3248–3258 (2008).
18. DeFrank, J. T. & Brewer, N. A model of the influence of false-positive mammography screening results on subsequent screening.
Health Psychol. Rev. 4(2), 112–127 (2010).
19. Fuller, M. S., Lee, C. I. & Elmore, J. G. Breast cancer screening: an evidence-based update. Med. Clin. N. Am. 99(3), 451–468 (2015).
20. Kaiser, J. “Liquid biopsy” for cancer promises early detection. Science 359(6373), 259 (2018).
21. Holdenrieder, S. et al. Clinically meaningful use of blood tumor markers in oncology. Biomed. Res. Int. 2016, 9795269 (2016).
22. Wang, R. et al. Cell-free circulating tumor DNA analysis for breast cancer and its clinical utilization as a biomarker. Oncotarget
8(43), 75742–75755 (2017).
23. Kobayashi, T. A blood tumor marker combination assay produces high sensitivity and specificity for cancer according to the natural
history. Cancer Med. 7(3), 549–556 (2018).
24. Stearns, V., Yamauchi, H. & Hayes, D. F. Circulating tumor markers in breast cancer: accepted utilities and novel prospects. Breast
Cancer Res. Treat. 52, 239–259 (1998).
25. Duffy, M. J. Serum tumor markers in breast cancer: are they of clinical value?. Clin. Chem. 52, 345–351 (2006).
26. Cohen, J. D. et al. Detection and localization of surgically resectable cancers with a multi-analyte blood test. Science 359(6378),
926–930 (2018).
27. Puttipanyalears, C. et al. Breast cancer upregulating genes in stromal cells by LINE-1 hypermethylation and micrometastatic
detection. Epigenomics 8(4), 475–486 (2016).
28. Hamm, A. et al. Tumour-educated circulating monocytes are powerful candidate biomarkers for diagnosis and disease follow-up
of colorectal cancer. Gut 65(6), 990–1000 (2016).
29. Arayataweegool, A. et al. Head and neck squamous cell carcinoma drives line-1 hypomethylation in the peripheral blood mono-
nuclear cells. Oral Dis. 24(6), 64–72 (2018).
30. Boonsongserm, P. et al. Tumor-induced DNA methylation in the white blood cells of patients with colorectal cancer. Oncol. Lett.
18(3), 3039–3048 (2019).
31. Kitkumthorn, N. et al. LINE-1 methylation in the peripheral blood mononuclear cells of cancer patients. Clin. Chim. Acta
413(2012), 869–874 (2012).
32. El-Hattab, A. W., Almannai, M. & Sutton, V. R. Newborn screening: history, current status, and future directions. Pediatr. Clin. N.
Am. 65(2), 389–405 (2018).
33. Finak, G. et al. Stromal gene expression predicts clinical outcome in breast cancer. Nat. Med. 14(5), 518–527 (2008).
34. LaBreche, H. G., Nevins, J. R. & Huang, E. Integrating factor analysis and a transgenic mouse model to reveal a peripheral blood
predictor of breast tumors. BMC Med. Genom. 4, 61 (2011).
35. Aporntewan, C. et al. Hypomethylation of intragenic LINE-1 represses transcription in cancer cells through AGO2. PLoS ONE
6(3), e17934 (2011).
36. Singletary, S. E. & Greene, F. L. Revision of breast cancer staging: the 6th edition of the TNM classification. Semin. Surg. Oncol.
21(1), 53–59 (2003).
37. Law, J., Faulkner, K. & Young, K. C. Risk factors for induction of breast cancer by X-rays and their implications for breast screening.
Br. J. Radiol. 80(952), 261–266 (2007).
38. Furic, L., Maher-Laporte, M. & DesGroseillers, L. A genome-wide approach identifies distinct but overlapping subsets of cellular
mRNAs associated with Staufen1- and Staufen2-containing ribonucleoprotein complexes. RNA 14(2), 324–335 (2008).
39. Park, E. & Maquat, L. E. Staufen-mediated mRNA decay. Wiley Interdiscip. Rev. RNA 4(4), 423–435 (2013).
40. Duchaine, T. F. et al. Staufen2 isoforms localize to the somatodendritic domain of neurons and interact with different organelles.
J. Cell Sci. 115(Pt 16), 3285–3295 (2002).
41. Maher-Laporte, M. et al. Molecular composition of Staufen2-containing ribonucleoproteins in embryonic rat brain. PLoS ONE
5(6), e11350 (2010).
42. Landskron, G. et al. Chronic inflammation and cytokines in the tumor microenvironment. J. Immunol. Res. 2014, 1–19 (2014).
43. Zhang, X. et al. The downregulation of the RNA-binding protein Staufen2 in response to DNA damage promotes apoptosis. Nucleic
Acids Res. 44(8), 3695–3712 (2016).
Acknowledgements
The authors would like to thank the Faculty of Medicine, Chulalongkorn University for equipment, laboratory
assistance and technical support.
Author contributions
The study was conceived by A.M. The experiments were conducted and designed by A.M. and C.P. The experi-
ments were performed by C.P., S.D. and V.A. The clinical samples were recruited and collected by C.P., P.A.,
V.A., S.D., M.V., S.A., S.T., and N.K. The results were analysed and interpreted by C.P., C.A. and A.M. C.P. wrote
the manuscript. A.M. reviewed and edited the manuscript. All authors read and approved the final manuscript.
Funding
This study was financially supported by the National Research Council of Thailand (NRCT); National Science
and Technology Development Agency (Grant Number FDA-CO-2561-8477-TH); Ratchadapiseksomphot Fund
for Postdoctoral Fellowship and Development of New Faculty Staff, Chulalongkorn University; and the Anantara
Siam Bangkok Hotel in conjunction with the Four Seasons Hotel Care for Cancer 2017 Fun Run in coordination
Scientific Reports | (2021) 11:915 | https://doi.org/10.1038/s41598-020-79622-2 10
Vol:.(1234567890)www.nature.com/scientificreports/
with the Thai Red Cross Society and Chulalongkorn University. The authors have no other relevant affiliations
or financial involvement with any organization or entity with a financial interest in or financial conflict with the
subject matter or material discussed in the manuscript apart from those disclosed. No writing assistance was
utilized in the production of this manuscript.
Competing interests
The authors declare no competing interests.
Additional information
Supplementary Information The online version contains supplementary material available at https://doi.
org/10.1038/s41598-020-79622-2.
Correspondence and requests for materials should be addressed to A.M.
Reprints and permissions information is available at www.nature.com/reprints.
Publisher’s note Springer Nature remains neutral with regard to jurisdictional claims in published maps and
institutional affiliations.
Open Access This article is licensed under a Creative Commons Attribution 4.0 International
License, which permits use, sharing, adaptation, distribution and reproduction in any medium or
format, as long as you give appropriate credit to the original author(s) and the source, provide a link to the
Creative Commons licence, and indicate if changes were made. The images or other third party material in this
article are included in the article’s Creative Commons licence, unless indicated otherwise in a credit line to the
material. If material is not included in the article’s Creative Commons licence and your intended use is not
permitted by statutory regulation or exceeds the permitted use, you will need to obtain permission directly from
the copyright holder. To view a copy of this licence, visit http://creativecommons.org/licenses/by/4.0/.
© The Author(s) 2021
Scientific Reports | (2021) 11:915 | https://doi.org/10.1038/s41598-020-79622-2 11
Vol.:(0123456789)You can also read