Hyperbaric oxygen suppressed tumor progression through the improvement of tumor hypoxia and induction of tumor apoptosis in A549 cell transferred ...
←
→
Page content transcription
If your browser does not render page correctly, please read the page content below
www.nature.com/scientificreports
OPEN Hyperbaric oxygen
suppressed tumor progression
through the improvement of tumor
hypoxia and induction of tumor
apoptosis in A549‑cell‑transferred
lung cancer
Shao‑Yuan Chen1,2,3*, Koichi Tsuneyama4, Mao‑Hsiung Yen5, Jiunn‑Tay Lee6,
Jiun‑Liang Chen7 & Shih‑Ming Huang8
Tumor cells have long been recognized as a relative contraindication to hyperbaric oxygen treatment
(HBOT) since HBOT might enhance progressive cancer growth. However, in an oxygen deficit
condition, tumor cells are more progressive and can be metastatic. HBOT increasing in oxygen
partial pressure may benefit tumor suppression. In this study, we investigated the effects of HBOT
on solid tumors, such as lung cancer. Non-small cell human lung carcinoma A549-cell-transferred
severe combined immunodeficiency mice (SCID) mice were selected as an in vivo model to detect
the potential mechanism of HBOT in lung tumors. HBOT not only improved tumor hypoxia but also
suppressed tumor growth in murine xenograft tumor models. Platelet endothelial cell adhesion
molecule (PECAM-1/CD31) was significantly increased after HBOT. Immunostaining of cleaved
caspase-3 was demonstrated and apoptotic tumor cells with nuclear debris were aggregated starting
on the 14th-day after HBOT. In vitro, HBOT suppressed the growth of A549 cells in a time-dependent
manner and immediately downregulated the expression of p53 protein after HBOT in A549 cells.
Furthermore, HBOT-reduced p53 protein could be rescued by a proteasome degradation inhibitor,
but not an autophagy inhibitor in A549 cells. Our results demonstrated that HBOT improved tissue
angiogenesis, tumor hypoxia and increased tumor apoptosis to lung cancer cells in murine xenograft
tumor models, through modifying the tumor hypoxic microenvironment. HBOT will merit further
cancer therapy as an adjuvant treatment for solid tumors, such as lung cancer.
Tumor hypoxia has been a concern for cancer therapy1,2. Hypoxia can increase tumor resistance to chemotherapy,
radiation and lead to malignant progression and even metastasis3,4. Hypoxia or some signaling alterations of the
hypoxic cascades could enhance the intact neovascularization, and facilitate tumor m etastasis5,6.
Hyperbaric Oxygen Treatment (HBOT) is a medical treatment using 100% oxygen administered at a greater
than usual atmospheric pressure. Since cellular and vascular proliferation is promoted by HBOT in an ischemic
wound7,8, practitioners of hyperbaric medicine are concerned about the effect of HBOT on cancer g rowth9.
However, more and more evidence suggests a neutral effect of HBOT on malignancy10–12. HBOT working as
an adjuvant to promote cellular and vascular proliferation might have the same effect in a tumor. However, the
1
Department of Hyperbaric Medicine and Neurology, Cardinal Tien Hospital, New Taipei City, Taiwan, ROC. 2School
of Medicine, Fu Jen Catholic University, New Taipei City, Taiwan, ROC. 3Graduate Institute of Aerospace and
Undersea Medicine, National Defense Medical Center, Taipei, Taiwan, ROC. 4Department of Molecular and
Environmental Pathology, The University of Tokushima, Tokushima, Japan. 5Department of Pharmacology,
National Defense Medical Center, Taipei, Taiwan, ROC. 6Department of Neurology, Tri‑Service General Hospital,
National Defense Medical Center, Taipei, Taiwan, ROC. 7Department of Traditional Chinese Medicine, Chang Gung
University, Taoyuan City, Taiwan, ROC. 8Department of Biochemistry, National Defense Medical Center, Taipei,
Taiwan, ROC. *email: 1sychen@yahoo.com.tw
Scientific Reports | (2021) 11:12033 | https://doi.org/10.1038/s41598-021-91454-2 1
Vol.:(0123456789)
www.nature.com/scientificreports/
nature physiology between tumor growth and wound healing differs by way of cancer growth, transformation
and metastases. Such differences will result in different impacts on HBOT. A significant difference pointed out by
Growther et al.13 suggested macrophages are the major healing factors in angiogenesis, while tumor macrophages
contributed as part as an angiogenesis factor in a tumor e nvironment14,15. The optimal oxygen tensions of 30 to
40 mmHg increased by HBOT can stimulate collagen synthesis and hydroxylation in wounds, but it does not
promote cell proliferation in cancer.
Our previous experiments demonstrated that exposure to HBO attenuated the severity of disease progression
in autoimmune NZB/W F1 mice16, proposing targeted apoptosis to hyper-proliferating lymphocytes. Moreo-
ver, hematopoietic origin cells have a lower threshold to oxidative stress induced by HBOT and HBO-induced
apoptosis of hematopoietic-derived cancer cells was through the intracellular accumulation of H2O2 and O2.- as
well as the involvement of phosphorylation of p38 MAPK17.
Lung cancer is responsible for more than one million deaths annually and is claimed to be the world’s most
popular cancer. The main types of lung cancer are small-cell lung cancer (SCLC), and non-small-cell lung cancer
(NSCLC). Several studies so far have provided direct beneficial shreds of evidence to show the effective combined
therapy with HBOT and chemotherapy for c ancer18–21. The reasons for the successfully combined therapy are
the good vascularization of hypoxic tumor cells after HBOT. Hypoxic tumor cells are much more progressive
and have the potentials to be metastatic. Moreover, tumor cells under hypoxic situations are more resistant to
chemotherapy. In several clinical studies, combined HBOT and chemotherapy demonstrated practical value of
increased survival rate and the side effects did not increase by combining HBOT with chemotherapy22–24.
Our study aimed to establish human lung carcinoma A549 tumor-transferred severe combined immunodefi-
ciency mice (SCID) mice to investigate the potential role of HBOT in cancer therapy. NSCLC A549-transferred
SCID mice were selected to detect the long-term beneficial effects of HBOT in cancer therapy without any
combined treatment in the manner of 2.5 ATA/90 min/day in 2 weeks after 45 days of tumor transfer. Tumor
hypoxia detected by Hypoxyprobe-1 was examined and the effect of HBOT on tumor growth was demonstrated
after 14 and 28 days of HBOT. Further, the direct effects of HBOT on cell base, including cell viability and related
protein expressions (such as p53 and HIF-1) were detected in A549 cells. Hence, this study will be the first experi-
ment to provide both in vivo and in vitro responses of tumor cells to HBOT and propose the underlined tumor
microenvironment for further solid cancer treatment.
Materials and methods
Cell culture. Human lung carcinoma A549 cell line and an immortalized human bronchial epithelial cell
line, Beas-2B, were purchased from the Food Industry Research and Development Institute (Hsinchu, Taiwan,
R.O.C.). The cells were cultured at 1 06 cells/ml in RPMI 1640 with 10% fetal calf serum, 2 mM L-glutamine,
1 mM sodium pyruvate, 4.5 g/l glucose, 10 mM HEPES, and 1.5 g/l sodium bicarbonate. Individual cultures were
maintained for no more than two months.
Mice. 50 C.B-17 SCID female mice were purchased from National Taiwan Medical Animal Center and main-
tained in a pathogen-free and, individually ventilated cage sat National Defense Medical Center- Laboratory
Animal Center (NDMCLAC), Taiwan. Routinely sterilized, rodent diets (Meika) were used to feed the mice.
The mice were used for the experiments at the ages of 6 to 8 week. All animal experiments were in accordance
with NDMCLAC guidelines of IACUC. The animal protocols were approved by the IACUC in Taiwan (IACUC-
101A01-002, IACUC-13–264). The study was carried out in compliance with the ARRIVE guidelines.
Injection of A549 tumors. Mice were anesthetized by intra-peritoneum (i.p.) injection of pentobarbital:
40 mg/kg body weight. The abdomen was sterilized with 2-isopropanol (70%). A549 cells were diluted to 6 × 10⁶
cells in a volume of 0.2 ml RPMI 1640 and transferred to each recipient at the neck site by subcutaneous injec-
tion. The diameter of tumor mass was monitored two times per week and only mice with tumor volume larger
than 500mm3 were selected for further experiments.
Hyperbaric oxygen treatment (HBOT). A549-tumor transferred SCID mice were either non-exposed
or exposed to HBO in a hyperbaric animal chamber (98% O2, 2% CO2 at 2.5 ATA; 0.5 ATA/min to a pressure
of 2.5 ATA) (Longshin Gas Ltd. Taipei, Taiwan, R.O.C.) for 90 min once a day over two weeks beginning on the
45th date after tumor injection. Cells in groups were exposed to HBOT (98% O2, 2% CO2 at 3.5 ATA) (Long-
shin Gas Ltd., Taipei, Taiwan, R.O.C.) in a hyperbaric chamber for 90 min. Control cultures for each experiment
were placed in an incubator at 37 ◦C, 21% O2, 5% CO2 at 1 ATA. This hyperbaric chamber was maintained at
a concentration of 95% oxygen, and CO2 was exhausted at a rate of 10–12 L/min. After reaching the end of the
treatment, the chamber was slowly decompressed at 0.5 ATA/min pressure.
Tumor volume. We measured tumor volume two times in a week and calculated the tumor size as length
(L) × width (W) × height (H).
Detection of tumor hypoxia. Hypoxyprobe-1 kit (Pimonidazole Hydrochloride) (Chemicon Interna-
tional) was used to measure tissue hypoxia in solid tumors. A dose of 60 mg/kg body weight of Hypoxyprobe-1
kit was injected intraperitoneally to A549-transferred SCID mice one hour before they were sacrificed. Tumor
mass was removed and embedded as OCT/liquid nitrogen cryostat section.
Scientific Reports | (2021) 11:12033 | https://doi.org/10.1038/s41598-021-91454-2 2
Vol:.(1234567890)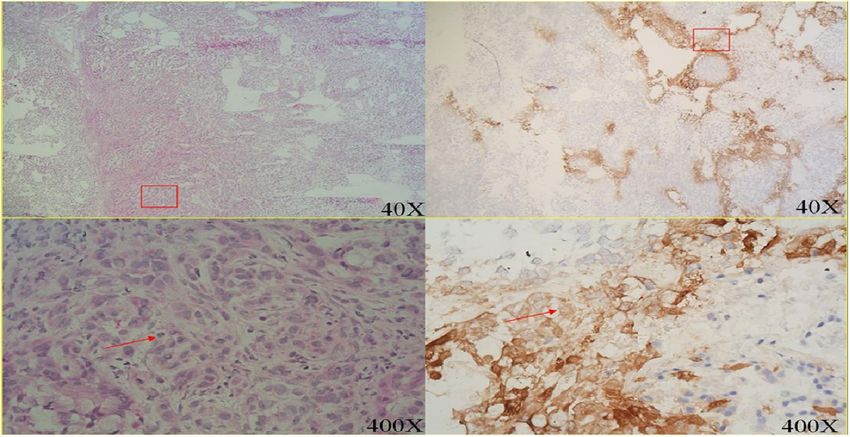
www.nature.com/scientificreports/
Tumor histopathology. Tumor cells were removed from mice for either frozen or paraffin sections. For
frozen sections, tissue cells were snap-frozen in dry ice-cold 2-methylbutane and embedded in TISSUE-TEC
(Miles, Elkhart, IN, U.S.A.). Freshly cut Sects. (5 μm) were mounted on clean glass slides coated with poly-
L-lysine (Sigma Chemical Co, U.S.A.). They were further rapidly air-dried and stored at − 80 °C until used
for immunohistochemical staining. The fixed sections were incubated with normal goat serum diluted 1:5 in
PBS for 15 min at room temperature to block nonspecific staining. Sections were incubated with primary anti-
bodies including goat anti-mouse CD31 antibody (BD Pharmingen, San Diego, CA, U.S.A.), rabbit anti-mouse
cleaved caspase-3 antibody (BD Pharmingen, San Diego, CA, U.S.A.) and rabbit anti mouse VEGF antibody (BD
Pharmingen, San Diego, CA, U.S.A.) in PBS for 1 h at room temperature in a moist chamber and then washed
with PBS for 5 min with gentle shaking. After washing in PBS, they were interacted with immunopolymer of
anti-goat or rabbit IgG antibodies (Histofine, Nichirei, Japan and Dako) as secondary antibodies and developed
with DAB chromogen (Vector) for 6 min. The slides were washed with Q water and incubated with hemotaxylin
for staining nucleus. The sections were immersed with 75%–95%–100% alcohol and xylene before covered with
a coverslip. The processing, embedding and sectioning of paraffin blocks were performed in Dr. Koichi Tsuney-
ama’s pathology laboratory and the paraffin sections were deparaffinized and re-hydrated before immunohis-
tochemical staining. To evaluate the immunostaining results objectively, whole slide scanning with computer
counting was performed. The slides were scanned with slide scanner (3DHISTECH, Budapest, Hungary) in
200X magnification. Computer counting software of CellQuant and PatternQuant were used (3DHISTECH,
Budapest, Hungary). Briefly, PatternQuant was trained for recognizing region of interests and following Cell-
Quant to evaluate the H-Score. H-score was defined by immuno intensity multiply by staining percentage (range
from 0 to 300). Immuno intensity was recorded as 0 for no staining, 1 for faint staining, 2 for moderate staining,
and 3 for intense staining. The staining percentage was recorded from 0 to 100%. Both immuno intensity and
staining percentage were automatically calculated by CellQuant which would only count on region of interests
recognized by PatternQuant.
Western blotting. Cell lysates were prepared in lysis buffer (100 mM Tris–HCl of pH 8.0, 150 mM NaCl,
0.1% SDS, and 1% Triton X-100) at 4 °C. The cell extracts were boiled and resolved on 10% SDS-PAGE gels. After
the protein was transferred to nitrocellulose membranes by electroblotting (Bio-Rad, Richmond, CA, U.S.A.),
the blots were blocked by overnight incubation with 5% nonfat dry milk in Tris/boric acid/sodium chloride/
Tween20 and subsequently probed with antibodies againstp53, ACTN, and Nrf-2 (Santa Cruz, U.S.A.), LC3B,
HIF-1α, PARP, Caspase-3, and p-p53 (Ser15) (Cell Signaling, U.S.A.), and γ-H2A.x (Abcam, U.K.). Immunore-
active proteins were visualized using horseradish peroxidase-linked secondary antibodies and further with ECL
(Enhanced-chemiluminescence western blotting kit) (Amersham Biosciences, Pittsburgh, PA, U.S.A).
Reverse transcription‑polymerase chain reaction (RT‑PCR). Total RNA was isolated using TRIzol
(Thermo Fisher Scientific, U.S.A.) reagent according to the manufacturer’s instructions. For 1st-strand cDNA
synthesis, 1 µg of total RNA was reverse transcribed using 200 U of M-MLV reverse transcriptase for 60 min
at 37 °C (Epicentre Biotechnologies, U.S.A.). Specific primers (for p53: Forward: 5′-CTCTGACTGTACCAC
CATCCACTA-3′; Reverse: 5′-GAGTTCCAAGGCCTCATTCAGCTC-3′; for GAPDH: Forward: 5′-CTT CAT
TGA CCT CAA CTA C-3′; Reverse: 5′-GCC ATC CAC AGT CTT CTG-3′), dNTP, and Taq DNA polymerase
were added for subsequent PCR reactions, which were processed using a Veriti Simpli Thermal Cycler (Applied
Biosystems, CA, U.S.A.).
Statistical analysis. Unpaired t-test, one-way ANOVA and Nonparametric Kruskal–Wallis test were used
to compare differences between means of groups and statistical analysis was performed using SPSS. One-Dscan
analysis software was used to analyze the expression contents of proteins in western blotting.
Ethical approval and consent to participate. All animal experiments were in accordance with NDM-
CLAC guidelines of IACUC. All animal protocols were approved by the IACUC in Taiwan (IACUC-101A01-002,
IACUC-13-264).
Results
HBOT suppressed tumor growth. On the observation that HBOT could decrease the proliferation rate
of A549 cells17, we established the A549 tumor transferred-SCID mice xenograft model for the potential use of
HBOT (2.5 ATA, 90 min) in cancer therapy. A549-tumor transferred SCID mice were either non-exposed or
exposed to HBO for 2.5 ATA 90 min 5 times in a week beginning on the 45th date after tumor injection and were
monitored for the tumor volume twice in a week. The tumor volume of human lung carcinoma A549 cells was
increased at a linear curve after 20 days of transfer for both control and HBO-treated mice (Fig. 1A). Only the
mice with tumor volume larger than 500mm3 were selected to HBOT. Our data showed that HBOT effectively
suppressed tumor growth after 14 days (**P < 0.01) and 28 days (**P < 0.01) of tumor transfer (Fig. 1A,B) com-
pared with control mice.
HBOT improved tumor hypoxia. Although tumor sections from A549-transferred SCID mice showed
the regular shapes after 45 days of tumor transfer by hematoxylin& eosin (H & E) staining, significant tumor
hypoxia was measured by Hypoxyprobe-1 probe (Fig. 2A). HBOT significantly improved tumor hypoxia after
14 days (*P < 0.05) and 28 days (*P < 0.05) of HBO therapy (Fig. 2B, Figure S3 and Table 1) by quantitative
analysis.
Scientific Reports | (2021) 11:12033 | https://doi.org/10.1038/s41598-021-91454-2 3
Vol.:(0123456789)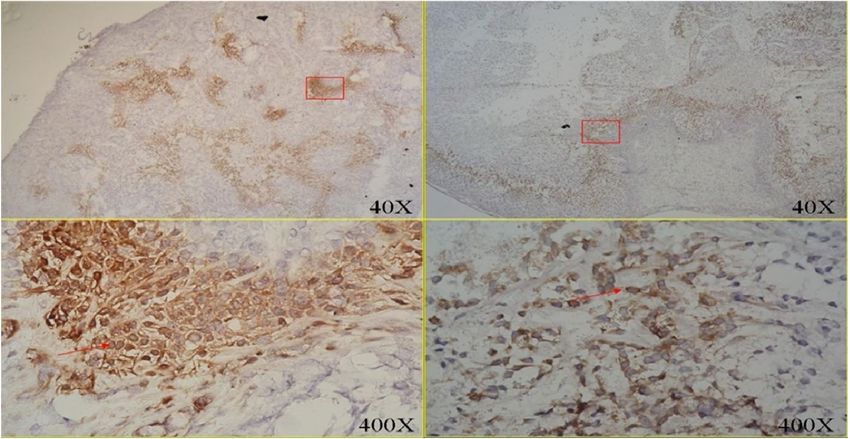
www.nature.com/scientificreports/
(A) The growth curve of A549 cells in SCID mice
End- HBO2
2500
28th date
Control End- HBO2
HBO2
14th date
2000
End- HBO2 **
Tumor volume (mm3)
0th date
1500
Start-HBO2
1000
500 HBO2 treatment
0
0 20 40 60 80
Date
**
(B)
3000
Tumor volume (mm3)
2500
2000
1500
1000
500
0
Control HBO C-0 O-0 C-14 O-14 C-28 O-28
Before HBO2 After HBO2 treatment
Figure 1. A549-tumor transferred SCID mice were either non-exposed or exposed to H BO2(98% O2, 2%
CO2 at 2.5 ATAfor2.5 ATA 90 min 5 times in a week beginning at the 45th date after tumor injection and
were monitored for the tumor volume twice in a week. Tumor volume was calculated as length (L) × width
(W) × height (H). (A) The growth curve of A549 cells in SCID mice. Only the mice with tumor volume larger
than 500mm3 were selected (B) The comparison of tumor volume among groups of mice before or after HBOT.
For each dot-point represents the tumor volume of one A549-tumor transferred SCID mice. HBOT effectively
suppressed tumor growth after 14 days (**P < 0.01) and 28 days (**P < 0.01) of tumor transfer. (C-0 represents
for control mice at the first date comparing with HBOT mice; O-0 represents for mice receiving the first date of
HBOT; C-14 days represents for control mice after 14 days comparing with HBOT mice; O-14 days represents
for mice after 14 days of HBOT; C-28 days represents for control mice after 28 days comparing with HBOT
mice; O-28 days represents for mice after 28 days of HBOT).
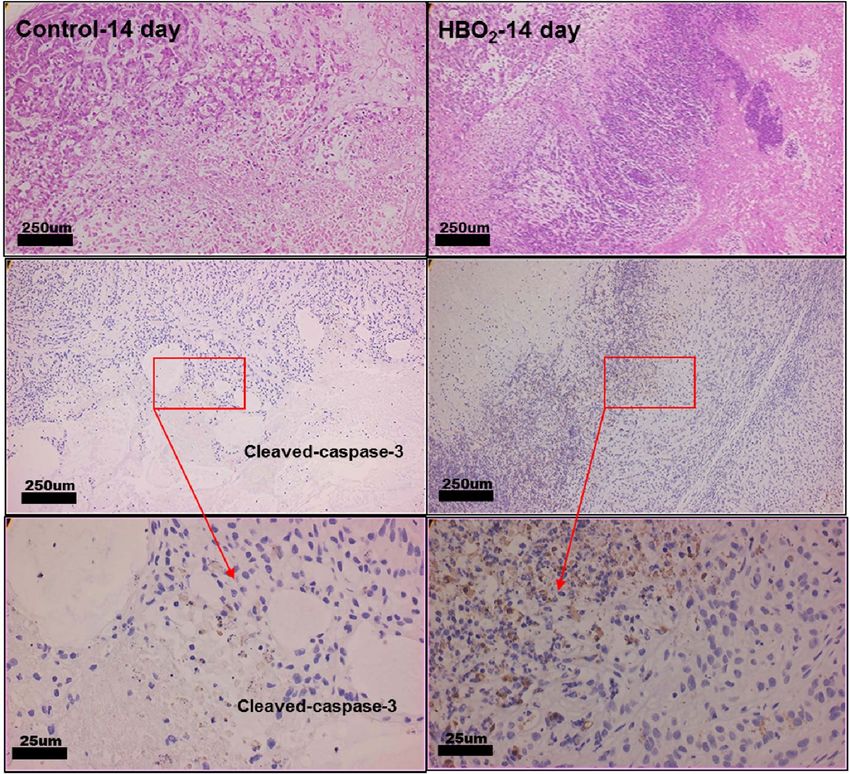
HBOT induced apoptosis in A549 tumor transferred SCID mice.. Histopathological findings of
tumor lesions were quite similar on the first day after HBO exposure between control and HBOT groups. The
necrotic field area is not observed on the first day after HBOT; however, the necrotic field was more prominent
on the 14th and 28th date after HBOT (Fig. 3D). Ghost-like shadow of cells was recognized in the necrotic field
as “coagulation necrosis”. Tumor sections of HBOT-14th and 28th date showed zonal inflammatory cells and
degenerated cells with nuclear debris were aggregated in the border of coagulation necrosis (Fig. 3A). Immu-
nostaining of cleaved-caspase-3 was demonstrated in HBO-treated mice after 14 days of HBOT (Fig. 3B,E) com-
pared with control mice (Fig. 3C,E).
CD31 was significantly increased after HBOT.. Platelet endothelial cell adhesion molecule (PECAM-1/
CD31), is a ligand for CD38 and plays a role in angiogenesis. CD31 is highly expressed in endothelial cells and
the expressions of vascular endothelial growth factor (VEGF) and CD31 have recently been implicated in tumor
angiogenesis. HBOT did not change the expression of VEGF but significantly increased the expression of CD31
after 14 days and 28 days of HBOT (*P < 0.05) (Fig. 4, Figure S3 and Table 1).
HBOT decreased p53 protein and increased HIF‑1α protein in A549 cells, not Beas‑2B
cells.. We examined the effects of HBOT on A549 cells compared with an immortalized human bronchial
epithelial cell line, Beas-2B, followed by the cell-based HBOT protocol (Fig. 5A). HBOT suppressed the growth
Scientific Reports | (2021) 11:12033 | https://doi.org/10.1038/s41598-021-91454-2 4
Vol:.(1234567890)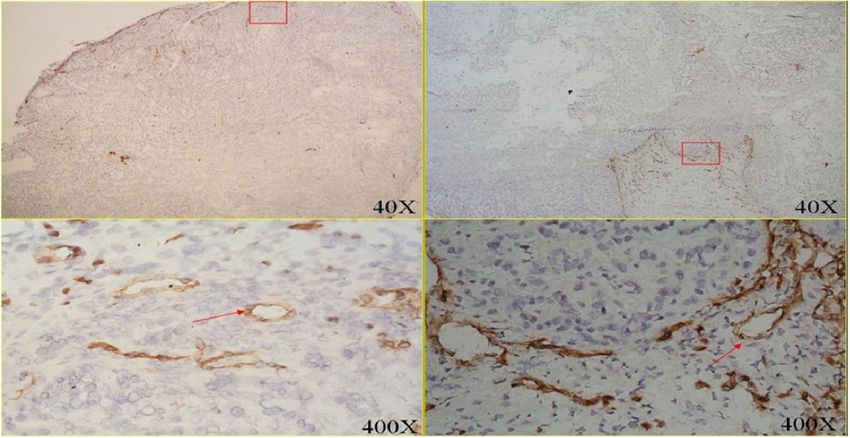
www.nature.com/scientificreports/
(A)
H&E Tumor hypoxia
250um 250um
25um 25um
Figure 2. Immunohistochemical staining of tumor sections from A549- transferred SCID mice. (A)
Haematoxylin & Eosin (H & E) staining and immunostaining of Hypoxyprobe-1 probe of A549 tumor
frozen sections after 45 days of tumor transfer. (H & E: H and E staining; tumor hypoxia: Immunostaining of
Hypoxyprobe-1 probe) (B) Comparisons of tumor hypoxia in groups of mice after 14 and 28 days of HBOT.
(Control-0: control mice at the first date comparing with HBOT mice; H BO2-0: mice receiving the first date of
HBOT; Control-14: control mice after 14 days comparing with HBOT mice; H BO2-14: mice after 14 days of
HBOT; Control-28: control mice after 28 days comparing with HBOT mice; H BO2-28: mice after 28 days of
HBOT).
Scientific Reports | (2021) 11:12033 | https://doi.org/10.1038/s41598-021-91454-2 5
Vol.:(0123456789)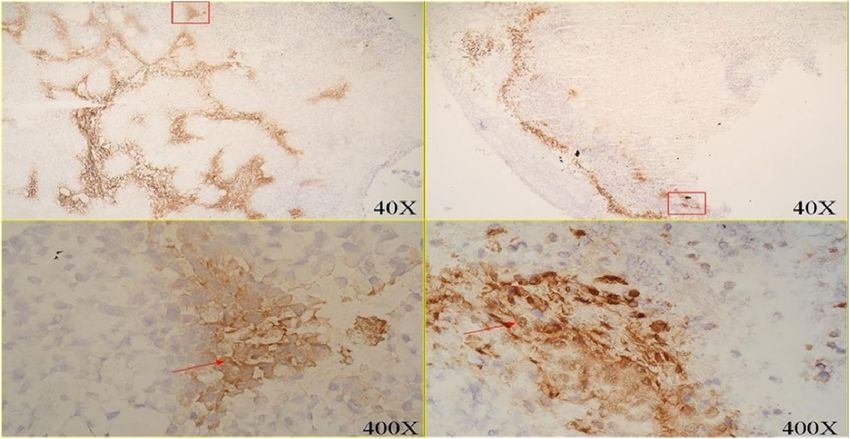
www.nature.com/scientificreports/

                                            (B)
                                                     Control-0 day                                     HBO2-0 day

                                                     250um                                            250um

                                                     25um                                               25um

                                                     Control-14 day                                    HBO2-14 day

                                                     250um                                            250um

                                                     25um                                               25um

                                                     Control-28 day                                    HBO2-28 day

                                                     250um                                             250um

                                                      25um                                              25um

                                            Figure 2.  (continued)

                                            of A549 cells, not Beas-2B cells, in a time-dependent manner as measured in Fig. 5B. From western blotting
                                            analysis, p53 proteins in A549 cells were first downregulated by HBOT and then rebounded to basal level after
                                            6 h of HBOT, but not Beas-2B cells (Fig. 5C). There is no significant difference in the expression of p53 mRNA

          Scientific Reports |   (2021) 11:12033 |              https://doi.org/10.1038/s41598-021-91454-2                                              6

Vol:.(1234567890)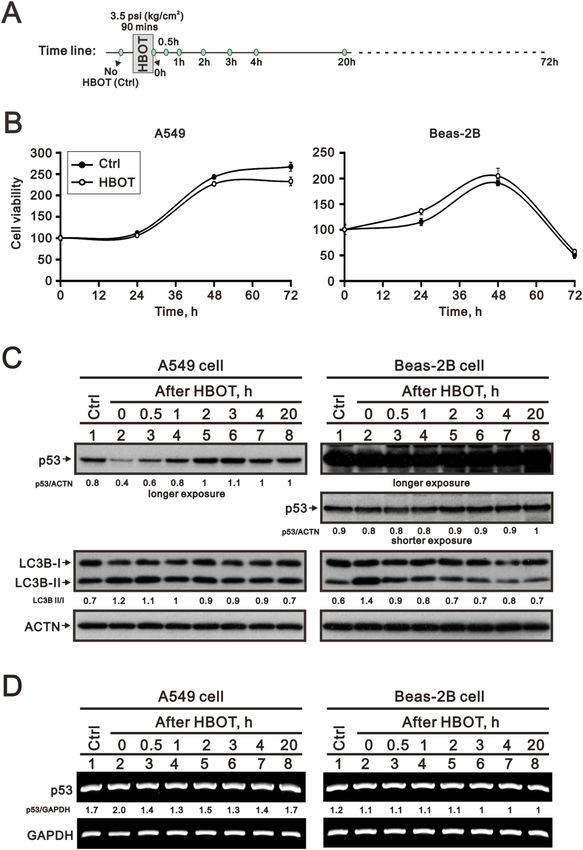
www.nature.com/scientificreports/
Control-14 (N = 10) HBO2-14 (N = 10) Control-28 (N = 10) HBO2-28 (N = 10)
Tumor hypoxia (mean ± SD) 3.40 ± 0.55 *1.25 ± 0.96 3.20 ± 0.37 *2.00 ± 0.01
CD31 (mean ± SD) 2.20 ± 0.45 *3.25 ± 0.50 2.00 ± 0.32 *2.25 ± 0.48
VEGF (mean ± SD) 1.40 ± 0.55 1.25 ± 0.50 1.20 ± 0.20 1.25 ± 0.25
0% No staining 0
Nuclear staining in less than 1%
0–1% 1
of cells
1. Cell staining
1–10% In 1–10% of cells 2
10–50% In 10–50% of cells 3
> 50% Greater than 50% 4
2. Nonparametric Kruskal–Wal-
lis test
3. *P < 0.05, compared with Con-
trol group
Table 1. Semi-quantitative expressions of tumor hypoxia, CD31 and VEGF in groups of mice after 14 and
28 days of HBOT.
(A)
HBO2-14 day
Degenerated cells
with nuclear debris
Coagulation
Apoptotic cells with
necrosis
250um 25um degenerated nuclei
Figure 3. Immunohistochemistry staining of tumor sections from A549- transferred SCID mice. (A) Tumor
paraffin sections of HBO2-14th date showed zonal inflammatory cells and degenerated cells aggregation in the
border of coagulation necrosis. Immunostaining of cleaved-caspase-3 after 14 days of HBOT in H BO2 group (B)
and control group (C). Note that, in HBOT group, many cleaved-caspase-3 positive apoptotic cells were located
in the border between coagulation necrosis and viable tumor cells. Comparative analysis of necrotic field (D)
and cleaved-caspase-3 (E) was quantified from groups of mice. Statistical significance (*P < 0.05, compared with
control group) was observed in HBOT group. H-score was defined by immuno intensity multiply by staining
percentage (range from 0 to 300). Computer counting software of CellQuant and PatternQuant were used
(3DHISTECH, Budapest, Hungary) for quantitation.
Scientific Reports | (2021) 11:12033 | https://doi.org/10.1038/s41598-021-91454-2 7
Vol.:(0123456789)www.nature.com/scientificreports/
(B) (C)
Cleaved-caspase-3
Cleaved-caspase-3
(D) (E)
Necroc field cleaved-Caspase-3
50 100
* 90
40 80
*
Pixels (1 x 10*5)
70
H-Score
30 60
50
20
40
10 30
20
0 10
Control-14 HBO-14 Control-14 HBO-14
Figure 3. (continued)
after HBOT between A549 and Beas-2B cells (Fig. 5D).The LC3BII/I ratio was increased by the HBOT and then
declined to basal level after HBOT in Beas-2B cells (Fig. 5C, Figure S1).
A proteasome degradation inhibitor could rescue HBOT‑reduced p53 protein, but not an
autophagy inhibitor in A549 cells. The downregulation of p53 protein of A549 cells upon HBOT was
consistent at a continuous 3-day exposure; p53 protein was immediately downregulated at the first moment of
HBOT exposure and back to normal after 20 h exposure (Fig. 6). Hypoxia-inducible factor 1 alpha (HIF-1α)
protein expression was significantly decreased by HBOT after exposure at the first interval and rebounded to
basal level both in A549 and Beas-2B cells (Fig. 6); however, the apoptotic biomarkers of cleaved PARP and cas-
pase 3 remained unchanged in both A549 and Beas-2B cells (Fig. 6, Figure S1). With the cytosolic and nuclear
fractions, we found that the effect of HBOT on p53 proteins occurred in the cytosol and nucleus of A549 cells
(data not shown). We tested whether a proteasome degradation inhibitor, MG132 or the autophagy inhibitor
3-methyladenine (3-MA), could rescue the effect of HBOT on p53 and HIF-1α proteins. Our data showed that
Scientific Reports | (2021) 11:12033 | https://doi.org/10.1038/s41598-021-91454-2 8
Vol:.(1234567890)www.nature.com/scientificreports/
Control-0 day HBO2-0 day
250um 250um
25um 25um
Control-14 day HBO2-14 day
250um 250um
25um 25um
Control-28 day HBO2-28 day
250um 250um
25um 25um
Figure 4. Comparative analysis of immunohistochemical CD31 antigen expressions from groups of mice.
Significantly increase of CD31 was observed after 14 days and 28 days of HBOT exposure.
Scientific Reports | (2021) 11:12033 | https://doi.org/10.1038/s41598-021-91454-2 9
Vol.:(0123456789)www.nature.com/scientificreports/
Figure 5. The HBOT protocol and its transient effect on A549 and Beas-2 cell lines. (A) The HBOT protocol
was applied in A549 and Beas-2 cell lines. (B) The cell viability profiles were analyzed in A549 and Beas-2 cell
lines. (C,D) The HBOT A549 and Beas-2 cells were treated with indicated conditions and then cell lysates
were subject to the (C) Western analysis for antibodies against p53, LC3B, and control protein ACTN and
(D) RT-PCR analysis for p53 mRNA and control GAPDH mRNA. The results were representative of two
independent experiments. Quantitative analysis of the western blot was listed under each strip.
Scientific Reports | (2021) 11:12033 | https://doi.org/10.1038/s41598-021-91454-2 10
Vol:.(1234567890)www.nature.com/scientificreports/
Figure 6. The HBOT effect on stress proteins on A549 and Beas-2 cell lines. The A549 and Beas-2 cells were
treated with HBOT at 3.5 ATA for 90 min and then lysates were subject to the Western analysis for antibodies
against p53, LC3B, HIF-1α, PARP, Caspase 3, and control protein ACTN. The results are representative of two
independent experiments. Quantitative analysis of the western blot was listed under each strip.
MG132 could rescue p53 and HIF-1α proteins in A549-HBOT cells (Fig. 7). The effect of MG132 on HIF-1α
protein was dependent on cell-context and HBOT. In A549 cells, MG132 stabilized basal HIF-1α protein and
further enhanced HIF-1α protein in A549-HBOT cells. However, the HIF-1α protein in MG132-treated Beas-2
cells was still decreased under HBOT condition. 3-MA could suppress the induction of autophagy by HBOT in
Beas-2B cells, suggesting that the autophagy did not affect p53 protein stability in A549 cells by HBOT (Fig. 7).
Discussion
The clinical application of HBOT to cancer treatment has been debated for decades19. Malignancy had been con-
sidered the contraindication of HBOT since oxygen at raised pressure might enhance tumor growth25. However,
more and more studies demonstrated that a combination of HBOT might decrease tumor resistance to chemo-
therapy and radiotherapy1,10,12. Reevaluating the direct effect of HBOT in solid cancer could help us understand
the potential role of HBOT in cancer treatment. In this study, HBO was used to treat mice transferred with A549
human lung carcinoma in the manner of 2.5 ATA/90 min daily for 2 weeks after 45 days of tumor establishment.
HBOT in a cycle of 14 and 28 days both showed significant improvement for tumor hypoxia environment and
suppressed tumor growth compared with control mice. Interestingly, tumor vascularity detected by the expres-
sions of CD31 was significantly increased after 14 and 28 days of HBOT; however, VEGF expression did not
change as measured in semi-quantitative I.H.C. staining analysis. This finding indicated that the improvement
of cancer hypoxia and cancer vascularity by HBOT did not promote cancer growth. For tumor angiogenesis, the
new blood vessels are formed when the basement membrane of existing blood vessels is broken and while the
vascular basement membrane has been breached, endothelial cells will be divided to form vessels and start to
grow. VEGF appears to be the first to induce endothelial cell mitosis in tumor a ngiogenesis26,27. In contrast, CD31,
which is a mitogenic factor in wound healing, reacts more sensitive to oxygen t ension23,28. HBOT significantly
increased the expression of CD31 after 14 days of HBOT. Meanwhile, the volume of A549 tumor cells was not
Scientific Reports | (2021) 11:12033 | https://doi.org/10.1038/s41598-021-91454-2 11
Vol.:(0123456789)www.nature.com/scientificreports/
Figure 7. The reduced p53 protein level by HBOT was modulated through a ubiquitin-dependent proteasome
degradation in A549 cells. The HBOT A549 and Beas-2 cell were treated with 3.5 ATA for 90 min in the
presence of 5 mM MG132 (a proteasome degradation inhibitor) or 2 mM 3-MA(an autophagy inhibitor) for 4 h.
These cell lysates were subject to the Western analysis for antibodies against p53, LC3B, HIF-1α, γH2A.x, Nrf2,
PARP, and control protein ACTN. The results are representative of two independent experiments. Quantitative
analysis of the western blot was listed under each strip.
growing as increasing expressions of CD31. To evaluate the direct effect of HBOT in A549 cells, the decrease
of p53 and HIF-1α proteins was involved in the ubiquitin-dependent proteasome degradation pathway via the
proteasome degradation inhibitor MG132 in A549 cells. The extra effect of MG132 on p53 and HIF-1α proteins
were observed by HBOT in A549 cells. In a normal lung epithelial cell line, we also observed the decrease of
HIF-1α protein with the HBOT, even in the presence of MG132. The involvement of autophagy was verified via
the increasing LC3BII/I ratio and its specific inhibitor, 3-MA, in Beas-2 cells, but not in A549 cells. Our find-
ings suggest that HBOT induced tumor suppression in A549-tumor transferred SCID mice might be through
modification of tumor microenvironment rather than induction of autophagy in tumor cells themselves.
Malignant tumors have been recognized as a relative contraindication to H
BOT. It was concerned that HBOT
might have cancer growth-enhancing effects. Our findings indicated that the improvement of tumor hypoxia
and tumor vascularity by HBOT did not promote tumor growth but inhibit tumor development, which provided
Scientific Reports | (2021) 11:12033 | https://doi.org/10.1038/s41598-021-91454-2 12
Vol:.(1234567890)www.nature.com/scientificreports/
evidence for the potential use of HBOT on tumor malignancy. Although the mechanism of HBOT on tumor
suppression is not clear, our experiments argue that HBOT results in tumor apoptosis. Moreover, HBOT can
increase the formation of reactive oxygen species (ROS) and induce apoptosis of tumor cells29,30. In our previous
experiments, primary cells and transformed tumor cell lines were treated with either 2.5 ATA or 3.5ATA of 100%
oxygen for 6 h, and a significant percentage of apoptosis was compared. HBO-induced apoptosis of cancer cells
was through the intracellular accumulation of H 2.- as well as the involvement of phosphorylation of
2O2 and O
17
p38 MAPK . In the present study, non-hematopoietic A549-transferred SCID mice were treated with HBO2.5
ATA/90 min daily for 2 weeks and immunoassaying of cleaved-caspase-3 was demonstrated after 14 and 28 days
of HBOT compared with control mice. However, apoptotic biomarkers have no significant difference, including
cleaved PARP and caspase 3, directly in A549 cells after HBOT. Our current study is consistent with our previ-
ous reports that different origins of different cancer cells result in different threshold to HBOT-induced cancer
apoptosis. The possible proposal of tumor suppression in HBOT treated murine xenograft model is that HBOT
may provide better tissue vascluogenesis rather than angiogenesis to recruit more inflammatory cells in tumor
microenvironment. However, the detailed working mechanisms, such as the vessel length density and detection of
markers of endothelial precursor cells, or angioblasts for vascluogenesis, should be addressed in the future studies.
Lung cancers usually start in the cells lining the bronchi, bronchioles or alveoli. Lung cancer development
involves multiple genetic abnormalities leading to malignant transformation of the bronchial epithelial cells, fol-
lowed by invasion and m etastasis31. One of the most common changes is mutations of the p53 tumor suppressor
32–35
gene . It was found in 45%–70% of adenocarcinomas and 60%–80% of squamous-cell carcinoma. The frequent
loss of heterozygosity (LOH) of p53 on chromosome 17p13 suggests p53 is likely involved in the pathogenesis
of NSCLC36,37. p53 functions as a crucial normal genome protector, located in the cytoplasm and translocates to
the nucleus upon cellular stress. Wild type p53 translocates to the mitochondrial surface and directly binds to
Bcl-2 family proteins, leading to apoptosis. Furthermore, wild type p53 induces senescence in neighboring tumor
cells, inhibits angiogenesis, polarizes macrophages to the anti-tumor M1 phenotype, and activates NK and T cells
to trigger immune c learance38,39. Herein, our study demonstrated that HBOT immediately downregulated the
endogenous p53 protein, and rebounded to the basal level after 20 h of treatment; which could provide the help
to improve tumor vascularity, but could not directly cause further apoptosis and cell cycle arrest in the cell base
analysis. We are the first to examine the effect of HBOT on wild type p53 in A549 cells. However, the detailed
regulatory network of HBOT will be addressed in future studies.
Other interesting findings were the levels of CD31 and VEGF expressions upon HBOT. There was no signifi-
cant change of VEGF expressions after HBOT supporting our hypothesis that HBOT could not further accelerate
tumor angiogenesis and lead to tumor metastasis. By contrast, CD31, Platelet endothelial cell adhesion molecule
(PECAM-1) was significantly upregulated after HBOT; which might further recruit more immune cells to the
microenvironment for immune c learance40,41. Furthermore, a combination of HBOT and either chemotherapy or
radiotherapy may provide better treatment in cancer therapy. In addition to p53 protein, HBOT could decrease
the HIF-1α protein in A549 and Beas-2 cells, which supported the hypothesis that HBOT could ameliorate the
hypoxic condition in cancer cells42,43. Combined with our in vivo and in vitro findings suggest that tumor micro-
environment interacting with tumor cells is significantly impacted after HBOT in lung cancer.
Conclusions
Our results demonstrated that HBOT could improve tumor vascularity, tumor hypoxia and potentially target
apoptosis-related genes leading to tumor suppression in A549-transferred SCID mice. Our present work may
provide direct beneficial evidence for HBOT in the tumor xenograft mouse model and lighten a hope to other
solid tumor cancer therapy in the future.
Received: 29 December 2020; Accepted: 27 May 2021
References
1. Moen, I. & Stuhr, L. E. B. Hyperbaric oxygen therapy and cancer—a review. Target Oncol. 7(4), 233–242 (2012).
2. Jing, X. et al. Role of hypoxia in cancer therapy by regulating the tumor microenvironment. Mol. Cancer 18(1), 157 (2019).
3. Wu, T. & Dai, Y. Tumor microenvironment and therapeutic response. Cancer Lett. 387, 61 (2017).
4. Kizaka-Kondoh, S., Inoue, M., Harada, H. & Hiraoka, M. Tumor hypoxia: a target for selective cancer therapy. Cancer Sci. 94(12),
1021–1028 (2003).
5. Carmeliet, P. et al. Role of HIF-1alpha in hypoxia-mediated apoptosis, cell proliferation and tumour angiogenesis. Nature
394(6692), 485–490 (1998).
6. Moulder, J. E. & Rockwell, S. Tumor hypoxia: its impact on cancer therapy. Cancer Metastasis Rev. 5(4), 313–341 (1987).
7. Mizuguchi, T. et al. Hyperbaric oxygen stimulates cell proliferation and normalizes multidrug resistance protein-2 protein localiza-
tion in primary rat hepatocytes. Wound Repair Regen. 13(6), 551–557 (2005).
8. Kang, T. S., Gorti, G. K., Quan, S. Y., Ho, M. & Koch, R. J. Effect of hyperbaric oxygen on the growth factor profile of fibroblasts.
Arch. Facial. Plast. Surg. 6(1), 31–35 (2004).
9. Feldmeier, J., Carl, U., Hartmann, K. & Sminia, P. Hyperbaric oxygen: does it promote malignancy growth or recurrence?. Undersea
Hyperb. Med. 30(1), 1–18 (2003).
10. Ashamalla, H. L., Thom, S. R. & Goldwein, J. W. Hyperbaric oxygen therapy for the treatment of radiation-induced sequelae in
children. The University of Pennsylvania experience. Cancer 77(11), 2407–2412 (1996).
11. Stępień, K., Ostrowski, R. P. & Matyja, E. Hyperbaric oxygen as an adjunctive therapy in treatment of malignancies, including
brain tumours. Med. Oncol. 33(9), 101 (2016).
12. Graham, K. & Unger, E. Overcoming tumor hypoxia as a barrier to radiotherapy, chemotherapy and immunotherapy in cancer-
treatment. Int. J. Nanomed. 13, 6049–6058 (2018).
Scientific Reports | (2021) 11:12033 | https://doi.org/10.1038/s41598-021-91454-2 13
Vol.:(0123456789)www.nature.com/scientificreports/
13. Crowther, M., Brown, N. J., Bishop, E. T. & Lewis, C. E. Microenvironmental influence on macrophage regulation of angiogenesis
in wounds and malignant tumors. J. Leukoc Biol. 70(4), 478–490 (2001).
14. Liu, S. et al. “Cross-talk” between Schwannian stroma and neuroblasts promotes neuroblastoma tumor differentiation and inhibits
angiogenesis. Cancer Lett. 228(1–2), 125–131 (2005).
15. Quail, D. F. & Joyce, J. A. Microenvironmental regulation of tumor progression and metastasis. Nat. Med. 19(11), 1423–1437
(2013).
16. Chen, S. Y. et al. Early hyperbaric oxygen therapy attenuates disease severity in lupus-prone autoimmune (N.Z.B. x N.Z.W.) F1
mice. Clin. Immunol. 108(2), 103–110 (2003).
17. Chen, Y. C. et al. Apoptosis of T-leukemia and B-myeloma cancer cells induced by hyperbaric oxygen increased phosphorylation
of p38 MAPK. Leuk Res. 31(6), 805–815 (2007).
18. Stuhr, L. E., Iversen, V. V., Straume, O., Maehle, B. O. & Reed, R. K. Hyperbaric oxygen alone or combined with 5-FU attenuates
growth of DMBA-induced rat mammary tumors. Cancer Lett. 210(1), 35–40 (2004).
19. Petre, P. M., Baciewicz, F. A. Jr., Tigan, S. & Spears, J. R. Hyperbaric oxygen as a chemotherapy adjuvant in the treatment of meta-
static lung tumors in a rat model [discussion]. J. Thorac. Cardiovasc. Surg. 125(1), 85–95 (2003).
20. Al-Waili, N. S. et al. Hyperbaric oxygen and malignancies: a potential role in radiotherapy, chemotherapy, tumor surgery and
phototherapy. Med. Sci. Monit. 11(9), RA279-289 (2005).
21. Chong, V. & Rice, M. The effectiveness of hyperbaric oxygen therapy (HBOT) in radiation-induced haemorrhagic cystitis. N. Z.
Med. J. 129(1446), 79–83 (2016).
22. Ohguri, T. et al. Systemic chemotherapy using paclitaxel and carboplatin plus regional hyperthermia and hyperbaric oxygen treat-
ment for non-small cell lung cancer with multiple pulmonary metastases: preliminary results. Int. J. Hyperthermia. 25(2), 160–167
(2009).
23. Ohguri, T. et al. Efficacy of hyperbaric oxygen therapy combined with mild hyperthermia for improving the anti-tumour effects
of carboplatin. Int. J. Hyperthermia 31(6), 643–648 (2015).
24. Bennett, M., Feldmeier, J., Smee, R. & Milross, C. Hyperbaric oxygenation for tumour sensitisation to radiotherapy: a systematic
review of randomised controlled trials. Cancer Treat. Rev. 34(7), 577–591 (2008).
25. Gawdi, R., Cooper, J. S. Hyperbaric Contraindications - StatPearls - NCBI Bookshelf (2020).
26. Ferrara, N., Gerber, H. P. & LeCouter, J. The biology of VEGF and its receptors. Nat. Med. 9(6), 669–676 (2003).
27. Rak, J. et al. Oncogenes and tumor angiogenesis: differential modes of vascular endothelial growth factor up-regulation in ras-
transformed epithelial cells and fibroblasts. Cancer Res. 60(2), 490–498 (2000).
28. DeLisser, H. M. et al. Involvement of endothelial PECAM-1/CD31 in angiogenesis. Am. J. Pathol. 151(3), 671–677 (1997).
29. Matsunami, T. et al. Enhancement of reactiveoxygenspecies and induction of apoptosisin streptozotocin-induced diabetic rats
under hyperbaricoxygenexposure. Int. J. Clin. Exp. Pathol. 4(3), 255–266 (2011).
30. Weidinger, A. & Kozlov, A. V. Biological activities of reactive oxygen and nitrogen species: oxidative stress versus signal transduc-
tion. Biomolecules 5, 472–484 (2015).
31. Zito Marino, F. et al. Molecular heterogeneity in lung cancer: from mechanisms of origin to clinical implications. Int. J. Med. Sci.
16(7), 981–989 (2019).
32. Brambilla, E. et al. p53 mutant immunophenotype and deregulation of p53 transcription pathway (Bcl2, Bax, and Waf1) in precur-
sor bronchial lesions of lung cancer. Clin. Cancer Res. 4, 1609–1618 (1998).
33. Hirano, T., Franzen, B., Kato, H., Ebihara, Y. & Auer, G. Genesis of squamous cell lung carcinoma. Sequential changes of prolifera-
tion, DNA ploidy, and p53 expression. Am. J. Pathol. 144, 296–302 (1994).
34. Li, Z. H., Zheng, J., Weiss, L. M. & Shibata, D. c-k-ras and p53 mutations occur very early in adenocarcinoma of the lung. Am. J.
Pathol. 144, 303–309 (1994).
35. Xu, Y. et al. Mutated p53 promotes the symmetric self-renewal of cisplatin-resistant lung cancer stem-like cells and inhibits the
recruitment of macrophages. J. Immunol. Res. 2019(7478538), 1–9, https://doi.org/10.1155/2019/7478538 (2019).
36. Hao, Q. & Cho, W. C. Battle against cancer: an everlasting saga of p53. Int. J. Mol. Sci. 15(12), 22109–22127 (2014).
37. Liu, G. et al. Role of autophagy and apoptosis in non-small-cell lung cancer. Int. J. Mol. Sci. 18(2), 367 (2017).
38. Xu, J. et al. Differential radiation sensitivity in p53wild-type and p53-deficient tumor cells associated with senescencebut not
apoptosis or (nonprotective) autophagy. Radiat. Res. 190(5), 538–557 (2018).
39. Vilgelm, A. E. et al. Mdm2 and aurora kinase a inhibitors synergize to block melanoma growth by driving apoptosis and immune-
clearanceof tumor cells. Cancer Res. 75(1), 181–193 (2015).
40. Woodfin, A., Voisin, M. B. & Nourshargh, S. PECAM-1: a multi-functional molecule in inflammation and vascular biology. Arte-
rioscler Thromb Vasc. Biol. 27(12), 2514–2523 (2007).
41. Cheung, K. et al. CD31 signals confer an immune privilege to the vascular endothelium. Proc Natl Acad Sci USA 112(43), E5815–
E5824 (2015).
42. Anguiano-Hernandez, Y. M. et al. Modification of HIF-1α, NF-aκB, IGFBP-3, VEGF and adiponectin in diabetic foot ulcers treated
with hyperbaricoxygen. Undersea Hyperb Med. 46(1), 35–44 (2019).
43. Sunkari, V. G. et al. Hyperbaric oxygen therapy activates hypoxia-induciblefactor1(HIF-1), which contributes to improved wound
healing in diabetic mice. Wound Repair. Regen. 23(1), 98–103 (2015).
Author contributions
S.Y.C., M.H.Y. and S.M.H. designed the research. KT. and S.M.H. supported the experiments. J.T.L. and J.L.C.
collected and analyzed the data. All authors interpreted the results and approved the manuscript.
Funding
This study was supported in part by a grant-in-aid from the National Science Council (NSC 93–2314-B-016–026),
Tri-Service General Hospital (TSGH) Foundation (TSGH-C94-46), Cardinal Tien Hospital (CTH-106A-1-2A01,
CTH-106A-2C02, CTH108A-2A03), and Grant CH-NDMC-108–02 from Cheng Hsin General Hospital.
Competing interests
The authors declare no competing interests.
Additional information
Supplementary Information The online version contains supplementary material available at https://doi.org/
10.1038/s41598-021-91454-2.
Correspondence and requests for materials should be addressed to S.-Y.C.
Reprints and permissions information is available at www.nature.com/reprints.
Scientific Reports | (2021) 11:12033 | https://doi.org/10.1038/s41598-021-91454-2 14
Vol:.(1234567890)www.nature.com/scientificreports/
Publisher’s note Springer Nature remains neutral with regard to jurisdictional claims in published maps and
institutional affiliations.
Open Access This article is licensed under a Creative Commons Attribution 4.0 International
License, which permits use, sharing, adaptation, distribution and reproduction in any medium or
format, as long as you give appropriate credit to the original author(s) and the source, provide a link to the
Creative Commons licence, and indicate if changes were made. The images or other third party material in this
article are included in the article’s Creative Commons licence, unless indicated otherwise in a credit line to the
material. If material is not included in the article’s Creative Commons licence and your intended use is not
permitted by statutory regulation or exceeds the permitted use, you will need to obtain permission directly from
the copyright holder. To view a copy of this licence, visit http://creativecommons.org/licenses/by/4.0/.
© The Author(s) 2021
Scientific Reports | (2021) 11:12033 | https://doi.org/10.1038/s41598-021-91454-2 15
Vol.:(0123456789)You can also read