Prostate-specific antigen dynamics predict individual responses to intermittent androgen deprivation - Nature
←
→
Page content transcription
If your browser does not render page correctly, please read the page content below
ARTICLE
                  https://doi.org/10.1038/s41467-020-15424-4                 OPEN

                  Prostate-specific antigen dynamics predict
                  individual responses to intermittent androgen
                  deprivation
                  Renee Brady-Nicholls 1, John D. Nagy2,3, Travis A. Gerke4, Tian Zhang5, Andrew Z. Wang                                            6,

                  Jingsong Zhang7, Robert A. Gatenby8 ✉ & Heiko Enderling 1 ✉
1234567890():,;

                  Intermittent androgen deprivation therapy (IADT) is an attractive treatment for biochemically
                  recurrent prostate cancer (PCa), whereby cycling treatment on and off can reduce cumulative
                  dose and limit toxicities. We simulate prostate-specific antigen (PSA) dynamics, with
                  enrichment of PCa stem-like cell (PCaSC) during treatment as a plausible mechanism of
                  resistance evolution. Simulated PCaSC proliferation patterns correlate with longitudinal
                  serum PSA measurements in 70 PCa patients. Learning dynamics from each treatment cycle
                  in a leave-one-out study, model simulations predict patient-specific evolution of resistance
                  with an overall accuracy of 89% (sensitivity = 73%, specificity = 91%). Previous studies have
                  shown a benefit of concurrent therapies with ADT in both low- and high-volume metastatic
                  hormone-sensitive PCa. Model simulations based on response dynamics from the first IADT
                  cycle identify patients who would benefit from concurrent docetaxel, demonstrating the
                  feasibility and potential value of adaptive clinical trials guided by patient-specific mathema-
                  tical models of intratumoral evolutionary dynamics.

                  1 Department  of Integrated Mathematical Oncology, H. Lee Moffitt Cancer Center and Research Institute, 12902 USF Magnolia Drive, Tampa, FL 33612, USA.
                  2 Department  of Life Sciences, Scottsdale Community College, 9000 E. Chaparral Rd., Scottsdale, AZ 85256, USA. 3 School of Mathematical and Statistical
                  Sciences, Arizona State University, 900 S Palm Walk, Tempe, AZ 85281, USA. 4 Department of Cancer Epidemiology, H. Lee Moffitt Cancer Center and
                  Research Institute, 12902 USF Magnolia Drive, Tampa, FL 33612, USA. 5 Division of Medical Oncology, Department of Medicine, Duke Cancer Institute, 20
                  Duke Medicine Cir, Durham, NC 27710, USA. 6 Department of Radiation Oncology, University of North Carolina at Chapel Hill, Chapel Hill, NC 27599, USA.
                  7 Department of Genitourinary Oncology, H. Lee Moffitt Cancer Center and Research Institute, 12902 Magnolia Drive, Tampa, FL 33612, USA. 8 Department

                  of Radiology, H. Lee Moffitt Cancer Center and Research Institute, 12902 Magnolia Drive, Tampa, FL 33612, USA. ✉email: Robert.gatenby@moffitt.org;
                  heiko.enderling@moffitt.org

                  NATURE COMMUNICATIONS | (2020)11:1750 | https://doi.org/10.1038/s41467-020-15424-4 | www.nature.com/naturecommunications                              1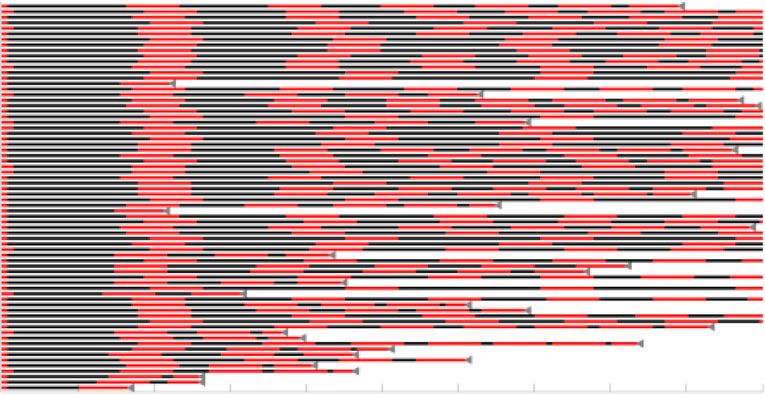
ARTICLE                                                                 NATURE COMMUNICATIONS | https://doi.org/10.1038/s41467-020-15424-4

P
       rostate cancer (PCa) is the most common type of cancer in             cell lines, which can be reverted by the addition of functional AR.
       American men and the second leading cause of cancer                   Combined, these results suggest evolution of or selection for pre-
       mortality1. Following surgery or radiation, the standard              existing androgen-independent PCaSCs as a plausible explanation
treatment for hormone-sensitive PCa is continuous androgen                   of the development of ADT resistance.
deprivation therapy (ADT) at the maximum tolerable dose                         The purpose of this study is to evaluate individual PSA
(MTD) with or without continuous abiraterone acetate (AA) until              dynamics in early IADT treatment cycles as a predictive marker
the tumor becomes castration resistant2. Importantly, advanced               of response or resistance in subsequent treatment cycles. We
PCa is not curable because PCa routinely evolves resistance to all           hypothesize that patient-specific PCaSC division patterns
current treatment modalities. Continuous treatment approaches                underlie the measurable longitudinal PSA dynamics, and that a
fail to consider the evolutionary dynamics of treatment response             mathematical model of PCaSCs can be trained to predict treat-
where competition, adaptation, and selection between treatment               ment responses on a per-patient basis. Here, we present an
sensitive and resistant cells contribute to therapy failure3. In fact,       innovative framework to simulate and predict the dynamics of
continuous treatment, by maximally selecting for resistant phe-              PCaSCs, androgen-dependent non-stem PCa cells (PCaCs), and
notypes and eliminating other competing populations, may                     blood PSA concentrations during IADT. Our mathematical
actually accelerate the emergence of resistant populations—a                 model of PCaSC enrichment is calibrated and validated with
well-studied evolutionary phenomenon termed competitive                      longitudinal PSA measurements in individual patients to
release4.                                                                    identify model dynamics that correlate with treatment resistance.
   In part to address this issue, prior trials have used intermittent        The model’s predictive power to accurately forecast individual
ADT (IADT) to reduce toxicity and potentially delay time to                  patients’ responses to IADT cycles is evaluated in an independent
progression (TTP). However, these trials were typically not                  patient cohort. These analyses suggest that PCaSC and
designed with a detailed understanding of the underlying evolu-              PSA dynamics may potentially be used to personalize IADT,
tionary dynamics. For example, a prospective Phase II trial of               maximize TTP, and ultimately improve PCa outcomes. The
IADT for advanced PCa included an 9-month induction period                   calibrated and validated model is then used to generate testable
in which patients were treated at MTD prior to beginning                     hypotheses about patients that may benefit from concurrent
intermittent therapy5. We have previously postulated that only a             chemotherapy.
small number of ADT-sensitive cells would typically remain after
the induction period, thereby significantly reducing the potential
of intermittent treatment to take advantage of the evolutionary              Results
dynamics3.                                                                   Model accurately simulates patient-specific response dynamics.
   Fully harnessing the potential of intermittent PCa therapy                The model was calibrated to and assessed for accuracy on long-
requires identifying ADT resistance mechanisms, predicting                   itudinal data from a prospective Phase II study trial conducted in
individual responses, and determining potentially highly patient-            109 men with biochemically recurrent PCa treated with IADT22
specific, clinically actionable triggers for pausing and resuming             (see Methods, Supplementary Fig. 1). Stratified random sam-
IADT cycles. Progress in integrated mathematical oncology may                pling23 was used to divide the data into training and testing
make such analysis possible. Many mathematical models based                  cohorts. That is, the data were ordered according to number of
on a variety of plausible resistance mechanisms have been pro-               cycles of treatment and then randomly sampled such that each
posed to simulate IADT responses3,6–14. Although these models                cohort had a similar spread of number of cycles per patient.
can fit clinical data, they often rely on numerous model variables            Assuming that uninhibited PCaSCs divide approximately once
and parameters that in combination fail to adequately predict                per day24, λ (day−1) was set to ln(2) and parameter estimation was
responses and outcomes for individual patients10. We hypothe-                used to find the remaining parameters. The model was calibrated
size that PCa cells with stem-like properties (PCaSCs) may be, at            to the training cohort data with two population uniform para-
least in part, responsible for tumor heterogeneity and treatment             meters (PSA production rate ρ = 1.87E-04 (µg/L day−1), decay
failure owing to their self-renewing, differentiating and quiescent          rate φ = 0.0856 (day−1)) and two patient-specific parameters
nature15–17. Here, we define PCaSCs to be a population of cells               (median PCaSC self-renewal rate ps = 0.0278 (95% CI: [0.0265,
that are less sensitive to low testosterone environments but still           0.0611]) (non-dimensional), ADT cytotoxicity rate α = 0.0360
somewhat dependent on androgen receptor pathways. Simulating                 (95% CI: [0.0258, 0.1379]) (day−1)).
longitudinal prostate-specific antigen (PSA) levels in early IADT                The model results captured clinically measured longitudinal
treatment cycles could help identify patient-specific PCaSC                   PSA dynamics of individual responsive and resistant patients
dynamics to computationally forecast individual disease dynam-               (Supplementary Fig. 2A–B) and the population as a whole (R2 =
ics and reliably predict IADT response or resistance in sub-                 0.74 Supplementary Fig. 2C). The corresponding PCaSC
sequent treatment cycles.                                                    dynamics demonstrated a rapid increase in the PCaSC population
   The first evidence of stem cells in the prostate was provided by           in patients that became castration resistant compared with
Isaacs and Coffey18, who used androgen cycling experiments in                patients that remained sensitive throughout the trial. Simulations
rodents to show that castration resulted in involution of the                also showed that, in this model, the emergence of resistance is a
prostate, whereas restored androgen levels resulted in complete              result of selection for the PCaSCs during on-treatment phases.
regeneration of the prostate. These findings demonstrated that                Coinciding with this transition to castration resistance, analysis of
the normal prostate depends on androgens for maintenance. A                  model parameters revealed that resistant patients had signifi-
small population of androgen-independent stem cells within the               cantly higher PCaSC self-renewal rates than responsive patients
prostate epithelium divide to give rise to amplifying cells, which           (median ps = 0.0249 for responsive patients vs. ps = 0.0820 for
do not directly depend on androgen for their continuous main-                resistant patients, p < 0.001, (95% CI: (0.0167, 0.0344) vs. (0.0472,
tenance, but respond to androgens by generating androgen-                    0.1460), respectively) Supplementary Fig. 2D). As such, we can
dependent transit cells. Approximately 0.1% of cells in prostate             conclude that those patients with a low ps are considered to be
tumors express the stem cell markers CD44+/α2β1hi/CD133+19.                  evolutionarily stable, whereas those with a higher ps are likely to
A pre-clinical study by Bruchovsky et al. showed ADT selects for             develop resistance quicker. As shown in Supplementary Fig. 2D,
murine PCaSCs20. Analogously, Lee et al.21 demonstrated                      analysis revealed that ps and α may be functionally related.
increased PCaSCs populations after ADT in patient-derived PCa                Supplementary Table 1 shows the mean squared error

2                NATURE COMMUNICATIONS | (2020)11:1750 | https://doi.org/10.1038/s41467-020-15424-4 | www.nature.com/naturecommunications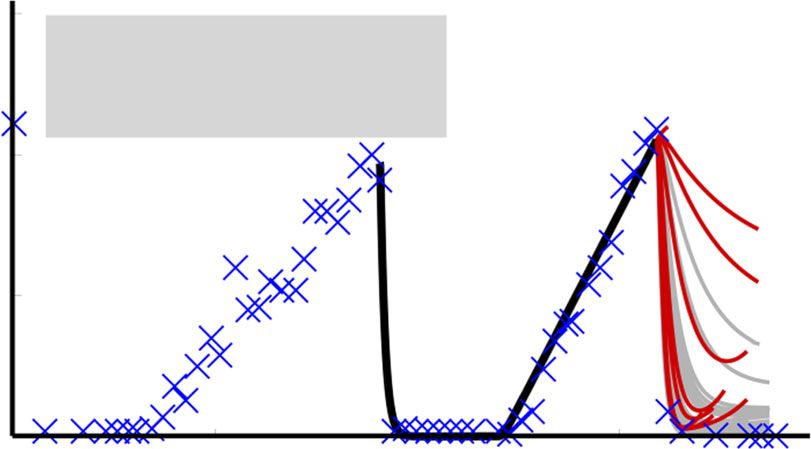
NATURE COMMUNICATIONS | https://doi.org/10.1038/s41467-020-15424-4 ARTICLE
a Patient 091 (Continuous Responder) b
Patient 033 (Resistant in 3rd Cycle)
40 40 PSA
× Data Model (P) increasing
during TX
30 30
PSA (g/L)
PSA (g/L)
20 20
10 10
0 0
0 500 1000 1500 0 200 400 600 800
600 600
400 400
PCaSC
PCaSC
Slowly Rapidly
increasing increasing
200 200
0 0
0 500 1000 1500 0 200 400 600 800
Days Days
c d ** ***
0.5 1 1
50
0.4 0.8 0.8
ADT Cytotoxicity,
40
Self-Renewal, ps
Simulated PSA
0.3 0.6 0.6
30
0.2 0.4 0.4
20
10 0.1 0.2 0.2
R 2 = 0.63
0 0 0 0
0 50 Resp. Resist. Resp. Resist. 0 0.2 0.4
Measured PSA ps
Fig. 1 Model validation on testing patients. a, b Model fits to PSA data and corresponding PCaSC dynamics for a a continuous responder and b a patient
who developed resistance during his third cycle of treatment. PCaSC population is rapidly increasing in resistant patient and slowly in responsive patient
owing to a significantly higher self-renewal rate (ps = 0.0201 and 0.1118 for patients 091 and 033, respectively). c Simulated vs. measured PSA. Linear
regression obtains an R2 of 0.63. d Parameter distributions for the stem cell self-renewal ps and ADT cytotoxicity α, comparing between responsive (n =
28) and resistance (n = 7) patients, with φ and ρ learned from training patients. Boxplots show median including the 25th and 75th percentiles. The two-
sample t test was used to calculate the statistical significance of the difference between the two groups (p = 0.016 (left pane), p = 2.54E-05 (right pane),
significance level denoted by double and triple star, respectively). Exponential relationship between ps and α. Blue dots and red triangles denote responsive
and resistant patients, respectively.
comparison for possible relationships between these parameters. and ADT cytotoxicity rates maintained the exponential rela-
This analysis showed that multiple relationships could provide tionship, previously obtained when optimizing over all IADT
similar fits to the data. From this, we chose the exponential cycles. The distributions of the self-renewal rate ps and the cor-
relationship, allowing PCaSC self-renewal rate ps to be the single, responding ADT cytotoxicity rate α, as well as their relative
identifiable, independent patient-specific parameter. change from cycle to cycle, were used to predict responses in
To assess the accuracy of our model, we set the PSA production subsequent cycles of patients in the training cohort. To determine
rate ρ and decay rate φ to the values obtained from the training whether to categorize a patient as responsive or resistant based on
cohort and identified patient-specific values for ps and corre- our predictions, receiving operating characteristic curves25 from
sponding α in the testing cohort. With these, the model was able the results from the training cohort data were analyzed to find a
to fit the data (R2 = 0.63) and the resulting parameter distribu- threshold κi for each cycle (Fig. 2d). If P(Ω) > κi, then the patient
tions and relationships were similar to those found in the training was predicted as resistant in cycle i. For each cycle i, a value of κi
cohort (Fig. 1). was chosen that would maximize the sensitivity (predicting
resistance when a patient is indeed resistant), and specificity
(predicting resistance when a patient is actually responsive) of the
PCaSC dynamics predict subsequent IADT cycle responses. To training cohort.
predict the evolution of resistance in subsequent treatment cycles, Using these thresholds, model forecasting was completed on
we fit the model to single treatment cycles for patients in the the testing set and the patient was classified as either responsive
training set, again setting the PSA production rate ρ and decay or resistant in the subsequent treatment cycle. Representative
rate φ to the values previously found (Fig. 2a). The self-renewal examples of second and third cycle predictions for one responsive
NATURE COMMUNICATIONS | (2020)11:1750 | https://doi.org/10.1038/s41467-020-15424-4 | www.nature.com/naturecommunications 3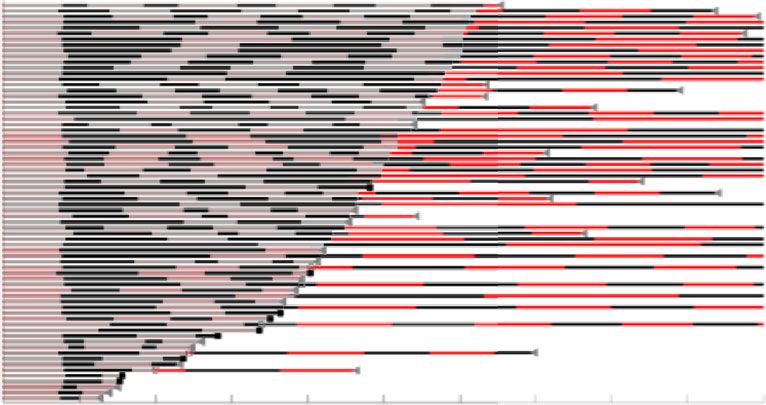
ARTICLE NATURE COMMUNICATIONS | https://doi.org/10.1038/s41467-020-15424-4
a 1
0.8
Self-Renewal, ps
0.6
0.4
0.2
0
Cycle 1 Cycle 2 Cycle 3 Cycle 4
b Cycle 1 to cycle 2 c Cycle 2 d Cycle 2
1 1 1
2 = 0.454
Cumulative prob.
0.8
Sensitivity
0.6 0.5 0.5
α
0.4 AUC = 0.59
0.2 0 0
–1 7 35 7E11 500E11 0.2 0.4 0.6 0.8 0 0.2 0.4 0.6 0.8 1
Cycle 2 to cycle 3 Cycle 3 Cycle 3
1 3 = 0.284
1 1
Cumulative prob.
Sensitivity
0.8
0.6 0.5 0.5
α
0.4 AUC = 0.802
0.2 0 0
–1 9 24 1.3E3 1E12 0.2 0.4 0.6 0.8 0 0.2 0.4 0.6 0.8 1
Cycle 3 to cycle 4 Cycle 4 Cycle 4
1 1 1 4 = 0.47
Cumulative prob.
Sensitivity
0.8
0.5
α
0.6 0.5
0.4 AUC = 0.816
0.2 0 0
–1 4 1E11 1E12 3E12 0.1 0.2 0.3 0.4 0.5 0 0.2 0.4 0.6 0.8 1
Δ ps ps 1-Specificity
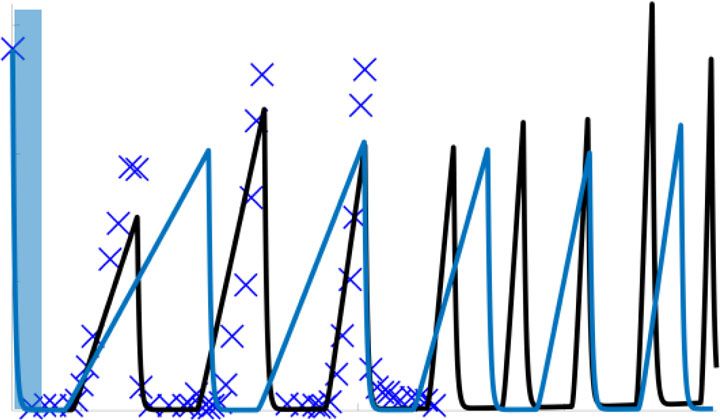
Fig. 2 Cycle to cycle parameter changes. a Cycle to cycle parameter distributions for ps (changes between cycles is not significant (p > 0.05)) for n = 35,
n = 35, n = 33, n = 30 patients in cycles 1 through 4, respectively. Boxplots show median including the 25th and 75th percentiles. The two-sample t test
was used to calculate the statistical significance of the difference between the groups. Blue dots and red triangles denote responsive and resistant patients,
respectively. b Cumulative probability of relative changes in ps between cycles. c α vs. ps fit (black curve) and 95% confidence interval (gray). d Receiver
operating characteristic curves for training predictions for cycles two through four. The resistance threshold κ that maximizes the accuracy and hence,
predictive power, is shown in red.
patient and one resistant patient from the testing cohort are times. The 95% confidence intervals for the uniform parameters φ
shown in Fig. 3. Patient 017 was a continuous responder who and ρ, the threshold values ki, as well as the overall accuracy are
underwent three cycles of IADT before the end of the trial. shown in Supplementary Table 2. As expected, the threshold
The model correctly predicted responsiveness in cycles two and values varied dependent upon the randomization. The overall
three based on the parameters fitted in cycles one and two, accuracy had a relatively narrow 95% confidence interval ranging
respectively. Patient 054 became resistant in the third IADT between 75.34% and 88.66%, with sensitivity between 43% and
cycle and the model was able to correctly predict response in cycle 61% and specificity between 75% and 91%. To better account for
two and resistance in the third cycle based on the thresholds under-represented resistant patients in the training cohort, we
learned in the training set. The model yielded a sensitivity of 57% utilized a bootstrapping leave-one-out design and performed the
and specificity of 94% over all subsequent IADT cycles for optimization and forecast analysis for each of the 70 patients
patients in the test cohort. The overall accuracy of the model individually. This resulted in training set-specific φ, ρ, κ2, κ3, and
was 90%. κ4 (95% confidence intervals shown in Supplementary Table 3),
To evaluate if the low sensitivity is an artifact of which resistant yielding a sensitivity of 73%, specificity of 91%, and overall
patients are stratified into the training cohort, we performed the accuracy of 89% (mean AUC = 0.80 ± 0.06). The ROC curve for
parameter optimization as well as forecast analysis by re- each individual patient, as well as the average ROC curve for
randomizing the patients into training and testing cohorts five cycles 2 through 4 are shown in Fig. 4.
4 NATURE COMMUNICATIONS | (2020)11:1750 | https://doi.org/10.1038/s41467-020-15424-4 | www.nature.com/naturecommunications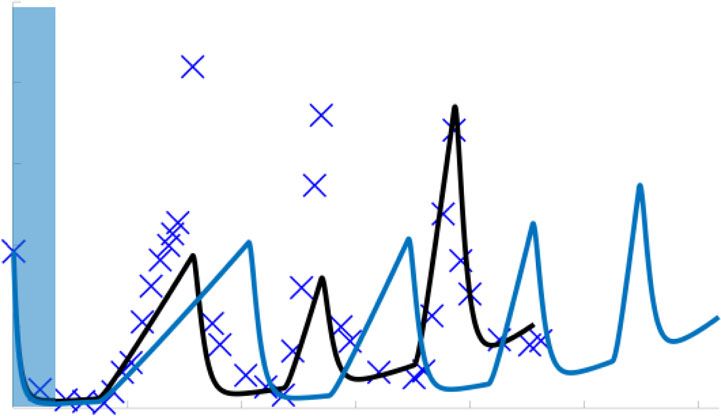
NATURE COMMUNICATIONS | https://doi.org/10.1038/s41467-020-15424-4 ARTICLE
a 2nd Cycle Response prediction 2rd Cycle Response prediction
15 15
P (Ω) = 0.02 < 2 P (Ω) = 0.097 < 3
Responsive Responsive
(Cont. Responder)
Responding
10 10
PSA (μg/L)
Patient 017
PSA (μg/L)
to TX
(90.3%)
5 Responding to TX 5
(98%)
0 0
0 500 1000 1500 0 500 1000 1500
b
P (Ω) = 0.235 < 2 80 P (Ω) = 0.466 > 3 PSA increasing
15 during TX
Responsive Resistant
(Resistant in 3rd Cycle)
(46.6%)
60
Patient 054
PSA (μg/L)
10
PSA (μg/L)
PSA increasing
during TX 40
(23.5%)
5
20
Responding to TX
(76.5%)
0 0
0 200 400 600 800 1000 1200 0 200 400 600 800 1000 1200
days days
Fig. 3 Model forecast using parameters obtained by sampling from CDF and 95% confidence intervals. a The model predicted responsiveness in cycles
two (98% of simulations) and three (90.3% of simulations) for Patient 017. The probability of resistant ðPðΩÞÞ was less than its respective κ
ðκ2 ¼ 0:45; κ3 ¼ 0:29Þ for each cycle. The patient completed the trial on day = 2202. b The model predicted resistance in 23.5% of cycle 2 simulations
and in 46.6% of cycle 3 simulations for Patient 054. The predicted probability of resistance in cycle three was greater than κ3 so the patient would be
advised to stop the trial. Data showed that he became resistant on day 1384 during the third cycle, as predicted.
Cycle 2 Cycle 3 Cycle 4
1 1 1
Sensitivity
Sensitivity
Sensitivity
0.5 0.5 0.5
AUC = 0.77 AUC = 0.85 AUC = 0.77
0 0 0
0 0.5 1 0 0.5 1 0 0.5 1
1-Specificity 1-Specificity 1-Specificity
Fig. 4 Leave-one-out study ROC analysis. Individual ROC curves for each leave-one-out cohort (gray curves), with mean ROC curve and corresponding
95% confidence interval (black). AUC 95% confidence intervals are (0.76, 0.78), (0.85, 0.86), and (0.74, 0.80), for cycles 2, 3, and 4, respectively.
IADT without induction period significantly increases TTP. In µg/L and resumed again once it rose above 10 µg/L at simulated
a study by Crook et al.5 continuous ADT was compared with measurements every 4 weeks. Both protocols were simulated until
IADT in localized PCa patients and they found that IADT was PSA progression or for 10 years (end of simulation, EOS), with
non-inferior to ADT using overall survival as the clinical end- progression defined as three sequential increases in PSA during
point. A similar study by Hussain et al.26 conducted in metastatic, treatment. For the IADT protocol, progression was also defined
hormone-sensitive PCa patients found that neither regimen as PSA > 4 µg/L at both 24 and 32 weeks on treatment, as used in
proved superior. These findings are likely the result of the the Bruchovsky trial. Figure 5a shows the treatment cycling times
7–8 months induction period, which resulted in the competitive for the 70 patients included in our analysis. For those that did not
release of the resistant phenotype once the androgen sensitive progress or experience an adverse event/death before the end of
subpopulation was eliminated3. Administering IADT without the trial, we continued simulating IADT until progression for up
such an induction period would allow sufficient time for the to 10 years (Fig. 5b). Figure 5c–d shows the treatment cycling
sensitive subpopulation to efficiently compete with the resistant times from the model simulations of IADT without the induction
subpopulation and prolong TTP and ultimately, overall survival. period and continuous ADT. Without induction, the average
To test these hypotheses, we simulated continuous ADT and cumulative dose is ~88% of that of the standard IADT and ~46%
IADT without the 36-week induction period and compared of continuous ADT. Comparing the TTP from the trial results
predicted TTP against the trial by Bruchovsky et al.22. For IADT against simulated continuous ADT showed that IADT with an
simulations, treatment was administered until PSA fell below 4 induction period resulted in longer TTP (Fig. 5e), though not
NATURE COMMUNICATIONS | (2020)11:1750 | https://doi.org/10.1038/s41467-020-15424-4 | www.nature.com/naturecommunications 5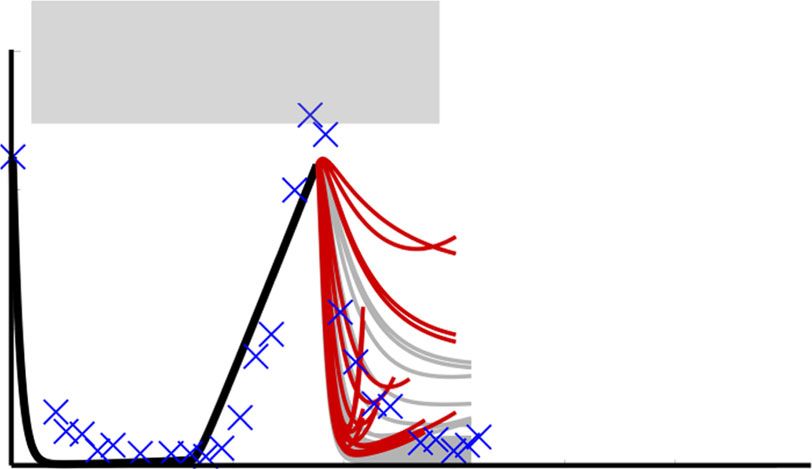
ARTICLE NATURE COMMUNICATIONS | https://doi.org/10.1038/s41467-020-15424-4
a b Bruchovsky Trial; Extrapolated
Bruchovsky Trial Data lADT w/Induction§
Patient
Patient
Off TX
On TX
Progression
Lost to follow up
Adverse event
0 12 24 36 48 60 72 84 96 108 120 0 12 24 36 48 60 72 84 96 108 120
c d Continuous ADT§
IADT w/o Induction§
Patient
Patient
0 12 24 36 48 60 72 84 96 108 120 0 12 24 36 48 60 72 84 96 108 120
Months Months
e 1
f EOS
108
Time to progression (months)
Progression Free Survival
0.8 96
84
0.6 72
n.s. 60
0.4 48
Median TTP (months)
IADT w/o Induction§ n.r. 36
0.2 IADT w/ Induction§ 119 24
Continuous ADT§ 103 12
0 0
0 12 24 36 48 60 72 84 96 108 120 IADT Cont. IADT
Time to progression (months) w/Ind.§ ADT§ w/o Ind.§
# at risk
70 70 69 65 62 57 56 50 49 46 40
70 70 65 60 54 47 44 41 36 34 30
70 69 63 57 53 49 45 43 38 34 32
g 60
5 month gain 102
in TTP w/o
Patient 054
PSA (μg/L)
40 Induction§
20 Selection for
PCa stem cells
during TX
0 101
0 24 49 54 0 24 49 54
Months Months
significant. The average TTP was ~4 months longer for IADT of treatment. To investigate if a patient-specific approach that
without the induction period when compared with the IADT with depends on individual pre-treatment PSA levels would be more
induction simulations (Fig. 5f) and could be increased by more effective, we simulated IADT using a 50% decline in PSA as a
than 5 months in select patients (Fig. 5g). treatment cessation trigger, as well as 90% and 30% decline, and
compared the results against those obtained in the Bruchovsky
Alternative treatment decision thresholds also increase TTP. In trial. Pausing treatment once PSA fell below 30% and 90% of the
the protocol used in the Bruchovsky study, treatment was paused pre-treatment PSA, checking every two weeks, resulted in sig-
after 36 weeks if PSA fell below 4 µg/L after both 24 and 32 weeks nificantly longer TTP when compared with the IADT protocol
6 NATURE COMMUNICATIONS | (2020)11:1750 | https://doi.org/10.1038/s41467-020-15424-4 | www.nature.com/naturecommunications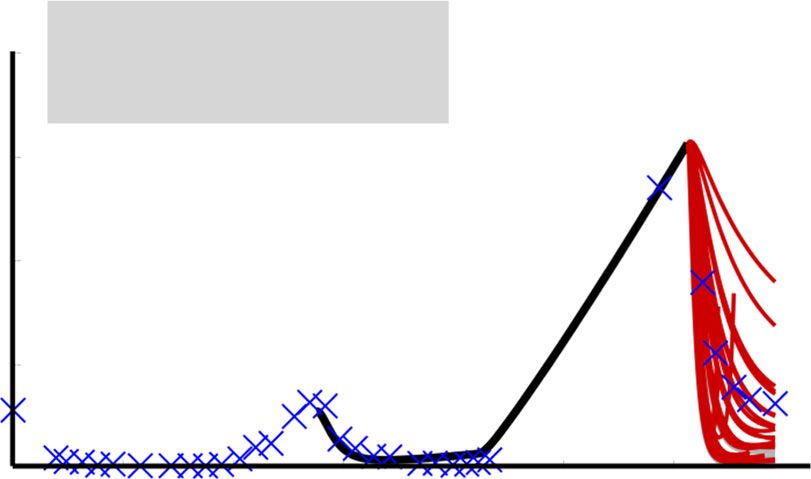
NATURE COMMUNICATIONS | https://doi.org/10.1038/s41467-020-15424-4 ARTICLE
Fig. 5 Administering IADT without induction period increases TTP when compared with IADT with induction and continuous ADT. a–d Treatment
times for a Bruchovsky trial data and simulations of b extrapolated IADT with induction, c IADT without induction, and d continuous ADT. Red and black
denote when treatment is on and off, respectively. e Kaplan–Meier estimates of progression comparing IADT with induction (black curve) against IADT
without induction (blue) and continuous ADT (gray) (double S indicates predictive model simulation). With and without induction period, IADT TTP
increases when compared with continuous therapy TTP. Red symbols denote patients who experienced an adverse event/death prior to the conclusion of
the trial. Statistical significance was determined using logrank test (IADT w/o induction vs. continuous: p = 0.073, IADT w/induction vs. continuous: p =
0.129, IADT w/induction vs. w/o induction: p = 0.795). f TTP comparison between IADT with induction (black), continuous therapy (gray), and IADT
without induction (blue). Open circles denote end of simulation (EOS). Red dots denote patients who experienced an adverse event/death prior to the
conclusion of the trial. Solid lines denote mean TTP (67.11, 57.25, and 71.87 months for IADT with induction, continuous therapy, and IADT without
induction, respectively). The average TTP is longer with IADT without induction, compared with IADT with induction and continuous ADT. g Simulation
results for Patient 054 (IADT with induction (black curve), without induction (blue curve), and continuous ADT (gray)). With IADT with induction, the
patient became resistant after 49 months. Simulating continuous ADT would result in progression after 24 months. Simulating IADT without the induction
would increase TTP by 5 months. PCaSC dynamics show that treatment selects for PCaSC population, accelerating resistance development. Dashed curve
represent time when ADT is off.
a Off TX On TX Progression d
1
§
30% PSA Decline
Progression Free Survival
0.8
*** ***
0.6 **
Patient
0.4
Median TTP (months)
30% decline§ n.r.
0.2 50% decline§ n.r.
§
0 12 24 36 48 60 72 90% decline n.r.
Months IADT§ 119
0
0 12 24 36 48 60 72 84 96 108 120
b 50% PSA Decline§ Time to Progression (months)
# at risk
70 70 69 69 69 67 67 67 66 64 63
70 70 69 69 68 66 66 65 62 60 60
70 70 69 67 65 61 59 56 56 54 52
Patient
70 70 65 60 54 47 44 41 36 34 30
e f Patient 054
60
0 12 24 36 48 60 72 84 96 108 120 EOS
PSA (μg/L)
40
Time to Progression (months)
Months 108
96
20
84
c 90% PSA Decline§ 72
0
60 0 49 53 104 120
48 EOS
36
102
Patient
24
PCaSC
12
0
IADT§ 90%§ 50%§ 30%§
101
0 12 24 36 48 60 72 84 96 108 120 0 49 53 104 120
Months Months EOS
Fig. 6 Alternative threshold therapy can significantly improve TTP. a–c Treatment times for IADT with pre-treatment PSA decline triggers. Red and black
denote when treatment is on and off, respectively. d Kaplan–Meier estimates of progression comparing standard IADT (black curve) with alternative
therapy protocol using a 90% (maroon), 50% (green), and 30% (blue) PSA decline trigger (double S indicates predictive model simulation). All threshold
levels show a significant increase in TTP when compared with standard IADT. Red symbols denote patients who experienced an adverse event/death prior
to the conclusion of the trial. Statistical significance was determined using logrank test (IADT vs. 30% decline, 50% decline, and 90% decline: p = 0.004,
p = 5.154E-06, p = 7.929E-08, respectively). Double and triple star denote p < 0.01 and p < 0.001, respectively. e TTP comparison between Bruchovsky
IADT (black) and thresholds of 90%, 50%, and 30% PSA reduction. Open circles denote end of trial/simulation (EOS). Red dots denote patients who
experienced an adverse event/death prior to the conclusion of the trial. Solid lines denote mean TTP (67.11, 66.79, 72.52, and 76.60 for standard IADT,
90%, 50%, and 30% PSA decline triggers, respectively). f Alternative threshold therapy simulations for Patient 054. With IADT, the patient became
resistant after 49 months. Using a PSA decline of 90% and 50%, resistance could be delayed to 53 and 104 months, respectively. Using a PSA decline of
30%, the patient could continue on the protocol for >120 months.
NATURE COMMUNICATIONS | (2020)11:1750 | https://doi.org/10.1038/s41467-020-15424-4 | www.nature.com/naturecommunications 7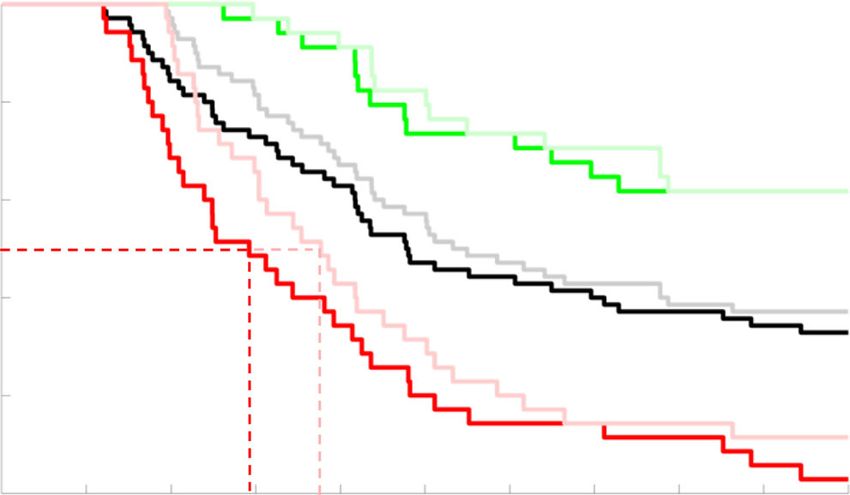
ARTICLE NATURE COMMUNICATIONS | https://doi.org/10.1038/s41467-020-15424-4
a 1 b
120
108 Advantage
IADT w/DOC§ TTP (months)
0.8 from DOC
Progression Free Survival
96
(ΔTTP > 4.2 months)
84
0.6 n.s. 72
60
0.4 48
36
0.2 Median TTP (months) 24
IADT w/6 cycles of DOC§ n.r.
IADT Alone§ 119 12
0 0
0 12 24 36 48 60 72 84 96 108 120 0 24 48 72 96 120
Time to Progression (months) IADT Alone§ TTP (months)
# at risk
70 70 67 64 59 59 56 52 52 50 47
70 70 65 60 54 47 44 41 36 34 30
c Patient 036 d Patient 024 No gain in TTP with
25
15 6 cycles of DOC§
19 month gain with
20
6 cycles of DOC§ PSA (μg/L)
PSA (μg/L)
15 10
10
5
5
0 0
0 12 24 36 55 74 0 12 24 36 48 60 72 84 96 108 120
EOS
102 102
PCaSC
PCaSC
0 12 24 36 55 74 0 12 24 36 48 60 72 84 96 108 120
Months Months EOS
Fig. 7 Docetaxel administration applied prior to IADT progression can increase TTP. a Kaplan–Meier estimates of progression comparing IADT (black)
against IADT with induction DOC (blue) (double S indicates predictive model simulation). Red symbols denote patients who experienced an adverse
event/death prior to the conclusion of the trial. Statistical significance was determined using logrank test (p = 0.260). b TTP comparison between IADT
alone and IADT with induction DOC. Shaded area shows where TTP for IADT with induction DOC is >4.2 months longer. c–d IADT simulations with (blue)
and without (black) induction DOC. c With IADT alone, Patient 036 developed resistance after 55 months. IADT with induction DOC delayed progression
for an additional 19 months. d Though the trial concluded after 6.5 years, simulations shows that Patient 024 could have remained on the IADT protocol for
at least 10 years.
used in the trial (Fig. 6d–f). In addition, the average cumulative metastatic hormone-sensitive PCa27–31. Thus, we sought to
dose could be significantly reduced depending on the threshold evaluate potential responses to combination therapy in the bio-
used as shown in Fig. 6a–c. With a 90% decline from pre- chemically recurrent setting. We investigated the effect of con-
treatment PSA, the average cumulative dose is ~64% of that of the current DOC by simulating six cycles of DOC early during IADT
standard IADT. A 50% decline results in ~30% of the cumulative (as defined in the Methods section). Model analysis showed that
dose used in standard IADT, whereas 30% results in ~27%. administering DOC early with concurrent ADT followed by
Controlling for the total time that each patient participated in the IADT may be able to increase TTP (Fig. 7a, c). In particular,
trial results in ~60%, 25%, and 22% of the cumulative dose used in model simulations showed that the majority of patients may
standard IADT for thresholds of 90%, 50%, and 30%, respectively. receive a benefit of >4.2 months (length of six cycles of DOC)
when given induction DOC with IADT (Fig. 7b). Equally
important, simulations can identify selected patients for whom
Concurrent docetaxel administration provides favorable TTP. early concurrent DOC may not provide gains in TTP (Fig. 7d).
As PCaSCs are resistant to ADT, it may be beneficial to admin-
ister alternative therapies that do not work directly via the AR
pathway. AA, enzalutamide, apalutamide, and docetaxel (DOC) First cycle PCaSC self-renewal rate stratifies patients who can
have shown benefit when used concurrently with ADT in various benefit from DOC. As shown above, the stem cell self-renewal
PCa settings, including both high- and low-volume disease in rate plays a significant role in IADT and could accurately predict
8 NATURE COMMUNICATIONS | (2020)11:1750 | https://doi.org/10.1038/s41467-020-15424-4 | www.nature.com/naturecommunications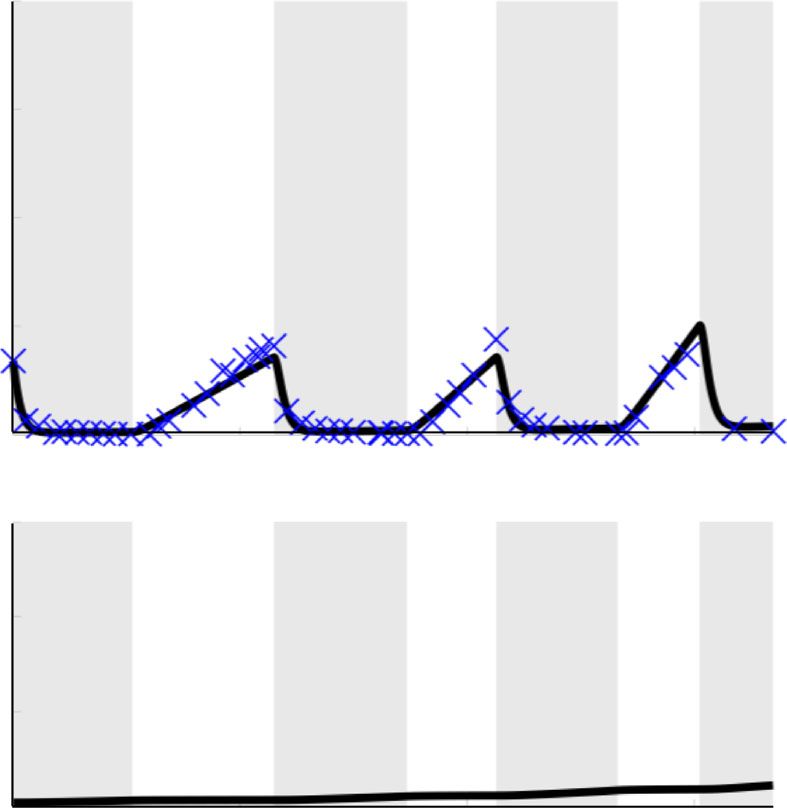
NATURE COMMUNICATIONS | https://doi.org/10.1038/s41467-020-15424-4 ARTICLE
a *** b
0.6 IADT Alone§
1
DOC After 1st IADT Cycle§
0.5
Progression Free Survival
0.8
ps < med(ps)
0.4
Self-Renewal, ps
0.6
0.3
0.4
0.2 ***
***
0.2 ps ≥ med(ps)
0.1
0.0255 med(ps)
0
No Benefit Benefit 0 12 24 35 45 60 72 84 96 108 120
DOC After 1st IADT Cycle § Time to Progression (months)
c ** d e
n.s. n.s. Patient 084 Patient 016
**
EOS >18 month
15 gain with 15
108 DOC
Time to Progression (months)
96
PSA (μg/L)
PSA (μg/L)
10 10
84
72 5 5
60
48 0 0
0 12 24 36 48 60 72 84 96 102 120 0 12 24 36 48 60 72 84 96 108 120
36 EOS EOS
24 102 102
PCaSC
PCaSC
12
0
W/ W/o W/o W/
DOC§ DOC§ DOC§ DOC§
0 12 24 36 48 60 72 84 96 102 120 0 12 24 36 48 60 72 84 96 108 120
ps < med(ps) ps ≥ med(ps) Months Months
Fig. 8 First cycle ps stratifies patients who could benefit from docetaxel after first cycle of IADT. a ps distributions between patients who may benefit
from docetaxel after first cycle of IADT and those who may not. Median ps (shown by blue dashed line) stratifies patients who could benefit from docetaxel
after first cycle of IADT. The two-sample t test was used to calculate the statistical significance of the difference between patients receiving no benefit
(n = 36) and benefit (n = 34) from docetaxel after first cycle. Boxplots show median including the 25th and 75th percentiles. The two-sample t test was
used to calculate the statistical significance of the difference between the two groups (p = 0.0004). b Kaplan–Meier estimates of progression with and
without docetaxel after first cycle of IADT (double S indicates predictive model simulation). Stratifying by median ps shows that patients with ps ≥ medðps Þ
(red) experience greatest benefit from docetaxel (gain of 10 months). For patients with ps < medðps Þ (green), there was not a significant benefit in TTP.
Statistical significance was determined using logrank test. c TTP comparison between IADT with and without docetaxel. Open circles denote end of
simulation (EOS). TTP was significantly shorter in patients with ps ≥ medðps Þ both with and without docetaxel. Solid lines denote mean TTP (63.57, 62.35,
42.26, and 44.77 months (left to right) for patients with low ps (green) and high ps (red), respectively). d–e Simulation results of IADT with (gray) and
without (black) docetaxel after first cycle. d Patient 084 ðps ¼ 0:0386 > medðps ÞÞ gains at least 18 months with docetaxel after first cycle. e Patient 016
ðps ¼ 0:0017 < medðps ÞÞ did not progress with or without docetaxel. In a–c, double and triple star signifies p < 0.01 and p < 0.001, respectively.
a patient’s response in subsequent cycles after just the first cycle. resistant subpopulation during treatment holidays. As IADT is
With this, we used the first cycle ps value to simulate six cycles of highly dynamic, maximum efficacy requires continuous, accurate
DOC with concurrent ADT followed by IADT and found that estimates of sensitive and resistant subpopulations.
patients with ps ≥ med(ps) could benefit from DOC after the first Here, we present a simple mathematical model of evolutionary
cycle of IADT (Fig. 8a). There was a significant difference in dynamics within biochemically recurrent PCa during IADT. The
progression free survival between patients with a high ps and model has been trained with two parameters that are uniform
those with a low ps, both when simulating IADT with and across all patients and only two patient-specific parameters,
without DOC after the first cycle (Fig. 8b). Though the difference which are interconnected, allowing us to further reduce them to a
in TTP was not significantly higher with DOC given after the first single, measurable parameter for each patient. Simulations sug-
cycle (Fig. 8c), median TTP increased from 35 to 45 months in gest that, in this model, the evolution of PCaSCs is highly cor-
those patients with ps ≥ med(ps) (Fig. 8b, d, e). related with the development of resistance to IADT and may
consequently be a plausible mechanism of resistance develop-
Discussion ment. PSA dynamics suggest that resistant patients are likely to
ADT is not curative for advanced PCa, as patients inevitably have higher PCaSC self-renewal rates than responsive patients,
develop resistance. IADT is a promising approach to counteract leading to increased production of PCaSCs and ultimately dif-
evolutionary dynamics by reducing competitive release of the ferentiated cells, thereby accelerating PSA dynamics with each
NATURE COMMUNICATIONS | (2020)11:1750 | https://doi.org/10.1038/s41467-020-15424-4 | www.nature.com/naturecommunications 9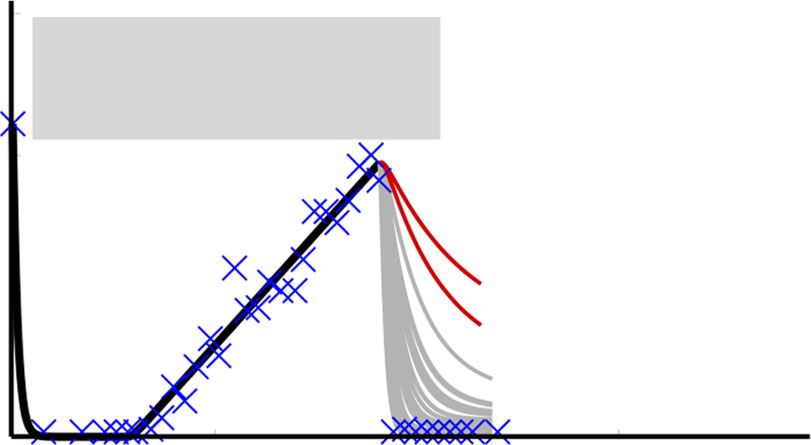
ARTICLE                                                                 NATURE COMMUNICATIONS | https://doi.org/10.1038/s41467-020-15424-4

treatment cycle. Our results are similar to prior studies in glio-              Since only 21% of the 70 patients progressed before the con-
blastoma that cancer stem cell self-renewal is likely to increase            clusion of the trial22 (Supplementary Fig. 1), the clinical data
during prolonged treatment32.                                                included more responsive than resistant patients. This was
   Using longitudinal PSA measurements and observed clinical                 overcome by bootstrapping the data, with more balanced data
outcomes from the IADT trial by Bruchovsky et al.22, the model               being poised to advance clinical utility. Of note, the presented
was calibrated to clinical data and predicted the development of             model was calibrated and validated on patients with pre-
resistance with 89% accuracy. Study analysis produced four                   dominantly stage T2b and T3 disease, with Gleason scores ran-
important clinical findings: (1) PSA dynamics provide actionable              ging from 2 to 922. As additional data become available, the
triggers for PCa treatment personalization, vis-à-vis static PSA             developed framework may be generalizable and able to predict
values with highly debated clinical utility33. (2) IADT outcomes in          how PCa patients of different stages will respond to IADT with
prior studies may be adversely affected by the long induction per-           comparable accuracy. Further work in patients with more
iods that accelerate selection for treatment-resistant subpopulations.       advanced or metastatic PCa is needed.
(3) Patient-specific PSA treatment thresholds relative to pre-                   The mathematical model was developed with the intent to
treatment burden rather than a fixed value for all patients could             make clinically actionable predictions. To balance model com-
significantly improve IADT responses. (4) Early treatment response            plexity and prediction accuracy, the presented simple model has
dynamics during IADT can identify patients that may benefit from              been derived36. Although numerous additional biological
concurrent docetaxel treatment and, maybe more importantly,                  mechanisms are contributing to the observed PSA dynamics, it
identify patients who are adequately treated with IADT alone.                will become impossible to calibrate and validate their contribu-
   Our study demonstrated the value of ongoing model simula-                 tions from the measured clinical data. For reproducibility, we
tions in predicting outcomes from each treatment cycle                       report the trained parameter values for the presented model.
throughout the course of therapy. By integrating data that                   However, modification of the functional form of the developed
becomes available with each additional treatment cycle to adap-              model terms or inclusion of additional mechanisms will change
tively inform tumor population dynamics, model simulations                   each parameter. Therefore, herein estimated parameter values
predict the response to the next cycle with a sensitivity and                should not be taken as biological ground truth, nor are they
specificity of 73% and 91%, respectively and an overall accuracy              translatable to different mathematical models.
of 89%. This ability to learn from early treatment cycles and                   A perceived limitation of the quantitative model may be the use
predict subsequent responses adds an essential degree of perso-              of PSA dynamics as the sole biomarker of progression. PCa can
nalization and flexibility to a cancer treatment protocol—a game              become aggressive and metastatic despite low levels of serum
theoretic strategy termed Bellman’s Principle of Optimality that             PSA37,38 with development of androgen independence, most
greatly increases the physician’s advantage34.                               notably in neuroendocrine PCa. Additional serum biomarkers
   For those patients predicted to become resistant in the next              such as circulating tumor cells (CTCs) and cell-free DNA
cycle of IADT, an actionable model would also predict alternative            (cfDNA) may prove useful in estimating intratumoral evolu-
treatments that could produce better clinical outcomes. The role             tionary dynamics in subsequent trials. With the CellSearch plat-
of docetaxel in metastatic, hormone-sensitive PCa has been                   form, higher CTCs enumeration more than five cells per 7.5 mL
investigated in three studies in the past five years. The GETUG-              of peripheral blood has been shown to be prognostic and portend
AFU15 study found a non-significant 20% increase in overall                   worse overall survival in metastatic CRPC patients39; however
survival in high volume disease (HVD) patients who received                  detecting CTCs in biochemically recurrent patients has been
DOC concurrently with continuous ADT, but no survival benefit                 labor-intensive with low yield40.
in those with low volume disease (LVD)35. Subsequently, the                     In conclusion, our study demonstrates that a simple mathe-
results of the STAMPEDE trial found that DOC administration                  matical model based on cellular dynamics in PCa can have a high
resulted in a >12 months overall survival benefit with a median               predictive power in a retrospective data set from patients with
follow-up of 43 months29. Finally, the CHAARTED trial showed                 biochemically recurrent PCa undergoing IADT. In particular, we
a statistically significant overall survival benefit from adding DOC           demonstrate the model can use data from each treatment cycle to
in patients with HVD; however, no statistically significant sur-              estimate intratumoral subpopulations and accurately predict the
vival benefit was found in LVD patients30. Here we explored the               outcomes in subsequent cycles. Furthermore, in patients who are
option of adding docetaxel in the treatment of biochemically                 predicted to fail therapy in the next cycle, alternative treatments
recurrent PCa. Coinciding with previous findings, we found that               for which a response is more likely can be predicted. We conclude
concurrent docetaxel did not provide a significant benefit for the             that PSA dynamics can prospectively predict treatment response
entire patient cohort. However, we found that analyzing PSA                  to IADT, suggesting ways to adapt treatment to delay TTP.
dynamics from the first IADT cycle stratifies patients who may
receive benefit from concurrent administration of docetaxel.                  Methods
More importantly, the model was able to identify patients who                IADT clinical trial data. The Bruchovsky prospective Phase II study trial was
                                                                             conducted in 109 men with biochemically recurrent PCa22. IADT consisted of
would not receive a significant benefit in TTP from concurrent
                                                                             4 weeks of Androcur as lead-in therapy, followed by a combination of Lupron and
DOC treatment. These results emphasize that heterogeneity in                 Androcur, for a total of 36 weeks. Treatment was paused if PSA had normalized
patient responses can be harnessed by quantitative models to                 (< 4 µg/L) at both 24 and 32 weeks, and resumed when PSA increased above
personalize treatment protocols.                                             10 µg/L. PSA was measured every 4 weeks. Patients whose PSA had not normalized
   Model validation showed that with two uniform parameters                  after both 24 and 32 weeks of being on treatment were classified as resistant and
                                                                             taken off of the study. We analyzed the data of 79 patients who had completed
learned from our training cohort, only 63% of the data were                  more than one IADT cycle. One patient was omitted for inconsistent treatment,
accurately captured in the testing cohort. Although this may be              seven were omitted owing to the development of metastasis and/or local pro-
perceived as a limitation of the model, the primary objective of             gression, and one was omitted due to taking multiple medications throughout the
this study was not to fit data with highest accuracy but to develop           trial, resulting in 70 patients included in the analysis (Supplementary Fig. 1). To
                                                                             calibrate and assess the accuracy of our model, the data was divided into training
a predictive model that could be clinically actionable. Allowing             (n = 35, 27 responsive, eight resistant) and testing (n = 35, 28 responsive, seven
for more patient-specific parameters substantially increases data             resistant) cohorts, respectively matched for clinical response to treatment.
fit, but compromises the ability to predict cycle-by-cycle
dynamics as insufficient data are collected to inform each                    Mathematical model of IADT response. We developed a mathematical model of
model parameter on a per-patient basis.                                      PCaSC (S), non-stem (differentiated) PCa cells (D), and serum PSA concentration

10               NATURE COMMUNICATIONS | (2020)11:1750 | https://doi.org/10.1038/s41467-020-15424-4 | www.nature.com/naturecommunications
NATURE COMMUNICATIONS | https://doi.org/10.1038/s41467-020-15424-4 ARTICLE
PCa stem Differentiated Prostate-specific the response in cycle i+1. In line with the trial by Bruchovsky et al.22, resistance
cells cells antigen was defined as PSA increasing during treatment and/or a PSA level above 4 µg/L at
both 24 and 32 weeks after the start of a cycle of treatment. Simulations that
1 – ps
satisfied either of these conditions were classified as resistant. Thus, for each cycle
prediction we obtained a probability of resistance (P(Ω) = proportion of resistance
predictions). If the resulting P(Ω) was greater than the given threshold (obtained
ps
from the training cohort, Fig. 2d), then the prediction was classified as resistant.
Otherwise, it was classified as responsive. The accuracy was computed as the
proportion of predictions that were correctly classified.
Fig. 9 Model of prostate cancer stem-like cell and non-stem
(differentiated) cell dynamics. Interactions between stem-like and non- Modeling concurrent docetaxel. Unlike ADT, docetaxel can induce cell death in
stem cells, as well as serum PSA. Stem-like cells can divide asymmetrically both PCaSCs and non-stem cells, though to a lesser degree in PCaSCs compared
to produce differentiated cells. The differentiated cells inhibit the with non-stem cells47. To model this, we extended the current model to include
death of each cell type at rates βS (day−1) and βD (day−1). That is,
production of PCaSCs, die in response to ADT (shown by the red arrow),
and produce PSA. Parameters are stem cell proliferation rate (λ), stem cell dS S
¼ p λS βS TxD S;
self-renewal ps, ADT cytotoxicity α, PSA production rate ρ, and PSA decay dt SþD s
rate φ.
dD S
¼ 1 ps λS αTx D βD TxD S; ð2Þ
dt SþD
(P) (Fig. 9). PCaSCs divide with rate λ (day−1) to produce either a PCaSC and a
where TxD = 1 when docetaxel is on and TxD = 0 otherwise. Each cycle of docetaxel
non-stem PCa cell with probability 1−ps (asymmetric division) or two PCaSCs at
was simulated as a single dose on day n (TxD = 1) followed by 3 weeks without
probability ps (symmetric division) with negative feedback from differentiated
docetaxel (TxD = 0). The parameters βS = 0.0027 and βD = 0.008 were chosen such
cells16, modeled as SþDS
. Differentiated cells exclusively produce PSA at rate ρ (µg/L that approximately three times more non-stem cells died than PCaSCs47. The data
day−1), which decays at rate φ (day−1). Unlike androgen-independent PCaSCs, that support the findings of this study are available from the corresponding author
differentiated cells die in response to androgen removal at rate α (day−1)41. IADT upon reasonable request.
on and off cycles are described with parameter Tx, where Tx = 1 when IADT is
given and Tx = 0 during treatment holidays.
The coupled mathematical equations describing these interactions are shown Reporting summary. Further information on research design is available in
below the Nature Research Reporting Summary linked to this article.
dS S dD S dP
¼ ps λS; ¼ 1 ps λS αTx D; ¼ ρD φP: ð1Þ Data availability
dt SþD dt SþD dt The clinical data used to conduct this study are available in a public repository at http://
www.nicholasbruchovsky.com/clinicalResearch.html. A reporting summary for this
article is available as a Supplementary Information file.
Mathematical model training and validation. Cell cycle duration is assumed to
align with the evolved circadian rhythm42. Matsu-Ura et al. demonstrated that
intercellular coupling helps stem cells to synchronize their cell divisions with local Code availability
circadian pacemakers in secretory Paneth cells43. Thus, we set uninhibited PCaSCs Code supporting the findings of this study are available at https://github.com/
to divide once per day at λ = ln(2). Sensitivity analysis44 was done to assess the reneebrady/IADT_PCaSC.
variation in the model output in response to small perturbations in the model
parameters. This was computed by solving the sensitivity matrix χ ¼ ∂P ∂θ , where P is
PSA and θ ¼ ðps ; α; λ; φ; ρÞ. Cell division rate λ was the least sensitive parameter, Received: 9 May 2019; Accepted: 9 March 2020;
whereas ρ was the most sensitive (Supplementary Figure 3A–B). Correlation
analysis45 was used to determine parameter identifiability. Using the covariance
1
matrix defined as C ¼ ðχ T χ Þ , the correlation coefficients were computed as cij ¼
ffi : If a parameter pair shows a strong correlation, that is if cij > ξ, then two
Cij
pffiffiffiffiffiffiffi
C C
ii jj
References
parameters are correlated. In this case, we chose a correlation threshold of
1. Siegel, R. L., Miller, K. D. & Jemal, A. Cancer statistics, 2019. CA Cancer J.
ξ ¼ 0:95. Supplementary Figure 3C shows that λ is highly correlated with ρ and as
Clin. 69, 7–34 (2019).
the least sensitive parameter, we can confidently set λ to be patient uniform at its
2. Fizazi K., et al. LATITUDE: A phase III, double-blind, randomized trial of
nominal value of ln(2) and optimize the four remaining parameters (Supplemen-
androgen deprivation therapy with abiraterone acetate plus prednisone or
tary Figure 3D).
We used particle swarming optimization (PSO)46 to identify patient-specific placebos in newly diagnosed high-risk metastatic hormone-naive prostate
model parameters that minimized the least squares error between model cancer. J Clin Oncol 35, LBA3-LBA3 (2017).
simulation and patient data. The parameter distributions obtained by calibrating 3. Zhang J., Cunningham J. J., Brown J. S., Gatenby R. A. Integrating
the model to the data using these four parameters are shown in Supplementary evolutionary dynamics into treatment of metastatic castrate-resistant prostate
Figure 4. Comparing the coefficients of variation between each parameter showed cancer. Nat. Commun. 8, 1816 (2017).
that φ may not be required to be patient-specific and can be assumed uniform for 4. Wargo, A. R., Huijben, S., de Roode, J. C., Shepherd, J. & Read, A. F.
all patients. Allowing the optimizer to find the uniform value of φ and the Competitive release and facilitation of drug-resistant parasites after
remaining three patient-specific parameters produced accurate fits to the data (not therapeutic chemotherapy in a rodent malaria model. Proc. Natl. Acad. Sci.
shown). In addition, the coefficient of variation of ρ revealed that this parameter USA 104, 19914–19919 (2007).
could also be uniform between patients. Therefore, φ and ρ were set as uniform, 5. Crook, J. M. et al. Intermittent androgen suppression for rising PSA level after
whereas ps and α were patient-specific. PSO was used to identify population radiotherapy. N. Engl. J. Med 367, 895–903 (2012).
uniform and patient-specific model parameters in the training cohort. The trained 6. Baez, J. & Kuang, Y. Mathematical models of androgen resistance in prostate
mathematical model was assessed for accuracy in the validation cohort. The cancer patients under intermittent androgen suppression therapy. Appl. Sci. 6,
learned population uniform parameters were kept constant for all patients, and 352 (2016).
PSO was performed to find appropriate values for ps and α to produce accurate 7. Cunningham J. J., Brown J. S., Gatenby R. A., Stankova K. Optimal control to
data fits. Resulting PCaSC proportion dynamics are shown in Supplementary develop therapeutic strategies for metastatic castrate resistant prostate cancer.
Figure 5. J. Theor. Biol. 459, 67–78 (2018).
8. Hirata Y., et al. Intermittent androgen suppression: estimating parameters for
Adaptive response prediction. In order to predict the evolution of resistance, we individual patients based on initial PSA data in response to androgen
started by fitting the model to each cycle of the training cohort data individually. deprivation therapy. PLoS ONE 10, e0130372 (2015).
That is, finding the optimal values of ps and α, while allowing φ and ρ to remain 9. Hirata Y., Morino K., Akakura K., Higano C. S., Aihara K. Personalizing
fixed at the values previously found, to fit one cycle of data at a time (Fig. 2a). We androgen suppression for prostate cancer using mathematical modeling. Sci.
then measured the relative change in ps between cycles and used this to generate Rep. 8, 2673 (2018).
cumulative probability distributions as shown in Fig. 2b. Sampling from the 95% 10. Hirata, Y., Bruchovsky, N. & Aihara, K. Development of a mathematical
confidence interval around the exponential curve relating ps to α in cycle i+1 model that predicts the outcome of hormone therapy for prostate cancer. J.
(Fig. 2c), we found a corresponding αiþ1 . This ps;iþ1 and αiþ1 were used to predict Theor. Biol. 264, 517–527 (2010).
NATURE COMMUNICATIONS | (2020)11:1750 | https://doi.org/10.1038/s41467-020-15424-4 | www.nature.com/naturecommunications 11ARTICLE NATURE COMMUNICATIONS | https://doi.org/10.1038/s41467-020-15424-4
11. Ideta, A. M., Tanaka, G., Takeuchi, T. & Aihara, Z. A mathematical model of 39. Danila, D. C. et al. Circulating tumor cell number and prognosis in
intermittent androgen suppression for prostate cancer. J. Nonlinear Sci. 18, progressive castration-resistant prostate cancer. Clin. Cancer Res 13,
593–614 (2008). 7053–7058 (2007).
12. Morken, J. D., Packer, A., Everett, R. A., Nagy, J. D. & Kuang, Y. Mechanisms 40. Aragon-Ching, J. B. et al. Circulating tumor cells in biochemical recurrence of
of resistance to intermittent androgen deprivation in patients with prostate prostate cancer. Clin. Genitourin. Cancer 13, e341–e345 (2015).
cancer identified by a novel computational method. Cancer Res. 74, 41. Tu, S. M. & Lin, S. H. Prostate cancer stem cells. Clin. Genitourin. Cancer 10,
3673–3683 (2014). 69–76 (2012).
13. Portz T., Kuang, Y., Nagy, J. A clinical data validated mathematical model of 42. Glass, L. Synchronization and rhythmic processes in physiology. Nature 410,
prostate cancer growth under intermittent androgen suppression therapy AIP 277–284 (2001).
Advances 2, 0110022 (2012). 43. Matsu-Ura, T. et al. Intercellular coupling of the cell cycle and circadian clock
14. Elishmereni, M. et al. Predicting time to castration resistance in hormone in adult stem cell culture. Mol. Cell 64, 900–912 (2016).
sensitive prostate cancer by a personalization algorithm based on a 44. Banks H. T., Tran H. T. Mathematical and Experimental Modeling of Physical
mechanistic model integrating patient data. Prostate 76, 48–57 (2016). and Biological Processes. Chapman and Hall (2009).
15. Collins, A. T. & Maitland, N. J. Prostate cancer stem cells. Eur. J. Cancer 42, 45. Olufsen, M. S. & Ottesen, J. T. A practical approach to parameter estimation
1213–1218 (2006). applied to model predicting heart rate regulation. J. Math. Biol. 67, 39–68
16. Enderling, H. Cancer stem cells: small subpopulation or evolving fraction? (2013).
Integr. Biol. 7, 14–23 (2015). 46. Poli, R., Kennedy, J. & Blackwell, T. Particle swarm optimization. Swarm
17. Maitland, N. J. & Collins, A. T. Prostate cancer stem cells: a new target for Intell. 1, 33 (2007).
therapy. J. Clin. Oncol. 26, 2862–2870 (2008). 47. Jaworska D., Szliszka E. Targeting apoptotic activity against prostate cancer
18. Isaacs, J. T. & Coffey, D. S. Etiology and disease process of benign prostatic stem cells. Int. J. Mol. Sci. 18, pii: E1648 (2017).
hyperplasia. Prostate Suppl. 2, 33–50 (1989).
19. Collins, A. T., Berry, P. A., Hyde, C., Stower, M. J. & Maitland, N. J.
Prospective identification of tumorigenic prostate cancer stem cells. Cancer Acknowledgements
Res 65, 10946–10951 (2005). We thank participants of the clinical trial and Dr. Bruchovsky for sharing the data. We
20. Bruchovsky, N., Rennie, P. S., Coldman, A. J., Goldenberg, S. L., To M & also thank our patient advocate Mr. Robert Butler for fruitful discussions. This work was
Lawson, D. Effects of androgen withdrawal on the stem cell composition of supported by NIH/NCI 1R21CA234787-01A1 “Predicting patient-specific responses to
the Shionogi carcinoma. Cancer Res. 50, 2275–2282 (1990). personalize ADT for prostate cancer”, and in part by NIH/NCI U54CA143970-05
21. Lee, S. O. et al. New therapy targeting differential androgen receptor signaling (Physical Science Oncology Network) “Cancer as a complex adaptive system”, the Ocala
in prostate cancer stem/progenitor vs. non-stem/progenitor cells. J. Mol. Cell Royal Dames for Cancer Research, Inc., and The JAYNE KOSKINAS TED GIOVANIS
Biol. 5, 14–26 (2013). FOUNDATION FOR HEALTH AND POLICY, a Maryland private foundation dedi-
22. Bruchovsky, N. et al. Final results of the Canadian prospective phase II trial of cated to effecting change in health care for the public good. The opinions, findings, and
intermittent androgen suppression for men in biochemical recurrence after conclusions or recommendations expressed in this material are those of the authors and
radiotherapy for locally advanced prostate cancer: clinical parameters. Cancer not necessarily those of the JAYNE KOSKINAS TED GIOVANIS FOUNDATION FOR
107, 389–395 (2006). HEALTH AND POLICY, its directors, officers, or staff.
23. Baxter W. C., Stanley J. S., Zhang Q., Smith W. D. Developing artificial neural
network models of water treatment processes: a guide for utilities. J. Environ.
Eng. Sci. 1, 201–211 (2002). Author contributions
24. Johnson, C. H. Circadian clocks and cell division: what’s the pacemaker? Cell R.B., A.Z.W., T.Z., J.D.N., and H.E. conceptualized the study. R.B, J.D.N, T.A.G., and H.
Cycle 9, 3864–3873 (2010). E. performed the modeling and statistical analyses. R.B., J.D.N., T.A.G., T.Z., A.Z.W., J.Z.,
25. Fawcett T. An introduction to ROC analysis. Pattern Recognit. Lett. 27, R.A.G., and H.E. wrote the manuscript.
861–874 (2005).
26. Hussain, M. et al. Intermittent versus continuous androgen deprivation in
prostate cancer. N. Engl. J. Med. 368, 1314–1325 (2013). Competing interests
27. Chi, K. N. et al. Apalutamide for metastatic, castration-sensitive prostate Provisional patent application entitled “Methods for PCa intermittent adaptive therapy”.
cancer. N. Engl. J. Med. 381, 13–24 (2019). Applicants/inventors: Renee Brady-Nicholls, Heiko Enderling; application number: 62/
28. Hoyle, A. P. et al. Abiraterone in “high-“ and “low-risk” metastatic hormone- 944.804; status: provisionally filed. The patent covers methods related to using the
sensitive prostate cancer. Eur. Urol. 76, 719–728 (2019). mathematical model to adjust an individual patient’s treatment administration (both
29. James, N. D. et al. Addition of docetaxel, zoledronic acid, or both to first-line timing and alternative treatment options), thereby increasing TTP. T.Z.: Research
long-term hormone therapy in prostate cancer (STAMPEDE): survival results funding: Acerta, Novartis, Merrimack, Abbvie/StemCentrx, Merck, Regeneron, Mirati
from an adaptive, multiarm, multistage, platform randomised controlled trial. Therapeutics, Janssen, Astra Zeneca, Pfizer, OmniSeq, Personal Genome Diagnostics,
Lancet 387, 1163–1177 (2016). Seattle Genetics; Speakers Bureau: Genentech/Roche, Exelixis, Sanofi-Aventis, Genomic
30. Kyriakopoulos, C. E. et al. Chemohormonal therapy in metastatic hormone- Health; Advisory Board: Genentech/Roche, Merck, Exelixis, Sanofi-Aaventis, Janssen,
sensitive prostate cancer: long-term survival analysis of the randomized phase Astra Zeneca, Pfizer, Amgen, BMS, Pharmacyclics, Seattle Genetics, Bayer; Consultant:
III E3805 CHAARTED trial. J. Clin. Oncol. 36, 1080–1087 (2018). Bayer, Astra Zeneca, Foundation Medicine; Employee: Capio Biosciences, Archimmune
31. Vale, C. L. et al. Addition of docetaxel or bisphosphonates to standard of care Therapeutics (spouse); Stockholder: Capio Biosciences, Archimmune Therapeutics
in men with localised or metastatic, hormone-sensitive prostate cancer: a (spouse); A.Z.W.: Cofounder, stockholder and consultant: Capio Biosciences, Archim-
systematic review and meta-analyses of aggregate data. Lancet Oncol. 17, mune Therapeutics; J.Z.: Consultant: Dendreon, Advisory Board: AstraZeneca, Bayer,
243–256 (2016). Clovis Oncology, Seattle Genetics, Speaker Bureau: Merck, Sanofi. All other authors
32. Singh, S. K. et al. Identification of a cancer stem cell in human brain tumors. declare no competing interests.
Cancer Res. 63, 5821–5828 (2003).
33. Boerrigter E., Groen L. N., Van Erp N. P., Verhaegh G. W., Schalken J. A.
Clinical utility of emerging biomarkers in prostate cancer liquid biopsies.
Expert. Rev. Mol. Diagn. 20, 219–230 (2020). Additional information
34. Stankova, K., Brown, J. S., Dalton, W. S. & Gatenby, R. A. Optimizing cancer Supplementary information is available for this paper at https://doi.org/10.1038/s41467-
treatment using game theory: a review. JAMA Oncol. 5, 96–103 (2019). 020-15424-4.
35. Gravis, G. et al. Androgen deprivation therapy (ADT) plus docetaxel versus
ADT alone in metastatic non castrate prostate cancer: impact of metastatic Correspondence and requests for materials should be addressed to R.A.G. or H.E.
burden and long-term survival analysis of the randomized phase 3 GETUG-
AFU15 trial. Eur. Urol. 70, 256–262 (2016). Peer review information Nature Communications thanks Martin Nowak and the other,
36. Brady R., Enderling H. Mathematical models of cancer: when to predict novel anonymous, reviewer(s) for their contribution to the peer review of this work. Peer
therapies, and when not to. Bull. Math Biol. 81, 3722–3731 (2019). reviewer reports are available.
37. Lee, D. K. et al. Progression of prostate cancer despite an extremely low serum
level of prostate-specific antigen. Korean J. Urol. 51, 358–361 (2010). Reprints and permission information is available at http://www.nature.com/reprints
38. Thompson, I. M. et al. Prevalence of prostate cancer among men with a
prostate-specific antigen level < or =4.0 ng per milliliter. N. Engl. J. Med. 350, Publisher’s note Springer Nature remains neutral with regard to jurisdictional claims in
2239–2246 (2004). published maps and institutional affiliations.
12 NATURE COMMUNICATIONS | (2020)11:1750 | https://doi.org/10.1038/s41467-020-15424-4 | www.nature.com/naturecommunicationsYou can also read