Effects of temperature frequency trends on projected japonica rice (Oryza sativa L.) yield and dry matter distribution with elevated carbon ...
←
→
Page content transcription
If your browser does not render page correctly, please read the page content below
Effects of temperature frequency trends
                                        on projected japonica rice (Oryza sativa
                                        L.) yield and dry matter distribution with
                                        elevated carbon dioxide
                                        Zeyu Zhou1 ,2 , Jiming Jin1 ,2 , Libing Song1 ,2 and Ling Yan1 ,2
                                    1
                                      College of Water Resources and Architectural Engineering, Northwest A&F University, Yangling,
                                      Shaanxi Province, China
                                    2
                                      Key Laboratory of Agricultural Soil and Water Engineering in Arid and Semiarid Areas, Ministry of
                                      Education, Northwest A&F University, Yangling, Shaanxi Province, China

                                            ABSTRACT
                                            In this study, we investigated the effects of temperature frequency trends on the
                                            projected yield and dry matter distribution of japonica rice (Oryza sativa L.) with
                                            elevated carbon dioxide (CO2 ) under future climate change scenarios in northwestern
                                            China. The Crop Environment Resource Synthesis (CERES)-Rice model was forced
                                            with the outputs from three general circulation models (GCMs) to project the rice
                                            growth and yield. Future temperature trends had the most significant impact on rice
                                            growth, and the frequency of higher than optimal temperatures (∼24–28 o C) for rice
                                            growth showed a marked increase in the future, which greatly restricted photosynthesis.
                                            The frequency of extreme temperatures (>35 o C) also increased, exerting a strong
                                            impact on rice fertilization and producing a significantly reduced yield. Although
                                            the increased temperature suppressed photosynthetic production, the elevated CO2
                                            stimulated this production; therefore, the net result was determined by the dominant
                                            process. The aboveground biomass at harvest trended downward when temperature
                                            became the major factor in photosynthetic production and trended upward when
                                            CO2 -fertilization dominated the process. The trends for the leaf and stem dry matter at
                                            harvest were affected not only by changes in photosynthesis but also by the dry matter
Submitted 19 August 2020                    distribution to the panicles. The trends for the rice panicle dry matter at harvest were
Accepted 8 February 2021                    closely related to the effects of temperature and CO2 on photosynthetic production, and
Published 11 March 2021                     extreme temperatures also remarkably affected these trends by reducing the number
Corresponding author                        of fertilized spikelets. The trends of rice yield were very similar to those of panicle dry
Jiming Jin, jimingjin99@gmail.com           matter because the panicle dry matter is mostly composed of grain weight (yield). This
Academic editor                             study provides a better understanding of the japonica rice processes, particularly under
Guobin Fu                                   extreme climate scenarios, which will likely become more frequent in the future.
Additional Information and
Declarations can be found on
page 19                                 Subjects Agricultural Science, Plant Science, Climate Change Biology, Environmental Impacts
DOI 10.7717/peerj.11027                 Keywords CERES-Rice model, Temperature frequency, Photosynthetic production, CO2 ,
                                        Fertilized spikelet number, Rice yield
    Copyright
2021 Zhou et al.

Distributed under                       INTRODUCTION
Creative Commons CC-BY 4.0
                                        Rice (Oryza sativa L.) is one of the most important grain crops to ensure current and future
OPEN ACCESS                             food security. Due to its high suitability for many growing environments, rice can be planted

                                        How to cite this article Zhou Z, Jin J, Song L, Yan L. 2021. Effects of temperature frequency trends on projected japonica rice (Oryza
                                        sativa L.) yield and dry matter distribution with elevated carbon dioxide. PeerJ 9:e11027 http://doi.org/10.7717/peerj.11027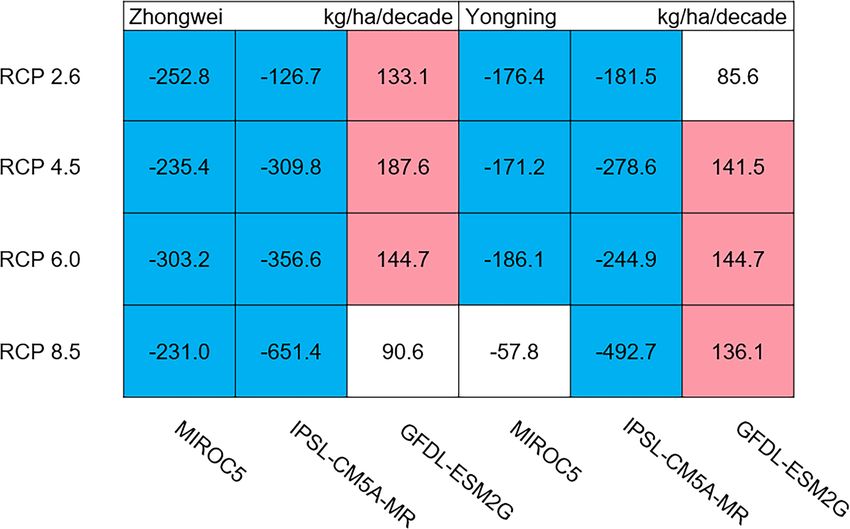
in a wide range of climate conditions (Maclean et al., 2002). Except for Antarctica, rice is
                                   grown on all continents, with a planting area of more than 1.6 million km2 (FAOSTAT,
                                   2017). With such a vast area, rice has become the staple food for over half the world’s
                                   population (Gross & Zhao, 2014; Sawano et al., 2008). However, Wailes & Chavez (2012)
                                   predicted that rice consumption would continue to increase with increasing population
                                   but that the planting area would remain unchanged. Therefore, high rice production is
                                   essential for food security and even social stability.
                                       Compared with the rice grown in low-latitude regions (indica rice), japonica rice planted
                                   in mid-latitude regions has a higher yield. Generally, japonica rice has a longer growth
                                   period than indica rice, resulting in a longer grain filling duration and thus a higher
                                   yield (Ying et al., 1998; Kropff et al., 1994). In addition, the sunshine hours in mid-latitude
                                   regions are longer than those in low-latitude regions during the summer (the rice growth
                                   period). For example, in China, the sunshine hours in Jilin, Liaoning, and Ningxia provinces
                                   (mid-latitude regions) are ∼7.4–8.4 h during the rice growth period over 1960 through
                                   2014, but are ∼5.9–6.0 h in Fujian and Guangdong provinces (low-latitudes regions) (these
                                   data were provided by the China Meteorological Administration). Such longer sunshine
                                   hours are beneficial for the higher photosynthetic production (Yu et al., 2014; Zhang et al.,
                                   1992) of japonica rice.
                                       Although the cultivars, management practices, rice types or other factors are associated
                                   with the rice yield, the sunshine hours still play a significant role. In China, rice yields in
                                   most low-latitude provinces were less than 6,000 kg/ha, but they were over 8,000 kg/ha in
                                   the mid-latitude provinces (National Bureau of Statistics of China, 2007-2016). The average
                                   indica rice yields were only about 2,200 kg/ha in India, a low-latitude country (Ministry of
                                   Agriculture in India, 2015). Japonica rice yields reached 7,000–8,000 kg/ha in Japan (Kato,
                                   Okami & Katsura, 2009), and even 10,700 kg/ha in Australia (Chauhan, Jabran & Mahajan,
                                   2017), both of which are mid-latitude countries. Therefore, the high yield of japonica rice
                                   is an important reason for it to be planted in the mid-latitudes.
                                       Climate change has significant effects on rice growth and yield. When the daytime
                                   temperature (DT) is above the optimal value (∼26 ◦ C) for rice growth (Singh & Padilla,
                                   1995), photosynthesis is weakened (Mathur, Agrawal & Jajoo, 2014; Feng et al., 2007;
                                   Makino & Sage, 2007) and grain filling duration is shortened (Abayawickrama et al.,
                                   2017; Ahmed et al., 2015; Kim et al., 2011b), resulting in a decreased yield. When the
                                   daily maximum temperature is over 35 ◦ C, rice spikelet fertilization is greatly restricted
                                   (Madan et al., 2012; Jagadish, Craufurd & Wheeler, 2007; Jagadish, Craufurd & Wheeler,
                                   2008; Yoshida, Satake & Mackill, 1981; Satake & Yoshida, 1978), further lowering the yield.
                                   On the other hand, carbon dioxide (CO2 ) is critical for photosynthesis, and elevated CO2
                                   concentrations can accelerate carbon assimilation, enhancing photosynthetic production
                                   and increasing the rice yield (Yang et al., 2006; Lieffering et al., 2004; Kimball, Kobayashi &
                                   Bindi, 2002). Hence, examining the combined effects of temperature and CO2 is essential
                                   to the prediction of rice production under climate change.
                                       Field experiments in chambers have been conducted with different combinations of
                                   temperature and CO2 concentration. Roy et al. (2012) carried out a field experiment in
                                   India for three years to observe the effects of ambient CO2 (390 ppm in a control chamber),

Zhou et al. (2021), PeerJ, DOI 10.7717/peerj.11027                                                                           2/25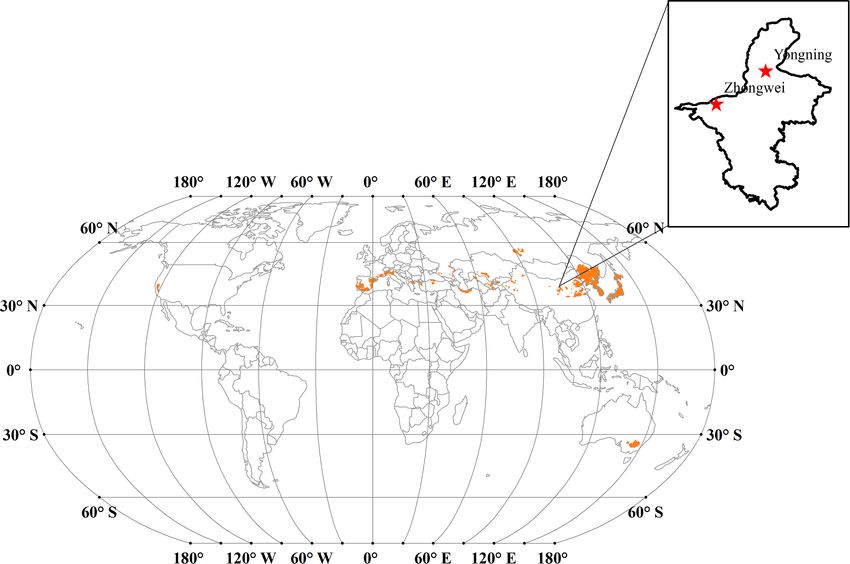
elevated CO2 (550 ppm), and elevated CO2 (550 ppm) with elevated temperature (+2 ◦ C
                                   over the control chamber) on dry matter production, and the CO2 treatments were
                                   maintained throughout the entire rice growth season. Compared with the control chamber,
                                   the photosynthesis and each rice organ dry matter had a significant increase under the other
                                   two treatments, and there were no significant differences between these two treatments.
                                      Kim et al. (2011a) also conducted a similar experiment in South Korea, with 380 ppm
                                   ambient CO2 , 662 ppm elevated CO2 , and 2 ◦ C elevated temperature. Their results suggested
                                   that rice photosynthesis was enhanced with elevated CO2 and/or temperature; however,
                                   the whole plant dry matter in elevated CO2 and temperature was much larger than that in
                                   elevated CO2 alone. In addition, the dry matter distribution showed an inconsistent trend
                                   in different organs. The elevated temperature effect reduced the dry matter allocation to
                                   the panicle due to decreased spikelet numbers, significantly increasing the leaf and stem
                                   dry matter, while the elevated CO2 can alleviate this effect. Thus, the panicle dry matter
                                   under elevated CO2 and temperature was less than that in elevated CO2 ; however, the dry
                                   matter of the leaf and stem was larger than the latter.
                                      Although the experimental operation matters, the different magnitude combinations
                                   of temperature and CO2 concentration set were a key reason causing the differences
                                   between their results. This also resulted in differences in the dry matter accumulation
                                   and distribution among rice organs in recent studies (Wang et al., 2019a; Nam et al., 2013;
                                   Cheng et al., 2010). The temperature and CO2 concentration are closely coupled at a
                                   long-term temporal scale, and the combinations of these two variables in the experimental
                                   chambers may not reflect the actual long-term relationship between them. Hence, the
                                   response of rice growth to temperature and CO2 concentration may be different in reality.
                                      Crop models are driven by various combinations of temperature and CO2 concentration
                                   generated with general circulation models (GCMs) (Kim et al., 2013; Iizumi, Yokozawa
                                   & Nishimori, 2011; Tao et al., 2008). These combinations are based on the physical
                                   relationship between these two variables, overcoming the drawback of the often randomly
                                   set values in the experimental chambers. In addition, these modeling studies indicated
                                   that high temperature shortened the rice growth period and reduced the yield, while
                                   CO2 -fertilization tended to increase the yield (Kim et al., 2013; Iizumi, Yokozawa &
                                   Nishimori, 2011; Tao et al., 2008). However, less attention has been paid to changes in
                                   the physiological processes during rice growth with different combinations of temperature
                                   and CO2 concentration, which needs to be further investigated.
                                      The objectives of this study are: (1) to quantify the effects of different combinations of
                                   temperature and CO2 concentration on the japonica rice yield and dry matter distribution
                                   with the Crop Environment Resource Synthesis (CERES)-Rice model driven by the outputs
                                   of three GCMs with different greenhouse gas emission scenarios, and (2) to explore the
                                   influence of extreme temperature (>35 ◦ C) frequency projections on japonica rice growth
                                   and yield. In the following, ‘Materials & Methods’ introduced the study area, data, and
                                   methodology, ‘Results’ presents the results, ‘Discussion’ includes the discussion, and
                                   ‘Conclusion’ describes the conclusions.

Zhou et al. (2021), PeerJ, DOI 10.7717/peerj.11027                                                                         3/25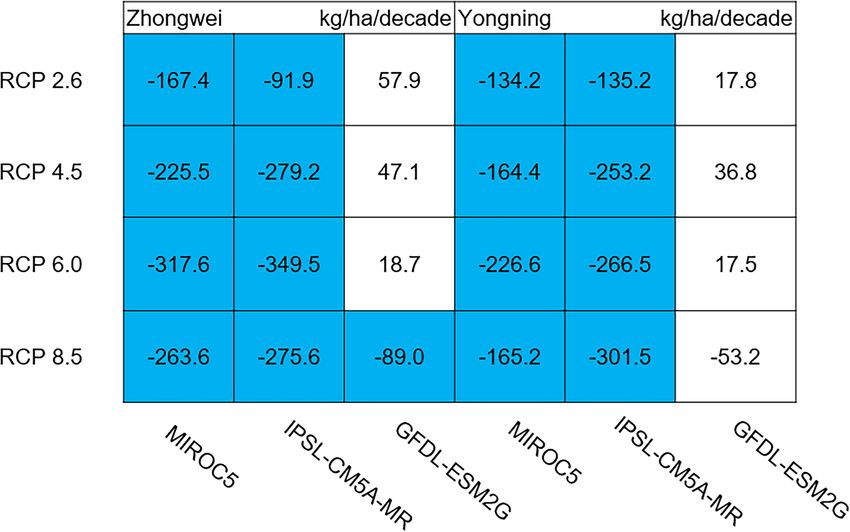
Figure 1 The major japonica rice cultivation areas (orange areas) across the world. Note: Map of rice
                                     production across the world is from Andrew (2010), and the license of this map is CC BY SA 3.0. Available
                                     at: https://commons.wikimedia.org/w/index.php?curid=9643470 We extracted the primary japonica rice
                                     planting regions based on Chauhan, Jabran & Mahajan (2017) and Thompson (2002).
                                                                                                    Full-size DOI: 10.7717/peerj.11027/fig-1

                                   MATERIALS & METHODS
                                   Study area
                                   Japonica rice is typically grown in temperate regions (Chauhan, Jabran & Mahajan, 2017;
                                   Mackill & Lei, 1997). The major japonica rice cultivation areas are located in northeastern
                                   China, Korea, Japan, New South Wales of Australia, and European countries among the
                                   Mediterranean Sea (Fig. 1). We calculated the annual mean cumulative growing degree
                                   days (GDD) over 1901 through 2016 for these regions based on the temperature data from
                                   the Climate Research Unit-National Centers for Environmental Prediction (CRUNCEP;
                                   Viovy, 2011). The cumulative GDDs were mostly between 1,000–2,600 ◦ C day in these
                                   regions, and the base temperature was set to 9 ◦ C in our calculation based on Singh,
                                   Ritchie & Godwin (1993). For this study, we selected the Zhongwei (37.53◦ N, 105.18◦ E)
                                   and Yongning (38.25◦ N, 106.25◦ E) rice field stations, which are located about 125 km apart
                                   in Ningxia province, China (Fig. 1) and have a typical temperate continental climate. Due
                                   to the high production and excellent quality, japonica rice has been planted in this region
                                   for about 2,000 years (Wang et al., 2013) where the GDD is about 1,800 ◦ C day based on
                                   the temperature data for the period of 1901–2016.

Zhou et al. (2021), PeerJ, DOI 10.7717/peerj.11027                                                                                        4/25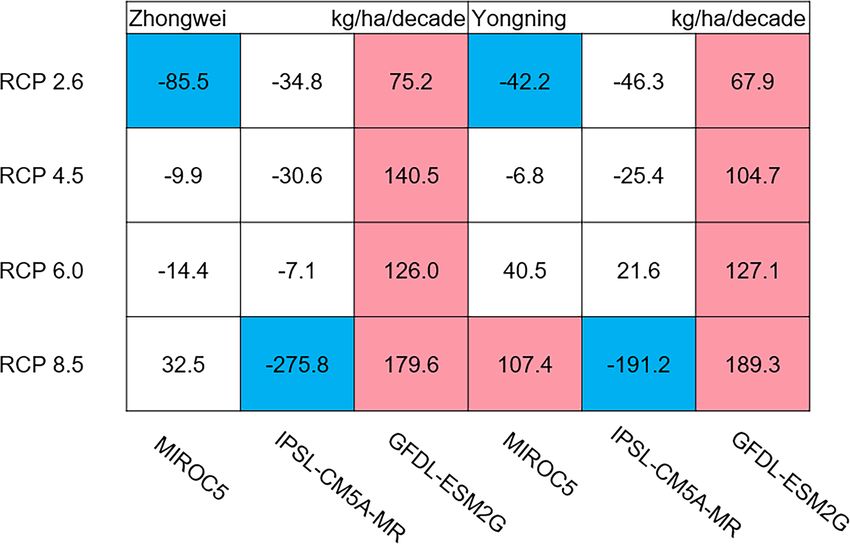
Table 1 Detailed information about soil properties.

                                     Depth           Clay      Silt       Sand        Organic   Total         pH       Cation
                                     (cm)            %         %          %           carbon    nitrogen               exchange
                                                                                      (g/kg)    (g/kg)                 capacity
                                                                                                                       (cmol/kg)
                                     0–20            23.0      33.7       43.3        14.8      1.10          8.1      11.1
                                     20–55           25.0      32.5       42.5        11.2      1.07          8.4      10.3
                                     55–120          18.5      31.5       50.0        7.0       0.43          8.4      9.4

                                   Input data for the CERES-Rice model
                                   Historical weather data, field management information, soil properties, and rice cultivar
                                   parameters are needed to drive the CERES-Rice model. Historical weather data were
                                   derived from the China Meteorological Forcing Dataset (CMFD) (He et al., 2020; Yang et
                                   al., 2010), including the daily maximum temperature (Tmax ), daily minimum temperature
                                   (Tmin ), daily precipitation, and daily incoming solar radiation. These data cover China with
                                   a spatial resolution of 0.1◦ at 3-hour time steps for the period of 1979 to 2015. In this study,
                                   we averaged the weather data for each station over the nine surrounding grids to reduce
                                   the uncertainty. The field management information required by the CERES-Rice model
                                   was provided by the Ningxia Meteorological Bureau, China. This information included
                                   detailed phenology dates, yields, amounts and dates of fertilization and irrigation, etc. Soil
                                   data were collected from the China soil database (http://vdb3.soil.csdb.cn/) as shown in
                                   Table 1. We used the rice cultivar Ningjing No. 16, a common japonica rice cultivar in
                                   the study area. All data from the Zhongwei station were used to calibrate the CERES-Rice
                                   model, and data from the Yongning station were used for model validation.
                                       The future climate data used to drive the CERES-Rice model were derived from the
                                   outputs of three GCMs (Table 2) with four Representative Concentration Pathways (RCPs)
                                   (2.6, 4.5, 6.0, and 8.5) from the Coupled Model Intercomparison Project Phase 5 (Taylor,
                                   Stouffer & Meehl, 2012). These three GCMs represent different warming intensities, where
                                   the temperature increase was the most aggressive in IPSL-CM5A-MR, moderately aggressive
                                   in MIROC5, and least aggressive in GFDL-ESM2G (Hsu et al., 2013). The variables we used
                                   from these GCMs were Tmax , Tmin , precipitation, and incoming solar radiation. We also
                                   used the projected future CO2 concentrations from Prather et al. (2013) to consider the
                                   effects of CO2 on rice growth. Future projections in this study were made using the cultivar
                                   Ningjing No. 16, and the transplanting date was set to May 12 each year, a time when
                                   rice transplanting is commonly done (Liu et al., 2017; Sang, Liu & Qiu, 2006). According
                                   to the local farmers’ experience, transplanting was set at a hill spacing of 25×10 cm with
                                   six seedlings per hill (Chen, 2012; Ma et al., 2003; Wang, Yin & An, 1996). A total of 290
                                   kg/ha of nitrogen fertilizer was applied to the rice field each year, the maximum value in
                                   the records, to ensure that there was no nitrogen stress during the rice growth period. The
                                   other field management information, such as full irrigation, and soil data were the same as
                                   in the historical runs.

                                   Methodology

Zhou et al. (2021), PeerJ, DOI 10.7717/peerj.11027                                                                            5/25
Table 2 Detailed information about the three GCMs selected in this study.

                                     GCM                      Resolution         Modeling Center
                                                                   ◦     ◦
                                     MIROC5                   1.4 × 1.4          Atmosphere and Ocean Research Institute (The University
                                                                                 of Tokyo), National Institute for Environmental
                                                                                 Studies, and Japan Agency for Marine-Earth Science
                                                                                 and Technology
                                     IPSL-CM5A-MR             2.5◦ × 1.3◦        Institute Pierre-Simon Laplace MR: Medium resolution
                                     GFDL-ESM2G               2.5◦ × 2.0◦        Geophysical Fluid Dynamics Laboratory

                                     Table 3 Effect of CO2 on rice photosynthesis.

                                     CO2 /ppm        0      220        330    440      550      660      770     880      990     9999
                                     PCO2            0.00   0.71       1.00   1.08     1.17     1.25     1.32    1.38     1.43    1.50

                                   The CERES-Rice model
                                   The CERES-Rice model is one of the crop models in the Decision Support System for
                                   Agrotechnology Transfer (DSSAT) family (Version 4.6) (Jones et al., 2003). The model
                                   simulates rice phenology development based on the GDDs calculated with the daily
                                   average temperature. Photosynthetic production accumulation and allocation to each
                                   organ are associated with the growth stage and the stress factors, such as temperature,
                                   CO2 , nitrogen, and water. In this study, no nitrogen or water stress existed during the rice
                                   growth period, and temperature and CO2 were the main factors affecting photosynthesis.
                                   In the CERES-Rice model, the optimal DT for rice photosynthesis is set at 26 ◦ C (Singh &
                                   Padilla, 1995). A quadratic equation is used to calculate the temperature reduction factor
                                   (PRFT) that affects photosynthesis (Ritchie et al., 1998):

                                   PRFT = 1.0 − 0.0025 × ((0.75Tmax + 0.25Tmin ) − 26.0)2                                               (1)

                                       PRFT is applied to the calculation of photosynthetic production in the CERES-Rice
                                   model. When PRFT is equal to 1.0, this indicates no temperature stress on photosynthesis,
                                   and when it is equal to 0.0, there is the maximum temperature stress. The effects of CO2
                                   concentration on rice photosynthesis are also taken into account in the CERES-Rice model
                                   (Peart et al., 1988). A factor (PCO2) representing these effects was applied to the calculation
                                   of photosynthetic production based on Table 3. In this lookup table, the PCO2 value and
                                   corresponding CO2 concentration are prescribed in the model based on Peart et al. (1988).
                                   The PCO2 value of any given CO2 concentration was calculated with a linear interpolation
                                   between the two nearest factors whose weights were computed according to the given and
                                   two corresponding CO2 concentrations.

                                   Downscaling and trend calculation
                                   For this study, statistical downscaling was performed to transform the coarse-resolution
                                   GCM data (1.3◦ –2.5◦ ) into the station data from Zhongwei and Yongning to reduce the
                                   uncertainty in the GCM data. The CMFD data were used as observations for downscaling.
                                   We first used bilinear interpolation to downscale these 3-hourly GCM data, except
                                   precipitation, to the resolution of CMFD (0.1◦ ). Second, the downscaled data were

Zhou et al. (2021), PeerJ, DOI 10.7717/peerj.11027                                                                                      6/25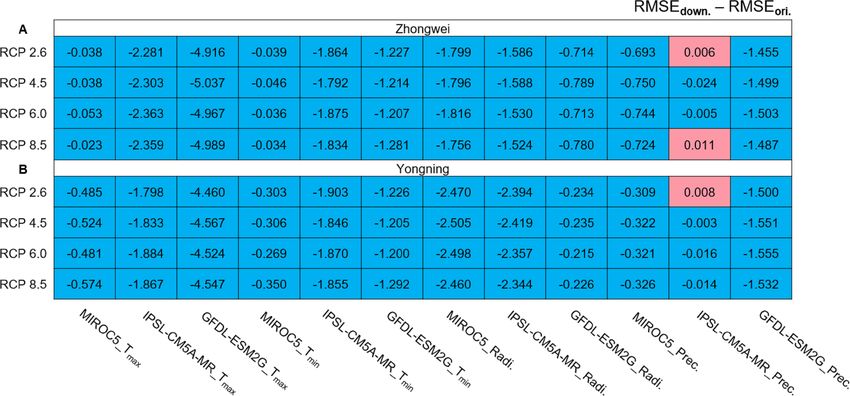
Table 4 Genotype parameters of Ningjing No. 16 for the CERES-Rice model.

                                     Genotype parameter                                                              GLUE
                                                                                                                     Optimized
                                                                                                                     value
                                     P1: GDD for basic vegetative phase (◦ C day)                                    321.9
                                     P2O: Critical photoperiod (hour)                                                12.5
                                     P2R: Photoperiod sensitivity coefficient (◦ C day)                              51.5
                                                                                          ◦
                                     P5: GDD from beginning of grain filling to maturity ( C                         508.0
                                     day)
                                     G1: Potential grain number coefficient                                          55.7
                                     G2: Single grain weight (g)                                                     0.024
                                     G3: Tillering coefficient                                                       1.0
                                     G4: Temperature tolerance coefficient                                           1.0
                                     PHINT: phyllochron                                                              83.0

                                   statistically bias-corrected by maintaining the probability distributions of historical values
                                   similar to those of CMFD through linear regression models (Dettinger et al., 2004). In
                                   addition, we used daily downscaled precipitation data (Abatzoglou, 2013) with the method
                                   described by Buotte et al. (2019) to create 3-hourly precipitation data for the selected GCMs,
                                   and then interpolated these new precipitation data to 0.1◦ using bilinear interpolation.
                                   Through downscaling and bias-corrections, the biases in these GCM outputs were reduced
                                   for the historical period, making the future projections more reliable. Meanwhile, the
                                   long-term trends of the downscaled climate and simulated rice growth and development
                                   variables were calculated for the period of 2006–2100. The significance of these trends was
                                   examined with the Mann–Kendall test (Hamed, 2008) using R programming language.

                                   RESULTS
                                   Parameter estimation and model evaluation
                                   The crop genotype parameters in CERES-Rice were optimized with the Generalized
                                   Likelihood Uncertainty Estimation (GLUE) package (He et al., 2010) using seven-year
                                   available agricultural experiment data from the Zhongwei station. These optimized
                                   parameters were validated with data from the Yongning station (Table 4). In this study,
                                   we used the absolute relative error (ARE) and the least normalized root mean square error
                                   (nRMSE) to evaluate the performance of the CERES-Rice model. The largest AREs of
                                   the anthesis and maturity dates were less than 11% for the two stations. Except for the
                                   Yongning station in 1997, all the AREs of the simulated rice yield were less than 13%
                                   (Figs. 2 and 3). Ritchie et al. (1998) indicated that the quality of DSSAT simulations with
                                   AREs of less than 15% are considered acceptable. In addition, He et al. (2017) suggested
                                   that a crop model performance is considered reasonable when the nRMSE is less than 15%.
                                   Therefore, the GLUE-optimized genotype parameters for the CERES-Rice model can be
                                   employed to study the effects of future climate on rice growth and development.

                                   Climate change projections

Zhou et al. (2021), PeerJ, DOI 10.7717/peerj.11027                                                                           7/25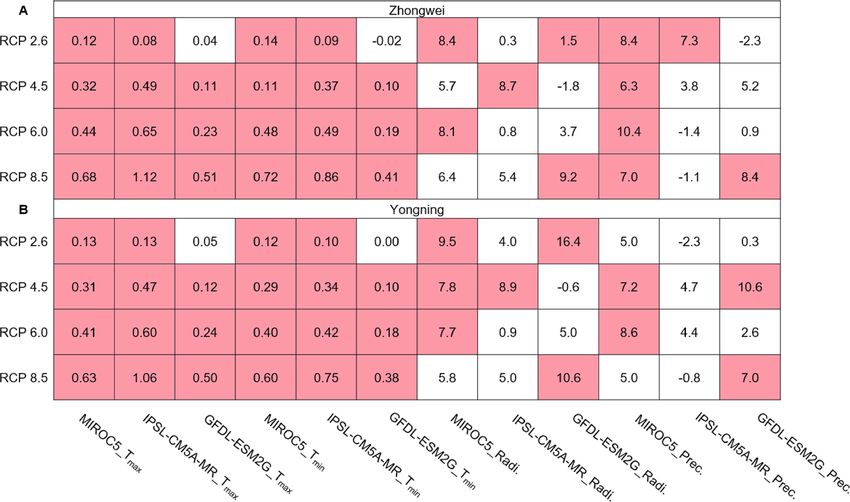
Figure 2 Comparison between rice phenology simulations and observations for (A –B) the Zhong-
                                     wei station and (C–D) the Yongning station. The numbers above the bars are AREs. RMSE is root mean
                                     square error, and nRMSE is equal to RMSE divided by the mean value of observations.
                                                                                                Full-size DOI: 10.7717/peerj.11027/fig-2

Zhou et al. (2021), PeerJ, DOI 10.7717/peerj.11027                                                                                  8/25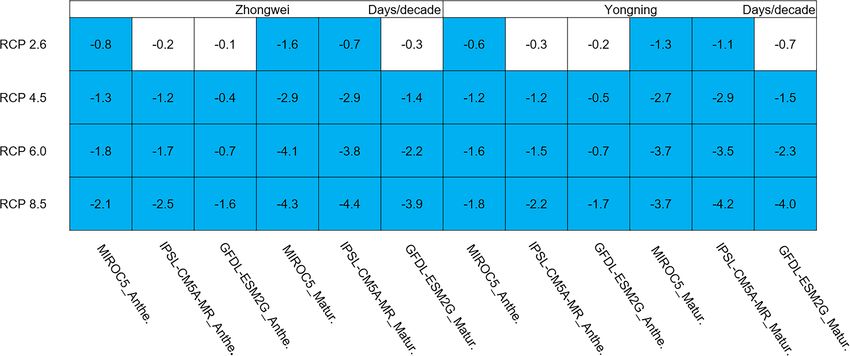
Figure 3 Comparison between rice yield simulations and observations for (A) the Zhongwei station
                                     and (B) the Yongning station. The numbers above the bars are AREs. RMSE is root mean square error,
                                     and nRMSE is equal to RMSE divided by the mean value of observations.
                                                                                                  Full-size DOI: 10.7717/peerj.11027/fig-3

                                   GCM data downscaling
                                   We calculated the root mean square error (RMSE) differences between the downscaled and
                                   original GCM data for the period of 1979–2015 (Fig. 4). The observational data used for the
                                   calculations were the CMFD data. All the RMSEs were reduced with the downscaled data
                                   except for those with precipitation in the three red boxes simulated by IPSL-CM5A-MR
                                   (Fig. 4). These RMSE increases were very minor and negligible. Thus, statistical downscaling
                                   improved the quality of the historical GCM data and should be capable of generating more
                                   reliable future projections.

                                   Trends of climate variable projections
                                   The annual averaged Tmax and Tmin showed a significantly upward trend with most
                                   greenhouse gas emission scenarios over the rice growth period, while the solar radiation
                                   and precipitation trends were mostly insignificant over the same period (Fig. 5). In most
                                   of our study cases (92%), the trends of Tmax and Tmin passed the 95% significance level
                                   (p < 0.05). The significant trend for Tmax ranged from 0.08 to 1.12 ◦ C /decade, while it
                                   ranged from 0.09 to 0.86 ◦ C /decade for Tmin . The largest Tmax and Tmin trends occurred
                                   with IPSL-CM5A-MR for RCP 8.5. Thus, these significant trends may affect future rice
                                   growth and development projections, as analyzed in the following sections.

Zhou et al. (2021), PeerJ, DOI 10.7717/peerj.11027                                                                                    9/25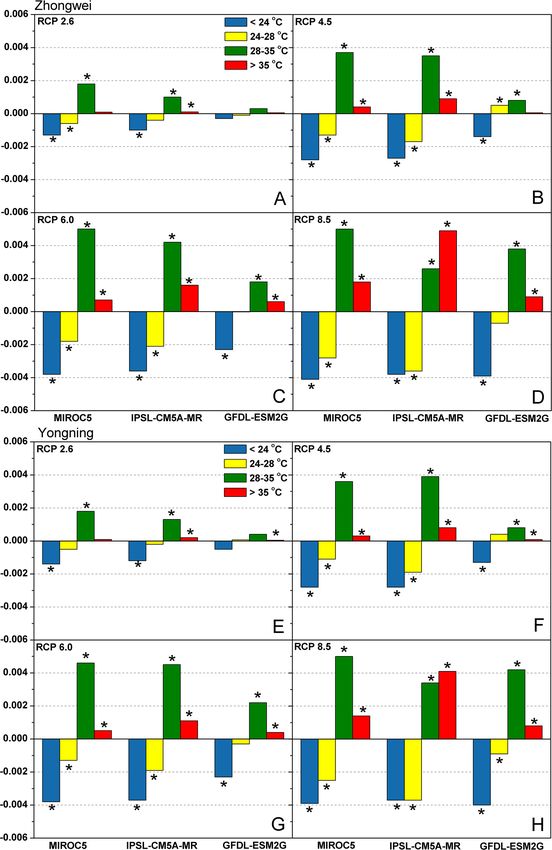
Figure 4 RMSE differences between downscaled and original GCM variables during 1979–2005 for (A)
                                     the Zhongwei station and (B) the Yongning station. For Tmax and Tmin the unit is ◦ C, for radiation it is
                                     MJ/m2 , and for precipitation it is mm.
                                                                                                  Full-size DOI: 10.7717/peerj.11027/fig-4

                                     Figure 5 Trends of Tmax and Tmin (◦ C/decade), solar radiation (MJ/decade), and precipitation
                                     (mm/decade) during the rice growth period over 2006–2100 for (A) the Zhongwei station and (B) the
                                     Yongning station. The red boxes show upward trends that pass the significance level test (p < 0.05), and
                                     the white boxes mean that this test is not passed.
                                                                                                  Full-size DOI: 10.7717/peerj.11027/fig-5

                                   Trends of temperature frequency
                                   In the CERES-Rice model, DT is defined as 0.75Tmax + 0.25Tmin (Ritchie et al., 1998), a
                                   temperature that is essential for photosynthesis. For this study, we divided the DT into four
                                   intervals: 35 ◦ C. The CERES-Rice model sets

Zhou et al. (2021), PeerJ, DOI 10.7717/peerj.11027                                                                                       10/25
26 ◦ C as the optimal DT for photosynthesis (Singh & Padilla, 1995), and DTs within the
range of (24 ◦ C, 28 ◦ C] reduce rice photosynthesis by less than 1% based on Eq. (1), which
is negligible. Hence, for rice photosynthesis, DTs falling within this temperature range were
defined as optimal (OT), 35 ◦ C were the extreme temperature (EMT). When the DT
was outside the optimal range in the CERES-Rice model, this played a significant role in
restricting rice photosynthesis.
Figure 6 shows the trends of LT, OT, HT, and EMT frequencies under all emission
scenarios for the two study stations over the rice growth period from 2006 to 2100. Clearly,
the frequencies of LT and OT decreased, while the frequencies of HT and EMT increased for
most study cases. EMT in IPSL-CM5A-MR with RCP 8.5 had the most dramatic increase
among all the cases. Such shifts indicated that higher temperatures became more dominant
under future climate change scenarios and had a strong potential to affect rice processes.
Impact of climate change on rice growth and development
Phenology
Rice phenology was shortened significantly in all study cases, 87.5% of which passed the
95% significance test (Fig. 7; blue boxes). Since the growth period was almost directly
proportional to the thermal time accumulation in the CERES-Rice model, the increased
temperature could accelerate this accumulation, leading to earlier anthesis and maturity
dates. For example, in the IPSL-CM5A-MR model with the fixed transplanting date (May
12), the anthesis date each year was 0.2, 1.2, 1.7, and 2.5 days/decade earlier for the
Zhongwei station, and the maturity date each year was 0.7, 2.9, 3.8, and 4.4 days/decade
earlier, corresponding to the RCP 2.6, RCP 4.5, RCP 6.0, and RCP 8.5 scenarios, respectively.
The shorter phenology reduced the grain filling duration, which could result in a decreased
rice yield.
Photosynthetic production
In this study, the accumulated photosynthetic production for the entire rice growth period
showed different trends under different climate change scenarios (Fig. 8). The IPSL-CM5A-
MR and MIROC5 models generated negative trends for all emission scenarios, while the
GFDL-ESM2G model produced positive trends. The majority of the trends (in blue and
red) passed the 95% significance level test. As discussed previously, when the temperature
was out of the optimal range, this reduced the photosynthetic production (Eq. (1)). Our
simulations showed that the temperature shifted from the low and optimal ranges toward
the high and extreme ones under almost all study scenarios (Fig. 6), and such shifts tended
to reduce the photosynthetic production. Thus, it is clear that the negative trends of
accumulated photosynthetic production were controlled by rising temperatures.
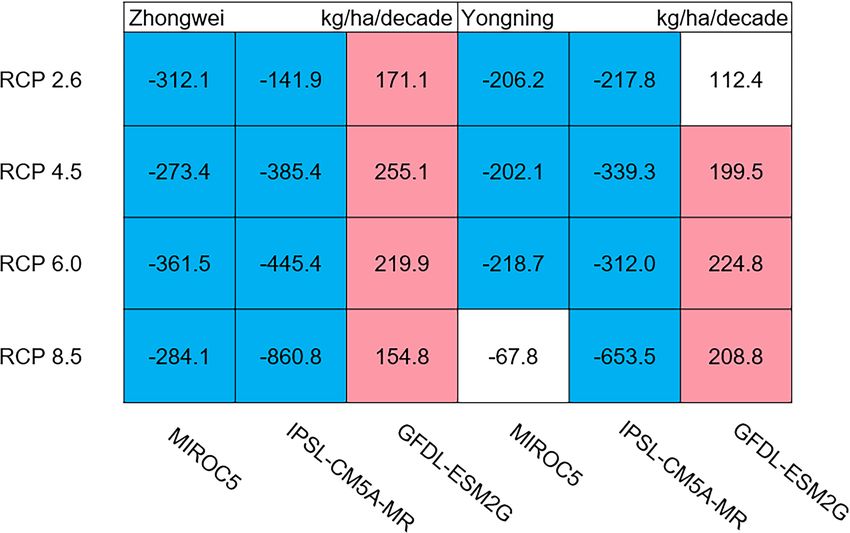
Aboveground biomass, leaf, stem, panicle, and yield
The dry matter accumulation of rice organs was strongly affected by the photosynthetic
intensity, whose long-term changes were very sensitive to the temperature frequency trends.
Figure 9 shows that the trends of aboveground biomass at harvest were very similar to those
of accumulated photosynthetic production, since the carbohydrates of the rice plant are
Zhou et al. (2021), PeerJ, DOI 10.7717/peerj.11027 11/25Figure 6 Trends of temperature frequency during the rice growth period over 2006–2100 for (A–D)
the Zhongwei station and (E–H) the Yongning station. The asterisk (*) indicates that the trend passes the
significance level test (p < 0.05).
Full-size DOI: 10.7717/peerj.11027/fig-6
Zhou et al. (2021), PeerJ, DOI 10.7717/peerj.11027 12/25Figure 7 Trends of rice phonology for 2006–2100. The blue boxes show downward trends that pass the
significance level test (p < 0.05), and the white boxes mean that this test is not passed.
Full-size DOI: 10.7717/peerj.11027/fig-7
Figure 8 Trends of accumulated rice photosynthetic production for the entire rice growth period
over 2006–2100. The colored boxes mean that the significance level test is passed (p < 0.05), and the
white boxes mean that this test is not passed. Red and blue indicate the significant upward and downward
trends, respectively.
Full-size DOI: 10.7717/peerj.11027/fig-8
produced by photosynthesis. The leaf and stem dry matter at harvest decreased significantly
in the MIROC5 and IPSL-CM5A-MR models (p < 0.05; blue boxes in Fig. 10), while the
trends of such dry matter mostly did not pass the 95% significance test in the GFDL-ESM2G
model (white boxes in Fig. 10). The trends of panicle dry matter at harvest did not pass
the 95% significance test for approximately 68.8% of the study cases in the MIROC5 and
Zhou et al. (2021), PeerJ, DOI 10.7717/peerj.11027 13/25Figure 9 Trends of aboveground biomass at harvest for 2006–2100. The colored boxes mean that the
significance level test is passed (p < 0.05), and the white boxes mean that this test is not passed. Red and
blue indicate the significant upward and downward trends, respectively.
Full-size DOI: 10.7717/peerj.11027/fig-9
IPSL-CM5A-MR models (white boxes in Fig. 11). Two RCP 2.6 cases with MIROC5 and
two RCP 8.5 cases with IPSL-CM5A-MR showed a significant downward trend of panicle
dry matter, while an upward trend of this variable occurred for the MIROC5 with RCP
8.5 case with a p-value of less than 0.05, which was an exception. The panicle dry matter
increased meaningfully for all study cases in the GFDL-ESM2G model (p < 0.05; red boxes
in Fig. 11). Yield trends were very similar to those of the panicles (Fig. 12), because the
panicle dry matter is mostly composed of grain weight (yield).
DISCUSSION
Trends of temperature frequency
Based on above results, we can see that HT and EMT become dominant under future
climate change with the decreased LT and OT frequencies (Fig. 6). Such shifts not only
reduced rice photosynthesis (Eq. (1); Fig. 8), but limited fertilization as well (Fig. 11).
Noticeably, with the daily maximum temperature over 35 ◦ C for even a few hours, rice
fertilization was restricted, severely reducing the yield, as verified by field experiments
(Madan et al., 2012; Jagadish, Craufurd & Wheeler, 2007; Jagadish, Craufurd & Wheeler,
2008; Yoshida, Satake & Mackill, 1981; Satake & Yoshida, 1978). In the CERES-Rice model,
this process was also considered. However, the model was run at a daily time step, which
could cause errors in simulating rice fertilization.
Zhou et al. (2021), PeerJ, DOI 10.7717/peerj.11027 14/25Figure 10 Trends of rice leaf and stem dry matter at harvest for 2006–2100. The blue boxes show down-
ward trends that pass the significance level test (p < 0.05), and the white boxes mean that this test is not
passed.
Full-size DOI: 10.7717/peerj.11027/fig-10
Photosynthetic production
In this study, the IPSL-CM5A-MR and MIROC5 models generated negative trends for
all emission scenarios, while the GFDL-ESM2G model produced positive trends (Fig. 8),
which need to be analyzed. As rice is a C3 plant, the elevated CO2 concentrations in the
GCM projections enhance the activity of Rubisco, which accelerates the carboxylation of
ribulose-1,5-bisphosphate (RuBP) and increases the net CO2 fixation rate, strengthening
the photosynthetic production (Busch et al., 2013; Sasaki et al., 2007; Makino, 1994). Thus,
the positive trends in the GFDL-ESM2G model indicate that the CO2 concentration can
override the effects of rising temperature and increase photosynthetic production. Among
the three GCMs, the GFDL-ESM2G model had the least temperature increase (Fig. 5), and
the upward trends of the HT and EMT frequencies in this GCM were the slowest (Fig.
6). Thus, the CO2 concentration exerted a stronger effect on photosynthetic production
than temperature in the GFDL-ESM2G model. On the other hand, rising temperature
played a dominant role in affecting photosynthetic production than CO2 concentration
in the other two GCMs. Different from the increased photosynthetic production in the
field experiments (Wang et al., 2019a; Nam et al., 2013; Roy et al., 2012; Kim et al., 2011a;
Cheng et al., 2010), the most scenarios in our studies showed a significant decrease in rice
photosynthesis, which can be attributed to the random combinations of temperature and
CO2 concentration in the field experiments.
Zhou et al. (2021), PeerJ, DOI 10.7717/peerj.11027 15/25Figure 11 Trends of rice panicle dry matter at harvest for 2006–2100. The colored boxes mean that the
significance level test is passed (p < 0.05), and the white boxes mean that this test is not passed. Red and
blue indicate the significant upward and downward tren.
Full-size DOI: 10.7717/peerj.11027/fig-11
Dry matter of leaf, stem, panicle, and yield
The dry matter distribution among rice organs was affected by both photosynthesis and
pollen fertilization. The rice photosynthesis in the field experiment mostly increased (Wang
et al., 2019a; Nam et al., 2013; Roy et al., 2012; Kim et al., 2011a; Kim et al., 2011b; Cheng
et al., 2010). These studies found that the dry matter of each organ increases with the
increased CO2 concentration and temperature (Roy et al., 2012). On the other hand, the
elevated temperature reduces the dry matter allocation to panicle due to the decreased
spikelet numbers, significantly increasing the leaf and stem dry matter (Nam et al., 2013;
Kim et al., 2011a; Kim et al., 2011b; Cheng et al., 2010). However, these results are based
on the limited and random combinations of temperature and CO2 concentration. When
photosynthesis is weakened, or when both photosynthesis and fertilization are restricted,
the dry matter accumulation and distribution are uncertain.
Usually, leaf and stem dry matter is transferred to the panicles to form rice grains during
the grain filling period (Stoy, 1980). When the leaf and stem dry matter decreased (Fig.
10), we did not see a significant decrease in the panicle dry matter except for two RCP
2.6 cases with MIROC5 and two RCP 8.5 cases with IPSL-CM5A-MR, where the panicle
dry matter had a negative trend with a p-value of less than 0.05 (blue boxes). The trends
of the projected fertilized spikelets (Fig. S1) were determined and were consistent with
the changes in panicle dry matter in our CERES-Rice model projections. The insignificant
changes in the fertilized spikelets and panicle dry matter imply that the demand and transfer
of leaf and stem dry matter remained at a certain level, even if this dry matter decreased
Zhou et al. (2021), PeerJ, DOI 10.7717/peerj.11027 16/25Figure 12 Trends of rice yield for 2006–2100. The colored boxes mean that the significance level test is
passed (p < 0.05), and the white boxes mean that this test is not passed. Red and blue indicate the signifi-
cant upward and downward trends, respectively.
Full-size DOI: 10.7717/peerj.11027/fig-12
quite obviously due to the reduction in photosynthetic production. However, the panicle
dry matter showed a distinct downward trend in the MIROC5 with RCP 2.6 cases and
IPSL-CM5A-MR with RCP 8.5 cases. For the RCP 2.6 scenarios, the HT frequency in
the MIROC5 model had the largest increase among the three models (Fig. 6), showing
the largest photosynthetic production reduction (Fig. 8), and therefore decreasing the
panicle dry matter much more than in the other two models. In these cases, the low carbon
concentration with RCP 2.6 could not compensate for the large reduction in photosynthetic
production and panicle dry matter caused by the increased HT frequency. In addition, the
EMT frequency had the highest increase in the IPSL-CM5A-MR with the RCP 8.5 case
among all the study cases, dramatically reducing the number of the fertilized spikelets and
thus the panicle dry matter as shown in Fig. 11.
The rice panicle receives the photosynthetic product with a higher priority than the
leaves and stem in the CERES-Rice model. The increase in panicle dry matter was clearly
caused by the increased photosynthetic production in the GFDL-ESM2G model due to
the more dominant effects of carbon over temperature (Figs. 10 and 11). This model
generated an upward trend in the number of fertilized spikelets (Fig. S1) with the elevated
photosynthetic production, indicating that the demand and transfer of the photosynthetic
product to the panicles needed to hold a similar trend. This demand and transfer increase
could reduce the percentage of photosynthetic product distribution to the leaves and stem
and suppress their trends. To a very large extent, these processes led to insignificant changes
in the leaves and stem (Fig. 10).
Zhou et al. (2021), PeerJ, DOI 10.7717/peerj.11027 17/25Yield trends were very similar to those of the panicles (Fig. 12), since changes in
the panicles resulted directly in changes in the yield. Thus, the two variables shared
similar trends behind their changes. The most dramatic yield reduction occurred in the
IPSL-CM5A-MR with the RCP 8.5 case for the two study stations. As mentioned, the
EMT frequency had the largest increase in this case. Previous studies indicated that EMT
weakens the activity of pollen and inhibits anther dehiscence, resulting in poor pollen shed
on the stigma (Prasad et al., 2006; Matsui, Omasa & Horie, 2000; Matsui, Omasa & Horie,
2001). The resulting processes severely weakened the rice fertilization and, thus, reduced
the spikelet numbers and panicle dry matter. Finally, the highest EMT frequency led to the
largest reduction in the rice yield.
The effects of high temperature and CO2 on other rice type
The combined effects of increased temperature and CO2 concentration on the dry matter
distribution in the organs of other rice types such as the indica rice may be different from
those for japonica rice. The primary reason can be attributed to the higher heat resistance
of indica rice than that of japonica rice (Wang et al., 2019b). Wang (2016) indicated that
the spikelet degeneration rate of japonica rice cultivars increases more quickly than
that of indica rice cultivars under high temperatures, implying that the indica rice may
have a better heat adaptability. Such adaptability can affect the dry matter accumulation
and distribution among the rice organs. Therefore, the indica rice may have a different
response to the increased temperature and CO2 concentration, which needs to be further
investigated.
Limitations
Several limitations still exist in this study. Only two sites were selected for our simulations,
and additional simulations need to be done in broader areas to draw more general
conclusions. The single rice cultivar and fixed planting date are also possible shortcomings
of this study. Different cultivars may have different sensitivities to high temperature, and
the vegetative and reproductive growth phases usually vary with different cultivars. All these
can affect the dry matter accumulation and distribution among the rice organs. Meanwhile,
the effect of EMT on rice fertilization is likely avoided by adjusting the planting date, which
need to be further tested. In addition, our simulations were conducted with sufficient
water and fertilizer, which cannot always mimic the reality. These limitations need to be
overcome in the future studies.
CONCLUSION
In this study, we investigated the effects of temperature frequency trends on projected
japonica rice yield and dry matter distribution with elevated carbon dioxide under future
climate scenarios. We used the CERES-Rice model, which was quantitatively evaluated
with historical field data for two representative stations, Zhongwei and Yongning, located
in northwestern China. We selected the outputs from three GCMs—MIROC5, IPSL-
CM5A-MR, and GFDL-ESM2G—under the RCP 2.6, 4.5, 6.0, and 8.5 scenarios, to drive
the CERES-Rice model for future projections of rice growth and yield. The uncertainties
in these outputs were reduced through statistical downscaling.
Zhou et al. (2021), PeerJ, DOI 10.7717/peerj.11027 18/25Our results showed that future temperature trends had the most significant impact on
rice growth and development when compared with those of the other forcing variables,
including precipitation and incoming solar radiation. In addition, the frequency of the
higher than optimal temperature (∼26 ◦ C) for rice growth showed a large increase in the
future, which greatly restricted photosynthesis. The frequency of extreme temperatures
(>35 ◦ C) also increased, especially in IPSL-CM5A-MR with the RCP 8.5 case, which
exerted a strong impact on rice fertilization and significantly reduced the yield. The
increased temperature shortened the rice phenology and grain filling duration, potentially
decreasing the yield. Meanwhile, the increased temperature suppressed the photosynthetic
production, while the elevated CO2 tended to enhance this production, and the net result
was determined by the dominant process. The trends of the aboveground biomass were
downward when temperature became the major factor, and upward when CO2 -fertilization
dominated the photosynthetic production. The rice leaf and stem dry matter trends were
affected not only by photosynthesis changes but also by the dry matter distribution to the
panicles, the latter of which could significantly change those trends.
The rice panicle trends were closely related to the effects of temperature and CO2 on
photosynthetic production, and how these trends changed depended on which factor
played a major role. Extreme temperatures also remarkably affected panicle trends by
reducing the number of fertilized spikelets. The rice yield shared the same trends with
the panicle dry matter as panicle dry matter is mostly composed of grain weight (yield).
These results provide a better understanding of improved japonica rice growth and yield
projections under different climate change scenarios.
ACKNOWLEDGEMENTS
We thank the academic editor and two anonymous reviewers for their constructive
suggestions to improve the quality of the manuscript. Meanwhile, we would like to express
our appreciation to Dr. Qunhui Zhang for her efforts in downscaling.
ADDITIONAL INFORMATION AND DECLARATIONS
Funding
This research was funded by the National Key R & D Program of China on monitoring,
early warning, and prevention of major natural disasters (No. 2018YFC150703) and the
National Natural Science Foundation of China (No. 41571030, No. 91637209, and No.
91737306). The funders had no role in study design, data collection and analysis, decision
to publish, or preparation of the manuscript.
Grant Disclosures
The following grant information was disclosed by the authors:
National Key R & D Program of China on monitoring, early warning, and prevention of
major natural disasters: 2018YFC150703.
National Natural Science Foundation of China: 41571030, 91637209, 91737306.
Zhou et al. (2021), PeerJ, DOI 10.7717/peerj.11027 19/25Competing Interests
The authors declare there are no competing interests.
Author Contributions
• Zeyu Zhou conceived and designed the experiments, performed the experiments,
analyzed the data, prepared figures and/or tables, authored or reviewed drafts of the
paper, and approved the final draft.
• Jiming Jin, Libing Song and Ling Yan analyzed the data, authored or reviewed drafts of
the paper, and approved the final draft.
Data Availability
The following information was supplied regarding data availability:
Raw data is available in the Supplemental Files.
Supplemental Information
Supplemental information for this article can be found online at http://dx.doi.org/10.7717/
peerj.11027#supplemental-information.
REFERENCES
Abatzoglou JT. 2013. Development of gridded surface meteorological data for ecological
applications and modelling. International Journal of Climatology 33(1):121–131
DOI 10.1002/joc.3413.
Abayawickrama ASMT, Reinke RF, Fitzgerald MA, Harper JDI, Burrows GE. 2017.
Influence of high daytime temperature during the grain filling stage on fissure for-
mation in rice. Journal of Cereal Science 74:256–262 DOI 10.1016/j.jcs.2017.02.013.
Ahmed N, Tetlow IJ, Nawaz S, Iqbal A, Mubin MSN, Rehman M, Butt A, Lightfoot
DA, Maekawa M. 2015. Effect of high temperature on grain filling period, yield,
amylose content and activity of starch biosynthesis enzymes in endosperm of
basmati rice. Journal of the Science of Food and Agriculture 95(11):2237–2243
DOI 10.1002/jsfa.6941.
Andrew MT. 2010. Map of rice production across the world. Available at https://
commons.wikimedia.org/ w/ index.php?curid=9643470.
Buotte PC, Levis S, Law BE, Hudiburg TW, Rupp DE, Kent JJ. 2019. Near-future forest
vulnerability to drought and fire varies across the western United States. Global
Change Biology 25(1):290–303.
Busch FA, Sage TL, Cousins AB, Sage RF. 2013. C3 plants enhance rates of photosynthe-
sis by reassimilating photorespired and respired CO2 . Plant, Cell and Environment
36(1):200–212 DOI 10.1111/j.1365-3040.2012.02567.x.
Chauhan BS, Jabran K, Mahajan G. 2017. Rice production worldwide. Cham, Switzer-
land: Springer International Publishing.
Chen XJ. 2012. Technical specification of rice high yield cultivation in yellow river
irrigation area. Ningxia Journal of Agriculture and Forestry Science and Technology
53(02):3, 5 (In Chinese with English abstract).
Zhou et al. (2021), PeerJ, DOI 10.7717/peerj.11027 20/25Cheng WG, Sakai H, Yagi K, Hasegawa T. 2010. Combined effects of elevated [CO2 ]
and high night temperature on carbon assimilation, nitrogen absorption, and the
allocations of C and N by rice (Oryza sativa L.). Agricultural and Forest Meteorology
150(9):1174–1181 DOI 10.1016/j.agrformet.2010.05.001.
Dettinger MD, Cayan DR, Meyer MK, Jeton AE. 2004. Simulated hydrologic responses
to climate variations and change in the Merced, Carson, and American river
basins, Sierra Nevada, California, 1900–2099. Climatic Change 62(1–3):283–317
DOI 10.1023/B:CLIM.0000013683.13346.4f.
FAOSTAT. 2017. Corporate Statistical Database. Available at http:// www.fao.org/ faostat/
en/ #data/ QC.
Feng LL, Wang K, Li Y, Tan YP, Kong J, Li H, Li YS, Zhu YG. 2007. Overexpression of
SBPase enhances photosynthesis against high temperature stress in transgenic rice
plants. Plant Cell Reports 26(9):1635–1646 DOI 10.1007/s00299-006-0299-y.
Gross BL, Zhao ZJ. 2014. Archaeological and genetic insights into the origins of domes-
ticated rice. Proceedings of the National Academy of Sciences of the United States of
America 111(17):6190–6197 DOI 10.1073/pnas.1308942110.
Hamed KH. 2008. Trend detection in hydrologic data: the Mann-Kendall trend
test under the scaling hypothesis. Journal of Hydrology 349(3-4):350–363
DOI 10.1016/j.jhydrol.2007.11.009.
He D, Wang EL, Wang J, Robertson MJ. 2017. Data requirement for effective calibration
of process-based crop models. Agricultural and Forest Meteorology 234–235:136–148.
He JQ, Jones JW, Graham WD, Dukes MD. 2010. Influence of likelihood func-
tion choice for estimating crop model parameters using the generalized like-
lihood uncertainty estimation method. Agricultural Systems 103(5):256–264
DOI 10.1016/j.agsy.2010.01.006.
He J, Yang K, Tang WJ, Lu H, Qin J, Chen YY, Li X. 2020. The first high-resolution
meteorological forcing dataset for land process studies over China. Scientific Data
7:25 DOI 10.1038/s41597-020-0369-y.
Hsu PC, Li T, Murakami H, Kitoh A. 2013. Future change of the global monsoon
revealed from 19 CMIP5 models. Journal of Geophysical Research: Atmospheres
118(3):1247–1260.
Iizumi T, Yokozawa M, Nishimori M. 2011. Probabilistic evaluation of climate change
impacts on paddy rice productivity in Japan. Climatic Change 107(3-4):391–415
DOI 10.1007/s10584-010-9990-7.
Jagadish SVK, Craufurd PQ, Wheeler TR. 2007. High temperature stress and spikelet
fertility in rice (Oryza sativa L.). Journal of Experimental Botany 58:1627–1635
DOI 10.1093/jxb/erm003.
Jagadish SVK, Craufurd PQ, Wheeler TR. 2008. Phenotyping parents of mapping
populations of rice (Oryza sativa L.) for heat tolerance during anthesis. Crop Science
48:1140–1146 DOI 10.2135/cropsci2007.10.0559.
Jones JW, Hoogenboom G, Porter CH, Boote KJ, Batchelor WD, Hunt LA, Wilkens
PW, Singh U, Gijsman AJ, Ritchie JT. 2003. The DSSAT cropping system model.
European Journal of Agronomy 18(3-4):235–265 DOI 10.1016/S1161-0301(02)00107-7.
Zhou et al. (2021), PeerJ, DOI 10.7717/peerj.11027 21/25Kato Y, Okami M, Katsura K. 2009. Yield potential and water use efficiency of
aerobic rice (Oryza sativa L.) in Japan. Field Crops Research 113(3):328–334
DOI 10.1016/j.fcr.2009.06.010.
Kim HY, Ko J, Kang S, Tenhunen J. 2013. Impacts of climate change on paddy rice yield
in a temperate climate. Global Change Biology 19(2):548–562 DOI 10.1111/gcb.12047.
Kim HY, Lim SS, Kwak JH, Lee DS, Lee SM, Ro HM, Choi WJ. 2011a. Dry matter
and nitrogen accumulation and partitioning in rice (Oryza sativa L.) exposed
to experimental warming with elevated CO2 . Plant and Soil 342(1-2):59–71
DOI 10.1007/s11104-010-0665-y.
Kim J, Shon J, Lee CK, Yang W, Yoon Y, Yang WH, Kim YG, Lee BW. 2011b. Relation-
ship between grain filling duration and leaf senescence of temperate rice under high
temperature. Field Crops Research 122(3):207–213 DOI 10.1016/j.fcr.2011.03.014.
Kimball BA, Kobayashi K, Bindi M. 2002. Responses of agricultural crops to free-air
CO2 enrichment. Advances in Agronomy 77:293–368
DOI 10.1016/S0065-2113(02)77017-X.
Kropff MJ, Cassman KG, Peng S, Matthews RB, Setter TL. 1994. Quantitative under-
standing of yield potential. In: Cassman K.G., ed. Breaking the yield barrier. Los
Baños, Philippines: IRRI, 21–38.
Lieffering M, Kim HY, Kobayashi K, Okada M. 2004. The impact of elevated CO2 on
the elemental concentrations of field-grown rice grains. Field Crops Research 88(2–
3):279–286 DOI 10.1016/j.fcr.2004.01.004.
Liu J, Liu YX, Wang LX, Li Q, Ma GF, Ma LW. 2017. Simulation on effects of rice growth
under different nursery period and shed temperature in Hetao irrigation region.
Chinese Journal of Agrometeorology 38(08):496–506.
Ma HW, Xu Q, Liu SX, Xu JG. 2003. Study on suitable transplanting period of replanted
rice after winter wheat in irrigated area of Ningxia. Ningxia Journal of Agriculture and
Forestry Science and Technology 000(002):19–20 (In Chinese).
Mackill DJ, Lei XM. 1997. Genetic variation for traits related to temperate adaptation of
rice cultivars. Crop Science 37(4):1340–1346
DOI 10.2135/cropsci1997.0011183X003700040051x.
Maclean JL, Dawe DC, Hardy B, Hettel GP. 2002. Rice almanac. Los Baños, (Philippines):
International Rice Research Institute, Bouaké (Côte d’Ivoire): West Africa Rice
Development Association, Cali (Colobia): International Center for Tropical Agriculture.
Rome (Italy): Food and Agriculture Organization.
Madan P, Jagadish SVK, Craufurd PQ, Fitzgerald M, Lafarge T, Wheeler TR. 2012.
Effect of elevated CO2 and high temperature on seed-set and grain quality of rice.
Journal of Experimental Botany 63(10):3843–3852 DOI 10.1093/jxb/ers077.
Makino A. 1994. Biochemistry of C3 -photosynthesis in high CO2 . Journal of Plant
Research 107(1):79–84 DOI 10.1007/BF02344533.
Makino A, Sage RF. 2007. Temperature response of photosynthesis in transgenic
rice transformed with ‘sense’ or ‘antisense’ rbcS. Plant and Cell Physiology
48(10):1472–1483 DOI 10.1093/pcp/pcm118.
Zhou et al. (2021), PeerJ, DOI 10.7717/peerj.11027 22/25Mathur S, Agrawal D, Jajoo A. 2014. Photosynthesis: response to high tempera-
ture stress. Journal of Photochemistry and Photobiology B: Biology 137:116–126
DOI 10.1016/j.jphotobiol.2014.01.010.
Matsui T, Omasa K, Horie T. 2000. High temperature at flowering inhibits swelling of
pollen grains, a driving force for thecae dehiscence in rice (Oryza sativa L.). Plant
Production Science 3(4):430–434 DOI 10.1626/pps.3.430.
Matsui T, Omasa K, Horie T. 2001. The difference in sterility due to high temperatures
during the flowering period among japonica-rice varieties. Plant Production Science
4(2):90–93 DOI 10.1626/pps.4.90.
Ministry of Agriculture in India. 2015. Agricultural statistics at a glance 2014. New Delhi:
Department of agriculture and cooperation. Ministry of Agriculture, Government of
India.
National Bureau of Statistics of China. 2007-2016. China Statistics Yearbook. Beijing:
China Statistics Press.
Nam HS, Kwak JH, Lim SS, Choi WJ, Lee SI, Lee DS, Lee KS, Kim HY, Lee SM, Mat-
sushima M. 2013. Fertilizer N uptake of paddy rice in two soils with different fertility
under experimental warming with elevated CO2 . Plant and Soil 369(1–2):563–575
DOI 10.1007/s11104-013-1598-z.
Peart RM, Jones JW, Curry RB, Boote KJ, Allen LH. 1988. Final report: impact of the
climate change on crop yield in the Southern USA: a simulation study. Gainesville:
Institute of Food and Agricultural Sciences, University of Florida.
Prasad PVV, Boote KJ, Allen Jr LH, Sheehy JE, Thomas JMG. 2006. Species, eco-
type and cultivar differences in spikelet fertility and harvest index of rice in
response to high temperature stress. Field Crops Research 95(2–3):398–411
DOI 10.1016/j.fcr.2005.04.008.
Prather M, Flato G, Friedlingstein P, Jones C, Lamarque J, Liao H, Rasch P. 2013.
Annex II: climate system scenario tables. In: Climate change 2013: the physical
science basis. Contribution of working group I to the fifth assessment report of the
intergovernmental panel on climate change. Cambridge: Cambridge University Press,
1395–1445.
Ritchie JT, Singh U, Godwin DC, Bowen WT. 1998. Cereal growth, development and
yield. In: Understanding options for agricultural production. Dordrecht, Netherlands:
Kluwer Academic Publishers, 79–98.
Roy KS, Bhattacharyya P, Neogi S, Rao KS, Adhya TK. 2012. Combined effect of
elevated CO2 and temperature on dry matter production, net assimilation rate, C
and N allocations in tropical rice (Oryza sativa L.). Field Crops Research 139:71–79
DOI 10.1016/j.fcr.2012.10.011.
Sang JR, Liu YL, Qiu W. 2006. Impact of climate warming on rice yield in irrigation area
of Ningxia. Journal of Desert Research 26(006):953–958 (In Chinese with English
abstract).
Sasaki H, Hara T, Ito S, Uehara N, Kim HY, Lieffering M, Okada M, Kobayashi K.
2007. Effect of free-air CO2 enrichment on the storage of carbohydrate fixed
Zhou et al. (2021), PeerJ, DOI 10.7717/peerj.11027 23/25at different stages in rice (Oryza sativa L.). Field Crops Research 100(1):24–31
DOI 10.1016/j.fcr.2006.05.003.
Satake T, Yoshida S. 1978. High temperature-induced sterility in indica rices at flower-
ing. Japanese Journal of Crop Science 47(1):6–17 DOI 10.1626/jcs.47.6.
Sawano S, Hasegawa T, Goto S, Konghakote P, Polthanee A, Ishigooka Y, Kuwagata T,
Toritani H. 2008. Modeling the dependence of the crop calendar for rain-fed rice
on precipitation in northeast Thailand. Paddy and Water Environment 6(1):83–90
DOI 10.1007/s10333-007-0102-x.
Singh U, Padilla JL. 1995. Simulating rice response to climate change. In: Climate
Change and agriculture: analysis of potential international impacts. American Society
of Agronomy Special Publication No. 59. Madison: American Society of Agronomy,
99–121.
Singh U, Ritchie JT, Godwin DC. 1993. . A user’s guide to CERES Rice, V2. 10. Muscle
Schoals: International Fertilizer Development Center.
Stoy V. 1980. Grain filling and the properties of the sink: physiological aspects of crop
productivity. In: Proceedings of the 15th colloquium of the international potash
institute. International Potash Institute, 65–76.
Tao FL, Hayashi Y, Zhang Z, Sakamoto T, Yokozawa M. 2008. Global warming, rice
production, and water use in China: developing a probabilistic assessment. Agricul-
tural and Forest Meteorology 148(1):94–110 DOI 10.1016/j.agrformet.2007.09.012.
Taylor KE, Stouffer RJ, Meehl GA. 2012. An overview of CMIP5 and the exper-
iment design. Bulletin of the American Meteorological Society 93(4):485–498
DOI 10.1175/BAMS-D-11-00094.1.
Thompson JA. 2002. Water management of rice in southern New South Wales, Aus-
tralia. In: Bouman BAM, Hengsdijk H, Hardy B, Bindraban PS, Tuong TP, Ladha
JK, eds. Proceedings of the international workshop on waterwise rice production. Los
Baños: International Rice Research Institute, 62–67.
Viovy N. 2011. CRUNCEP dataset. Available at http:// www.cesm.ucar.edu/ models/ cesm1.
2/ clm/ clm_forcingdata_esg.html.
Wailes EJ, Chavez EC. 2012. World rice outlook: international rice deterministic and
stochastic baseline projections, 2012-2021. Staff Papers, University of Arkansas
Department of Agricultural Economics and Agribusiness, 1–80.
Wang B, Li JL, Wan YF, Cai WW, Guo C, You SC, Li RN, Qin XB, Gao QZ, Zhou SH,
Liu KW, Wilkes A, Li YE. 2019a. Variable effects of 2 ◦ C air warming on yield for-
mation under elevated [CO2 ] in a Chinese double rice cropping system. Agricultural
and Forest Meteorology 278:107662 DOI 10.1016/j.agrformet.2019.107662.
Wang HY. 2016. Investigation and prevention-and-control countermeasures for rice high
temperature damage: a case of Ma’anshan City in 2013. Journal of Anhui Agriculture
Science 44(8):50–52 (In Chinese with English abstract).
Wang LX, Liu J, Li Q, Qian R. 2013. Simulation study of the climate change impact
on the rice and its adaptability in Ningxia province. Advances in Earth Science
28(11):1248–1256 (In Chinese with English abstract).
Zhou et al. (2021), PeerJ, DOI 10.7717/peerj.11027 24/25You can also read


