The Effects of Increasing Visitor and Noise Levels on Birds Within a Free-flight Aviary Examined Through Enclosure Use and Behavior - Animal ...
←
→
Page content transcription
If your browser does not render page correctly, please read the page content below
ABC 2020, 7(1):49-69
Animal Behavior and Cognition                                           DOI: https://doi.org/10.26451/abc.07.01.05.2020
©Attribution 3.0 Unported (CC BY 3.0)

 The Effects of Increasing Visitor and Noise Levels on Birds
 Within a Free-flight Aviary Examined Through Enclosure
                      Use and Behavior
                      Mackenzie K. S. Blanchett*, Esther Finegan, and Jim Atkinson

Department of Animal Biosciences, University of Guelph

*Corresponding author (Email: mackenzie.blanchett@gmail.com)

Citation – Blanchett, M. K. S., Finegan, E., & Atkinson, J. (2020). The effects of increasing visitor and noise levels
on birds within a free-flight aviary examined through enclosure use and behavior. Animal Behavior and Cognition,
7(1), 49-69. doi: https://doi.org/10.26451/abc.07.01.05.2020

Abstract – Visitors in a zoo environment have the potential to impact the animals that they are viewing in a variety
of ways. Recently, there have been suggestions that free-range enclosures, where visitors can walk directly through
an animal’s exhibit, may reduce the potential for negative visitor impacts. The aim of this study was to examine
associations between visitor numbers and noise levels and enclosure use and the stress and critical behavior of 24
bird species housed in a free-flight, mixed species aviary. Using GIS (Geographic Information Systems), the
locations of the birds were marked on a digital map of the aviary, with their behavior and vertical distance above the
ground also marked. In addition, visitor numbers and noise levels were simultaneously monitored using scan
sampling. Thirty-minute intervals were used to collect bird data, while 10-minute intervals were used to collect the
visitor data. Under periods of high visitor numbers, several changes in how the birds used their enclosure space were
observed, including; movement away from the visitor pathway, decreased range sizes and increased use of
vegetation cover. However, the lack of association between visitor numbers and the performance of stress related
(pacing, aggression), and critical behavior (feeding, resting, nesting), suggest that the birds were not experiencing
substantial negative welfare consequences. Instead, the ways in which the birds used the space in their free-range
enclosure appears to have minimized any potential negative effects during high visitor periods.

Keywords – Free-range enclosure, Visitor effects, Enclosure use, Behavioral responses, Mixed species aviary, GIS

         The relationship between zoo animals and the visitors who view them is a complicated one,
where both parties can have considerable effects on the other. The experience of visitors in zoos is often
associated with feelings of happiness, relaxation, excitement, and interest in and empathy for the animals
being viewed (Clayton et al., 2009; Reade & Waran, 1996). However, without the aid of self-reporting by
the zoo animals themselves, understanding the effects that visitors have on animals, can be a more
complicated process. For the past 50 years, scientists have investigated the effects that human presence
has on animals in captivity (Hosey, 2000). Mechanisms by which visitors can influence zoo animals
include the visual presence of visitors at viewing areas, the noise that visitors create, and the attempts that
visitors make to interact with the animals (Fernandez et al., 2009; Quadros et al., 2014). These
components can act independently or inter-relatedly to produce negative, positive, or neutral visitor
effects (Davey, 2007; Hosey, 2000, 2008, 2013). Negative visitor effects suggest that animals may find
visitors to be an aversive presence, which may be due to the animals viewing visitors as a source of
disturbance, a predatory or territorial threat, or a negative stimulus due to previous negative interactions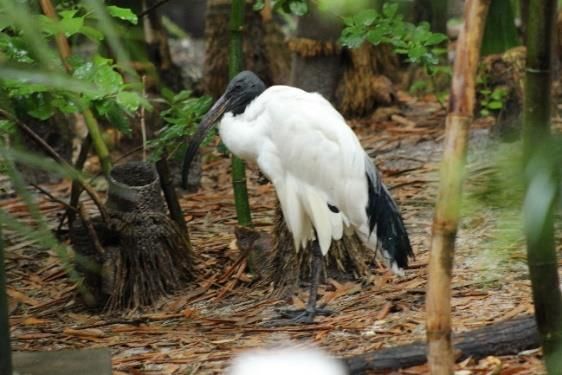
Blanchett et al. 50

with humans (Hosey, 2008, 2013). Alternatively, positive visitor effects suggest that visitors may be
stimulating for the animals (Hosey, 2000), potentially acting as a form of social enrichment (Claxton,
2011; Hosey, 2013). Finally, neutral visitor effects have been observed where visitors appear to have no
effect on the animals, suggesting animal habituation to the presence of humans in their environment, due
to repeated exposure (Hosey & Melfi, 2014).
          An area of study that is beginning to receive more attention is that of visitor effects in free-range
enclosures. Free-range enclosures are those in which visitors can move directly through an animal’s
habitat, with minimal physical barriers separating them from the animals that they are viewing (Sherwen,
Hemsworth, et al., 2015). In theory, the opportunity for close-contact interactions between visitors and
zoo animals, could make the animals more vulnerable to negative visitor effects (Collins et al., 2017;
Morgan & Tromborg, 2007; Woolway & Goodenough, 2017). Increased opportunity for close-contact
interactions between visitors and zoo animals has been linked to increases in the rate at which undesirable
or aggressive behavior is displayed towards visitors. This has been documented in cotton-top tamarins
(Saguinus oedipus, Mun et al., 2013), African pygmy goats (Capra hircus, Anderson et al., 2002) and
Romanov sheep (Ovis aries, Anderson et al., 2002).
         There is also evidence of increases in the performance of vigilance behavior by animals housed in
free-range enclosures, as visitor numbers and noise levels increase. These responses may indicate fear and
have been documented in koalas (Phascolarctos cinereus; Larsen et al. 2014) and kangaroos (Macropus
fuliginosus fuliginosus and Macropus rufus; Sherwen, Hemsworth, et al., 2015). However, it has been
noted that vigilance can also be an indicator of curiosity directed towards visitors (Larsen et al., 2014;
Sherwen, Hemsworth, et al., 2015), resulting in uncertainty as to whether the visitor impacts are positive
or negative.
         Alternatively, recent studies performed on ring-tailed lemurs (Lemur catta) (Collins et al., 2017),
red European squirrels (Sciurus vulgaris) (Woolway & Goodenough, 2017) and orangutans (species name
not provided) (Choo et al., 2011) housed in free-range enclosures, have reported relatively low levels of
visitor effects, despite the reduced level of visitor-animal separation inherent to free-range enclosures. All
three studies reported low levels of behavioral responses to increasing visitor numbers, visitor noise
levels, and/or visitor distance to the animals (Choo et al., 2011; Collins et al., 2017; Woolway &
Goodenough, 2017). These limited responses to the visitors were attributed to habituation through
repeated exposure, or to the animals’ positive associations with humans due to their positive relationships
with their keepers. Additionally, authors interpreted approach behavior or food solicitation behavior
displayed by animals, as indicating a lack of fear of towards visitors (Collins et al., 2017; Woolway &
Goodenough, 2017). One study suggested that visitors may have acted as a form of enrichment by
providing novel interactions and variability in the environment (Choo et al., 2011).
         Furthermore, it has been proposed that design aspects of free-range enclosures may play a direct
role in minimizing the effects of visitor presence on the animals housed within them (Hosey, 2000). It has
been hypothesized that free-range enclosures allow for animals to remove themselves from visitor view,
and distance themselves from visitors and unwanted interactions at will, providing a means by which
animals may reduce the effects of visitor presence (Carlstead & Sheperdson, 2000; Collins & Marples,
2015; Hosey, 2000). Retreat responses such as these have been documented in free-range enclosures in
lemurs (Lemur catta, Collins et al., 2017), flamingos (Phoenicopterus roseus, P. ruber, P. chilensis,
Phoenicoparrus andinus, Phoeniconaias minor) (Rose et al., 2018) and squirrels (Sciurus vulgaris,
Woolway & Goodenough, 2017). In all cases, due to the design of the enclosures, the animals were able
to respond to potentially stressful stimuli (visitors, large crowds, children) by moving further away from
visitor pathways as preferred (Collins et al., 2017; Rose et al., 2018; Woolway & Goodenough, 2017).
         Retreat responses have been further studied through the provisioning of retreat space, areas within
free-range enclosures that animals can access but visitors cannot. This has been studied in petting zoos
(Anderson et al., 2002) and swim-with dolphin experiences (Kyngdon et al., 2003). These studies
concluded that the ability of the animals to retreat from visitors at will allowed for the animals to maintain
control over visitor interactions. This resulted in the decreased performance of ‘non-desirable’ behaviors
directed towards visitors (Anderson et al., 2002), and the potential habituation (Kyngdon et al., 2003) to
Blanchett et al. 51

what might otherwise be a disruptive presence in their environment. The provisioning of choice and
control for animals within their enclosures, has been shown to contribute to positive animal welfare in zoo
environments (summarized in Whitham & Wielebnowski, 2013).
         Understanding how animals position themselves in free-range enclosures in response to differing
visitor levels, is crucial in order to better understand the mechanisms that animals may use to potentially
mitigate negative visitor effects. Combining locational data with behavior data can supply a detailed
picture of visitor effects, providing a behavioral context to how the animals use their enclosures and the
habitat features provided to them (de Vere, 2018). Methodology used to assess enclosure use and
positioning in visitor effect studies has largely been composed of measures such as, distance from visitor
pathways (Larsen et al., 2014; Sherwen, Hemsworth, et al., 2015), positions of the animals in two-
dimensional or three-dimensional quadrants of the enclosure (Collins et al., 2017; Collins & Marples,
2015; de Azevedo et al., 2012; de Vere, 2018; Downes, 2012; Larsen et al., 2014; Thicks, 2008), use of
retreat space (Anderson et al., 2002; Kyngdon et al., 2003) and overall visibility of the animals to visitors
(Schäfer, 2014). We aim to contribute to this research further by examining the enclosure use of a
community of mixed species birds housed in a free-range exhibit, through the use of digital maps and
Geographic Information Systems (GIS).
         GIS is a system that can be used to make digital maps, on which, data can be directly collected,
stored, analysed and displayed. With GIS, the location of the birds within their enclosure can be tracked
in three-dimensions, providing a highly detailed account of their locations, and how these locations
change under periods of differing visitor numbers and noise levels. This information will be particularly
helpful while examining visitor effects in a large free-range enclosure, whose complex naturalistic design
uses features to more closely mimic a natural environment. In addition, GIS can be used to aid in easily
providing information on changes in the range size of the birds, and changes in their use of features in the
environment, such as vegetation cover. It is proposed that this information can aid in better understanding
how the birds are using the space provided to them in their free-range enclosure, and possibly, how their
positioning in the environment varies under differing visitor levels.
         In the current study, enclosure use by 24 bird species was monitored during periods of differing
visitor numbers and noise levels in a free-range naturalistic enclosure at Zoo Tampa at Lowry Park, FL.
GIS was used to track the birds’ locations on a to-scale aviary map. It was hypothesized that under
periods of increased visitor numbers/noise levels birds would: (1) be found further away from the path;
(2) be found higher up in the canopy; (3) be found more often in ground vegetation cover, and/or; (4)
display smaller range sizes. In addition, it was hypothesized that any associated negative welfare of the
birds during periods of increased visitor numbers or noise levels would be seen through changes in their
behavior, including increased performance of stress related behaviors, such as pacing and/or aggression,
and decreased performance of critical behavior, such as feeding, nesting and resting.

                                                 Methods

Subjects

         The study was conducted at Zoo Tampa at Lowry Park, Florida (United States). The aviary of
focus was the Main Free-flight Aviary: a large, naturalistic, free-range enclosure (Figure 1). The aviary is
an outdoor, dome-shaped enclosure (approximately 34 x 28 m across and 13.5 m high) surrounded by
wire mesh, that allows full exposure for the birds to the outside weather conditions. In addition, the
naturalistic design incorporates abundant ground vegetation cover and trees, a running waterfall, and a
river and pond. A cement path near the edges of the habitat (Figure 1) allows visitors to walk through the
aviary encountering the birds in close proximity with no physical barriers, while prohibiting visitor
movement into the center and surrounding edges of the enclosure with a low-rope fence. In the center of
the aviary, there is a raised viewing platform and stairs, on which visitors can gain an elevated view of the
birds, approximately four meters above the ground. However, the platform was closed to visitors for
repairs throughout the study period.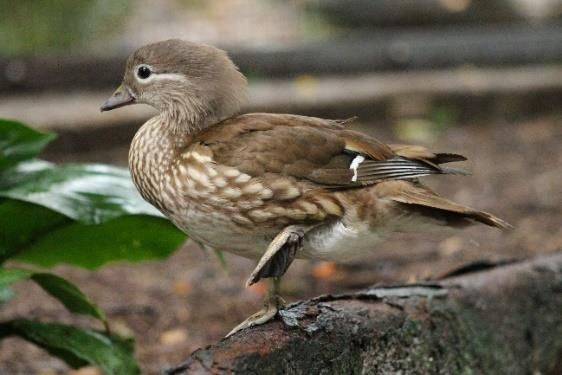
Blanchett et al. 52

                                                                                                            Section A

    Section B

Elevated viewing platform                                                                Aviary main entrance

 Legend

          Entrance                                                Viewing platform and stairs (closed for
          Exit                                                    duration of observation period)

          Noise reading locations                                 Keeper offices

          Visitor pathway                                         External contained aviaries
          Pond and river                                          Ground vegetation cover

          Waterfall                                               Wire mesh wall dividing sections A and B
Figure 1. An overhead map of the Main Free-flight Aviary at Zoo Tampa at Lowry Park, Tampa FL, used for data collection,
analysis and interpretation.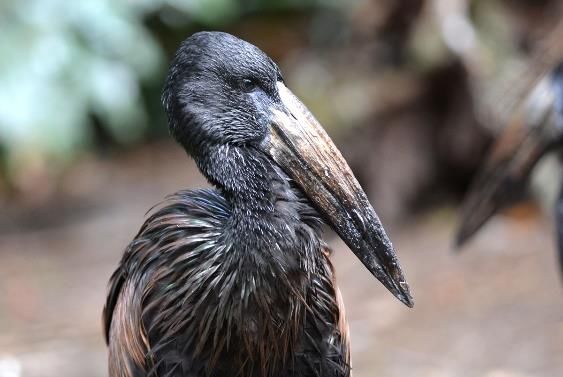
Blanchett et al. 53
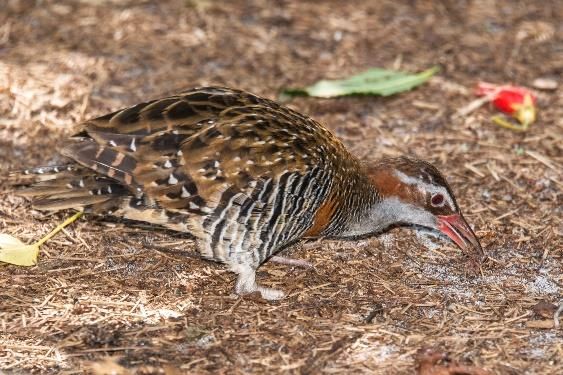
At the time of this study, the aviary was home to 26 bird species and two Linnaeus’s two-toed
sloths (Choloepus didactylus), of which 24 bird species (98 individual birds) were included in the data
collection (Table 1; see Appendix for photographs). Two species, the crested oropendola (Psarocolius
decumanus) and the nicobar pigeon (Caloenas nicobarica), were omitted from analysis, as it was
determined during two days of pre-study data collection, that their high levels of activity made it too
difficult to ensure that individuals of either population were not sampled more than once within the same
scan period. The aviary was divided into two sections, section A and B. The two sections were separated
by a wire mesh wall with chain curtains that visitors could pass through. This division allowed for the
separation of species, as well as two related scarlet ibis populations. However, it is of note that some
species could pass through the curtains, accessing both sides of the aviary at will (Table 1). In addition,
there were several traditional bird exhibits along the edges of the aviary (Figure 1, external contained
aviaries) that visitors could view once inside, but could not enter, and as such, these birds were not
included in the study.
Table 1
An Inventory of the Main Free-flight Aviary at Zoo Tampa at Lowry Park, Tampa, FL
Species Sex*
Section A
African openbill (Anastomus lamelligerus)*** 2:0:0
African spoonbill (Platalea alba) 1:1:0
Black-bellied whistling duck (Dendrocygna autumnalis)** 2:2:4
Blue-crowned motmot (Momotus coeruliceps) 1:1:0
Boat-billed heron (Cochlearius cochlearius) 4:1:0
Buff-banded rail (Hypotaenidia philippensis)** 1:0:1
Demoiselle crane (Anthropoides virgo) 1:1:0
Great curassow (Crax rubra) 1:0:0
Helmeted guineafowl (Numida meleagris) 1:1:3
Hottentot teal (Spatula hottentota)** 2:0:0
Mandarin duck (Aix galericulata)** 1:1:0
Pied imperial pigeon (Ducula bicolor) 1:1:0
Sacred ibis (Threskiornis aethiopicus) 2:0:0
Scarlet ibis (Eudocimus ruber) 16:17:6
Spotted whistling duck (Dendrocygna guttata)** 2:0:0
Sunbittern (Eurypyga helias)** 3:0:0
Von der Decken’s hornbill (Tockus deckeni)** 0:1:0
Section B
Blue-bellied roller (Coracias cyanogaster) 1:0:0
Blue-breasted kingfisher (Halcyon malimbica) 0:1:0
Eastern crested guineafowl (Guttera pucherani) 0:1:0
Inca tern (Larosterna inca) 2:3:0
Little blue heron (Egretta caerulea) 0:1:0
Red-legged seriema (Cariama cristata) 1:1:0
Scarlet ibis (Eudocimus ruber) 2:1:0
Violet turaco (Musophaga violacea) 1:1:0
Note: Latin names according to IUCN Red List of Threatened Species (IUCN Red List, 2018)
* denotes sex ratios, represents number of Males:Females:Individuals of Unidentified Sex
** denotes species that can move between both sections of the aviary at will
*** after two days of observation, one of the African openbills was moved off-exhibit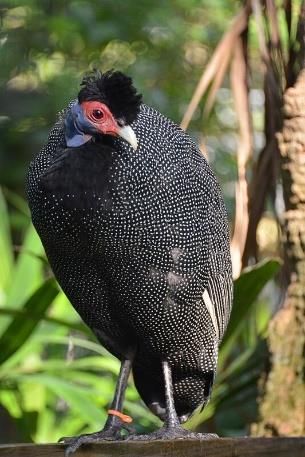
Blanchett et al. 54

Production of Aviary Map in GIS

        To survey the aviary, traversing (Wenger, 1984) was used. The entrance to the aviary was
selected as the known point (0, 0), from which the distance (measured with a TruPulse Laser Rangefinder
Series 200; Laser Technology Inc., Centennial, CO, USA) and the angle of degrees north (measured with
the Compass App on iPhone 6S; Apple Canada Inc., Toronto, ON, Canada) to subsequent points were
measured and recorded. Key points along features such as the path, river, pond, waterfall, vegetation
cover and interior walls of the aviary were measured. Once completed, the distance and angle recordings
were input into Microsoft Excel 2013 (Microsoft Corporation, Redmond, WA, USA) and converted to
positions in a plane coordinate system. These positions were uploaded to a blank georeferenced surface in
QGIS Desktop 2.18.3 with GRASS 7.2.0 (open-source software product) as delimited text files with point
coordinates. Aviary features were digitized from these point coordinates as lines, shapes or point files as
appropriate (Figure 1).

Observational Data Collection Procedures

        Bird data. Data collection occurred from June 12, 2017 to July 7, 2017. Data for 12 full days was
collected, with sampling occurring from 9:00am – 1:00pm and 2:00pm – 4:00pm, on both weekend and
weekdays. Scan sampling (Martin & Bateson, 2007) was used to collect location and behavior data of the
birds. Two days of pre-study sampling were conducted before the study began, during which time it was
determined that it would take approximately 20 min to sight and record all of the subject birds in the
aviary. To ensure adequate time for data collection, as well as allow for time to reset before the
subsequent sampling period, a 30 min interval was allocated for each scan. At the beginning of every 30
min interval, the observer walked through the enclosure, along the pathway, marking the location of each
sighted bird on a hardcopy version of the aviary map. In addition, the species of bird, the behavior the
bird was performing (Table 2), the vertical distance of the bird above the ground (measured using the
TruPulse Laser Rangefinder Series 200), and the date and time of sampling were recorded in association
with each bird’s locational point on the map. Due to the inability to distinguish individual birds, and the
scale of the map on which data was being collected, when more than three birds (of any species) were
located in a grouping within the same relative area of space (approximately 0.5 m3), vertical distance
above the ground was recorded as a group measure. Instead of measuring the distance above the ground
for every bird within the grouping, vertical distance would be measured for a bird located in
approximately the center of the group, and this distance measure would be applied to all of the birds
within that group. In addition, for these groupings, a note was made of how many birds of each species
were performing each behavior (e.g., six scarlet ibis feeding and drinking, two scarlet ibis resting, one
sacred ibis pacing). These behaviors were then assigned at random to the locational points within a
grouping, according to species (see Data Entry into GIS).
        To minimize the likelihood that individual birds of the same species were recorded more than
once in the same scan, to the best of the observer’s ability, individuals of the same species were recorded
when all individuals of the given species were in-sight. Additionally, for the majority of the bird species,
there were populations of one or two individuals, and in these cases, it was possible to keep track of how
many individuals had already been sampled. However, as observers cannot fully guarantee that individual
birds were not double-counted during scans, it must be noted that this paper serves to provide a sampling
of each population’s use of the enclosure and behavior.
        Visitor and environmental data. Using 10 min scan sampling, a second observer simultaneously
recorded visitor and environmental variables. To maximize the detail and accuracy of air temperature and
humidity readings, visitor and environmental data were collected at 10 min sampling intervals,
coordinated with the start of bird sampling intervals (e.g., bird sampling periods began at 9:00, 9:30,
10:00, etc. and visitor and environmental sampling periods began at 9:00, 9:10, 9:20, 9:30, etc.). The total
number of visitors who entered the aviary during the ten-minute sampling period was recorded. As well,
noise readings from five points along the pathway (Figure 1; measured using a Dr. Meter MS10 Digital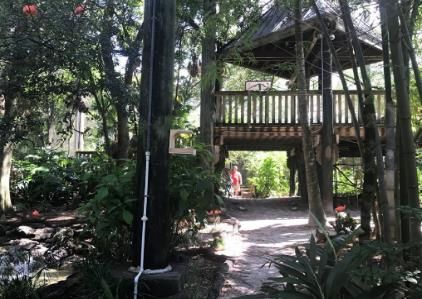
Blanchett et al. 55

Decibel Sound Level Meter Tester; Hisgadjet, Union City, CA, USA) along with air temperature and
humidity measured at the entrance of the aviary (both measured using the Kestrel 4000; Nielsen-
Kellerman, Boothwyn, PA, USA), were recorded at the beginning of each 10 min sampling period. Due to
the nature of the live observations, intra-observer reliability could not be collected for the bird, visitor or
environmental data.
Table 2

An Ethogram of Bird Behavior Recorded Throughout the Study

          Behavior                                                         Description
Critical Behavior*

Resting                        Sitting, perching, or standing on land, structures or in the water, with eyes closed

Feeding and Drinking           Gathering, washing or consuming food, or drinking water

Nesting                        Sitting on nest or nesting structure

Stress-related Behavior**

Pacing                         Walking back and forth in a set route with no apparent goal

Agonistic Interactions         Chasing, biting or vocalizing aggressively (e.g., hissing) at other birds
Note: Behaviors to include were determined based on those that were observed in preliminary trial-runs of data collection.
* denotes behaviors categorized as critical behaviors for the purposes of this study: if birds show a reduction in these behaviors,
this may indicate long-term welfare consequences for the bird concerning their health or their ability to perform natural behaviors
** denotes behaviors categorized as stress related behaviors for the purposes of this study: if birds show an increase in these
behaviors, this may indicate the birds are experiencing increased stress levels

Statistical Analyses

         To aid in ensuring that each species was accurately and sufficiently sampled, species that were
not successfully sighted and recorded in at least 70 percent of the total scans were excluded from the
formal results. Only two species (the pied imperial pigeon [Ducula bicolor] and blue-crowned motmot
[Momotus coeruliceps]) did not meet the cut-off of successfully being found in at least 70 percent of
scans; all other species were included in the formal analysis. In addition, due to the lack of variability in
environmental conditions recorded throughout the study (air temperature levels ranged from 26.7° C to
34.2° C per half hr scan, and humidity levels ranged from 19.0 g/m3 to 26.1 g/m3 per half hr scan), air
temperature and humidity levels were not included in the formal analysis.
         Data entry into GIS. A total of 132 scans were recorded over the 12 day period, with 11,115
bird observations in total. For each observation, the location of the bird in the enclosure was digitized
onto the digital aviary map in QGIS along with the corresponding bird, visitor and environmental
attribute data (Table 3). Visitor and environmental data were linked to bird data using date and time of
sampling period. Total visitor numbers for each 30 min period were calculated by summing the visitor
totals for the three corresponding 10 min scans. Average noise levels for each 30 min period were
calculated by averaging the noise levels for the three corresponding 10 min scans (Table 3). To determine
each bird’s distance from the path for each scan, a ‘nearest neighbor join’ that calculated the distance in
meters from each data point to the nearest part of the path, was performed in QGIS and added as an
additional attribute (Table 3). To map the locations in three-dimensions, points were converted to ‘Z-
points’ using the vertical distance of the bird from the ground as the Z coordinate. Presence of the birds in
ground vegetation cover (‘vegetation use’) was added as an attribute by digitizing the locations of heavy
ground vegetation onto the map. A ‘select by location’ was run on birds with a vertical distance of zero
against the ground vegetation cover layer (Table 3).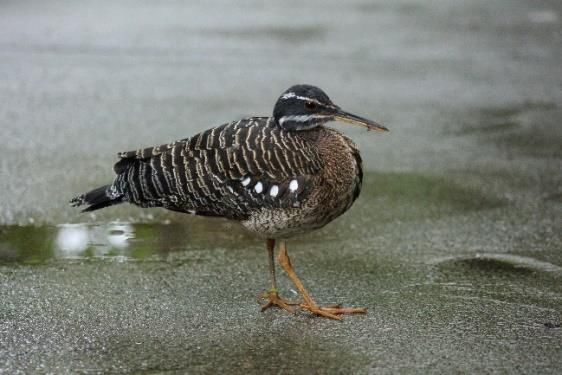
Blanchett et al. 56

Table 3

Attribute Data Recorded During Observations and Input into GIS

Attribute                 Description
Date                      Date that the data point was recorded

Time                      Time at the beginning of the 30 min scan sampling period during which the data point was recorded
                          (e.g., 9:00; 9:30, 10:00, etc.)

(X, Y, Z)                 X and Y coordinates automatically calculated from the location of the data point on the digital, to-scale,
Coordinates               aviary map in QGIS. Z Coordinate calculated from the vertical height of the birds from the ground

Vertical Height           Vertical height of the bird above the ground (m)

Species                   Species of the bird (Table 1)

Behavior                  Behavior being performed by the bird (Table 2)

Number of visitors        The total number of visitors who entered the aviary (including the two observers) during the
                          corresponding 30-min scan period (measured at 10 min scan sample intervals and summed per half hr
                          period)

Noise Level               Average noise level (dBa) recorded within the aviary during the corresponding 30 min scan period
                          (measured at ten-minute scan sample intervals and averaged per half hr period)

Vegetation Use            Is the bird in an area of ground level vegetation cover? (1 = Yes, 0 = No)

Distance from the         Distance of the bird from the visitor pathway (m) as calculated using the ‘nearest neighbour join’
Path                      function in QGIS

Note: Data collected throughout the study concerning the birds, visitor levels and sampling period, and input as attribute data
associated with the birds’ locational points onto the digital aviary map in QGIS. Associated attribute data for a bird in question
during any scan period can be quickly accessed by clicking on any locational point within the map in QGIS.

         Spearman’s correlation coefficients: Comparisons of the birds’ location in the aviary to
visitor variables. To determine how visitor numbers and noise levels were correlated with the birds’
horizontal distance from the path and vertical distance from the ground, Spearman’s Correlation
Coefficients were calculated using SAS software (University Edition version SAS Studio 3.6 and SAS
9.4M4; SAS Institute Inc., Cary, NC, USA). Spearman’s correlation coefficients were used to account for
the non-normal distribution of the variables. Correlations were calculated between the birds’ horizontal
distance from the path against; (1) the total number of visitors who entered the aviary during the
corresponding scan period, and; (2) the average noise level in the aviary during the corresponding scan
period. As well, correlations were calculated between the birds’ vertical distance above the ground
against; (1) the total number of visitors who entered the aviary during the corresponding scan period, and;
(2) the average noise level in the aviary during the corresponding scan period. Bonferroni corrections
were applied to account for the number of correlations run. Thus, a p-value of .0125 (0.05/4) was used to
determine significance.
         Chi-square test: Comparisons of the birds’ ground vegetation use to visitor numbers. To
determine how the birds’ presence in ground vegetation cover was associated with differing levels of
visitor numbers, a Chi-square test was run using SAS Software at a significance level of α = 0.05. A Chi-
square test was run comparing the number of scans in which birds were found in ground vegetation cover
in periods of low visitor numbers (classified as half hr scans in which two to 60 visitors entered the
aviary, n = 63) and the number of scans in which birds were found in ground vegetation cover in periods
of high visitor numbers (classified as scans in which 61 to 189 visitors entered the aviary, n = 69), with
the null hypothesis that there would be no association between the number of scans in which birds were
observed in ground vegetation cover and the visitor condition. A Fisher’s Exact test was run to analyze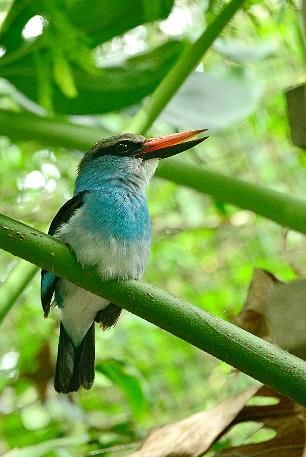
Blanchett et al. 57

the probability that vegetation use of birds in periods of high visitor numbers exceeds the probability of
vegetation use by birds in periods of low visitor numbers. Due to the nature of the observational study
design, there was an imbalance in sample sizes between scans that took place during low noise levels
(classified as scans in which noise levels ranged from 51.5 dBa to 61.5 dBa, n = 115 scans) and scans that
took place during high noise levels (classified as scans in which noise levels ranged from 61.6 dBa to
66.6 dBa, n = 17 scans). As such, the results of the Chi-square test for noise level comparisons were
statistically insignificant and not included in the formal results.
         Three-dimensional matrix: Range size comparisons. To assess changes in range size under
periods of differing visitor numbers, species’ range sizes were estimated and compared under periods of
low visitor numbers and periods of high visitor numbers (described above). Python (Python Version 2.7;
Python Software Foundation; Wilmington, DE, USA) was used to break the study area into a series of
three-dimensional 1 m3 grid cells. To determine which species were observed in each cell, the X, Y, Z
coordinates for each bird’s locational data point were collected in QGIS and overlaid on the grid cells. To
determine each species’ range size, counts of how many cells each species occupied under periods of low
visitor numbers and counts of how many cells each species occupied under periods of high visitor
numbers were performed. Number of cells occupied was then converted into range size estimates in cubic
meters. Percentage change in range size for each species, from periods of low visitor numbers to periods
of high visitor numbers, were calculated using these totals. Due to the small number of scans that took
place during periods of high noise levels, a representative sampling of species’ ranges during periods of
high noise levels could not be completed, and as such, the data did not allow for effective range
comparisons between periods of low noise levels and periods of high noise levels.
         Chi-square test: Behavior data comparisons. To determine how bird behavior was associated
with differing levels of visitor numbers, a Chi-square test was run using SAS Software at a significance
level of α = .05. Scans were categorized as either periods of high visitor numbers or periods of low visitor
numbers (as described previously). Pooling all of the species data, we counted the number of times each
stress related behavior (aggression, pacing) and each critical behavior (nesting, resting, and feeding and
drinking) were observed during periods of high visitor numbers and the number of times stress related
behavior and critical behavior were observed during periods of low visitor numbers. A Chi-square test
was run to compare the total count for each behavior type in periods of high visitor number and the total
count for each behavior type in periods of low visitor numbers, with the null hypothesis that there would
be no association between frequency of behavior observed and the visitor condition. Due to small sample
size, behavior data were pooled across species. Again, due to the imbalance in sample sizes between
scans that took place during low noise levels and scans that took place during high noise levels, the results
of the Chi-square test for noise level comparisons were statistically insignificant, and as such, not
included in the formal results.
                                                  Results

Summary of Aviary Conditions

         Visitor numbers and noise levels fluctuated throughout the study. Visitor numbers ranged from
two to 189 guests per half hour scan (M = 68 guests) and noise level readings ranged from 51.5 dBa to
66.6 dBa per half hour scan period (M = 59.0 dBa), equating to, approximately, what would be perceived
by humans as a two-fold increase in noise levels. From general observations of the aviary, it was noted
that visitors tended to move steadily through the aviary, spending two to three minutes walking along the
path. Most commonly, guests stopped at the kookaburra cage, the waterfall and the pond. Guest flow was
relatively steady, with large camp groups of children coming through sporadically throughout the day,
and visitor numbers increasing around 10:00am, and decreasing after 1:00pm. Calculation of correlation
coefficients showed that noise levels and visitor levels were moderately correlated (N = 132, r = .366, p <
.001).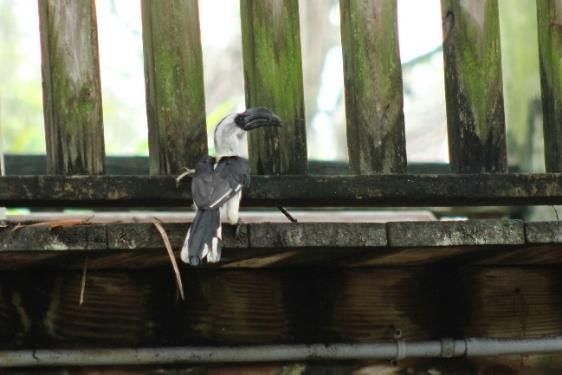
Blanchett et al. 58

Comparisons of the Birds’ Location in the Aviary to Visitor Variables

         Three species of birds displayed changes in distance from the visitor pathway as visitor numbers
and noise levels increased (Table 4). Two species showed a weak positive relationship between horizontal
distance from the path and visitor numbers. The helmeted guineafowl (N = 563, rs = .243, p < .001) and
the hottentot teal (N = 228, rs = .218, p = .001) were both found further away from the visitor path as
visitor numbers increased. In addition, both species and the demoiselle crane showed a weak positive
relationship between horizontal distance from the path and noise levels. The demoiselle crane (N = 263, rs
= .174, p = .005), the helmeted guineafowl (N = 563, rs = .222, p < .001) and the hottnetot teal (N = 228,
rs = .165, p = .126) were all found further away from the visitor pathway as noise levels increased. No
species showed a significant relationship between vertical distance from the ground and visitor numbers
or noise levels. In addition, visitor numbers and noise levels were positively correlated for the demoiselle
crane (N = 263, rs = .359, p < .001), helmeted guineafowl (N = 563, rs = .401, p
Blanchett et al. 59
Comparisons of the Birds’ Ground Vegetation Use to Visitor Numbers
For three species, there was a significant association between frequency of observed use of
ground vegetation cover and visitor condition (periods of low vs. high visitor numbers) (Table 5). The
hottentot teal (χ2(1, N= 111) = 4.045, p = .044 and the sunbittern ( χ2(1, N = 55) = 9.539, p = .002) were
both observed in vegetation cover more frequently during periods of high visitor numbers than periods of
low visitor numbers. Alternatively, the demoiselle crane (χ2(1, N = 26) = 7.323, p = .007) were observed
in vegetation cover less frequently during periods of high visitor numbers than periods of low visitor
numbers. For the hottentot teal (p = .030) and sunbittern (p = .001) the probability of the birds being
found in vegetation cover in periods of high visitor numbers exceeded the probability of the birds being
found in vegetation cover in periods of low visitor numbers. For the demoiselle crane the probability of
the birds being found in vegetation cover in periods of low visitor numbers exceeded the probability of
the birds being found in vegetation cover in periods of high visitor numbers (p = .998).
Table 5
Association between Vegetation Use and Level of Visitor Numbers
Number of scans in which Number of scans in which
Overall birds were present in ground birds were present in ground Chi square test of
Species
sample vegetation cover in low vegetation cover in high independence
visitor periods visitor periods
Demoiselle crane 26 19 7 X2 = 7.323
(Anthropoides p = .007
virgo) df = 1
Hottentot teal 111 45 66 X2 = 4.045
(Spatula hottentota) p = .044
df = 1
Sunbittern 55 15 40 X2 = 9.539
(Eurypyga helias) p = .002
df = 1
Note. Species that displayed significant results for the Chi-square test examining the association between the birds’ use of ground
vegetation cover and the visitor condition (scans with low visitor numbers [two to 60 visitors per half hr scan], scans with high
visitor numbers [61 to 189 visitors per half hour scan]). Significance determined at α = 0.05.
Changes in Range Size
Several species displayed differences in range size between periods of low and high visitor
periods (Table 6). Decreases in range size of at least 10 percent from periods of low visitor numbers to
periods of high visitor numbers, were seen in the African openbill (range decrease = -13.95, nlow = 53,
nhigh = 63), blue breasted kingfisher (range decrease = -22.73 percent, nlow = 53, nhigh = 56), great curassow
(range decrease = -21.43 percent, nlow = 57, nhigh = 64), hottentot teal (range decrease = -20.59 percent,
nlow = 59, nhigh = 64), and the scarlet ibis population in section A of the aviary (range decrease = -12.68
percent, nlow = 63, nhigh = 69). Alternatively, increases in range sizes of at least 10 percent from periods of
low visitor numbers to periods of high visitor numbers, were seen in the blue-belied roller (range increase
= 18.8 percent, nlow = 59, nhigh = 62), eastern crested guineafowl (range increase = 10.53 percent, nlow = 63,
nhigh = 68), little blue heron (range increase = 27.27 percent, nlow = 57, nhigh = 62), sacred ibis (range
increase = 15.78 percent, nlow = 62, nhigh = 69) and Von der Decken’s hornbill (range increase = 18.42
percent, nlow = 42, nhigh = 56).Blanchett et al. 60
Table 6
Changes in Range Size Under Periods of High Visitor Numbers
Change in range size under periods
Species of high visitor numbers
(% increase/decrease)
Section A
African openbill (Anastomus lamelligerus) - 13.95
African spoonbill (Platalea alba) - 6.78
Black-bellied whistling duck - 5.71
(Dendrocygna autumnalis)**
Boat-billed heron (Cochlearius cochlearius) 7.02
Buff-banded rail (Hypotaenidia philippensis)** -2.70
Demoiselle crane (Anthropoides virgo) - 4.62
Great curassow (Crax rubra) - 21.43
Helmeted guineafowl (Numida meleagris) 1.90
Hottentot teal (Spatula hottentota)** - 20.59
Mandarin duck (Aix galericulata)** - 3.39
Sacred ibis (Threskiornis aethiopicus) 15.78
Scarlet ibis (Eudocimus ruber) - 12.68
Spotted whistling duck (Dendrocygna guttata)** 2.86
Sunbittern (Eurypyga helias)** -3.03
Von der Decken’s hornbill (Tockus deckeni)** 18.42
Section B
Blue-bellied roller (Coracias cyanogaster) 18.18
Blue-breasted kingfisher (Halcyon malimbica) - 22.73
Eastern crested guineafowl (Guttera pucherani) 10.53
Inca tern (Larosterna inca) -6.94
Little blue heron (Egretta caerulea) 27.27
Red-legged seriema (Cariama cristata) 3.23
Scarlet ibis (Eudocimus ruber) 6.52
Violet turaco (Musophaga violacea) 0.00
Note: Percent changes in range size were calculated from periods of low (two to 60 visitors per half hr scan) to high (61 to 189
visitors per half hr scan) visitor numbers. Changes in range size were estimated using a three-dimensional matrix, with changes in
range size – increases or decreases – of more than 10 percent bolded.
* denotes species that can move between both sections of the aviary
Behavior Data Comparisons
There was no significant association observed between behavior counts (stress related behavior
[aggression, pacing] and critical behavior [nesting, resting, and feeding and drinking]) and visitor
condition (periods of low vs. high visitor numbers) (χ2 (4, N = 2357), p = .075).
Discussion
Changes in Enclosure Use as Visitor Numbers and Noise Levels Increase
Several changes in enclosure use were seen across the 24 bird species under periods of increased
visitor numbers and noise levels (Table 4). Movement away from the visitor pathway as visitor presence
within the aviary increased was seen in three species (demoiselle crane, helmeted guineafowl, and
hottentot teal). Distance of animals from visitor viewing areas has been used as a measure of visitor
impact in many previous studies (Bonnie et al., 2016; Larsen et al., 2014; Sherwen, Harvey, et al., 2015;
Sherwen, Hemsworth, et al., 2015; Sherwen, Magrath, Butler, & Hemsworth, 2015; Sherwen et al., 2014).
It has been proposed that animals that move further away from viewing areas as visitor presence
increases, may perceive visitors as a potentially fear-provoking or disruptive stimulus, from which theBlanchett et al. 61
animals are actively distancing themselves (Sherwen, Harvey, et al. 2015; Sherwen, Magrath, Butler, et
al., 2015). Thus, these may be responses of the birds that could indicate that they are actively distancing
themselves from some aspect of increasing visitor levels that they find disruptive.
It is interesting to note all of the birds that distanced themselves from the visitor pathway were
species that spent the majority, or all, of their time at ground level. As well, vertical distance above the
ground did not appear to be influenced by visitor numbers or noise levels. This suggests that the ability of
birds to position themselves above, or distance themselves from, visitors on a vertical scale, may play a
role in reducing the likelihood that birds will respond to increases in visitor presence. This agrees with the
results of a similar study examining orangutans housed in two different free-range enclosures (Choo et al.,
2011). When the orangutans were housed in an enclosure elevated above visitors, visitor numbers had no
impact on the orangutans’ behavior. However, when the orangutans were housed in an enclosure
positioned at visitor eye level, as visitor numbers increased so did alert and begging behaviors directed
towards visitors. From this, the authors concluded that housing the orangutans in elevated positions above
visitors may have provided the orangutans with a greater sense of security or dominance. Thus, it appears
that birds that spent the majority of their time in the canopy may have had a greater sense of security than
the birds that spent the majority of their time at ground level, due in part to their ability to position
themselves elevated above visitors.
Vegetation use and range size were also examined as outcomes that might be associated with
increased visitor levels. Two species (hottentot teal and sunbittern) displayed an increased use of
vegetation cover during periods of high visitor numbers (Table 5). Additionally, in five species (African
openbill, blue-breasted kingfisher, great curassow, hottentot teal and the scarlet ibis population in section
A of the aviary), decreases in range size of at least 10 percent were observed during periods of high
visitor numbers (Table 6). Four of these species (African openbill, blue-breasted kingfisher, great
curassow, and scarlet ibis) did not show movement away from the visitor pathway as visitor number/noise
levels increased. Thus, these reductions in range size do not necessarily appear to be focused around the
path where visitors were present, but instead, may be a decrease in the overall space that the birds were
using, regardless of their position in the enclosure. Previous studies have recorded percent of time spent
out of sight (Collins & Marples, 2016; Downes, 2012), or degree of visibility of animals (Mun et al.,
2013; Schäfer, 2014; Sherwen et al., 2014), as potential components of negative visitor effects. Similarly,
reductions in range sizes or partial visibility achieved in vegetation cover may be alternative responses
used to maintain control over how the animals interact with, or the extent to which they interact with,
visitors in their environment as a potentially disruptive stimulus.
Welfare Implications: Behavior
Our results provided no evidence that visitor period (periods of low or high visitor numbers)
significantly influenced the performance of stress (aggression, pacing) or critical behaviors (feeding and
drinking, nesting, resting). Thus, there was no evidence to indicate that the birds were experiencing
increasing stress levels or interference with their critical behaviors as a result of high visitor numbers. It
should be noted, species that had a greater number of individuals in their population (e.g., scarlet ibis with
a population of 39 birds, as compared to the blue-breasted kingfisher with only one bird) may have a
disproportionate effect on the results. However, the performance of stress related behaviors remained low
throughout the duration of the study across all species. Aggression behavior made up 0.40 percent of total
behavior recorded, and pacing made up 0.35 percent of total behavior. These low levels of stress related
behaviors may have made the birds less susceptible to visitor effects overall. Regardless, working within
the constraints of the current study, the results provided no outward evidence that suggests that the
welfare of the birds housed in the Main Free-flight Aviary was negatively impacted by increasing visitor
numbers. When considering this conclusion in conjunction with the birds’ use of their enclosure, it
appears that the manner in which the birds were using the space within the aviary may be responsible for
minimizing effects of high visitor numbers, explaining the low level of behavioral changes observed.Blanchett et al. 62
Potential Coping Mechanisms: Bringing Together Behavior and Enclosure Use
We propose that the changes in enclosure use observed in several species – movement away
from the visitor pathway, increases in vegetation use, and decreases in range sizes – may in themselves be
mechanisms used to cope with increasing visitor numbers and noise levels. The species that showed these
responses may still find high numbers of visitors to be aversive or disruptive. However, the ways in which
they altered their enclosure use under periods of increased visitor numbers and noise levels appears to
allow for multiple means in which the birds could use the control and freedom of movement provided to
them in a barrier-free enclosure to distance themselves from visitor presence. These measures provide
insight into the mechanisms by which animals may utilize these properties of free-range enclosures to
minimize visitor effects (Anderson et al., 2002; Choo et al., 2011; Collins et al., 2017; Collins & Marples,
2016; Fernandez et al., 2009; Hosey, 2000; Rose et al., 2018; Woolway & Goodenough, 2017). It is
proposed that these responses may keep stress levels of the birds low, in respect to visitor numbers and
noise levels, explaining the apparent lack of influence of visitor numbers on behavior. Thus, these birds
may have adapted to visitor presence in the aviary, at least in part, through the use of their environment as
a means of coping with increasing visitor levels. Factors such as habituation or a positive perception of
visitors due to a positive relationship with keepers should also be considered as playing a role in
minimizing the behavioral responses observed (Choo et al., 2011; Collins et al., 2017; Woolway &
Goodenough, 2017). These factors may be particularly relevant for species that showed no apparent
changes in their movement away from the visitor pathway, use of vegetation cover, or changes in range
size as visitor numbers varied (African spoonbill, black-bellied whistling duck, boat-billed heron, buff-
banded rail, Inca tern, mandarin duck, red-legged seriema, spotted whistling duck, violet turaco and the
scarlet ibis housed in section B of the aviary). Habituation and/or a positive perception of humans due to
keeper relationships may explain in-part the apparent lack of visitor effects observed in these species.
Limitations and Future Directions
Firstly, the weak correlations between the distance of the birds from the visitor pathway and
visitor numbers/noise levels must be considered. Although the trends indicate a relationship between
visitor presence and enclosure use, they also indicate that there is more variation that may be accounted
for through variables that were not measured. For instance, individual temperament, the animal’s size, if
the animal is a prey species, and previous exposure to humans, are all factors that have been noted as
potentially impacting how an animal responds to increasing visitor levels (Fernandez et al., 2009; Stoinski
et al., 2012; Woolway & Goodenough, 2017). As well, due to the presence of the observers, a ‘no visitor
period’ could not be achieved. As such, the possibility must be considered that, for some species, any
humans within the enclosure may have been enough to induce a visitor effect, potentially impacting their
enclosure use and behaviors throughout the duration of the study. The 12-day sampling period and the 30
min delay between consecutive samples of individual birds should also be considered as limitations, as
the study may not have captured the full extent of bird behavior, enclosure use, and visitor and
environmental variability. These factors, as well as the small sample sizes available for many of the
species at Zoo Tampa at Lowry Park, should be taken into account when extrapolating the results of this
study to other zoos or institutions. Overgeneralization of visitor effects should be avoided. Instead, studies
such as this add to the collective information surrounding the topic, providing insight that may be helpful
when informing future housing decisions, but must still be considered within the context of each unique
scenario. As such, research that focuses on the topics discussed above, which could not be accommodated
in the current study, is critical.
The Benefits of Incorporating GIS
Throughout data collection, storage and analysis, GIS proved to be a helpful tool. GIS has been
used twice previously to examine visitor effects in zoos (Bonnie et al., 2016; Smith, 2014). In both cases,Blanchett et al. 63
digital maps were used to track the three-dimensional locations of individual primates (gorillas and
orangutans) comparing the vertical and horizontal distance of the animals from the visitor viewing areas,
to the number of visitors surrounding the enclosure. In the current study, we found that GIS allowed for
the easy collection of precise 3D location data, in an environment where equally detailed quadrant
sampling would not have been possible due to the size and complexity of the aviary. GIS as a tool to
study enclosure use in zoos, apart from the context of visitor effects, is explored further in an
accompanying paper (Blanchett et al., in prep). In that manuscript, the same data set described here is
used to map and compare the grouping patterns of species distribution, habitat use and range overlap in
the community of birds housed in the Main Free-flight Aviary at Zoo Tampa at Lowry Park.
Conclusion
The purpose of this study was to examine how the enclosure use of birds housed in a mixed
species free-range environment varied under differing levels of visitor numbers and noise levels. Several
changes in the birds’ use of their enclosure were observed during periods of high visitor numbers,
including; movement further away from the visitor path, decreased range size, and increased use of
ground vegetation cover. However, the lack of substantial changes in critical behaviors and stress related
behaviors observed appears to indicate little to no negative welfare consequences for the birds under such
circumstances. As such, it is suggested that changes in enclosure use exhibited by some of the birds,
worked as a coping mechanism to manage and mitigate potentially stressful visitor effects. These findings
support the theory that the freedom of movement, allowance for retreat spaces, and greater degree of
control allowed for in free-range environments, decreases the potential for negative welfare consequences
from visitor effects. Information on birds living in free-range enclosures serves to add to the limited
information currently available concerning visitor effects on birds. Understanding more about these
responses in the context of visitor effects is crucial for striking a balance with habitats that both the
animals, as well as the visitors, can enjoy and benefit from to the greatest extent.
Ethical Approval
Ethical approval for the current study was obtained through the University of Guelph Animal
Care Services (approval number # 3759).
Acknowledgements
We would like to acknowledge that an associated report using the same data set is being prepared
for publication at the current time.
This research was supported in part by the Ontario Graduate Scholarship and the Graduate
Research Tuition Scholarship provided through the University of Guelph. We would like to acknowledge
the keepers and staff at the Main Free-flight Aviary, Zoo Tampa at Lowry Park, for their invaluable
insight into the birds. As well, many thanks to the Vice President of Medical Sciences and Senior
Veterinarian at Zoo Tampa at Lowry Park, Dr. Ray Ball, for his support facilitating this research. As well,
thanks to Dr. Ian Duncan and Dr. Andy Robinson for their contributions to the research. We are also very
grateful to Shining Wang for her assistance in data collection, and Dave Parkinson and Bethany Vlaming
for the provisioning of appendix photos. We thank Daryl Blanchett and Adam Bonnycastle for their aid in
methods development and Dr. Michelle Edwards for her aid with the development of statistical analysis
procedures.
References
Anderson, U. S., Benne, M., Bloomsmith, M. A., & Maple, T. L. (2002). Retreat space and human visitor density
moderate undesirable behavior in petting zoo animals. Journal of Applied Animal Welfare Science, 5, 125–
137.Blanchett et al. 64
Blanchett, M., Finegan, E., Bonnycastle, A., & Atkinson, J. Using GIS to examine space selection and enclosure use
by birds within a mixed species free-ranging zoo environment. In preparation.
Bonnie, K. E., Ang, M. Y. L., & Ross, S. R. (2016). Effects of crowd size on exhibit use by and behavior of
chimpanzees (Pan troglodytes) and Western lowland gorillas (Gorilla gorilla) at a zoo. Applied Animal
Behaviour Science, 178, 102–110.
Carlstead, K., & Shepherdson, D. (2000). Alleviating stress in zoo animals with environmental enrichment. In G.P.
Moberg, & J. A. Mench (Eds.), The biology of animal stress: Basic principles and implications for animal
welfare (pp. 337-354). New York: CABI Publishing.
Choo, Y., Todd, P. A., & Li, D. (2011). Visitor effects on zoo orangutans in two novel, naturalistic enclosures.
Applied Animal Behaviour Science, 133, 78–86.
Claxton, A. M. (2011). The potential of the human-animal relationship as an environmental enrichment for the
welfare of zoo-housed animals. Applied Animal Behaviour Science, 133, 1–10.
Clayton, S., Fraser, J., & Saunders, C. D. (2009). Zoo experiences: Conversations, connections, and concern for
animals. Zoo Biology, 28, 377–397.
Collins, C., Corkery, I., Haigh, A., McKeown, S., Quirke, T., & O’Riordan, R. (2017). The effects of environmental
and visitor variables on the behavior of free-ranging ring-tailed lemurs (Lemur catta) in captivity. Zoo
Biology, 36, 250–260.
Collins, C. K., & Marples, N. M. (2015). Zoo playgrounds: A source of enrichment or stress for a group of nearby
cockatoos? A case study. Journal of Applied Animal Welfare Science, 18, 375–387.
Collins, C. K., & Marples, N. M. (2016). The effects of zoo visitors on a group of Western lowland gorillas Gorilla
gorilla before and after the birth of an infant at Dublin Zoo. International Zoo Yearbook, 50, 183–192.
Davey, G. (2007). Visitors’ effects on the welfare of animals in the zoo: A review. Journal of Applied Animal
Welfare Science, 10, 169–183.
de Azevedo, C. S., Figueiredo Lima, M. F., da Silva, V. C. A., Young, R. J., & Rodrigues, M. (2012). Visitor
influence on the behavior of captive greater rheas (Rhea americana, Rheidae Aves). Journal of Applied
Animal Welfare Science, 15, 113–125.
de Vere, A. J. (2018). Visitor effects on a zoo population of California sea lions (Zalophus californianus) and harbor
seals (Phoca vitulina). Zoo Biology, 37, 162–170.
Downes, K. (2012). Is there a visitor effect on behaviour and enclosure use of mixed bird species in a zoo enclosure?
The Plymouth Student Scientist, 5, 38–60.
Fernandez, E. J., Tamborski, M. A., Pickens, S. R., & Timberlake, W. (2009). Animal-visitor interactions in the
modern zoo: Conflicts and interventions. Applied Animal Behaviour Science, 120, 1–8.
Hosey, G. (2000). Zoo animals and their human audiences: What is the Visitors Effect? Animal Welfare, 9, 343–357.
Hosey, G. (2008). A preliminary model of human-animal relationships in the zoo. Applied Animal Behaviour
Science, 109, 105–127.
Hosey, G. (2013). Hediger revisited: How do zoo animals see us? Journal of Applied Animal Welfare Science, 16,
338–359.
Hosey, G., & Melfi, V. (2014). Are we ignoring neutral and negative human-animal relationships in zoos? Zoo
Biology, 34, 1–8.
IUCN Red List. (2018). IUCN Red List of Threatened Species TM. https://www.iucnredlist.org/
Kyngdon, D. J., Minot, E. O., & Stafford, K. J. (2003). Behavioural responses of captive common dolphins
Delphinus delphis to a “Swim-with-Dolphin” programme. Applied Animal Behaviour Science, 81, 163–
170.
Larsen, M. J., Sherwen, S. L., & Rault, J. L. (2014). Number of nearby visitors and noise level affect vigilance in
captive koalas. Applied Animal Behaviour Science, 154, 76–82.
Martin, P., & Bateson, P. (2007). Measuring behaviour: An introductory guide. Cambridge, UK: Cambridge
University Press.
Morgan, K. N., & Tromborg, C. T. (2007). Sources of stress in captivity. Applied Animal Behaviour Science, 102,
262–302.
Mun, J. S. C., Kabilan, B., Alagappasamy, S., & Guha, B. (2013). Benefits of naturalistic free-ranging primate
displays and implications for increased human-primate interactions. Anthrozoos, 26, 13–26.
Quadros, S., Goulart, V. D. L., Passos, L., Vecci, M. A. M., & Young, R. J. (2014). Zoo visitor effect on mammal
behaviour: Does noise matter? Applied Animal Behaviour Science, 156, 78–84.
Reade, L. S., & Waran, N. K. (1996). The modern zoo: How do people perceive zoo animals? Applied Animal
Behaviour Science, 47, 109–118.You can also read