Antioxidant Activity of Sprouts Extracts Is Correlated with Their Anti-Obesity and Anti-Inflammatory Effects in High-Fat Diet-Fed Mice - Hindawi.com

Page created by Julia Chambers
 
CONTINUE READING
Antioxidant Activity of Sprouts Extracts Is Correlated with Their Anti-Obesity and Anti-Inflammatory Effects in High-Fat Diet-Fed Mice - Hindawi.com
Hindawi
Evidence-Based Complementary and Alternative Medicine
Volume 2021, Article ID 8367802, 13 pages
https://doi.org/10.1155/2021/8367802

Research Article
Antioxidant Activity of Sprouts Extracts Is Correlated with Their
Anti-Obesity and Anti-Inflammatory Effects in High-Fat
Diet-Fed Mice

          Chung Shil Kwak ,1 Mi-Ju Kim,1 Sunyeong Park,2 and In Gyu Kim3
          1
            Institute on Aging, Seoul National University College of Medicine, Seoul 03080, Republic of Korea
          2
            Dain Natural Co., Seoul 04788, Republic of Korea
          3
            Department of Biochemistry and Molecular Biology, Seoul National University College of Medicine,
            Seoul 03080, Republic of Korea

          Correspondence should be addressed to Chung Shil Kwak; kwakcs@snu.ac.kr

          Received 22 June 2020; Revised 22 January 2021; Accepted 30 January 2021; Published 16 February 2021

          Academic Editor: Rômulo Dias Novaes

          Copyright © 2021 Chung Shil Kwak et al. This is an open access article distributed under the Creative Commons Attribution
          License, which permits unrestricted use, distribution, and reproduction in any medium, provided the original work is
          properly cited.

          Obesity is closely associated with oxidative stress and chronic inflammation leading to related metabolic diseases. Some natural
          extracts or polyphenols reportedly possess anti-obesity and anti-inflammatory effects as well as antioxidant activity. In this study,
          we assessed the correlations between the antioxidant, anti-obesity, and anti-inflammatory activities of plant extracts with potent
          antioxidant activity in diet-induced obese mice. Sprouts of Cedrela sinensis (CS) and Oenothera biennis L. (OB) were selected as
          the most potent antioxidant plant based on analysis of in vitro antioxidant activity of the extracts of ten different edible plants.
          C57BL/6 mice were fed with a high-fat diet (HFD) and orally treated with 50% ethanol extract of CS or OB at 50 or 100 mg/kg body
          weight 5 days a week for 14 weeks. Body weight gain, weight of adipose tissue, adipocyte size, and levels of lipid metabolism,
          inflammation, and oxidative stress markers were investigated. The CS or OB extract reduced body weight gain, visceral adipose
          tissue weight, adipocyte size, and plasma leptin levels, and expressions of adipogenic genes (PPARc and fatty acid synthase) in the
          adipose tissue and liver of HFD-fed mice. Both extracts also reduced mRNA levels of pro-inflammatory cytokines (IL-6 and TNF-
          α) and oxidative stress-related genes (heme oxygenase- (HO-) 1 and p40phox). Body weight gain of mice was significantly
          correlated with visceral adipose tissue weight and adipocyte size. Body weight gain and adipocyte size were significantly correlated
          with plasma total cholesterol and 8-epi PGF2α levels, mRNA levels of leptin, HO-1, p40phox, and CD-11 in the adipose tissue, and
          mRNA levels of TNF-α in the adipose tissue and liver. These results suggest that the CS and OB extracts with potent antioxidant
          activity may inhibit fat deposition in adipose tissue and subsequent inflammation.

1. Introduction                                                         in various tissues [2, 3]. Particularly, fat accumulation in
                                                                        adipocytes induces the expression of NF-kB-dependent
Obesity increases the risk of various metabolic diseases                adipokines, which elicit inflammation by recruiting mac-
including type-2 diabetes, hypertension, fatty liver, and               rophage and neutrophil. These immune cells further stim-
cardiovascular diseases. Obesity-induced oxidative stress               ulate the production of ROS by activating several enzymes
and inflammation may cause the development of obesity-                   such as NADPH oxidase and xanthine oxidase. Excessive
associated metabolic diseases [1]. High fat consumption                 ROS induce oxidative damage of DNA, lipids, and proteins
leads to hyperlipidemia and subsequent increase of fatty acid           in cells, thereby leading to various diseases [4, 5].
oxidation and cellular reactive oxygen species (ROS), which                 Chronic and sterile low-grade inflammation is fre-
activates the nuclear factor kappa beta (NF-κB) pathway and             quently observed in the adipose tissue, liver, and kidneys of
thus increases the secretion of pro-inflammatory cytokines               obese humans and rodents [6, 7]. Previous reports have
2                                                                   Evidence-Based Complementary and Alternative Medicine

implicated the increased number of inflammatory molecules           2.2. In Vitro Antioxidant Activity. In vitro antioxidant ac-
including tumor necrosis factor-alpha (TNF-α), interleukin         tivity of sample extracts was evaluated by two different
(IL)-6, inducible nitric oxide synthase (iNOS), transforming       methods using ascorbic acid (AA) as a positive control. First,
growth factor-beta (TGF-β), monocyte chemoattractant               2,2-diphenyl-1 picrylhydrazyl (DPPH) radical scavenging
protein- (MCP-) 1, and plasminogen activator inhibitor             activity was determined as per methods described previously
(PAI)-1 secreted from visceral adipose tissue in the path-         [19]. The sample concentration that lowered the concen-
ological processes of vascular stiffness, insulin resistance,       tration of the radicals by 50% (IC50) was calculated. Second,
and plaque formation in an arterial wall of obese animals          ferric reducing antioxidant power (FRAP) was measured as
[8–11]. These findings suggest that antioxidant therapy may         per previously described methods [20]. The sample con-
be useful for the prevention of obesity-induced chronic            centration showing the equal reducing activity to 10 µg AA/
diseases. In this regard, the discovery of novel antioxidant       mL (EC10AA) was calculated.
agents with anti-obesity and anti-inflammatory effects is
important.
    Polyphenols, antioxidants and prebiotics from natural          2.3. Animals, Diets, and Treatment. Male C57BL/6 mice (5-
plants, and probiotics have recently been shown to be ef-          week-old) were obtained from DBL Co. (Eumsung,
fective for the prevention of obesity and its related com-         Korea). After one week of acclimatization, the mice were
plications in animals or humans [12–14]. The extracts of           allocated into seven groups (n � 7–8 mice per group). The
plant leaves and berries are rich sources of natural anti-         mice were fed with a rodent low-fat diet (LFD; D12450 B,
oxidant. These extracts and some phytochemicals can reduce         Research Diet, New Brunswick, NJ) containing 3.82 Kcal/
lipid accumulation and ROS generation in adipocytes by             g, fat 10% kcal, protein 20% kcal, and carbohydrate 70%
downregulating gene expression involved in adipogenesis            kcal or with a rodent high-fat diet (HFD; D12451, Re-
and lipogenesis and/or by upregulating lipolysis-related gene      search diet) containing 4.7 Kcal/g, fat 45% kcal, protein
expression [15, 16]. Resveratrol supplementation can at-           20% kcal, and carbohydrate 35% kcal ad libitum for 14
tenuate the increased inflammatory response and oxidative           weeks. Lycopene beadlets (LY; Lycored, Branchburg, NJ)
stress in the adipose tissue of high-fat diet- (HFD-) induced      containing 5% natural lycopene extracted from tomato
obese mice by suppressing NF-kB signaling and by stimu-            was the positive control. Mice fed with HFD were treated
lating sirtuin 1 expression [1]. Another report described a        orally with the CS extract, OB extract, LY, or vehicle
significantly positive correlation between ROS production           (saline) 5 days a week. The animal groups are as follows:
and lipid accumulation in 3T3-L1 cells treated with several        (1) LFD control (LFC) : LFD + vehicle treatment, (2) HFD
wild herb extracts [17]. Interestingly, whole plant extracts       control (HFC) : HFD + vehicle treatment, (3) LY :
and mixtures of flavonoids were reported to have superior            HFD + treatment with 50 mg LY/kg body weight, (4) CS-
effects compared to each isolated phytochemical [15, 18].           L : HFD + treatment with 50 mg CS extract/kg body
    Young leaves and sprouts of various plants are consumed        weight, (5) CS-H; HFD + treatment with 100 mg CS ex-
as a food in Korea, especially in springtime. To assess the        tract/kg body weight, (6) OB-L : HFD + treatment with
relationship among the antioxidant activity, anti-obesity          50 mg OB extract/kg body weight, and (7) OB-H :
activity, and anti-inflammatory activity of plants, we com-          HFD + treatment with 100 mg OB extract/kg body
pared in vitro antioxidant activity of the extracts from the       weight.
edible parts of ten different plants. We also examined the              The mice were kept in a temperature- and humidity-
anti-obesity and/or anti-inflammatory effects of two extracts        controlled room. During the experiment, body weight and
with higher antioxidant activity using HFD-fed mice.               diet intake of animals were measured regularly. Diet was
                                                                   replaced every other day. Food consumption weight of the
2. Materials and Methods                                           animals in each cage was estimated by subtracting the
                                                                   remaining weight from the supplied weight. Food efficient
2.1. Sample Preparation and Extraction. Dried young leaves,        ratio (FER) was calculated as the total body weight gain/total
sprouts, or aerial parts of Ipomoea batatas (IB), Boehmeria        food intake × 100.
nivea (L.) Gaudich (BN), Morus alba L. (MA), Acanthopanax              The mice were starved overnight on the last day of the
koreanum (AK), Cedrela sinensis (CS), Oenothera biennis L.         experiment. Blood was collected from the venous orbital
(OB), Equisetum arvense L. (EA), Artemisia princeps Pamp.          plexus in EDTA-coated tubes (BD, Canaan, CT) under the
Hara (AP), Oenanthe javanica (Blume) DC. (OJ), and Glebionis       inhalation anesthesia using 2.5% isoflurane (Sigma Aldrich,
coronaria (GC) were purchased from commercial sources,             Saint Louis, MO) in oxygen. After cervical dislocation, liver
TOJONGHERB or ONSKYFARM (Namyangju, Korea). To                     and visceral adipose tissues (epididymal and perirenal) were
obtain the sample extract, 1 kg of pulverized sample was stirred   removed and weighed. Some pieces of liver and epididymal
in ten volumes of 50% ethanol (Samchun, Seoul, Korea) for 24       fat tissue were frozen in Trizol reagent (QIAGEN, Hilden,
hours at room temperature and reflux-extracted for another 24       Germany) or liquid nitrogen, and another piece of epi-
hours at 80°C. The supernatant was filtered, concentrated using     didymal fat tissue was fixed in 10% paraformaldehyde so-
a rotary vacuum evaporator (Eyela, Tokyo, Japan), and dried        lution. The experimental protocol was approved by the
using an oven dryer (Daesan Machinery, Gyeongju, Korea) for        Institutional Animal Care and Use Committees of Woojung
48 hours at 70°C. Finely powdered sample from each extract         Genome Research Center (Suwon, Korea) (WJLA-
was stored at −20°C.                                               CUC20191118-4-18).
Evidence-Based Complementary and Alternative Medicine                                                                       3

2.4. Blood Biochemical Analysis. Concentrations of triglyc-    2.8. Statistical Analysis. Data are presented as the
eride and total cholesterol in plasma were determined using    mean ± standard deviation (SD). Significant differences
the AceChem kit (Youngdong Pharm., Korea). Aspartate           between groups were determined by ANOVA, followed by
aminotransferase (AST) and alanine aminotransferase            the Duncan’s multiple range test using SAS v9.4 (SAS
(ALT) levels were measured using a commercial kit (Asan        Institute, Cary, NC). Correlations between variables were
Pharm, Whasung, Korea). Malondialdehyde (MDA), 8-epi-          determined using the Pearson correlation coefficient.
prostaglandin (PG) F2α, and leptin levels in plasma were       Statistical significance was set at P < 0.05.
determined using commercial ELISA kit (Elabscience,
Wuhan, China, or Komabiotech, Seoul, Korea) according to       3. Results
the manufacturer’s instruction.
                                                               3.1. Potent In Vitro Antioxidant Activities of CS and OB
                                                               Extracts. To compare the antioxidant activity of samples, we
2.5. Measurement of Adipocyte Size of Mice. Fixed epididy-     evaluated the DPPH radical scavenging activity (IC50) and
mal adipose tissues were processed routinely for paraffin        FRAP (EC10AA) of the extracts. Data on the in vitro anti-
embedding, sectioned, and then stained with hematoxylin-       oxidant activity and extraction yield of the extracts are
eosin (H&E). The morphology was observed at three fields a      summarized in Table 2. The OB extract showed the highest
sample (x200) and the images were documented using an          DPPH radical scavenging activity, followed by the CS ex-
optical microscope with digital camera (Olympus, Tokyo,        tract. The OB extract also showed the highest FRAP, fol-
Japan). The size of adipocyte was analyzed from 60 adipo-      lowed by the extracts of AK and CS. These results indicated
cytes a sample (20 each field) using the Image J (NIH,          the potent antioxidant activities of the OB and CS extracts.
Bethesda, MD).                                                 These extracts were selected for the animal study to explore
                                                               their anti-obesity and anti-inflammatory effects.
2.6. Total RNA Extraction and Quantitative PCR (qPCR)
Analysis. Total RNA of epididymal adipose tissue and liver     3.2. CS and OB Extracts Reduce the Body Weight, Visceral Fat,
were isolated using the RNeasy Lipid Mini kit (QIAGEN),        and FER in HFD-Fed Mice. The body weights of the HFC
and cDNA was synthesized using Superscript®II Reverse          group were significantly higher than those of the LFC group
Transcriptase kit (Thermo Fischer Scientific, Waltham, MA).     after 4 weeks. The body weights of the OB-H group were
The mRNA expression levels of genes were analyzed using a      significantly lower than those of the HFC group after 7
Real-Time PCR system (Bio-Rad, Hercules, CA) and the           weeks. The body weights of the OB-L and CS-H groups and
SYBR FAST qPCR Master Mix (Kapa Biosystems, Wil-               the CS-L and LY groups were significantly lower than those
mington, MA). Glyceraldehyde 3-phosphate dehydrogenase         of the HFC group after 10 weeks and 13 weeks, respectively
(GAPDH) was used as a reference gene. Relative gene ex-        (Figure 1). At 14 weeks, body weight gains of the HFC group
pression levels were calculated using the 2−ΔΔCt method. The   were increased approximately 2.3-fold compared with those
sequence of the primers used in this study is shown in         of the LFC group. The average body weight gains of the LY,
Table 1.                                                       CS-L, CS-H, OB-L, and OB-H groups were reduced by
                                                               28.8%, 27.7%, 43.5%, 44.6%, and 46.7%, respectively,
                                                               compared to the weight gains of the HFC group. These
2.7. Measurement of Thiobarbituric Acid-Reactive Substance     results indicate that supplementation with the CS and OB
(TBARS) Levels and Antioxidant Enzymes Activities in the       extracts, especially OB, reduced the body weight gains more
Liver Tissue of Mice. To determine the TBARS concen-           effectively than LY treatment (Table 3).
trations in the liver, the liver sample was homogenized in         The HFC group of mice consumed less diet but more
10 volumes of buffer containing 150 mM KCl, 50 mM Tris-         energy than the LFC group. Treatment with the LY, CS, and
HCl, and 1 mM EDTA (pH 7.4) using the Ultra-Turrax             OB extracts did not affect the food intake and energy intake
tissue homogenizer (IKA Works, Wilmington, NC). The            of mice. Feeding the HFD resulted in an approximately 2.6-
homogenates were centrifuged at 800 × g for 10 min at 4°C      fold increase of FER compared with LFD feeding. The in-
and the supernatant (10% homogenate) was collected.            crease was significantly reduced by treatment with the LY,
TBARS concentrations in the 10% homogenate were                CS, and OB extracts. Particularly, the OB extract was more
determined according to the methods previously de-             effective than the LY or CS extract (Table 3). Visceral fat
scribed [21]. To measure the antioxidant enzymes activ-        weight measurements revealed that the HFD resulted in
ities, the 10% homogenate was further centrifuged at           approximately 3.1-fold increase in epididymal and perirenal
10, 000 × g for 15 min at 4°C and the supernatant was          fat weight compared with the LFD. Consistently, treatment
collected. Previously described methods were used to           of HFD-fed mice with the LY, CS, or OB extracts signifi-
determine catalase activity [22], superoxide dismutase-1       cantly reduced the weight of visceral fat. Further, the average
(SOD-1) activity [23], glutathione peroxidase (GPx) ac-        epididymal fat weight was reduced by 28.0%, 38.7%, 50.7%,
tivity [24], and glutathione S-transferase (GST) activity      44.9%, and 51.2% in the LY, CS-L, CS-H, OB-L, and OB-H
[25]. The protein concentration of tissue sample was           groups, respectively, compared with that of the HFC group.
determined using the Pierce protein assay kit (Thermo          There is no significant difference in liver weights between the
Fisher Scientific, Waltham, MA).                                HFC and LFC groups. The average liver weight in the LFC
4                                                                                Evidence-Based Complementary and Alternative Medicine

                                                      Table 1: Sequence of primer for qPCR.
                            Gene                                  Forward                      Reverse
                                                      5′-TGT GCT GCA GAT AGC CAA 5′-TGG AGA AGG CCA GCA GAT G-
Leptin                                       LEP
                                                                  TGA-3′                         3′
                                                                                   5′-TGA ACG CTG AGC GAT ACA
Adiponectin                                  ADIPOQ 5′-AAC CCC TGG CAG GAA AGG-3′
                                                                                               CAT-3′
                                                      5′-CAC ACC TAC ACG CAG GCC 5′-CTG CGC TCC GGA GTG GGA
Catalase                                     CAT
                                                                   GG-3′                       GA-3′
                                                      5′-AAG CTT TCA ACC CGA AGC   5′-TTT CCG AGT CAC TGA ACC
Nuclear factor erythroid 2-related factor 2 Nrf-2
                                                                   AC-3′                        CA-3′
                                                      5′-TGC AGA CCA AAG CCA TTC 5′-ACG GTT CCT GGT TTG TTC CT-
Glutathione S-transferase                    Gst
                                                                   TC-3′                         3′
                                                      5′-CGA TGG GAT GAT GCT GAC 5′-CAC TGG GAA GTA ACG GGT
Glutathione S-transferase A4                 GstA4
                                                                  ACA-3′                     TTT AGC-3′
                                                      5′-CCT CAC TGG CAG GAA ATC   5′-CCT CGT GGA GAC GCT TTA
Heme oxygenase-1                             HO-1
                                                                  ATC-3′                      CAT A-3′
                                                      5′-CCA GCA CCA GCA CCA GCC 5′-TGG GGC GTT AAC TGC ATC
Monocyte chemoattractant protein-1           MCP-1
                                                                   AA-3′                      TGG C-3′
                                                 phox 5′-CCT GCC CAC ATT GCC AGC 5′-AGA CCG GCA GGC TCA GGA
NADPH oxygenase                              p40
                                                                   CA-3′                       GG-3′
                                                       5′-CTG GAT AGC CTT TCT TCT 5′-GCA CAC TGT GTC CGA ACT C-
M1 macrophage marker                         CD11c
                                                                 GCT G-3′                        3′
                                                      5′-CCA GAG ATA CAA AGA AAT 5′-ACT CCA GAA GAC CAG AGG
Interleukin-6                                IL-6
                                                                GAT GG-3′                     AAA T-3′
                                                      5′-CCA GAC CCT CAC TAG ATC    5′-CAC TTG GTG GTT TGC TAC
Tumor-necrosis factor-α                      TNFα
                                                                    A-3′                       GAC-3′
                                                      5′-GCC CAC CAA CTT CGG AAT   5′-TGC GAG TGG TCT TCC ATC
Peroxisome proliferator activator receptor c PPARc
                                                                    C-3′                        AC-3′
                                                      5′-AGC CCA CGT CGT AGC AAA 5′-AGC CCA CGT CGT AGC AAA
Fatty acid synthase                          FAS
                                                                  CCA-3′                       CCA-3′
                                                      5′-TGT TGG GTA TGC TGT TCA
Carnitine palmotoyl transferase-1            CPT-1                                5′-GCG GCC TGG GTA GGA AGA-3′
                                                                TGA CA-3′
                                                      5′-GGG AAG CCC ATC ACC ATC
Glycealdehyde-3-phosphate dehydrogenase GAPDH                                      5′-CGG CCT CAC CCC ATT TG-3′
                                                                    T-3′

                             Table 2: Extraction yield of sample and in vitro antioxidant activities of the extract.
                                                                                                         DPPH2) radical scavenging
                                                                                                1)                                             FRAP3)
                                                                              Extraction yield                   activity
                  Plant name                  Local name       Sample
                                                                                     (%)                                                      ECAA105)
                                                                                                                IC504) (µg/mL)
                                                                                                                                              (µg/mL)
            Ascorbic acid (AA)                                                        —                          2.35 ± 0.726)                    —
1          Ipomoea batatas (IB)        Goguma                  Leaves                18.8                        392.4 ± 53.7                165.5 ± 46.3
2    Boehmeria nivea (L.) Gaudich (BN)  Mosi                   Leaves                31.8                        375.9 ± 61.5                 67.8 ± 6.3
3          Morus alba L. (MA)           Pong                   Leaves                24.4                        826.0 ± 26.2                195.3 ± 4.8
4      Acanthopanax koreanum (AK) Sum-ogalpi                   Leaves                29.4                          61.1 ± 1.1                 39.1 ± 1.3
5          Cedrela sinensis (CS)        Gazuk                  Sprouts               20.1                         35.9 ± 7.1                  39.5 ± 2.5
6        Oenothera biennis L. (OB)     Dalmazi                 Sprouts               25.4                         26.2 ± 4.2                  15.8 ± 1.1
                                                                Aerial
7        Equisetum arvense L. (EA)               Shettgi                             20.4                        306.7 ± 42.4                115.8 ± 13.6
                                                                parts
      Artemisia princeps Pamp. Hara                             Aerial
8                                                 Sook                               16.6                        915.2 ± 25.5                188.0 ± 3.9
                   (AP)                                         parts
      Oenanthe javanica (blume) DC.                             Aerial
9                                              Dolminari                             13.8                        2292.6 ± 32.3               230.6 ± 5.0
                   (OJ)                                         parts
                                                                Aerial
10        Glebionis coronaria (GC)              Sookgod                              31.0                       2549.3 ± 140.4               263.6 ± 11.8
                                                                parts
(1) The yield of 50% ethanol extract from dried sample, (2) 2,2-diphenyl-1 picrylhydrazyl, (3) ferric reducing antioxidant power, (4) concentration of each
extract to reduce the oxidant levels by 50%, (5) concentration of each extract to exhibit the equal effect to 10 µg/mL of ascorbic acid, (6) mean ± SD.
Evidence-Based Complementary and Alternative Medicine                                                                                                 5

                                               45

                                               40

                                               35

                                           g

                                               30

                                               25

                                               20
                                                    0   1   2   3   4   5   6    7 8     9 10 11 12 13 14
                                                                                Weeks
                                                        LFC                             HFC
                                                        CS_L                            CS-H
                                                        OB-L                            OB-H
Figure 1: Effects of the CS and OB extracts on body weight of HFD-fed mice. C57BL/6 mice (five-week-old, male) were fed with low-fat diet
(LFD) or high-fat diet (HFD) for 14 weeks. Mice were orally administered with lycopene beadlets (LY), CS, and OB extracts in saline at
50 mg/kg body weight (CS-L or OB-L) or 100 mg/kg body weight (CS–H or OB-H). Data are presented as the mean ± SD (n � 7–8/gr). 1)
Means sharing the same alphabet are not significantly different at P < 0.05 as determined by ANOVA and Duncan’s multiple range test. CS:
Cedrela sinensis, OB: Oenothera biennis L.

                             Table 3: Body weight gain, diet intake, and visceral adipose tissue weight of mice.
                         LFC (n � 7) HFC (n � 8)       LY (n � 8)    CS-L (n � 8)   CS-H (n � 8)    OB-L (n � 8)    OB-H (n � 8)
Initial body weight (g)  21.5 ± 0.9ns    21.6 ± 0.5    21.8 ± 0.8      21.6 ± 0.9     21.6 ± 0.8      21.7 ± 0.5      21.5 ± 0.6
Body weight gain (g)     8.1 ± 1.5c2)   18.4 ± 2.7a    13.1 ± 2.8b    13.3 ± 1.9b     10.4 ± 1.7c     10.2 ± 2.3c     9.8 ± 2.7c
Diet intake (g)          270.9 ± 5.0a  237.0 ± 1.2b 237.2 ± 13.5b 249.3 ± 18.4b     235.5 ± 14.4b   238.1 ± 24.8b   235.6 ± 14.2b
Energy intake (kcal)    1034.7 ± 19.3b 1114.1 ± 5.6a 1114.7 ± 63.3a 1171.7 ± 86.5a 1107.0 ± 67.9ab 1119.1 ± 116.3a 1107.4 ± 66.7ab
Food efficient
                         2.98 ± 0.55e   7.77 ± 1.10a  5.53 ± 1.11b   5.34 ± 0.74bc  4.46 ± 0.85cd   4.24 ± 0.58d     4.16 ± 1.06d
ratio (%g/g)1)
Epididymal fat (g)       0.73 ± 0.25d  2.25 ± 0.30a   1.62 ± 0.25b   1.38 ± 0.42bc   1.11 ± 0.42c    1.24 ± 0.30c    1.10 ± 0.21c
Perirenal fat (g)        0.25 ± 0.08d   0.96 ± 0.14a  0.77 ± 0.17b   0.58 ± 0.23c    0.49 ± 0.24c    0.56 ± 0.11c    0.52 ± 0.13c
Liver weight (g)         1.39 ± 0.21a 1.31 ± 0.24ab 1.15 ± 0.10bc 1.23 ± 0.17abc    1.16 ± 0.15bc    1.09 ± 0.14c    1.09 ± 0.12c
LFC: low-fat diet (LFD) control, HFC: high-fat diet (HFD) control, LY : HFD + oral treatment with lycopene beadlets at 50 mg/kg body weight (BW)
containing 5% tomato lycopene (positive control), CS-L : HFD + oral treatment with 50% ethanol extract of Cedrela sinensis (CS) at 50 mg/kg BW, CS-H :
 HFD + oral treatment with CS extract 100 mg/kg BW, OB-L : HFD + oral treatment with 50% ethanol extract of Oenothera biennis L. (OB) at 50 mg/kg BW,
OB-H : HFD + oral treatment with OB extract 100 mg/kg BW. Values are mean ± SD. ns: not significant. (1) Food efficient ratio � (body weight gain (g)/food
intake (g)) x 100, (2) means sharing the same alphabet in superscripts are not significantly different within a row at P < 0.05 as determined by ANOVA and
Duncan’s multiple range test.

group tended to be higher than that in the HFC group.                            the production of adipocytokines [3]. To confirm the in-
Notably, liver weight was significantly reduced in CS-H, OB-                      hibitory role of the CS and OB extracts in the fat deposition
L, and OB-H groups compared with the HFC group (Ta-                              at the cellular and molecular levels, we analyzed adipocyte
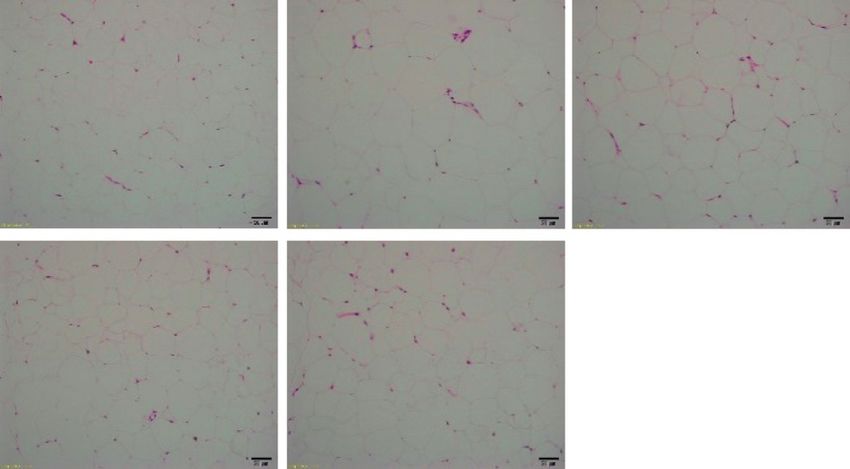
ble 3). These results indicated the supplementation with the                     size from the H&E-stained epididymal fat sections
CS or OB extract inhibited fat accumulation, which was the                       (Figure 2(a)). The adipocyte size in the HFC group was
main contributor to the reduced body weight gain in HFD-                         approximately 2.2-fold greater compared with the LFC
fed mice.                                                                        group. The adipocyte sizes were significantly reduced in the
                                                                                 LY, CS-H, and OB-H groups by 18.7%, 39.5%, and 35.4%,
                                                                                 respectively, compared with that in HFC group
3.3. CS and OB Extracts Induce Reduction in Adipocyte Size                       (Figure 2(b)).
and Subsequent Expression of Adipokines in the Adipose Tissue                        Treatment with the CS and OB extracts and LY signif-
of HDF-Fed Mice. Increased adipocyte size is critical in                         icantly reduced mRNA levels of p40phox and heme oxy-
obesity-related inflammatory states and is correlated with                        genase-1 (HO-1), which are ROS generating enzymes, in
6                                                                                                                                              Evidence-Based Complementary and Alternative Medicine

                                                   LFC                                        HFC                                         LY                               200
                                                                                                                                                                                            a
                                                                                                                                                                                                  b
                                                                                                                                                                                                            c      c

                                                                                                                                                                     µm2
                                                                                                                                                                           100       d

                                                                                                                                                                             0

                                                                                                                                                                                    LFC

                                                                                                                                                                                           HFC

                                                                                                                                                                                                  LY

                                                                                                                                                                                                           CS-H

                                                                                                                                                                                                                  OB-H
                                                   CS-H                                     OB-H
                                                                                                (a)                                                                                         (b)
                                                                                        4.0               a                              a
                                                                    mRNA level (fold)

                                                                                        2.0                   b b
                                                                                                                        b                        b               a
                                                                                                      b                              b       b                             a a ab
                                                                                                                                                     b               b

                                                                                        0.0
                                                                                                          HO-1                           p40phox                     GSTA4

                                                                                                      LFC                                            CS-H
                                                                                                      HFC                                            OB-H
                                                                                                      LY

                                                                                                                                     (c)
                                                                                                                                                         a
                                            18.0
                                            16.0
                                            14.0
                        mRNA level (fold)

                                            12.0
                                            10.0
                                             8.0
                                             6.0                                            a                                                                b                                         a
                                                                                                 b                          a                                                     a a ab
                                             4.0                                                                                                                 b
                                                                                                      c c           b           ab                                                                 b        b b b
                                             2.0     a b ab ab ab                       c                                            b
                                                                                                                                         b       b                   b        b             b
                                             0.0
                                                     Adiponectin                            Leptin                      MCP-1                         CD11c                         IL-6               TNF-α

                                                      LFC                                                                                            CS-H
                                                      HFC                                                                                            OB-H
                                                      LY

                                                                                                                                     (d)

Figure 2: Effect of the CS and OB extracts on adipocyte size, expression of adipokines, and oxidative stress markers in epididymal adipose
tissue of HDF-fed mice. Epididymal adipose tissues were stained with hematoxylin-eosin (H&E) (a) and size of adipocytes were measured by
Image J (b). mRNA expression levels of oxidative stress-related markers (c) or inflammation markers (d) in epididymal adipose tissue were
analyzed by quantitative RT-PCR (n � 5–6/gr). Means sharing the same alphabet in superscripts on the bars are not significantly different at
P < 0.05 as determined by ANOVA and Duncan’s multiple range test. HO-1: heme oxygenase-1, p40phox: NADPH oxidase subunit,
GSTA4: glutathione S-transferase A4, MCP-1: monocyte chemoattractant protein, CD11c: a surface marker of M1 type macrophage, IL-6:
interleukin-6, TNF-α: tumor-necrosis factor-α.

adipose tissue of HFD-fed mice. In contrast, mRNA levels of                                                                                  mice. In contrast, LY treatment significantly reduced mRNA
GSTA4, detoxifying enzyme of lipid peroxidation products,                                                                                    levels of leptin and TNF-α, but not IL-6 (Figure 2(d)).
were reduced significantly after HFD feeding. The mRNA                                                                                        Adipokines induce inflammation in adipose tissue by
levels were recovered by treatment with the LY or CS extract                                                                                 recruiting and by activating immune cells [26]. To further
(Figure 2(c)).                                                                                                                               confirm the effect of the CS and OB extracts, we analyzed the
    We also investigated the expression levels of adipokines                                                                                 levels of MCP-1 and CD11c expression, which are markers
in epididymal fat. HFD feeding induced a significant in-                                                                                      for macrophage and leukocyte, respectively, in epididymal
crease of leptin, IL-6, and TNF-α mRNA levels and a de-                                                                                      fat. HFD feeding resulted in a 2.1-fold increase in MCP-1
crease of adiponectin mRNA levels compared with LFC                                                                                          mRNA and a 12.9-fold increase in CD11c mRNA compared
feeding. Treatment with the CS and OB extracts significantly                                                                                  with LFD feeding. Treatment with the CS and OB extracts
reduced the mRNA levels of leptin, IL-6, and TNF-α, while it                                                                                 significantly reduced both levels, whereas LY treatment
slightly increased adiponectin mRNA levels in HFD-fed                                                                                        significantly reduced CD11c levels, but did not reduce MCP-
Evidence-Based Complementary and Alternative Medicine                                                                           7

1 levels (Figure 2(d)). These results demonstrated that          treatment with the CS or OB extract suppressed expression
supplementation with the CS or OB extract inhibited HFD-         of adipogenic genes in adipose tissue and liver of HFD-fed
induced fat deposition and subsequent adipokine-induced          mice, but did not influence significantly mitochondrial
inflammation more effectively than LY.                             oxidation of fatty acids.

3.4. CS and OB Extracts Reduce Expression of Inflammatory         3.6. CS and OB Extracts Reduce Plasma Levels of Leptin and
Cytokines, Antioxidant Enzymes, and Lipid Peroxidation in        Oxidative Stress Markers. To evaluate the systematic effect of
the Liver of HDF-Fed Mice. Although no difference in liver        extracts in HFD-fed mice, we analyzed the plasma levels of
weight was observed between the HFC and LFC group,               adiposity, oxidative stress, and hepatic toxicity. HFD feeding
treatment with the OB extract significantly reduced liver         resulted in a 2.3-fold increase of plasma leptin levels
weight in HFD-fed mice (Table 3). Fatty liver leads to in-       compared with LFC feeding. The increase was significantly
creased oxidative metabolism, which elevates hepatic oxi-        reduced by 47.7% in the CS-H group, 31.5% in the OB-L
dative stress and inflammatory responses [27]. We examined        group, and 35.4% in the OB-H group, but not in the CS-L
the levels of inflammatory cytokines and oxidative stress         and LY groups (Figure 5). Similarly, analysis of markers for
markers in the liver. mRNA levels of IL-6 and TNF-α in the       oxidative stress revealed that HFD feeding produced a 1.4-
liver of HFC group were increased approximately 4.3-fold         and 4.5-fold increase of plasma MDA and 8-epi-PGF2α,
and 2.2-fold compared with those in the LFC group.               respectively, compared with LFC feeding. Treatment with
Treatment with the LY, CS, or OB extract resulted in sig-        the LY, CS, or OB extract produced a 28.9% to 36.8% re-
nificantly decreased expression of IL-6 and TNF-α in the          duction in MDA levels compared with the HFC group. The
liver of HFD-fed mice. The reductions attributed to the LY       OB-H group displayed significantly reduced 8-epi-PGF2α
and OB extract were significantly higher than the CS extract      levels compared with the HFC group (Figure 5).
(Figure 3(a)). Next, we evaluated the hepatic response to            Plasma levels of triglycerides were significantly reduced
oxidative stress by measuring the mRNA expression levels of      in the CS-H and OB-H groups compared with the HFC
nuclear factor erythroid 2-related factor- (Nrf-) 2, catalase,   group. The total cholesterol levels remained unaffected by
and GST. HFD feeding had little effect on their mRNA levels,      any treatments. There was no significant difference in plasma
but treatment with the OB extract significantly reduced           AST and ALT levels between the LFC and HFC groups. The
mRNA expression of Nrf-2, but not the expression of cat-         levels of AST, but not ALT, were significantly reduced in the
alase and GST, in HFD-fed mice (Figure 3(b)). Additionally,      CS-L and OB-H groups compared with the HFC group
we measured the levels of lipid peroxidation and antioxidant     (Figure 5).
enzyme activity in the liver. The HFC group showed an
approximate 1.6-fold increase of TBARS concentration
compared with the LFC group. The increased hepatic               3.7. Correlations between Markers of Obesity and Inflam-
TBARS levels led by HFD were significantly reduced by             mation or Oxidative Stress in Mice. To confirm the effect of
treatment with the CS and OB extracts, but were not reduced      the reduced body weight gains on the levels of markers for
by LY treatment. Treatment with the OB extract significantly      inflammation or oxidative stress in mice, we examined their
reduced GPx activity, whereas treatment with the CS extract      statistical correlation. Body weight gain was significantly
increased SOD and GST activities (Figure 3(c)).                  positively correlated with epididymal fat weight, adipocyte
                                                                 size, and plasma leptin level. Additionally, body weight gain
                                                                 was positively correlated with immune cell infiltration
3.5. CS and OB Extracts Reduce Expression of Adipogenic          (CD11c), inflammatory cytokine levels (TNF-α, IL-6, and
Genes in the Adipose Tissue and Liver of HDF-Fed Mice.           MCP-1) in the adipose tissue, IL-6 and TNF-α levels in liver,
We analyzed mRNA expression of genes involved in adi-            and markers for oxidative stress (plasma MDA and 8-epi-
pogenesis or mitochondrial oxidation of fatty acids in epi-      PGF2α, hepatic TBARS, and adipose HO-1, p40phox, and
didymal adipose tissue and liver. As shown in Figure 4(a),       GSTA4) (Table 4). Adipocyte size was positively correlated
HFD feeding significantly increased mRNA expression of            with plasma leptin and 8-epi-PGF2α levels and leptin, HO-1,
peroxisome proliferator activator receptor gamma (PPARc),        p40phox, GSTA4, TNF-α, and CD11c expressions in the
fatty acid synthase (FAS), and carnitine palmitoyl trans-        epididymal fat. Body weight gain and adipocyte size were
ferase-1 (CPT-1) in the adipose tissue compared with LFD         negatively correlated with antioxidant enzyme activities in
feeding. HFD-induced FAS expression was significantly             the liver, such as catalase and SOD-1. These results dem-
reduced by treatment with the CS and OB extracts and LY,         onstrate that the anti-obesity, antioxidant, and anti-in-
while HFD-induced PPARc expression was significantly              flammatory activities of CS and OB extracts in HFD-fed
reduced by treatment with the OB extract. HFD also sig-          mice were mutually influenced.
nificantly increased mRNA expression of PPARc and FAS in
the liver. HFD-induced PPARc expression in the liver was         4. Discussion
significantly reduced by treatment with the CS and OB
extracts and LY, while HFD-induced FAS expression was            CS and OB belong to Meliaceae family and Onagraceae family,
significantly reduced only by the OB extract (Figure 4(b)).       respectively. Both plants grow in Asian region, including Korea
CPT-1 mRNA expression in the liver was not different              [26, 28]. The roots or all parts of OB have been used in Korea as
among the groups. These results demonstrated that oral           a folk medicine to alleviate inflammation and fever. Ethanol
8                                                                                                                                                                                                                                                                      Evidence-Based Complementary and Alternative Medicine

                                                                                            6.0                                                                                                                                                  3.0
                                                                                                                                    a

                                                                        mRNA level (fold)

                                                                                                                                                                                                                             mRNA level (fold)
                                                                                                                                               b
                                                                                            4.0                                                                                                                                                  2.0                                                                                                                ns
                                                                                                                                        bc                             a                                                                                                            ab a
                                                                                                                                                                                                                                                                                                                           ns
                                                                                                                                                                                                    ab                                                                                                ab ab
                                                                                            2.0                                                      c            bc                                                                             1.0                                                            b
                                                                                                                            c
                                                                                                                                                                                                c             c

                                                                                            0.0                                                                                                                                                  0.0
                                                                                                                                        IL-6                             TNF-α                                                                                                                   Nrf-2                          Catalase                                     GST

                                                                                                                            LFC                                   CS-H                                                                                                                          LFC                                                   CS-H
                                                                                                                            HFC                                   OB-H                                                                                                                          HFC                                                   OB-H
                                                                                                                            LY                                                                                                                                                                  LY

                                                                                                                                                   (a)                                                                                                                                                                       (b)
                                                                                                       TBARS                                                                                                                                                 Catalase                                                                                                                  SOD
                                                     0.8                                                                                                                                        100               a                                                                                                                              200
                            umole TEP (mg) protein

                                                                               a                                                                                       nmole (min/mg) protein

                                                                                                                                                                                                                                                                                                                                U (mg) protein
                                                     0.6                                                                                           bc                                               75                                                                        b
                                                                                              ab                                                           bc                                                                                                                                     b         b
                                                                                                                                         c                                                                                  b                      b                                                                  b                                         a                       a        a
                                                                bc                                                          bc                                                                                                                                                                                                                                           b         b                    b
                                                     0.4                                                                                                                                            50                                                                                                                                           100                                                           b

                                                     0.2                                                                                                                                            25

                                                     0.0                                                                                                                                             0                                                                                                                                             0
                                                                LFC

                                                                           HFC

                                                                                              LY

                                                                                                                            CS-L

                                                                                                                                        CS-H

                                                                                                                                                   OB-L

                                                                                                                                                           OB-H

                                                                                                                                                                                                                  LFC

                                                                                                                                                                                                                            HFC

                                                                                                                                                                                                                                                  LY

                                                                                                                                                                                                                                                                         CS-L

                                                                                                                                                                                                                                                                                                  CS-H

                                                                                                                                                                                                                                                                                                           OB-L

                                                                                                                                                                                                                                                                                                                      OB-H

                                                                                                                                                                                                                                                                                                                                                             LFC

                                                                                                                                                                                                                                                                                                                                                                         HFC

                                                                                                                                                                                                                                                                                                                                                                                 LY

                                                                                                                                                                                                                                                                                                                                                                                       CS-L

                                                                                                                                                                                                                                                                                                                                                                                                 CS-H

                                                                                                                                                                                                                                                                                                                                                                                                        OB-L

                                                                                                                                                                                                                                                                                                                                                                                                               OB-H
                                                                                                                                                                                            GPx                                                                                                                                                  GST
                                                                                                                            1,000                                                                                                                                                               200
                                                                                                   nmole (min/mg) protein

                                                                                                                                                                                                                                                                       nmole (min/mg) protein

                                                                                                                                                                   a                                                                                                                                                                              a         a
                                                                                                                                                          a                                     a                                                                                                          a                                                        ab
                                                                                                                                500            ab                                                             ab        ab                                                                      100                  b                                                         b
                                                                                                                                                                                                                                                 b                                                                              b

                                                                                                                                    0                                                                                                                                                             0
                                                                                                                                               LFC

                                                                                                                                                          HFC

                                                                                                                                                                   LY

                                                                                                                                                                                                CS-L

                                                                                                                                                                                                              CS-H

                                                                                                                                                                                                                        OB-L

                                                                                                                                                                                                                                                 OB-H

                                                                                                                                                                                                                                                                                                           LFC

                                                                                                                                                                                                                                                                                                                     HFC

                                                                                                                                                                                                                                                                                                                                LY

                                                                                                                                                                                                                                                                                                                                                 CS-L

                                                                                                                                                                                                                                                                                                                                                            CS-H

                                                                                                                                                                                                                                                                                                                                                                    OB-L

                                                                                                                                                                                                                                                                                                                                                                               OB-H
                                                                                                                                                                                                                      (c)

Figure 3: Effects of the CS and OB extracts on the expression levels of inflammatory cytokines, oxidative stress-related genes, and lipid
peroxidation levels in the liver of HDF-fed mice. Expression levels of inflammatory cytokines (a) and oxidative stress markers in the liver (b)
were analyzed by quantitative RT-PCR (n � 5-6/gr). Levels of lipid peroxidation and activities of antioxidant enzymes were measured
(n � 7–8/gr) as described in Materials and Methods (c). Means sharing the same alphabet in superscripts on the bars are not significantly
different at P < 0.05 as determined by ANOVA and Duncan’s multiple range test. ns: not significant, Nrf-2: nuclear factor erythroid 2-related
factor 2, GST: glutathione S-transferase, TBARS: thiobarbituric acid-reactive substance, SOD: superoxide dismutase, GPx: glutathione
peroxidase.

                           4.0                                                                                                                                                                                                                                         4.0                                                                                    a
                                                                                                                                        a
       mRNA level (fold)

                                                                                                                                                                                                                                                   mRNA level (fold)

                           3.0                                                                                                                                                                  a                                                                      3.0
                                                                                                                                               b                                                                                                                                                            a                                                             ab
                           2.0                                                                                                                      b b                     b                                  ab ab                                                   2.0
                                                                a                                                                                                                                        ab                                                                                                                                             b                                   ns
                                                           bc         abc ab                                                    b                                                                                                                                                                      b                                                            ab          b
                           1.0
                                                                                             c
                                                                                                                                                                                                                                                                       1.0                                          bc bc
                                                                                                                                                                                                                                                                                                                                c
                           0.0                                                                                                                                                                                                                                         0.0
                                                                 PPARγ                                                                       FAS                                                    CPT1                                                                                                      PPARγ                                                 FAS                            CPT1

                                                           LFC                                                                                       CS-H                                                                                                                                             LFC                                                                    CS-H
                                                           HFC                                                                                       OB-H                                                                                                                                             HFC                                                                    OB-H
                                                           LY                                                                                                                                                                                                                                         LY

                                                                                                                                    (a)                                                                                                                                                                                                                     (b)

Figure 4: Effects of the CS and OB extracts on mRNA expression of lipid metabolism involved genes in the adipose tissue and liver of HDF-
fed mice. Expression level of each gene in the adipose tissue (a) and liver (b) was analyzed by quantitative RT-PCR (n � 4–6/gr) as described
in Materials and Methods. Means sharing the same alphabet in superscripts on the bars are not significantly different at P < 0.05 as
determined by ANOVA and Duncan’s multiple range test. PPARc: peroxisome proliferator activator receptor c, FAS: fatty acid synthase,
CPT-1: carnitine palmitoyl transferase-1, ns: not significant.
Evidence-Based Complementary and Alternative Medicine                                                                                                                                                                                                     9

                                              Leptin                                                      Total cholesterol                                                      Triglyceride                                       MDA
                    2,000                                                                400                                                               200                                                       300
                                                                                                                                                                                                                                a
                                   a
                                                  ab                                                                                                       150      ab a ab ab b
                                                                                                                                                                                 ab                                        b        b b b b b
                                        abc                                                                                                                                         b

                                                                                                                                                                                                       ng (mL)
                                                                               mg (dL)
          pg (mL)

                                                                                                                                                 mg (dL)
                                                         cd bcd bcd                                       a    a ab ab ab ab
                    1,000    d                                                           200       b                                                       100                                                       100
                                                                                                                                                            50

                                                                                                                                                                                                                            LFC
                                                                                                                                                                                                                            HFC
                                                                                                                                                                                                                              LY
                                                                                                                                                                                                                            CS-L
                                                                                                                                                                                                                           CS-H
                                                                                                                                                                                                                           OB-L
                                                                                                                                                                                                                           OB-H
                       0          HFC                                                      0                                                                 0                                                   –100
                                        LY
                                                  CS-L
                                                         CS-H
                                                                OB-L
                                                                       OB-H

                                                                                                 LFC
                                                                                                         HFC
                                                                                                               LY
                                                                                                                    CS-L
                                                                                                                           CS-H
                                                                                                                                  OB-L
                                                                                                                                         OB-H

                                                                                                                                                                    LFC
                                                                                                                                                                    HFC
                                                                                                                                                                      LY
                                                                                                                                                                    CS-L
                                                                                                                                                                   CS-H
                                                                                                                                                                   OB-L
                                                                                                                                                                   OB-H
                            LFC

                                                                             8-epi-PGF2a                                                             ALT                                                    AST
                                                  1,200                 a ab                                            20.0                                                                100
                                                                                     a                                  15.0      ns                                                        75    ab a bc             a    a
                                                                                                                                                                                                                               bc
                                                    800                                                                                                                                                          c
                                        ng (mL)

                                                                                          ab ab

                                                                                                                                                                                   IU (L)
                                                                                                               iU (L)
                                                                                                                        10.0                                                                50
                                                                                                         b
                                                    400          b                                                       5.0                                                                25
                                                         0                                                               0.0                                                                 0
                                                                LFC
                                                                       HFC
                                                                              LY
                                                                                   CS-L
                                                                                          CS-H
                                                                                                 OB-L
                                                                                                        OB-H

                                                                                                                                  LFC
                                                                                                                                         HFC
                                                                                                                                                LY
                                                                                                                                                     CS-L
                                                                                                                                                            CS-H
                                                                                                                                                                   OB-L
                                                                                                                                                                          OB-H

                                                                                                                                                                                                   LFC
                                                                                                                                                                                                   HFC
                                                                                                                                                                                                     LY
                                                                                                                                                                                                   CS-L
                                                                                                                                                                                                  CS-H
                                                                                                                                                                                                  OB-L
                                                                                                                                                                                                  OB-H
Figure 5: Effects of the CS and OB extracts on the levels of leptin, lipids, and oxidative stress markers in the plasma. Concentration of
triglyceride, total cholesterol, and activity of aspartate aminotransferase (AST) and alanine aminotransferase (ALT) in plasma were
determined using commercial kits. Malondialdehyde (MDA), 8-epi-prostaglandin (PG) F2α, and leptin levels were determined by ELISA
kits according to the manufacturer’s instruction. Means sharing the same alphabet in superscripts on the bars are not significantly different
at P < 0.05 as determined by ANOVA and Duncan’s multiple range test.

                                                                         Table 4: Correlations between parameters measured in mice.
                                                                                                        Body weight gain                                                                                                       Adipocyte size
                                                                                 r1)                                   Significance                                                                       r1)                                    Significance
                                                                                                                                                  ∗∗∗
Adipocyte size                                                                 0.8110                                                                                                                     1
Plasma
  MDA2)                                                                        0.3692                                                                ∗
                                                                                                                                                                                                      0.1406                                        ns
  8-epi-PGF2α3)                                                                0.4358                                                                ∗∗
                                                                                                                                                                                                      0.6477                                        ∗∗
                                                                                                                                                  ∗∗∗                                                                                               ∗∗∗
  Leptin                                                                       0.7263                                                                                                                 0.7599
                                                                                                                                                     ∗
  Triglyceride                                                                 0.3767                                                                                                                 0.2269                                        ns
                                                                                                                                                     ∗∗                                                                                             ∗∗∗
  T. cholesterol                                                               0.4913                                                                                                                 0.7076
Adipose tissue
                                                                                                                                                  ∗∗∗                                                                                               ∗∗∗
     Epididymal fat                                                            0.8472                                                                                                                 0.8876
                                                                                                                                                  ∗∗∗
     Adipocyte size                                                            0.8110                                                                                                                    1
  mRNA
                                                                                                                                                  ∗∗∗                                                                                               ∗∗∗
     Leptin                                                                    0.8732                                                                                                                 0.7517
     Adiponectin                                                               0.3160                                                                ns                                              −0.3531                                        ns
     HO-14)                                                                    0.7798                                                             ∗∗∗
                                                                                                                                                                                                     0.5650                                         ∗∗

     p40phox5)                                                                 0.7412                                                             ∗∗∗
                                                                                                                                                                                                      0.4631                                         ∗

     GSTA46)                                                                   0.3612                                                                ∗
                                                                                                                                                                                                     −0.4899                                        ∗∗

     TNF-α7)                                                                   0.7324                                                             ∗∗∗
                                                                                                                                                                                                      0.5163                                        ∗∗

     MCP-18)                                                                   0.5272                                                                ∗∗
                                                                                                                                                                                                      0.3541                                        ns
     CD11c9)                                                                   0.8265                                                             ∗∗∗
                                                                                                                                                                                                      0.7431                                        ∗∗∗

     IL-610)                                                                   0.4174                                                                ∗
                                                                                                                                                                                                      0.3214                                        ns
Liver
  TBARS11)                                                                     0.4019                                                                ∗∗
                                                                                                                                                                                                      0.3395                                        ns
Activity
                                                                                                                                                     ∗∗                                                                                             ∗∗∗
  Catalase                                                                    −0.3823                                                                                                                −0.5647
  SOD-112)                                                                    −0.2011                                                                ns                                              −0.3858                                         ∗
                                                                                                                                                     ∗                                                                                              ∗∗∗
  GST                                                                         −0.3115                                                                                                                −0.5384
mRNA
                                                                                                                                                     ∗∗
  IL-6                                                                         0.5208                                                                                                                 0.3566                                        ns
                                                                                                                                                     ∗
  TNF-α                                                                        0.3407                                                                                                                 0.3078                                        ns
(1) Pearson correlation coefficient, (2) malondialdehyde, (3) 8-epi-prostaglandin F2α, (4) heme oxygenase-1, (5) subunit of NADPH oxidase, (6) glutathione
S-transferase A4, (7) tumor necrosis factor, (8) macrophage attractant protein-1, (9) a surface marker of M1 type of macrophages, (10) interleukin-6, (11)
thiobarbituric acid-reactive substance, (12) superoxide dismutase-1, significant at ∗ P < 0.05, ∗∗ P < 0.01, or ∗∗∗ P < 0.001 as determined by Pearson correlation
test, ns: not significant.
10                                                                  Evidence-Based Complementary and Alternative Medicine

extract of OB sprouts can scavenge DPPH radicals and inhibit       increased expression of p40phox and HO-1, and a decreased
the production of pro-inflammatory mediators in lipopoly-           expression of GSTA4 and GSTA3 selectively [45]. The
saccharide- (LPS-) treated macrophages [29, 30]. Methanol          p40phox, a subunit of NADPH oxidase, is a major enzyme
extract of aerial parts of OB can inhibit ROS production in        responsible for ROS generation in the macrophages and
neutrophils and demonstrates anti-inflammatory activity via the     involved in generation of superoxide radical and H2O2 in
suppression of hyaluronidase and lipoxygenase [31]. The rep-       adipocytes [46, 47]. HO-1, one of the target genes of Nrf-2, is
resentative compounds in the extract of OB aerial parts were       upregulated in obese mice and a microsomal enzyme in-
reported to be a part of flavonoid glycosides, such as kampherol-   duced in response to oxidative stress and some cytokines and
3-O-glucoside, quercetin-3-O-galactoside, quercetine-3-O-          protects against oxidative stress, inflammation, and meta-
rhamnoside and myricetin-3-O-glucoside, phenolic acids, and        bolic dysregulation [48, 49]. Nrf-2, an emerging regulator of
tannins [32].                                                      cellular resistance to oxidants, is a critical transcription
    CS has been also used as a folk medicine for treatment of      factor for regulating the expression of genes involved in
enteritis, dysentery, and itching [26]. Ethanol extract of CS      antioxidant defense, oxidant signaling, and drug metabolism
sprouts reportedly suppresses alcohol-induced oxidative            [11, 50]. GSTA4, an antioxidant enzyme detoxifying lipid
stress in HepG2 cells by upregulating GPx and HO-1 ex-             aldehyde, catalyzes the glutathionylation of reactive α, ß-
pressions [33]. Dichloromethane extract of CS sprouts              unsaturated aldehydes which covalently modify protein and
strongly inhibits ROS and nitric oxide production by               DNA and activate cellular stress-response systems. It has
downregulating iNOS and COX-2 in LPS-treated macro-                been demonstrated that downregulation of GSTA4 in adi-
phages [34].                                                       pose tissue led to increased ROS production, protein car-
    In this animal study, the treatment levels of the CS and       bonylation, and mitochondrial dysfunction contributing to
OB extracts (50 mg/kg BW and 100 mg/kg BW) and LY                  the development of insulin resistance [45, 51].
(50 mg/kg BW) were settled based on the previous reports.              In the present study, we demonstrated how the CS or OB
Oral treatment with 1 mg lycopene/kg/day (corresponding            treatment reduced oxidative stress induced by HFD. The CS
to 20 mg LY/kg BW) to C57BL/6J mice inhibited HDF-                 and OB treatments reduced MDA levels in the plasma and
induced adiposity and inflammatory response, but failed to          TBARS levels in the liver, downregulated the expression of
reduce the body weight gain [35]. Kim et al. [36] observed         HO-1 and p40phox in the adipose tissue, and modulated
that oral treatment (100 mg/kg BW) with the extract of             activity of antioxidant enzymes such as SOD, GPx, and GST
Toona sinensis leaf (TS), which is similar to CS, attenuated       in the liver of HFD-fed mice. In addition, the CS treatment
inflammatory responses in LPS-injected mice. Oral treat-            increased GSTA4 expression in the adipose tissue, and the
ment with the TS extract (40–300 mg/kg BW) exerted the             OB treatment reduced Nrf-2 expression in the liver.
antifatigue and antioxidant activities in various animal               There is a limitation in this study that we did not ex-
models [37–39]. Additively, treatment with the ethanol             amine the activity of antioxidant enzymes or oxidative
extract of Mulberry leaves or Aralia elata sprouts (50 mg/kg       damage markers in the adipose tissue. However, we need to
BW) resulted in reduction of body weight and fat weight in         pay attention to the strong antioxidant property of the CS
HFD-fed mice [40, 41] and modulation of activities of an-          and OB extracts in diet-induced obese animals because the
tioxidant enzymes in carcinogen-treated mice [42].                 increased ROS production in obesity is known to be posi-
    It is noteworthy that treatment with CS or OB extract to       tively correlated with lipid accumulation [17].
HFD-fed mice ameliorated the body weight gain and visceral             We elucidated the correlation between antioxidant or
fat accumulation without affecting food intake and energy           anti-inflammatory markers and anti-obesity markers in
intake in this study. Consistently, FER was significantly re-       mice in this study. Body weight gain was well correlated with
duced in CS or OB extract treated group, especially more           the oxidative stress levels in the plasma and liver. The re-
effectively in OB-L and OB-H group, compared to that in             duction of body weight gain was dose-dependent in the mice
HFC group. The anti-obesity effect of CS and OB extract in          treated with the CS or OB extract. Additionally, body weight
HFD-fed mice might have resulted from suppressing the              gain was significantly correlated with epididymal fat weight,
expression of adipogenic genes, such as PPARc and FAS,             adipocyte size, and plasma leptin, a marker for body adi-
rather than stimulating metabolic oxidation of fatty acids as      posity, although the CS or OB extract had no effect on energy
measured by CPT-1 expression in this study. PPARc is a             intake. These results indicate that antioxidant activity of the
transcriptional regulator that controls adipocyte proliferation,   CS or OB extract probably results in the inhibition of fat
lipogenesis, and lipolysis. FAS functions as a key enzyme in de    accumulation in adipocytes.
novo synthesis of fatty acid [43, 44]. CPT-1 is involved in            Sprouts or buds of plants are enriched in nutrients,
mitochondrial oxidation of fatty acids via catalysis of the        antioxidant vitamins, and phytochemicals, such as querce-
transfer of fatty acids from cytosolic compartment into mi-        tin, epigallocatechin gallate, curcumin, anthocyanins, and
tochondrial compartment. Zhao et al. [13] reported that            resveratrol [28]. These polyphenols have been reported to
excessive oxidative stress might decrease energy expenditure       alleviate oxidative stress, to reduce chronic low-grade in-
in adipocytes through the induction of mitochondrial dys-          flammation, and to inhibit lipogenesis, thereby improving
function and affect the expressions of genes and activities of      insulin resistance and reducing risk of cardiovascular dis-
enzymes involved in lipid metabolism.                              eases [3, 13, 49, 52, 53]. Methanol extract of aerial parts of
    On the oxidative stress markers, it was reported that          OB contains high levels of gallic acid, ellagic acid, caffeic
adipose tissue of HFD-induced obese mice exhibited an              acids, quercetin, and kaempferol [54]. CS sprouts contain
Evidence-Based Complementary and Alternative Medicine                                                                                11

abundant limonoids, triterpenoids, and flavonoids, such as         5. Conclusion
quercetin and quercitrin [33, 41, 55]. Lycopene is a carot-
enoid that exhibits antioxidant activity and a reducing effect     Oral treatment with 50% ethanol extracts with high anti-
on body weight and hepatosteatosis in obese animals               oxidant activity obtained from CS and OB sprouts signifi-
[10, 12, 36]. Thus, we used a commercial lycopene supple-         cantly reduced body weight gain in HFD-fed mice,
mentary product containing 5% tomato lycopene, 2% to-             presumably via inhibition of fat deposition, and subsequent
copherol, and 2.5% ascorbyl palmitate as a positive control       obesity-induced inflammatory response and oxidative stress.
in this study.                                                    The anti-obesity and antioxidant activities of the CS and OB
     Our results suggest that polyphenols and flavonoids in        extracts might be resulting from the biological actions of
the CS or OB extract may inhibit fat deposition in adipo-         phytochemicals present in the extracts. Our results suggest
cytes, possibly via direct inhibition of key enzymes involved     that the extract of plant sprouts with high antioxidant ac-
in transport of fatty acids from plasma lipoproteins to ad-       tivity may potentially mitigate obesity and inflammation
ipocytes, such as lipoprotein lipase in capillary wall, and/or    induced by a HFD, thereby preventing obesity-related
stimulating synthesis of fatty acids and triacylglycerol by       metabolic diseases. Further research is needed to identify the
influencing FAS and glycerol-3-phosphate acyltransferase.          effective components in the CS and OB extracts and to
Another possibility is that reduction in redox status con-        elucidate their functional mechanisms.
ferred by their antioxidant activity inhibits transport and
reesterification of fatty acids [56]. Further studies are needed   Data Availability
to establish the role of redox homeostasis in the regulation of
lipid deposition in adipocytes.                                   The experimental data used to support the findings of this
     It has been reported that adipocytes secrete a number of     study are available from the corresponding author upon
bioactive proteins called adipokines, which include pro-          request.
inflammatory cytokines and leptin. Adipokine levels have
been correlated with adipocyte size or adipose tissue mass        Conflicts of Interest
[11, 57]. Increased leptin and resistin levels result in immune
cell infiltration into the adipose tissue through the increase     The authors declare no conflicts of interest.
of vascular permeability, which subsequently elevates oxi-
dative stress and inflammatory responses thereby leading to
metabolic disorder [57]. Recruited macrophages and neu-
                                                                  Acknowledgments
trophils and infiltrated macrophages in tissue are polarized       This research was supported by grants (P0002206) from the
into M1 cells which in turn copiously secrete pro-inflam-          Ministry of Trade, Industry and Energy, Republic of Korea.
matory cytokines and ROS, eventually leading to further
amplification of inflammation, oxidative damage of cellular
components, and activation of redox signaling pathways            References
[9, 11, 58].                                                       [1] Z.-M. Lv, Q. Wang, Y.-H. Chen, S.-H. Wang, and
     Moreover, we observed the correlations between the                D.-Q. Huang, “Resveratrol attenuates inflammation and ox-
levels of obesity markers and the levels of inflammatory or             idative stress in epididymal white adipose tissue: implications
oxidative stress markers are more prominent in the ad-                 for its involvement in improving steroidogenesis in diet-in-
ipose tissue than those in the liver in this study. The                duced obese mice,” Molecular Reproduction and Development,
expression levels of several pro-inflammatory and oxi-                  vol. 82, no. 4, pp. 321–328, 2015.
dative stress markers in the adipose tissue were signifi-           [2] T. Wu, J. Yin, G. Zhang, H. Long, and X. Zheng, “Mulberry
cantly correlated with body weight gain. In the liver,                 and cherry anthocyanin consumption prevents oxidative
                                                                       stress and inflammation in diet-induced obese mice,” Mo-
however, only the expression levels of TNF-α and IL-6
                                                                       lecular Nutrition and Food Research, vol. 60, no. 3, pp. 687–
were significantly correlated with body weight gain. In                 694, 2016.
support of these results, a previous report showed that            [3] C. Carrasco-Pozo, M. J. Cires, and M. Gotteland, “Quercetin
tissue inflammation occurred in adipose tissue, liver,                  and epigallocatechin gallate in the prevention and treatment
kidneys, and intestine of diet-induced obese mice; how-                of obesity: from molecular to clinical studies,” Journal of
ever, visceral adipose tissue was more inflamed than the                Medicinal Food, vol. 22, no. 8, pp. 753–770, 2019.
other tissues [8]. Another study revealed that adipose             [4] S. H. Hong, M. Kim, M. Woo, and Y. O. Song, “Effects of
tissue inflammation was established prior to the devel-                 ingredients of Korean brown rice cookies on attenuation of
opment of hepatic inflammation. Therefore, adipose tissue               cholesterol level and oxidative stress in high-fat diet-fed
inflammation would contribute more to the development                   mice,” Nutrition Research and Practice, vol. 11, no. 5,
of metabolic disorders compared to hepatic inflammation                 pp. 365–372, 2017.
                                                                   [5] G. F. Da Costa, I. B. Santos, G. F. De Bem et al., “The beneficial
[6].
                                                                       effect of anthocyanidin-RichVitis viniferaL. Grape skin ex-
     Taken together, our results suggest that decreases of             tract on metabolic changes induced by high-fat diet in mice
inflammation and oxidative stress in HFD-fed mice due to                involves antiinflammatory and antioxidant actions,” Phyto-
the supplementation of the CS or OB extract may be at-                 therapy Research, vol. 31, no. 10, pp. 1621–1632, 2017.
tributed to the reduced adiposity and possibly direct anti-        [6] R. A. van der Heijden, F. Sheedfar, M. C. Morrison et al.,
oxidant activity of the extract as well.                               “High-fat diet induced obesity primes inflammation in
12                                                                            Evidence-Based Complementary and Alternative Medicine

       adipose tissue prior to liver in C57BL/6j mice,” Aging, vol. 7,       [23] S. Marklund and G. Marklund, “Involvement of the super-
       no. 4, pp. 256–268, 2015.                                                  oxide anion radical in the autoxidation of pyrogallol and
 [7]   K. Cheng, Z. Song, Y. Chen et al., “Resveratrol protects against           convenient assay for superoxide dismutase,” European Jour-
       renal damage via attenuation of inflammation and oxidative                  nal of Biochemistry, vol. 47, pp. 469–474, 1974.
       stress in high-fat-diet-induced obese mice,” Inflammation,             [24] A. L. Tappel, “Glutathione peroxidase and hydroperoxides,”
       vol. 42, no. 3, pp. 937–945, 2019.                                         Methods in Enzymology, vol. 52, pp. 506–513, 1978.
 [8]   H. Li, C. Lelliott, P. Håkansson et al., “Intestinal, adipose, and   [25] W. H. Halig, M. J. Pabst, and W. B. Jakoby, “Glutathione
       liver inflammation in diet-induced obese mice,” Metabolism,                 S-transferase,” Journal of Biological Chemistry, vol. 249,
       vol. 57, no. 12, pp. 1704–1710, 2008.                                      pp. 7130–7139, 1974.
 [9]   S. P. Weisberg, D. McCann, M. Desai, M. Rosenbaum,                    [26] M. Timoszuk, K. Bielawaka, and E. Skrzydlewska, “Evening
       R. L. Leibel, and A. W. Ferrante Jr, “Obesity is associated with           primrose (Oenothera biennis) biological activity dependent
       macrophage accumulation in adipose tissue,” Journal of                     on chemical composition,” Antioxidants, vol. 7, p. 108, 2018.
       Clinical Investigation, vol. 112, no. 12, pp. 1796–1808, 2003.        [27] S. Satapati, B. Kucejova, J. A. G. Duarte et al., “Mitochondrial
[10]   R. D. A. M. Luvizotto, A. F. Nascimento, E. Imaizumi et al.,               metabolism mediates oxidative stress and inflammation in
       “Lycopene supplementation modulates plasma concentra-                      fatty liver,” Journal of Clinical Investigation, vol. 125, no. 12,
       tions and epididymal adipose tissue mRNA of leptin, resistin               pp. 4447–4462, 2015.
       andIL-6in diet-induced obese rats,” British Journal of Nu-            [28] W.-J. Yoon, Y. M. Ham, B.-S. Yoo, J.-Y. Moon, J. Koh, and
       trition, vol. 110, no. 10, pp. 1803–1809, 2013.                            C.-G. Hyun, “Oenothera laciniata inhibits lipopolysaccharide
[11]   X. Liang, N. Nagata, and T. Ota, “Glucoraphanin: A broccoli                induced production of nitric oxide, prostaglandin E2, and
       sprout extract that ameliorates obesity-induced inflammation and            proinflammatory cytokines in RAW264.7 macrophages,” Journal
       insulin resistance,” Adipocyte, vol. 7, no. 3, pp. 218–225, 2018.          of Bioscience and Bioengineering, vol. 107, no. 4, pp. 429–438,
[12]   D. P. Singh, P. Khare, J. Zhu et al., “A novel cobiotic-based              2009.
       preventive approach against high-fat diet-induced adiposity,          [29] C. S. Kwak and J. H. Lee, “In vitro antioxidant and anti-in-
       nonalcoholic fatty liver and gut derangement in mice,” In-                 flammatory effects of ethanol extracts from sprout of evening
       ternational Journal of Obesity, vol. 40, no. 3, pp. 487–496,               primrose (Oenothera laciniata) and gooseberry (actinidia
       2016.                                                                      arguta),” Journal of the Korean Society of Food Science and
[13]   Y. Zhao, B. Chen, J. Shen et al., “The beneficial effects of                 Nutrition, vol. 43, no. 2, pp. 207–215, 2014.
       quercetin, curcumin, and resveratrol in obesity,” Oxidative           [30] S. Granica, M. E. Czerwińska, J. P. Piwowarski, M. Ziaja, and
       Medicine and Cellular Longevity, vol. 2017, Article ID                     A. K. Kiss, “Chemical composition, antioxidative and anti-
       1459497, 8 pages, 2017.
                                                                                  inflammatory activity of extracts prepared from aerial parts
[14]   H.-J. Kim, B. Kim, E.-G. Mun, S.-Y. Jeong, and Y.-S. Cha, “The
                                                                                  ofOenothera biennisL. andOenothera paradoxaHudziok ob-
       antioxidant activity of steamed ginger and its protective effects
                                                                                  tained after seeds cultivation,” Journal of Agricultural and
       on obesity induced by high-fat diet in C57BL/6J mice,”
                                                                                  Food Chemistry, vol. 61, no. 4, pp. 801–810, 2013.
       Nutrition Research and Practice, vol. 12, no. 6, pp. 503–511,
                                                                             [31] R. Fecker, V. Buda, E Alexa et al., “Phytochemical and bio-
       2018.
                                                                                  logical screening of Oenothera biennis L. hydroalcoholic
[15]   K. Kowalska, A. Olnjnik, D. Szwajgier, and M. Olkowicz,
                                                                                  extract,” Biomolecules, vol. 10, no. 6, Article ID 818, 2020.
       “Inhibitory activity of chokeberry, bilberry, raspberry and
                                                                             [32] H. J. Kim, S. Y. Cho, J. B Kim et al., “Effects of the Cedrela
       cranberry polyphenol-rich extract towards adipogenesis and
                                                                                  sinensis A. Juss. Leaves on the alcohol-induced oxidative
       oxidative stress in differentiated 3T3-L1 adipose cells,” PLoS
       One, vol. 12, no. 11, Article ID e0188583, 2017.                           stress in the human hepatic HepG2 cells,” Korean Journal of
[16]   Q. Wang, S. T. Wang, X. Yang, P. P. You, and W. Zhang,                     Food Nutrition, vol. 31, pp. 464–470, 2018.
       “Myricetin suppresses differentiation of 3T3-L1 preadipocytes          [33] S. Fenni, H. Hammou, J Astier et al., “Lycopene and tomato
       and enhances lipolysis in adipocytes,” Nutrition Research,                 powder supplementation similarly inhibit high-fat diet in-
       vol. 35, pp. 317–327, 2015.                                                duced obesity, inflammatory response, and associated met-
[17]   Y.-J. Lee, D.-B. Kim, J. Lee et al., “Antioxidant activity and             abolic disorders,” Molecular Nutrition and Food Research,
       anti-adipogenic effects of wild herbs mainly cultivated in                  vol. 61, no. 9, Article ID 1601083, 2017.
       Korea,” Molecules, vol. 18, no. 10, pp. 12937–12950, 2013.            [34] C.-Y. Hsiang, Y.-C. Hseu, Y.-C. Chang, K. J. S. Kumar,
[18]   M. Herranz-López, S. Fernández-Arroyo, A. Pérez-Sanchez                 T.-Y. Ho, and H.-L. Yang, “Toona sinensis and its major
       et al., “Synergism of plant-derived polyphenols in adipo-                  bioactive compound gallic acid inhibit LPS-induced inflam-
       genesis: perspectives and implications,” Phytomedicine,                    mation in nuclear factor-κB transgenic mice as evaluated by in
       vol. 19, no. 3-4, pp. 253–261, 2012.                                       vivo bioluminescence imaging,” Food Chemistry, vol. 136,
[19]   S. Yasushi, N. Tsukase, S. Keiko, Y. Hiroe, and Y. Hisashi,                no. 2, pp. 426–434, 2013.
       “Stopped-flow and spectrophotometric study on radical                  [35] H. Feng, H. Ma, H. Lin, and R. Putheti, “Antifatigue activity of
       scavenging by tea catechins and model compound,” Chemical                  water extracts of Toona sinensis Roemor leaf and exercise-related
       and Pharmaceutical Bulletin, vol. 47, pp. 1369–1374, 1999.                 changes in lipid peroxidation in endurance exercise,” Journal of
[20]   A. Yildirim, A. Mavi, and A. A. Kara, “Determination of                    Medicinal Plants Research, vol. 3, pp. 949–954, 2009.
       antioxidant and antimicrobial activities of Rumex crispus             [36] T.-S. Kim, K. Shin, J. H. Jeon et al., “Comparative analysis of
       L. extracts,” Journal of Agricultural and Food Chemistry,                  anti-Helicobacter pyloriactivities of FEMY-R7 composed
       vol. 49, pp. 4093–4089, 2001.                                              ofLaminaria japonicaandOenothera biennisextracts in mice
[21]   H. Ohkawa, N. Ohishi, and K. Yagi, “Assay for lipid peroxides              and humans,” Laboratory Animal Research, vol. 31, no. 1,
       in animal tissues by thiobarbituric acid reaction,” Analytical             pp. 7–12, 2015.
       Biochemistry, vol. 95, no. 2, pp. 351–358, 1979.                      [37] Y. Almora Pinedo, J. L. Arroyo-Acevedo, O. Herrera-Calderon
[22]   H. Aebi, “Catalase in vitro,” Methods in Enzymology, vol. 105,             et al., “Preventive effect of,” Clinical and Experimental Gastro-
       pp. 121–126, 1984.                                                         enterology, vol. 10, pp. 327–332, 2017.
You can also read