Generation of 3D Tumor Models from DICOM Images for Virtual Planning of its Recession - Dialnet
←
→
Page content transcription
If your browser does not render page correctly, please read the page content below
Generation of 3D Tumor Models from
DICOM Images for Virtual Planning of
                      its Recession
     Oscar Rodríguez-Bastidas; Hermes-Fabián Vargas-Rosero

Citation: O. Rodríguez-Bastidas, H.-F. Vargas-Rosero, “Generation of
  3D Tumor Models from DICOM Images for Virtual Planning of its
  Recession,” Revista Facultad de Ingeniería, vol. 29 (54), e10173,
                               2020.
       https://doi.org/10.19053/01211129.v29.n54.2020.10173

    Received: November 28, 2019; Accepted: March 12, 2020;
                    Published: March 13, 2020

Copyright: This is an open access article distributed under the terms
                           of the CC BY

Competing interests: The authors have declared that no competing
                           interests exist.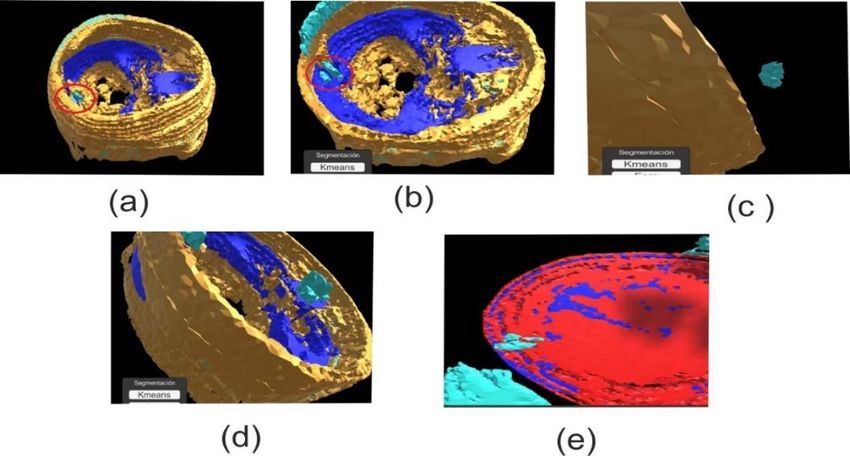
Oscar Rodríguez-Bastidas; Hermes-Fabián Vargas-Rosero

    Generation of 3D Tumor Models from
    DICOM Images for Virtual Planning of
                                   its Recession

                                                                        Oscar Rodríguez-Bastidas1
                                                                  Hermes-Fabián Vargas-Rosero2

Abstract
Medical images are essential for diagnosis, planning of surgery and evolution of
pathology. The advances in technology have developed new techniques to obtain
digital images with more details, in return this has also led to disadvantages, such
as: the analysis of large volumes of information, long time to determine an affected
region and difficulty in defining the malignant tissue for its later extirpation, among
the most relevant. This article presents an image segmentation strategy and the
optimization of a method for generating three-dimensional models. A prototype was
implemented in which it was possible to evaluate the segmentation algorithms and
3D reconstruction technique, allowing to visualize the tumor model from different
points of view through virtual reality. In this investigation, we evaluate the
computational cost and user experience, the parameters selected in terms of
computational cost are the time and consumption of RAM, we used 140 MRI images
each with dimensions 260x320 pixel, and as a result, we obtained an approximate
time of 37.16s and consumption in RAM of 1.3GB. Another experiment carried out
is the segmentation and reconstruction of a tumor, this model is formed by a three-
dimensional mesh made up of 151 vertices and 318 faces. Finally, we evaluate the
application, with a usability test applied to a sample of 20 people with different areas

1 Universidad del Cauca (Cauca-Popayán, Colombia). oscarodriguezb@unicauca.edu.co. ORCID: 0000-0003-
1728-7186.
2 M.Sc. Universidad del Cauca (Cauca-Popayán, Colombia). fvargas@unicauca.edu.co. ORCID: 0000-0001-

5682-3522.

     Revista Facultad de Ingeniería (Rev. Fac. Ing.) Vol. 29 (54), e10173. 2020. Tunja-Boyacá, Colombia.
    L-ISSN: 0121-1129, e-ISSN: 2357-5328, DOI: https://doi.org/10.19053/01211129.v29.n54.2020.10173
Generation of 3D Tumor Models from DICOM Images for Virtual Planning of its Recession

of knowledge. The results show that the graphics presented by the software are
pleasant, they also show that the application is intuitive and easy to use. Additionally,
it is mentioned that it helps improve the understanding of medical images.
Keywords: 3D mesh; 3D model; image segmentation; k-means; medical images;
usability.

       Generación de modelos 3D de tumor desde imágenes DICOM, para
                             planificación virtual de su recesión

Resumen
Las imágenes médicas son imprescindibles para la realización del diagnóstico,
planificación de cirugía y evolución de la patología. El avance de la tecnología ha
desarrollado nuevas técnicas para obtener imágenes digitales con más detalles,
esto a su vez ha llevado a tener desventajas, entre ellas: el análisis de grandes
volúmenes de información, tiempo prolongado para determinar una región afectada
y dificultad para definir el tejido maligno para su posterior extirpación, entre las más
relevantes. Este artículo presenta una estrategia de segmentación de imágenes y
la optimización de un método de generación de modelos tridimensionales. Se
implementó un prototipo en el que se logró evaluar los algoritmos de segmentación
y técnica de reconstrucción 3D permitiendo visualizar el modelo del tumor desde
diferentes puntos de vista mediante realidad virtual. En esta investigación, se evalúa
el costo computacional y la experiencia del usuario, los parámetros seleccionados
en términos de costo computacional son el tiempo y el consumo de RAM, se
utilizaron 140 imágenes MRI cada una de ellas con dimensiones de 260x320
píxeles, y como resultado, se obtuvo un tiempo aproximado de 37.16s y el consumo
de memoria RAM es de 1.3GB. Otro experimento llevado a cabo es la segmentación
y reconstrucción de un tumor, este modelo está formado por una malla
tridimensional que contiene 151 vértices y 318 caras. Finalmente, se evalúa la
aplicación con una prueba de usabilidad aplicada a una muestra de 20 personas
con diferentes áreas de conocimiento, los resultados muestran que los gráficos
presentados por el software son agradables, también se evidencia que el software

     Revista Facultad de Ingeniería (Rev. Fac. Ing.) Vol. 29 (54), e10173. 2020. Tunja-Boyacá, Colombia.
    L-ISSN: 0121-1129, e-ISSN: 2357-5328, DOI: https://doi.org/10.19053/01211129.v29.n54.2020.10173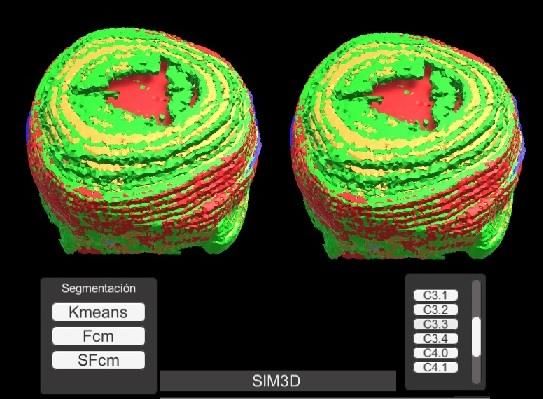
Oscar Rodríguez-Bastidas; Hermes-Fabián Vargas-Rosero

es intuitivo y fácil de usar. También mencionan que ayuda a mejorar la compresión
de imágenes médicas.
Palabras clave: imágenes médicas; k-means; malla 3D; modelo 3D; segmentación
de imágenes; usabilidad.

    Revista Facultad de Ingeniería (Rev. Fac. Ing.) Vol. 29 (54), e10173. 2020. Tunja-Boyacá, Colombia.
   L-ISSN: 0121-1129, e-ISSN: 2357-5328, DOI: https://doi.org/10.19053/01211129.v29.n54.2020.10173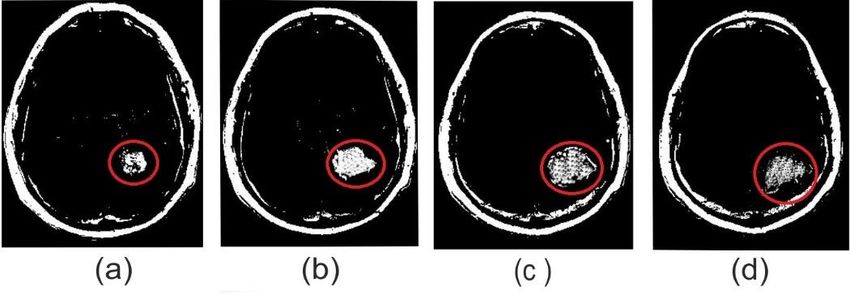
Generation of 3D Tumor Models from DICOM Images for Virtual Planning of its Recession

I. INTRODUCTION
The fundamental objectives of medicine are the prevention and promotion of health,
pain relieving, assistance to incurable diseases and prevention of premature death
[1, 2]. In medical practice, the diagnosis and evolution of pathology are the most
frequent activities in the daily work of a doctor.
Doctors rely on various tools that provide them with information about the status of
the human body, in order to diagnose and determine the evolution of the pathology
and decide on the treatment to follow [3, 4]. In recent years, medical images became
the main tool for the doctor, they show the state of internal tissues in a specific area
of the human body.
Different techniques have emerged through technological developments to observe
the interior of the body, among them is the computed tomography (CT), where the
image is constructed from multiple values of the X-ray beam, which crosses the
study area [5]. This type of images is applied to the study of bone lesions, lung and
thorax studies, and to detect oncological diseases. Another method is magnetic
resonance (MRI), based on the magnetic resonance of the hydrogen nucleus when
exposed to a high magnetic field [6], among its main applications are neurology,
cardiovascular pathologies, otorhinolaryngology, ophthalmology, and locomotor
system diseases. Ultrasound based on a series of electromagnetic waves [7] allows
to evaluate different organs of the human body, its main application is a prenatal
diagnosis. Positron emission tomography (PET) is a molecular technique that uses
radioactive drugs to obtain images of biological processes which are used to
evaluate the functioning of organs [8].
Medical images are presented in 2D, 3D, and 4D. Three dimensions are associated
with space and fourth is the time, in two-dimensional images the information
represents the width and the height of an organ, by adding one more dimension, it
represents depth and it is known as three-dimensional image [9]. On the other hand,
the fourth dimension, adds the possibility of having movement in the image, 4D
images are shaped by 2D and 3D images [10]. A technique that facilitates recording
images in different planes is computed tomography, resulting in 2D images, when
these images are stacked in a plane, they allow to obtain a 3D image; the three-

     Revista Facultad de Ingeniería (Rev. Fac. Ing.) Vol. 29 (54), e10173. 2020. Tunja-Boyacá, Colombia.
    L-ISSN: 0121-1129, e-ISSN: 2357-5328, DOI: https://doi.org/10.19053/01211129.v29.n54.2020.10173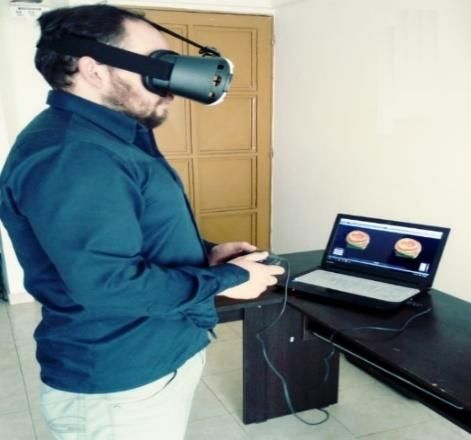
Oscar Rodríguez-Bastidas; Hermes-Fabián Vargas-Rosero

dimensional objects represented with this type of technique require a mental
projection process that can be subjective and different from the diagnostic of the
other specialists [11].
The delimitation (segmentation) of the affected area must be done by a specialist
doctor, and must take into consideration the additional knowledge of anatomy,
pathology, etc. Bokde et al. [12], Cichosz et al. [13], Jaya and Thanushkodi [14],
Selvanayaki and Karnan [15] conclude that manual segmentation is not free from
errors and presents various problems such as unwanted characteristics both
intraoperative and interoperative, lack of reproducibility, exhaustion of the operator
[16], among others.
By the incorporation of computation, the analysis of the region of interest in medical
images is significantly improved, there are several investigations to perform
segmentation, but there are still drawbacks, authors such as Weese and Lorenz [17]
highlight the lack of analysis technologies, lack of robustness and reliability in
techniques, and lack of automatic algorithms for constructing anatomical models.
Ayyoub et al. [18] focus the problem on the segmentation of the region of interest
and state that the analysis of medical images still requires considerable
improvements [19].
The document is structured as follows, the first section explains the materials and
methods presenting preliminary concepts of medical images, describing the
algorithms of segmentation and generation of 3D models, also, it shows the stages
of software development. The next section shows the result after a computing cost
assessment, three-dimensional models, and an end-user experience (usability). The
last section presents the conclusions and future works.

II. METHODS

A. Techniques for Medical Images
Currently, technological development has allowed obtaining real-time information of
the current state of the organs, facilitating the portability of reports between diverse
entities of health. Medical images have also evolved since their invention, presenting

    Revista Facultad de Ingeniería (Rev. Fac. Ing.) Vol. 29 (54), e10173. 2020. Tunja-Boyacá, Colombia.
   L-ISSN: 0121-1129, e-ISSN: 2357-5328, DOI: https://doi.org/10.19053/01211129.v29.n54.2020.10173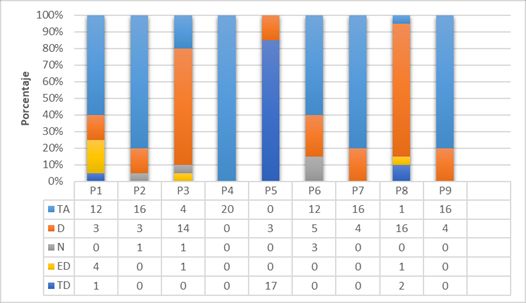
Generation of 3D Tumor Models from DICOM Images for Virtual Planning of its Recession

improvements in techniques and procedures, but in return, they also increase the
amount of data to be processed and analyzed.
As a solution to the handling of information, the DICOM (Digital Imaging and
Communications in Medicine) standard appears, which is the most widespread
standard. It was created by the ACR (American College of Radiology) and by the
NEMA (National Electrical Manufacturers Association). The DICOM standard is
open-source designed to organize images for visualization, storage, printing and
transmissions [20, 21]. The current version is 3.0 but it constantly evolves according
to technological advances [22, 23].
Among the information collection techniques of the human body, there is Computed
tomography (CT) and Magnetic Resonance (MRI). Hounsfield, in 1971 develops TC,
which uses the intrinsic characteristic of X-rays to pass through the tissues of the
human body, and thus form the image that represents the organ. Ramirez et al. [24]
determine that the investigations are focused on aspects such as: increasing the
speed of acquisition (temporal resolution), improving the spatial resolution, raising
the quality of the image and minimizing the dose of ionizing radiation. On the other
hand, MRI makes usage of an intense magnetic field for the generation of the image,
and this type of technique produces images of high quality, and its main uses are to
detect cerebral edema, venous thrombosis, among others [25].

B. Algorithm Clustering (k-means)
Artificial intelligence is revolutionizing the way of processing massive volumes of
data (Big Data) [26], involving various areas of knowledge, among which is the
medical field, specifically in segmentation. According to Caponetti et al. [27] grouping
algorithms are successful tools in the task of limiting the region of interest. Several
authors have carried out various works such as the one elaborated by Gharnali et
al. [28] who propose an algorithm based on FCM, which increased accuracy and
robustness against noise. The analysis was applied to MRI images of the brain in
white and gray matter segmentation. On the other hand, Ahmmed et al. [29]
performed the classification of brain tumors using fuzzy logic: they initially performed
delimitation of the region of interest, then selected characteristics to classify using

     Revista Facultad de Ingeniería (Rev. Fac. Ing.) Vol. 29 (54), e10173. 2020. Tunja-Boyacá, Colombia.
    L-ISSN: 0121-1129, e-ISSN: 2357-5328, DOI: https://doi.org/10.19053/01211129.v29.n54.2020.10173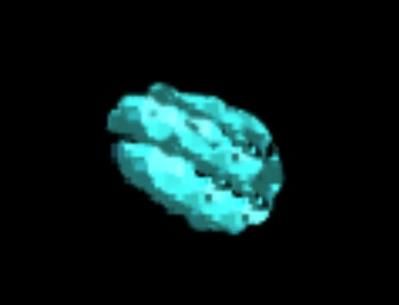
Oscar Rodríguez-Bastidas; Hermes-Fabián Vargas-Rosero
93 fuzzy rules. Jaros et al. [30] demonstrated the parallel capabilities of the K-means
algorithm applied to the segmentation of TC images of the human body.
In this work, we used the K-means algorithm because of its simple implementation
and great results. K-means developed by MacQueen in 1967 is the most widespread
and used [31] algorithm. The main applications of clustering methods are in data
mining; whose objective is to group elements with common characteristics.
C. Three-Dimensional Models
In virtual environments, the 3D or three-dimensional model is the technique that
allows modifying the perception of the observer, providing depth to two-dimensional
images. Representing an object on a screen requires an analysis of the
morphological characteristics of things. In computing, three-dimensional models are
discrete, that is, they are constructed from points located in 3D space, and are
interconnected by edges to form graphically visible structures.
Computational graphic models consist of meshes. Authors such as Boening et al.
[32], present an algorithm based on Delaunay triangulation, in this work they
performed the 3D reconstruction of proteins. Delone proposed in 1934 a method,
named Delaunay triangulation, that allows to maximize the interior angle of a mesh
of triangles that delimits the surface of an object. Its technique is based on two main
elements: the first of them, a triangle, and the second, the circumscribed
circumference (the one that contains the vertices of the triangle).
D. Development of SIM3D Software
1) Analysis. The success of software development is in the analysis of the functional
requirements of the system. The following list shows the engineering specifications.
Medical images are under the DICOM standard, and the source of generation
can be CT or MRI.
The files are stored in a folder, where they are properly labeled.
Perform delimitation of the region of interest using established characteristics.
Perform the generation of three-dimensional models, using the segmentation
of medical images.
Revista Facultad de Ingeniería (Rev. Fac. Ing.) Vol. 29 (54), e10173. 2020. Tunja-Boyacá, Colombia.
L-ISSN: 0121-1129, e-ISSN: 2357-5328, DOI: https://doi.org/10.19053/01211129.v29.n54.2020.10173Generation of 3D Tumor Models from DICOM Images for Virtual Planning of its Recession
Interconnect a virtual reality visualization device, using virtual reality glasses
and a mobile device.
Allow interaction with objects within the work environment.
2) Design. The program SIM3D contains two modules: Data analysis and
information management. Data analysis reads and performs segmentation of
medical images, and it includes the functions Read Image and Segmentation.
Information management builds three-dimensional meshes, and contains the
options Navigate, Mesh and VR. Figure 1. shows a complete block diagram.
Fig. 1. Block diagram of the program.
The module Read Image establishes a one-dimensional array with pixel values of
the image. Initially, a data-stack loads the names of the files located in the directory
defined by the user. Next, a function receives the stack with names and extracts the
pixel values. Finally, the data-array reshapes dimension to nx1.
The next module (Segmentation) aims to group pixels with similar characteristics.
This application implements clustering algorithms (k-means, FCM, and SFCM),
these algorithms are iterative and unsupervised, they seek patterns in the data,
without having a prediction as aim. As input data needs an array with population to
segment, and it also requires cluster number, the initialization of centroids is random.
Next, the module Mesh is responsible of generating the 3D mesh, it receives the
data from the Segmentation module, and it delivers the file with extension *.obj
(Wavefront 3D Object File) as an output. Initially, the Delaunay algorithm builds the
mesh based on data from the Segmentation module, and then a refinement is
performed to improve the definition of three-dimensional graphics, at the end of this
stage a *.off type file (Object File Format) that contains the geometry of the 3D object
Revista Facultad de Ingeniería (Rev. Fac. Ing.) Vol. 29 (54), e10173. 2020. Tunja-Boyacá, Colombia.
L-ISSN: 0121-1129, e-ISSN: 2357-5328, DOI: https://doi.org/10.19053/01211129.v29.n54.2020.10173Oscar Rodríguez-Bastidas; Hermes-Fabián Vargas-Rosero
is generated. However, Unity does not accept files *.off, therefore, the files all convert
to obj format.
The module Navigate is responsible of reading and loading the meshes, it is also
responsible of receiving the information of the joystick or gyroscope sensors of the
mobile device, with this data it performs movements of the objects or the camera.
Finally, the VR module is responsible of establishing the gateway between the
application running on the computer and the mobile device, where the viewing of the
objects happens. This module uses a client-server model to build a bidirectional
channel.
3) Implementation. We implemented the software using the C ++ programming
language, on the VisualStudio platform; Unity software was used as a graphics
engine for the rendering of meshes. Figure 2 shows the class diagram.
Fig. 2. Class diagram of the program.
4) Validation. The user interface can be seen in Figure 3. In the image, you can see
a window divided in two, where the mesh is generated by the program. In the lower
left part of the window the panel that allows to choose one of the three segmentation
algorithms is located, whereas on the right side, buttons that make each cluster
visible can be seen.
Revista Facultad de Ingeniería (Rev. Fac. Ing.) Vol. 29 (54), e10173. 2020. Tunja-Boyacá, Colombia.
L-ISSN: 0121-1129, e-ISSN: 2357-5328, DOI: https://doi.org/10.19053/01211129.v29.n54.2020.10173Generation of 3D Tumor Models from DICOM Images for Virtual Planning of its Recession
Fig. 3. Main window of the application.
For improving the navigation experience, the SIM3D software performs movements
from two perspectives. The first of these is the movement of the camera, allowing it
to perform rotational and translational changes, which makes it easy to observe from
various perspectives. The second way to perform moves is to keep the observer
static and move the objects present in the scene, additionally allowing translation
and rotation.
III. RESULTS
This section presents the strategy for the evaluation of the designed software. The
analysis includes the computational cost, time, and RAM usage during mesh
generation and viewing of a three-dimensional model. Finally, we perform an
experiment with a group the people to define the usability of the computational
application. Three computers were used to run the tool developed in this work, as
indicated in Table 1.
Table 1. Technological resources.
Characteristics Machine 1 Machine 2 Machine 3
Core i5-5200 CPU Core i7-6700 CPU Core i5-2400 CPU 3.1
Processor
2.2GHz 3.5 GHz GHz
RAM 6 GB 8 GB 4 GB
Graphic card Intel HD GTX 1050 4GB Intel HD
Operative system Win 10 Win 10 Win 10
Revista Facultad de Ingeniería (Rev. Fac. Ing.) Vol. 29 (54), e10173. 2020. Tunja-Boyacá, Colombia.
L-ISSN: 0121-1129, e-ISSN: 2357-5328, DOI: https://doi.org/10.19053/01211129.v29.n54.2020.10173Oscar Rodríguez-Bastidas; Hermes-Fabián Vargas-Rosero
A. Computational Cost
We used a medical MRI image with dimensions of 260x320 pixels for the evaluation
of time and RAM metrics. The protocol for the experiment was the following: we
performed 10 independent tests and each of them ran 100 iterations, also the
number of images in each new inspection increases.
Time and RAM are related to the number of images processed in each run. Table 2
shows the results of the time and RAM used on three machines, where the μ and δ
labels represent the mean and standard deviation, respectively. The average time in
the three work stations was 0.310s and 37.16s. The shortest time corresponds to
the processing of an image with 83.400 pixels, and the largest time in the study is of
11.648.000 pixels corresponding to 130 images. On the other hand, one image uses
0.028 Gb of RAM and 140 images use approximately 1.3 Gb. The RAM used in the
three computing machines does not show significant changes.
Table 2. Computational time and RAM cost.
Machine 1 Machine 2 Machine 3
No C. I Time (s) RAM (GB) Time (s) RAM (GB) Time (s) RAM (GB)
µ δ µ δ µ Δ µ Δ µ δ µ Δ
1 001 0.265 0.01 0.010 0.01 0.243 0.02 0.010 0.01 0.423 0.02 0.010 0.01
2 002 0.592 0.20 0.028 0.01 0.537 0.05 0.026 0.01 0.951 0.08 0.026 0.01
3 010 2.467 0.50 0.100 0.02 2.358 0.11 0.097 0.09 4.609 0.31 0.097 0.09
4 020 5.049 0.30 0.190 0.01 4.486 0.30 0.190 0.01 8.012 0.45 0.190 0.01
5 030 6.404 0.60 0.250 0.01 5.957 0.31 0.251 0.01 11.48 0.50 0.251 0.01
6 040 9.057 1.09 0.300 0.01 8.252 0.41 0.310 0.01 15.71 1.80 0.310 0.01
7 050 11.51 1.03 0.500 0.10 9.923 1.01 0.493 0.10 20.87 1.57 0.494 0.10
8 100 23.07 0.90 0.900 0.08 21.18 1.10 0.910 0.09 43.67 2.09 0.910 0.09
9 120 27.50 1.01 1.100 0.09 23.82 1.50 1.089 0.10 47.66 2.90 1.099 0.10
10 140 30.44 1.10 1.300 0.10 25.63 2.00 1.281 0.20 55.43 4.01 1.291 0.20
B. Segmentation
For the reconstruction of the tumor, we used four MRI studies that show a brain
tumor. Figure 4 illustrates medical images of a patient with primary glioblastoma,
which is a tumor of the central nervous system that primarily affects men [33]. In this
case, the region with the lesion is found in the right hemisphere, in the parietal lobe.
Figure 4a is a lower slice, and Figure 4d is a higher layer.
Revista Facultad de Ingeniería (Rev. Fac. Ing.) Vol. 29 (54), e10173. 2020. Tunja-Boyacá, Colombia.
L-ISSN: 0121-1129, e-ISSN: 2357-5328, DOI: https://doi.org/10.19053/01211129.v29.n54.2020.10173Generation of 3D Tumor Models from DICOM Images for Virtual Planning of its Recession
Fig. 4. Primary Glioblastoma layer: (a) Layer 15, (b) Layer 16, (c) Layer 17 and (d) Layer 18 [34].
Clustering techniques present a very high sensitivity to the selection of centroids
[35]. In this work, we initialize the centers using random values from the dataset and
the cluster number is five. Figure 5 shows the results of the segmentation of the
images present in Figure 4. Figures 4a to 4d display the region with a lesion inside
a red circle, they also contain an oval white area due to fat between scalp and bone.
C. Rendering
Rendering is done using the Unity graphics engine. Figure 6 displays the three-
dimensional model of the tumor. The model is built from triangular meshes which are
sets of vertices, edges, and faces. The mesh of the tumor includes 151 vertices and
318 faces. The image shows a tumor with some shape deformations. In other words,
the angle formed between two adjacent faces can be between two range 0-30 and
values near 90 grades. These types of angles have several causes such as a
deficiency in segmentation, images having a separation between each of the layers,
among others.
Fig. 5. Segmented image: (a) Layer 15, (b) Layer 16, (c) Layer 17 and (d) Layer 18.
Revista Facultad de Ingeniería (Rev. Fac. Ing.) Vol. 29 (54), e10173. 2020. Tunja-Boyacá, Colombia.
L-ISSN: 0121-1129, e-ISSN: 2357-5328, DOI: https://doi.org/10.19053/01211129.v29.n54.2020.10173Oscar Rodríguez-Bastidas; Hermes-Fabián Vargas-Rosero
Fig. 6. Tumor 3D.
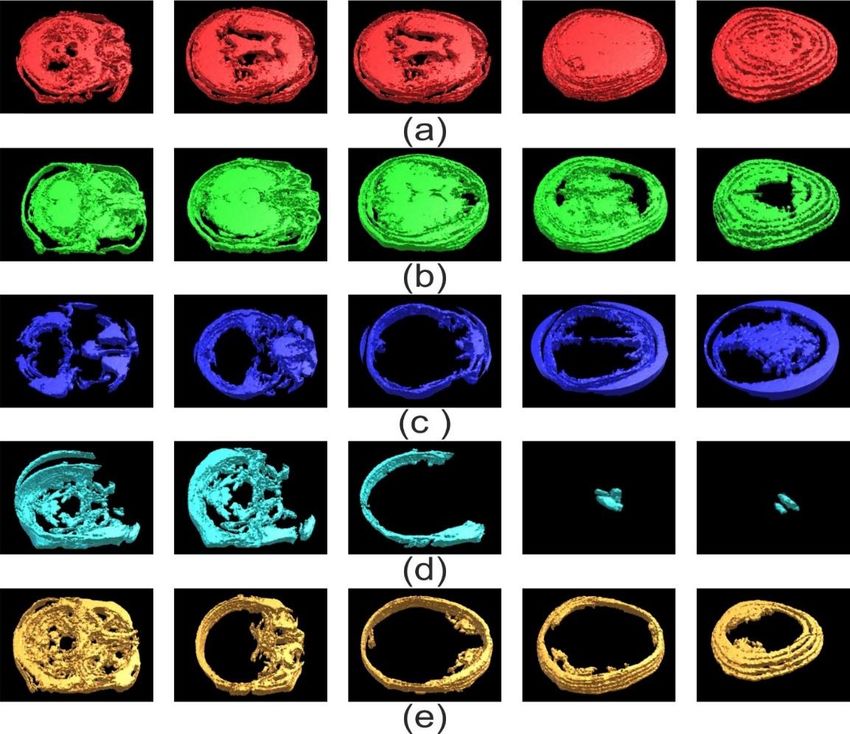
The meshes generated by the computational application use triangles. Figure 7
shows the reconstruction of the tumor seen from various viewpoints, also, the
illustration includes views of several sections aiming for the best view. Figures 7a
and 7b display the tumor views from top left (this is inside a red curve line). Figure
7c presents the model seen from the posterior region with a turn of about 45 degrees.
Figure 7d illustrates a mesh view from the front with approximately 45 grades of
inclination of the camera. Finally, Figure 7e shows the tumor view from the neck and
with a turn of 90 degrees.
On the whole, the model 3D generated by the application SIM3D contains vertices
than form polygons. It includes meshes generated from medical multilayer images;
the segmentation delimits the region in groups or several clusters, and it separates
in parts. Table 3 presents the vertices and faces of each group. In figure 8, we show
the 3D models that are the result of using 5 clusters. Each group is represented by
a letter.
Revista Facultad de Ingeniería (Rev. Fac. Ing.) Vol. 29 (54), e10173. 2020. Tunja-Boyacá, Colombia.
L-ISSN: 0121-1129, e-ISSN: 2357-5328, DOI: https://doi.org/10.19053/01211129.v29.n54.2020.10173Generation of 3D Tumor Models from DICOM Images for Virtual Planning of its Recession
Fig. 7. Views of the glioblastoma tumor: (a) and (b) top view, (c) back view with rotation, (d) front
view with rotation and (e) bottom view.
Table 3. Vertices and Faces of each of the clusters.
Vertices Faces
k
1 2 3 4 5 1 2 3 4 5
a 29.462 26.040 26.040 24.932 14.560 67.384 59.588 59.588 58.352 32.044
b 29.666 28.508 24.769 23.195 12.248 68.060 64.682 55.769 53.458 27.024
c 08.555 12.112 07.320 11.696 07.166 18.076 24.430 15.320 24.702 14.828
d 15.202 05.082 00.151 01.883 00.153 32.566 11.042 00.318 03.976 00.316
e 26.837 15.639 09.297 08.928 07.611 60.268 34.616 20.138 12.294 16.486
D. Usability
In the developed system, the visualization is done through virtual reality using
stereoscopy technique, that is to say, the models are seen through VR glasses.
Moreover, the interaction with the objects visible in the scene uses a video game
control. The system starts with the choice of DICOM images directory and the
selection of the segmentation algorithm, indicating respective parameters, and with
the help of the control it moves the objects, both in translation and rotation. Figure 9
shows the final user using the SIM3D system.
Authors such as Barajas et al. [35] recommend that for the study of software
usability, the minimum samples must be bigger than or equal to 20. To validate the
computer program, a study was conducted by interviewing 20 users, 10 participants
are engineers and students of engineering, electronics, mechanics and computer
science, and the remaining 10 are students of medicine and odontology. To perform
the trial, we used a document with questions.
Revista Facultad de Ingeniería (Rev. Fac. Ing.) Vol. 29 (54), e10173. 2020. Tunja-Boyacá, Colombia.
L-ISSN: 0121-1129, e-ISSN: 2357-5328, DOI: https://doi.org/10.19053/01211129.v29.n54.2020.10173Oscar Rodríguez-Bastidas; Hermes-Fabián Vargas-Rosero
Fig. 8. Views of k clusters (a) k = 1, (b) k = 2, (c) k = 3, (d) k = 4 y (e) k = 5.
Fig. 9. SIM3D user.
We used a document with ten questions, with nine closed questions and one open
question. The questionnaire is easy to answer, and the questions are shown in Table
4. The survey design seeks to collect the perception of aspects of software quality.
It also seeks to identify software support in the analysis of medical images. The
Revista Facultad de Ingeniería (Rev. Fac. Ing.) Vol. 29 (54), e10173. 2020. Tunja-Boyacá, Colombia.
L-ISSN: 0121-1129, e-ISSN: 2357-5328, DOI: https://doi.org/10.19053/01211129.v29.n54.2020.10173Generation of 3D Tumor Models from DICOM Images for Virtual Planning of its Recession
questions are randomly distributed to avoid cognitive biases at the time of
responding to the survey.
Table 4. Questionnaire.
Index Question
P1 Was it easy to make a mental representation of the tumor before using the software?
P2 After using the software, was it easier to understand the two-dimensional images
presented at the beginning of the exercise?
P3 Are you satisfied with the scenes shown in the SIM3D application?
P4 Is the degree of difficulty in detecting a tumor in medical images high?
P5 During or after the experiment, did you feel any discomfort?
P6 In general, are you satisfied with the navigability of the software?
P7 Before, during and after finishing the test, were there any difficulties interacting with the
SIM3D program?
P8 Is the interface suitable for the application?
P9 How do you rate the ergonomics of the software?
P10 What do you think are the opportunities for software improvement?
The protocol for the execution of the test was divided into three phases: induction,
developing, and finally survey answering. In the introductory stage, we inform
aspects related to the handling of the SIM3D software, then, each participant
observes the images that later load in the computational application. The user must
make an imaginative description of the tumor shown in the pictures. In the
development stage, the participants must define initial parameters, a directory that
includes the images and a cluster number. After that, they perform the following
actions: first, move the visible objects in the scene, in the three dimensions, using
the video game control (Joystick). Secondly, the head moves to adjust the position
of the camera. Thirdly, they perform the incorporation or rejection of objects that
uses the buttons in the application or the video game control (Joystick). In the final
phase, they must answer the survey.
The participants gave their opinion using the five point Likert scale, where they can
select: totally agree (TA), agree (D), neutral (N), disagree (ED) and totally disagree
(TD). Question 10 is an open question in which they capture their opinion without
limitations. Figure 10 shows the results of the questionnaire. We located in the
abscissa axis the index of the nine questions that shows in Table 3. On the other
hand, the ordinates axis represents the percentage of responses.
Revista Facultad de Ingeniería (Rev. Fac. Ing.) Vol. 29 (54), e10173. 2020. Tunja-Boyacá, Colombia.
L-ISSN: 0121-1129, e-ISSN: 2357-5328, DOI: https://doi.org/10.19053/01211129.v29.n54.2020.10173Oscar Rodríguez-Bastidas; Hermes-Fabián Vargas-Rosero
1) Visual perspective of medical images. As mentioned above, the survey is to
evaluate the participants' judgment regarding the interpretation of medical images.
After analyzing the data, we found that the reading of medical images, especially in
the identification of a tumor, presents a high degree of difficulty, 60% totally agree
and 15% agree. On the contrary, for 25% the interpretation is easy (see Figure 10.
P1), perhaps, due to their medical training. Also, the 20 students -that is 100% of the
surveyed people- ratify the difficulty to identify tumors in 2D images (see Figure 10.
P4).
Although the results of the questions identified with numbers one and four testify the
difficulty in the interpretation of 2D images (traditional method), the answers of the
second question let us infer that the implemented application improves the
perception of the information contained in medical images, since 80% completely
agree, 15% agree, and only 5% remain neutral (see Figure 10. P2).
Fig. 10. Result of the questionnaire.
2) Perspective of the SIM3D software. User interfaces should be attractive, easy
to use, functional, intuitive, among other features. The participants, directly and
indirectly, declared aspects oriented to improve the perception of the interface. Users
reported that approximately 12% strongly agree and 75% agree to the graphics and
Revista Facultad de Ingeniería (Rev. Fac. Ing.) Vol. 29 (54), e10173. 2020. Tunja-Boyacá, Colombia.
L-ISSN: 0121-1129, e-ISSN: 2357-5328, DOI: https://doi.org/10.19053/01211129.v29.n54.2020.10173Generation of 3D Tumor Models from DICOM Images for Virtual Planning of its Recession
scenes of the application (see Figure 10. P3 and P8). The test confirmed that the
designed interface is acceptable, and also that it can have several improvements.
Besides, the simplicity for the user to scroll through the screen and use the icons of
the application makes it attractive to use. Questions six, seven and nine allowed us
to obtain the perception of software navigability, and we found that 60% strongly
agree, 25% agree, and 15% remain neutral (see Figure 10. P6). Functionality is a
feature that makes the user feel comfortable when using a computational application,
for which question seven was used, confirming that it is a normally operating system,
since 80% fully agree, and 20% agree (see Figure 10. P7). Moreover, the
observations of the ninth question confirm that the software is user-friendly, where
16 users that represent 80% of the surveyed students reported total agreement (see
Figure 10. P9).
Using screens at a close visual range causes effects on the human body such as
eyestrain, dizziness, nausea, among others. To determine any change in the
participants, we asked about any discomfort presented during or after the test. Here,
15 % agreed (see Figure 10. P5), that is to say, 3 participants manifested some
discomfort that could have occurred due to the effect of the lenses or, perhaps, to
extremely rapid movements of the head. On the contrary, 85% reported finishing the
experiment without any discomfort.
The open question allows the respondent to answer using their own words and
reveal additional information about improvements to the computer program. There
is a tendency to improve three-dimensional graphics, some of the answers were:
"Eliminate pointed angles between faces"; "objects must be smooth surfaces"; "non-
square graphics"; among others. There are also suggestions about the
implementation of a security protocol to protect clinical information. Also, users
showed interest in the application being multi-user.
IV. DISCUSSION AND CONCLUSIONS
The difference between the research presented by Indraswari et al. [36], Imai et al.
[37], Maitra et al. [38] and Zhang et al. [39], and the one in this paper lays mainly in
the methodology for presenting results, where, in addition to segmentation, a three-
Revista Facultad de Ingeniería (Rev. Fac. Ing.) Vol. 29 (54), e10173. 2020. Tunja-Boyacá, Colombia.
L-ISSN: 0121-1129, e-ISSN: 2357-5328, DOI: https://doi.org/10.19053/01211129.v29.n54.2020.10173Oscar Rodríguez-Bastidas; Hermes-Fabián Vargas-Rosero
dimensional reconstruction algorithm is incorporated. On the other hand, solutions
presented by Zhang et al. [40], Zhao et al. [41], Shen et al. [42], Holger et al. [43]
show the data using three-dimensional reconstruction. The difference with the
solution proposed in this paper is in the possibility of navigating three-dimensional
reconstruction facilitating visualization from different perspectives.
In this article, we presented the design and implementation of the software named
SIM3D, for the segmentation and generation of three-dimensional models based on
multilayer medical images. The delimitation of the region of interest was performed
using clustering algorithms (K-means) and the Delaunay triangulation algorithm was
used to generate the 3D mesh, as a rendering engine for Unity 3D. The process was
implemented in C++ programming language.
We evaluated the SIM3D application in three computers with different hardware
resources, and Windows 10 operating system. The computer must have at least 4Gb
available in RAM for proper operation. Other than the RAM, there are no significant
changes in the three teams.
The evaluation of the program used MRI images from a patient diagnosed with
primary glioblastoma. In the magnetic resonance imaging from the head divided in
24 sliders, the tumor is visible in slice 15 to 18. The k-means algorithm selected the
region of interest (tumor), and generated three-dimensional meshes.
In the usability tests the participants were a group of multidisciplinary users such as
engineering students, engineers, and medical students. The results show a great
acceptance of the designed application.
As future work, it is proposed to optimize the mesh generation algorithm, evaluate
using the operating system in real-time, use virtual reality glasses like those
developed by Oculus VR, to estimate the performance of the application. Also,
perform tests with a real-time source of images.
AUTHOR’S CONTRIBUTION
Rodriguez-Bastidas carried out the problem statement, documentary review,
software development, usability tests, analysis, and discussion of the obtained
Revista Facultad de Ingeniería (Rev. Fac. Ing.) Vol. 29 (54), e10173. 2020. Tunja-Boyacá, Colombia.
L-ISSN: 0121-1129, e-ISSN: 2357-5328, DOI: https://doi.org/10.19053/01211129.v29.n54.2020.10173Generation of 3D Tumor Models from DICOM Images for Virtual Planning of its Recession
results. He also wrote the manuscript. Vargas-Rosero delimited the problem,
advised throughout the development of the investigation, reviewed the techniques
for processing the results, and reviewed the final document.
REFERENCES
[1] O. Quintana, “Los objetivos de la medicina,” Revista de Calidad Asistencial, vol. 18(2), pp. 132-135, 2003.
https://doi.org/10.1016/S1134-282X(03)77587-3
[2] R. León-Barua, and R. Berendson-Seminario, “Theorical Medicine. Definition of medicine and its relation
to biology,” Rev. Med. Hered., vol. 7(1), pp. 1-3, 1996. https://doi.org/10.20453/rmh.v7i1.499
[3] S. Sierre, D. Teplisky, and J. Lipsich, “Vascular malformations: an update on imaging and treatment,” Arch.
Argent. Pediatr., vol. 114(2), pp. 167-176, 2016. http://doi.org/10.5546/aap.2016.167
[4] P. Soffia, C. Ubeda, P. Miranda, and L. Rodríguez, “Radioprotección al día en radiología diagnóstica:
Conclusiones de la Conferencia Iberoamericana de Protección Radiológica en Medicina (CIPRaM) 2016,”
Rev. Chil. Radiol., vol. 23(1), pp. 15-19, 2017. http://doi.org/10.4067/S0717-93082017000100004
[5] E. Bosch, “Sir Godfrey Newbold Hounsfield y la tomografía computada, su contribución a la medicina
moderna,” Rev. Chil. Radiol., vol. 10(4), pp. 183-185, 2004. http://doi.org/10.4067/S0717-
93082004000400007
[6] I. D. Aristizábal, “The magnetic resonance and its agro-industry applications, a review,” Rev. Fac. Nal. Agr.,
vol. 60(2), pp. 4037-4066, 2007.
[7] G. Schmidt, “Introducción,” Ecografía: De la imagen al diagnóstico. Spain: Panamericana, 2007.
[8] J. A. Ruiz-Guijarro, “Tomografía por emisión de positrones (PET): evolución y futuro,” Radiobiología, vol.
7, pp. 148-156, 2007.
[9] G. Sakas, “Trends in medical imaging: From 2D to 3D,” Computer & Graphics, vol. 26(4), pp. 577-587, Aug.
2002. https://doi.org/10.1016/S0097-8493(02)00103-6
[10] G. Li, D. Citrin, K. Camphausen, B. Mueller, C. Burman, B. Mychalczak, R. W. Miller, and Y. Song,
“Advances in 4D medical Imaging and 4D Radiation Therapy,” Technology in Cancer Research an
Treatment, vol. 7(1), pp. 67-81, Feb. 2008. https://doi.org/10.1177/153303460800700109
[11] D. R. Ortega, and A. M. Iznaga, “Técnicas de Segmentación de Imágenes Médicas,” in 14 Convención
científica de ingeniería y arquitectura, Habana, Cuba, 2008, pp. 1-7.
[12] A. L. Bokde, S. J. Teipel, R. Schwarz, G. Leinsinger, K. Buerger, T. Moeller, H. J. Möller, and H. A. Hampel,
“Reliable manual segmentation of the frontal, parietal, temporal, and occipital lobes on magnetic resonance
images of healthy subjects,” Brain research protocols, vol. 14(3), pp. 135-145, Mar. 2005.
https://doi.org/10.1016/j.brainresprot.2004.10.001
[13] S. L. Cichosz, S. Vangsgaard, A. S. Jørgensen, K. E. Kannik, E. Steffensen, and S. F. Eskildsen, “Brain
tumor segmentation from MRI: a comparative study,” in IADIS Multi Conference on Computer Science and
Information Systems, Germany, 2010, pp. 401-406.
[14] J. Jaya, and K. Thanushkodi, “Certain investigation on MRI segmentation for the implementation of CAD
system,” WSEAS Transactions on Computers, vol. 10(6), pp. 189-198, Jun. 2011.
Revista Facultad de Ingeniería (Rev. Fac. Ing.) Vol. 29 (54), e10173. 2020. Tunja-Boyacá, Colombia.
L-ISSN: 0121-1129, e-ISSN: 2357-5328, DOI: https://doi.org/10.19053/01211129.v29.n54.2020.10173Oscar Rodríguez-Bastidas; Hermes-Fabián Vargas-Rosero
[15] K. Selvanayaki, and M. Karnan, “CAD system for automatic detection of brain tumor through magnetic
resonance image-A review,” International Journal of Engineering Science and Technology, vol. 2(10), pp.
5890-5901, Oct. 2010.
[16] K. P. Wong, “Medical image segmentation: methods and applications in functional imaging”, in Handbook
of biomedical image analysis. New York: Springer, 2005, pp. 111-182. https://doi.org/10.1007/0-306-
48606-7_3
[17] J. Weese, and C. Lorenz, “Four challenges in medical image analysis from an industrial perspective,”
Medical Image Analysis, vol. 33, pp. 44-49, Oct. 2016. https://doi.org/10.1016/j.media.2016.06.023
[18] M. AI-Ayyoub, S. AIZu’bi, Y. Jararweh, M. A. Shehab, and B. B. Gupta, “Accelerating 3D medical volume
segmentation using GPUs,” Multimedia Tools and Applications, vol. 77(3), pp. 4939-4958, Dec. 2016.
https://doi.org/10.1007/s11042-016-4218-0
[19] I. Scholl, T. Aach, T. M. Deserno, and T. Kuhlen, “Challenges of medical image processing,” Comput. Sci.
Res. Dev., vol. 26(1-2), pp. 5-13, Dec. 2011. https://doi.org/10.1007/s00450-010-0146-9
[20] A. Fedorov, D. Clunie, E. Ulrch, C. Bauer, A. Wahle, B. Brown, M. Onken, J. Riesmeier, S. Pieper, R.
Kikinis, J. Buatti, and R. R. Beichel, “DICOM for quantitative imaging biomarker development: a standards
based approach to sharing clinical data and structured PET/CT analysis results in head and neck cancer
research,” PeerJ, vol. 4, pp. 2057-2081, May. 2016. https://doi.org/10.7717/peerj.2057
[21] C. J. Roth, L. M. Lannum, and C. L. Joseph, “Enterprise Imaging Governance: HIMSS-SIIM Collaborative
White Paper,” J. Digit. Imaging, vol. 29(5), pp. 539-546, Jun. 2016. https://doi.org/10.1007/s10278-016-
9883-z
[22] S. Sornapudi, R. J. Stanley, W. V. Stoecker, H. Almubarak, R. Long, S. Antani, G. Thoma, R. Zuna, and S.
R. Frazier, “Deep Learning Nuclei Detection in Digitized Histology Images by Superpixels,” J. Pathol.
Inform., vol. 8(38), pp. 1-12, Mar. 2017. https://doi.org/10.4103/jpi.jpi_74_17
[23] P. Mildenberger, M. Eichelberg, and E. Martin, “Introduction to the DICOM standard,” Eur Radiol., vol.
12(4), pp. 920-927, Apr. 2002. https://doi.org/10.1007/s003300101100
[24] J. C. Ramírez-Giraldo, C. Arboleda-Clavijo, and C. H. McCollough, “Tomografía computarizada por rayos
X: fundamentos y actualidad,” Revista Ingeniería Biomédica, vol. 2(4), pp. 54-66, Nov. 2008.
[25] N. Pebet, “Resonancia Nuclear Magnética,” in XIII Seminario de Ingeniería Biomédica, Montevideo,
Uruguay, 2004, pp. 1-5.
[26] A. Marangoni, “A.I. Arrival on Radiology-Threat or Challenge to Update?,” Rev. Argent. Radiol., vol. 82(2),
pp. 55-56, Jun. 2018. https://doi.org/10.1055/s-0038-1656546
[27] L. Caponetti, G. Castellano, and V. Corsini, “MR Brain Image Segmentation: A Framework to Compare
Different Clustering Techniques,” Information, vol. 8(4), pp. 138-159, Nov. 2017.
https://doi.org/10.3390/info8040138
[28] B. Gharnali, and S. Alipour, “MRI Image Segmentation Using Conditional Spatial FCM Based on Kernel-
Induced Distance Measure,” Engineering, Rechnology and Applied Science Research, vol. 8(3), pp. 2985-
2990, Jun. 2018.
[29] R. Ahmmed, A. Rahman, and F. Hossain, “Fuzzy Logic Based Algorithm to Classify Tumor Categories with
Position from Brain MRI Images,” in 3rd International Conference on Electrical Information and
Communication Technology (EICT), Khulna, Bangladesh, 2017, pp. 1-6.
https://doi.org/10.1109/eict.2017.8275232
Revista Facultad de Ingeniería (Rev. Fac. Ing.) Vol. 29 (54), e10173. 2020. Tunja-Boyacá, Colombia.
L-ISSN: 0121-1129, e-ISSN: 2357-5328, DOI: https://doi.org/10.19053/01211129.v29.n54.2020.10173Generation of 3D Tumor Models from DICOM Images for Virtual Planning of its Recession
[30] M. Jaros, P. Strakos, T. Karásek, L. Ríha, A. Vasatová, M. Jarosová, and T. Kozubek, “Implementation of
K-means segmentation algorithm on Intel Xeon Phi and GPU: Application in medical imaging,” Advances
in Engineering Software, vol. 103, pp. 21-28, Jan. 2017. https://doi.org/10.1016/j.advengsoft.2016.05.008
[31] K. Wagstaff, C. Cardie, S. Rogers, and S. Schroedl, “Constrained k-means clustering with background
knowledge,” in ICML 01 Proceedings of the Eighteenth International Conference on Machine Learning, San
Francisco, United States, 2001, pp. 577-584.
[32] D. Boening, A. Gauthier-Kemper, B. Gmeiner and J. Klingauf, “Cluster Recognition by Delaunay
Triangulation of Synaptic Proteins in 3D,” Adv. Biosys., vol 1(10), pp. 1700091(1-8), Aug. 2017.
https://doi.org/10.1002/adbi.201700091
[33] S. Jaramillo, W. Osorio, and J. C. Espitia. “Avances en el tratamiento del glioblastoma multiforme,” Univ.
Méd., vol. 51(2), pp. 186-203, Apr. 2010. https://doi.org/10.11144/Javeriana.umed51-2.atgm
[34] K. Clark, B. Vendt, K. Smith, J. Freymann, J. Kirby, P. Koppel, S. Moore, S. Phillips, D. Maffitt, M. Pringle,
L. Tarbox, and F. Prior, “The Cancer Imaging Archive (TCIA): Maintaining and Operating a Public
Information Repository”, Journal of Digital Imaging, vol. 26 (6), Dec. 2013, pp 1045-1057.
https://doi.org/10.1007/s10278-013-9622-7
[35] E. R. Lara, I. María, and A. Barrera, “RENTOL: A Clustering Algorithm Based on K-means,” Research in
Computing Science, vol. 128, pp. 149-157, 2016. https://doi.org/10.13053/rcs-128-1-14
[36] M. A. Barajas, R. M. Reyes, A. A. Maldonado, A. I. García, and J. D. Rivera, “Análisis de cuestionarios para
la evaluación de la usabilidad en programas de computadora,” E-Gnosis, vol. 16, pp. 158-162, 2018.
[37] R. Indraswari, T. Kurita, A. Z. Arifin, N. Suciati, and E. R. Astuti, “Multi-projection deep learning network for
segmentation of 3D medical images,” Pattern Recognition Letters, vol. 125, pp. 791-797, Aug. 2019.
https://doi.org/10.1016/j.patrec.2019.08.003
[38] H. Imai, S. Matzek, T. D. Le, Y. Negishi, and K. Kawachiya, “Fast and accurate 3D medical image
segmentation with data-swapping method,” Arxiv, Pre-print, pp. 1-13, 2019.
[39] M. Maitra, and K. Jaman, “3D unsupervised modified spatial fuzzy c-means method for segmentation of 3D
brain MR image,” Pattern Analysis and Applications, vol. 22(4), pp. 1561-1571, Mar. 2019.
https://doi.org/10.1007/s10044-019-00806-2
[40] X. Zhang, H. Xhao, X. Li, Y. Feng, and H. Li, “A multi-scale 3D Otsu thresholding algorithm for medical
image segmentation,” Digital Signal Processing, vol. 60, pp. 186-199, Aug. 2017.
http://doi.org/10.1016/j.dsp.2016.08.003
[41] Y. Zhang, S. Miao, T. Mansi, and R. Liao, “Unsupervised X-ray Image Segmentation with Task Driven
Generative Adversarial Networks,” Medical Image Analysis, vol. 62, pp. 1-20 Feb. 2020.
http://doi.org/10.1016/j.media.2020.101664
[42] W. Zhao. and Z. Zeng, “Multi Scale Supervised 3D U-Net for Kidney and Tumor Segmentation”, Arxiv, Pre-
print, 2019. https://doi.org/10.24926/548719.007
[43] Q. Dou, L. Yu, H. Chen, Y. Jin, X. Yang, and P. A. Heng, “3D deeply supercised network for automated
segmentation of volumetric medical images,” Medical Image Anslysis, vol. 41, pp. 40-54, May. 2017.
https://doi.org/10.1016/j.media.2017.05.001
[44] H. R. Roth, H. Oda, X Zhow, N. Shimizu, Y. Yang, Y. Hayashi, and K. Mori, “An application of cascade 3D
fully convolutional networks for medical image segmentation,” Compterized Medical Imaging and Graphics,
vol. 66, pp. 90-99, Mar. 2018. https://doi.org/10.1016/j.compmedimag.2018.03.001
Revista Facultad de Ingeniería (Rev. Fac. Ing.) Vol. 29 (54), e10173. 2020. Tunja-Boyacá, Colombia.
L-ISSN: 0121-1129, e-ISSN: 2357-5328, DOI: https://doi.org/10.19053/01211129.v29.n54.2020.10173You can also read