A 7 Tesla Amygdalar-Hippocampal Shape Analysis of Lithium Response in Bipolar Disorder - Frontiers
←
→
Page content transcription
If your browser does not render page correctly, please read the page content below
ORIGINAL RESEARCH
                                                                                                                                                  published: 16 February 2021
                                                                                                                                              doi: 10.3389/fpsyt.2021.614010

                                                A 7 Tesla Amygdalar-Hippocampal
                                                Shape Analysis of Lithium Response
                                                in Bipolar Disorder
                                                Thomas L. Athey 1,2,3 , Can Ceritoglu 1 , Daniel J. Tward 1,2,3 , Kwame S. Kutten 1 ,
                                                J. Raymond DePaulo 4 , Kara Glazer 5 , Fernando S. Goes 4 , John R. Kelsoe 6,7 ,
                                                Francis Mondimore 4 , Caroline M. Nievergelt 7 , Kelly Rootes-Murdy 8 , Peter P. Zandi 4,9 ,
                                                J. Tilak Ratnanather 1,2,3 and Pamela B. Mahon 4,10,11*
                                                1
                                                  Center for Imaging Science, Johns Hopkins University, Baltimore, MD, United States, 2 Institute for Computational Medicine,
                                                Johns Hopkins University, Baltimore, MD, United States, 3 Department of Biomedical Engineering, Johns Hopkins University,
                                                Baltimore, MD, United States, 4 Department of Psychiatry and Behavioral Science, Johns Hopkins School of Medicine,
                            Edited by:          Baltimore, MD, United States, 5 Department of Occupational Therapy, Boston University, Boston, MA, United States,
              Neeltje E. M. Van Haren,          6
                                                  Department of Psychiatry, VA San Diego Healthcare System, La Jolla, CA, United States, 7 Department of Psychiatry,
                     Sophia Children’s          University of California, San Diego, La Jolla, CA, United States, 8 Department of Psychology, Georgia State University, Atlanta,
                Hospital, Netherlands           GA, United States, 9 Department of Mental Health, Johns Hopkins Bloomberg School of Public Health, Baltimore, MD,
                       Reviewed by:             United States, 10 Department of Psychiatry, Brigham & Women’s Hospital, Boston, MA, United States, 11 Department of
                         Delfina Janiri,        Psychiatry, Harvard School of Medicine, Boston, MA, United States
    Sapienza University of Rome, Italy
                        Gabriele Sani,
        Università Cattolica del Sacro
                                                Research to discover clinically useful predictors of lithium response in patients with
                           Cuore, Italy         bipolar disorder has largely found them to be elusive. We demonstrate here that
                *Correspondence:                detailed neuroimaging may have the potential to fill this important gap in mood disorder
                  Pamela B. Mahon
                                                therapeutics. Lithium treatment and bipolar disorder have both been shown to affect
           pmahon@bwh.harvard.edu
                                                anatomy of the hippocampi and amygdalae but there is no consensus on the nature of
                  Specialty section:            their effects. We aimed to investigate structural surface anatomy changes in amygdala
        This article was submitted to           and hippocampus correlated with treatment response in bipolar disorder. Patients with
       Neuroimaging and Stimulation,
              a section of the journal          bipolar disorder (N = 14) underwent lithium treatment, were classified by response status
               Frontiers in Psychiatry          at acute and long-term time points, and scanned with 7 Tesla structural MRI. Large
         Received: 20 October 2020              Deformation Diffeomorphic Metric Mapping was applied to detect local differences in
         Accepted: 19 January 2021
                                                hippocampal and amygdalar anatomy between lithium responders and non-responders.
        Published: 16 February 2021
                                                Anatomy was also compared to 21 healthy comparison participants. A patch of the
                             Citation:
     Athey TL, Ceritoglu C, Tward DJ,           ventral surface of the left hippocampus was found to be significantly atrophied in
    Kutten KS, DePaulo JR, Glazer K,            non-responders as compared to responders at the acute time point and was associated
   Goes FS, Kelsoe JR, Mondimore F,
     Nievergelt CM, Rootes-Murdy K,             at a trend-level with long-term response status. We did not detect an association
        Zandi PP, Ratnanather JT and            between response status and surface anatomy of the right hippocampus or amygdala. To
           Mahon PB (2021) A 7 Tesla
                                                the best of our knowledge, this is the first shape analysis of hippocampus and amygdala
      Amygdalar-Hippocampal Shape
      Analysis of Lithium Response in           in bipolar disorder using 7 Tesla MRI. These results can inform future work investigating
                      Bipolar Disorder.         possible neuroimaging predictors of lithium response in bipolar disorder.
         Front. Psychiatry 12:614010.
     doi: 10.3389/fpsyt.2021.614010             Keywords: lithium, 7T MRI, shape analysis, amygdala, hippocampus, bipolar disorder

Frontiers in Psychiatry | www.frontiersin.org                                           1                                          February 2021 | Volume 12 | Article 614010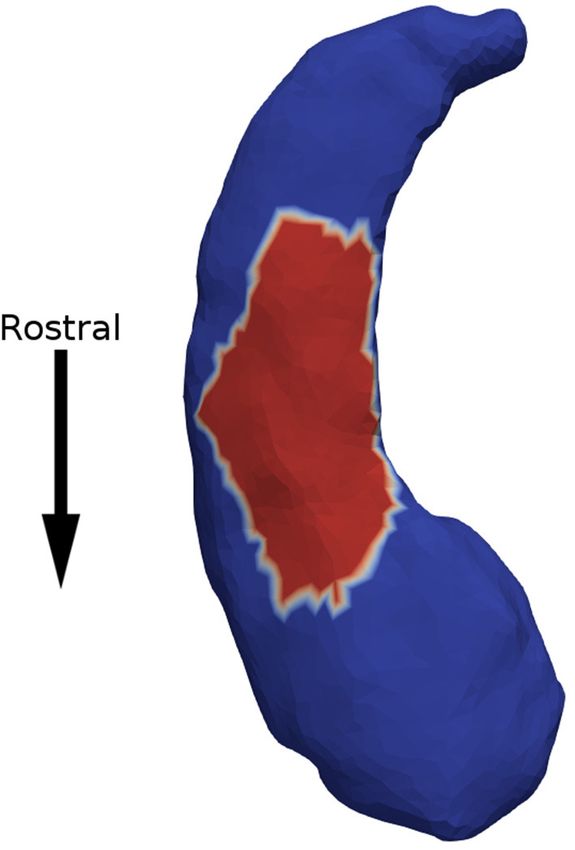
Athey et al.                                                                                     Amygdalar-Hippocampal Analysis of Lithium Response

1. INTRODUCTION                                                            participants (HC). LDDMM methods can quantify local
                                                                           morphological differences in brain structures and have been
Bipolar I disorder (BD) is characterized by a relapsing and                used previously to study patterns of atrophy in diseases such as
remitting course and is common, affecting an estimated 1% of               Alzheimer’s and Huntington’s (35, 36). Our goal was to identify
the population (1). Treatment of BD is complex, often involves             amygdalar and hippocampal shape correlates of lithium response
polypharmacy, and it can take months or even years to find                 in BD. This preliminary study could help identify brain features
an effective treatment for an individual patient (2). Lithium is           to be examined in future neuroimaging studies to identify
a common mood-stabilizing treatment that has been shown to                 predictors of lithium response in BD.
significantly reduce risk of depressive or manic relapse (3, 4).
However, only about 50% of patients with BD respond to lithium
(5). Identification of reliable predictors of treatment response
could greatly reduce illness burden and improve the lives of
                                                                           2. MATERIALS AND METHODS
patients with BD (6–8).                                                    2.1. Participants
    A limited number of predictors of lithium response in BD               Participants with BD were recruited at the Johns Hopkins site
have been identified, including clinical and genetic features (6–9).       of the Pharmacogenomics of Bipolar Disorder Study (PGBD),
Clinical predictors of positive response include an illness pattern        an eleven site prospective trial of lithium monotherapy in
of manic episodes before depressive episodes and later age of              adult patients with BD (37). Diagnostic and Statistical Manual
onset of the disorder. However, no single clinical feature has             of Mental Disorders (DSM-IV) research diagnosis was made
been found to strongly predict lithium response (8). In terms              by a psychiatrist using the Diagnostic Interview for Genetic
of genetics, Genome Wide Association Studies (GWAS) have                   Studies (DIGS) (38). Participants with BD were included if
now identified genetic variation associated with lithium response,         they (i) met DSM-IV criteria for bipolar I disorder, (ii) were
including single nucleotide polymorphisms (SNPs) located in a              currently euthymic with Beck Depression Inventory (BDI)
Athey et al. Amygdalar-Hippocampal Analysis of Lithium Response
response” considering up to 24 months of follow-up during the 3. The atlas subjects were segmented for left and right
maintenance phase. hippocampus, and left and right amygdala according to the
Participants with BD were consented and enrolled into Mai atlas (48).
the MRI study after beginning the PGBD study. Of the 25 The amygdalae were segmented primarily in the coronal
participants (17 female, 8 male) who consented to participate in plane, similar to (49). In anterior slices of the amygdalae, white
the MRI study, two were later excluded due a change in mood matter defined the ventrolateral and ventromedial borders.
disorder diagnosis, one due to treatment non-compliance, and The dorsomedial border was defined by the semilunar gyrus.
one was unable to complete the MRI scan. Participants were The lateral border was defined by the striations between
scheduled for MRI scanning after a clinical determination of the amygdala and claustrum. In more posterior slices, the
acute response was made. A total of 7 participants were lost to lateral ventricle composed the ventrolateral border and the
follow-up prior to the MRI scan. Thus, a clinical determination hippocampus/alveus composed the ventromedial border. The
of lithium response and a completed MRI scan were available region of white matter that includes the optic tract composed
for 14 participants with BD (9 acute responders, 5 acute non- the dorsal border of the amygdala.
responders). Two acute responders were determined to be long- The hippocampi were segmented primarily in the coronal
term non-responders. Twenty-one HC were enrolled into the and sagittal planes, similar to (50). In the sagittal plane,
study and scanned. the lateral most slice was identified as where gray matter
appeared in the temporal horn of the lateral ventricle. In the
lateral slices, white matter defined the ventral border, and
2.2. Clinical Assessment cerebrospinal fluid (CSF) defined the anterior and posterior
On the day of the MRI scan, all participants completed the borders. The dorsal border of the hippocampus was defined by
Hopkins Adult Reading Test (42) as an indicator of Full Scale two white matter structures, the alveus and fimbria. The alveus
IQ, as well as the BDI and CARS-M to assess current dessive sits above the anterior portion of the hippocampus and was
and manic symptoms, respectively. Possible dementia and mild included in the segmentation. The fimbria is posterior to the
cognitive impairment were assessed using the Mini Mental Status alveus and was not included in the segmentation. In the medial
Exam (43) and Montreal Cognitive Assessment (44). slices, the curvature of the hippocampus causes it to appear
As some participants with BD had initiated treatment in two sections, one anterior to the other. In both sections,
with lithium prior to entering the study, duration of lithium white matter defined the ventral border. Also, a combination
monotherapy at the time of the scan ranged from 2 months of white matter and CSF from the lateral ventricle defined the
to 12 years. The mean dose of lithium in the participants was dorsal border. In the anterior section, the medial most slice
1, 000 ± 300 MG. At the time of the MRI, four participants who was where the alveus converged with the white matter inferior
had exited the PGBD study had recently added an antipsychotic to the hippocampus. In the posterior section, the medial-most
or antidepressant medication. slice is where the splenium of the corpus callosum appears.
These guidelines include CA1, CA2, and CA3 regions of the
hippocampus but exclude the subiculum.
2.3. Image Acquisition and Segmentation
4. The 5 atlas subjects were downsampled to 1 × 1 × 1 mm3
T1-weighted MP-RAGE brain scans (TR = 4.3 ms, TE = 1.92
voxel size and then passed to MRICloud for single-atlas
ms, axial orientation, matrix = 225 × 288 × 288, resolution
segmentation of coarse regions (“7 Label” Segmentation)
= 0.8 × 0.764 × 0.764 mm) were acquired on a Phillips 7.0-
such as gray matter, white matter, ventricles, CSF, skull,
Tesla scanner (32 channel head coil) at Kennedy Krieger Institute
and background (51). The MRICloud atlas used was
(Baltimore, MD).
Adult22_50yrs_283Labels_26atlases_M2_V9B.
Binary segmentations in the population were obtained using
5. The automatic labels from Step 4 were upsampled to the
the multi-atlas random orbit model (45). First, multi-atlases
original resolution then combined with the manual labels of
of segmented hippocampi, amygdalae and coarse regions were
hippocampi and amygdalae from Step 3.
created from a subset of the population and then used to
6. Using the labeled atlas images from step 5, the LDDMM
generate segmentations in the entire population. The initial
algorithm from MRICloud was used to perform automatic
segmentation and editing were manually performed using Seg3D
multi-atlas segmentation in the remaining 30 subjects to
(46), summarized here.
segment the hippocampi and amygdalae (45, 52, 53). Atlas
1. A contributor who was unblinded to the subjects’ clinical information was based on segmentations of the atlas subjects
features selected 5 subjects who were representative of the from steps 3 and 4.
larger cohort with respect to sex, age, education, and diagnosis. 7. The 30 amygdala and hippocampus segmentations from Step
These subjects are henceforth referred to as the atlas subjects. 6 were reviewed and manually revised when necessary.
All following steps were performed by a contributor who was
blinded to the subjects’ clinical features.
2. Skull strip masks were constructed manually for the atlas 2.4. Shape Analysis via Surface-Based
subjects. This segmentation followed the dura mater around Morphometry
the cerebrum and cerebellum. The inferior most slice was Earlier works have described this method in more detail (35, 36,
inferior border of the cerebellum (47). 54). Briefly,
Frontiers in Psychiatry | www.frontiersin.org 3 February 2021 | Volume 12 | Article 614010Athey et al. Amygdalar-Hippocampal Analysis of Lithium Response
general linear models to test for associations between groups
(e.g., responder vs. non-responder) and brain shape. The
method has been described in detail elsewhere (36). The
same method was applied to each of the four structures
being investigated, left and right amygdalae, and left and
right hippocampi. After surface mapping described above, each
participant had an expansion factor for each surface patch
in the triangulated surfaces. The expansion factors associated
with a brain structure were concatenated into a vector indexed
by participant i: yi (e.g., 4 dimensional vector for the left
amygdala). These vectors describe how the brain structure
of each participant differs from the template, or “average,”
brain structure.
To determine whether clinical response status had a
significant association with brain shape, we constructed a null
linear model and alternative linear model. The alternative model
included response status and the null model did not. Both models
FIGURE 1 | Amygdalar and hippocampal surface discretization from spectral included covariates for sex, age, and intracranial volume (ICV).
clustering. After clustering, left and right amygdala are divided into 4 patches The model coefficients β were fit to minimize the sum of squared
each and left and right hippocampus into 9 patches each. errors (across all subjects) between the predicted expansion
factors and the actual expansion factors.
1. Segmentations of the four structures (left/right amygdala and
hippocampus) were converted to triangulated surfaces with
Restricted Delaunay Triangulation (55). 1 ...1 1
2. The triangulated surfaces were passed to MRICloud to | | ... | x1,age
x2,age ... xn,age
create population surface templates for both amygdalae Y = y1 y2 ... yn , X = x1,sex
x2,sex ... xn,sex
and hippocampi (56). These templates serve as a common | | ... | x1,icv x2,icv ... xn,icv
coordinate system for each subcortical structure. x1,response x2,response ... xn,response
3. The surface templates from step 2, and the triangulated
| | | | |
surfaces from step 1 were passed to MRICloud to calculate Ynull = βintercept βage βsex βicv 0 X
deformations from each patient to the surface templates. | | | | |
The features on which this paper focuses are the surface
| | | | |
Jacobians of the deformation at each vertex of the surface. The
Yalt = βintercept βage βsex βicv βresponse X
surface Jacobian measures the local expansion/atrophy around
| | | | |
a particular vertex (56).
4. We downsampled the vertices into surface patches for
computational efficiency. The surface patches were
constructed with a spectral clustering method, which In words, Y(a, b) corresponded to the expansion factor of the
only relies on surface geometry (36). This method computes ath patch in participant b and X(c, d) corresponded to the cth
the first k eigenvectors of the Laplace-Beltrami operator covariate in participant d.
associated with the surface. Then, each vertex is transformed For each patch, the sum of squared errors across all subjects
into a k dimensional vector according to the corresponding was computed for both models and the test statistic considered
(Y(p,i)−Ynull (p,i))2 . If the error at
Pn
elements in the eigenvectors. Finally, we cluster the vertices for patch p was sp = Pi=1 2
n
using the k-means algorithm. We downsampled the structures i=1 (Y(p,i)−Yalt (p,i))
so the patches would have an average surface area of 150 a patch was significantly lower in the alternative model, then
mm2 (57). Figure 1 shows the 4 patches on the amygdalae, the test statistic was large. A large test statistic implied that
and the 9 patches on the hippocampi. The surface Jacobians the feature was informative at that patch, i.e., the feature was
of all vertices in a patch were averaged to obtain the local associated with expansion or atrophy at that location. We used
expansion/atrophy for that patch. permutation testing to control the familywise error rate to 5%
(58). A permutation test rearranged the features among the
subjects and at each rearrangement, the maximum test statistic
2.5. Statistical Analysis (across all surface patches) was used to form a permutation
Differences in demographic and clinical characteristics and distribution. Then, the test statistics from the original, true
volumes between the HC, responder, and non-responder groups feature arrangement, were compared to this permutation
were examined using chi-squared tests, one-way ANOVAs distribution. Any test statistic above the 95th percentile of the
and two-sample t-tests implemented in MATLAB. We used permutation distribution was considered significant.
Frontiers in Psychiatry | www.frontiersin.org 4 February 2021 | Volume 12 | Article 614010Athey et al. Amygdalar-Hippocampal Analysis of Lithium Response
TABLE 1 | Demographic and clinical characteristics and brain volumes, by group.
Healthy comparison (N = 21) Acute responder (N = 9) Acute non-responder (N = 5) p-value
Demographic characteristics
Age (yrs) 36.3 (13.0) 37.7 (15.2) 31.0 (9.8) 0.65
Sex (% female) 71% 78% 100% 0.39
Education (yrs) 15.4 (2.9) 15.0 (2.5) 17.2 (1.8) 0.32
Clinical characteristics
BDI 1.4 (1.9) 6.4 (6.5) 11.6 (7.3)Athey et al. Amygdalar-Hippocampal Analysis of Lithium Response
found a correlation between overall gray matter hypertrophy and
clinical response to lithium in BD, but this study did not examine
localized brain changes (26).
Most studies examining effects of lithium use on structural
MRI have examined brain volumes, cortical thickness or surface
area, reducing all morphological information to a single statistic
(17, 21, 22, 30, 62). These studies have identified larger volumes of
amygdalae and hippocampi in lithium-treated patients compared
to patients not treated with lithium, although not consistently.
In a large meta-analysis conducted by the ENIGMA consortium
of 1,710 subjects with BD and 2,594 HC, though smaller
hippocampi and amygdalae were observed in subjects with BD
than in HC subjects, an effect of lithium use on these volumes
was not found (17). Exploring more local effects in subcortical
structure may provide additional information and potentially
help further elucidate lithium’s neurobiological action. A few
studies have examined such structure at a more detailed level,
testing volumes of hippocampal subfields, hippocampal thickness
and subcortical shape (23, 31–34). These studies reported more
localized differences in hippocampus including in CA1, CA2/3
and subiculum, although not consistently. However, these studies
assessed structural changes related to lithium use and did
not take into account differences in individual responses to
lithium treatment.
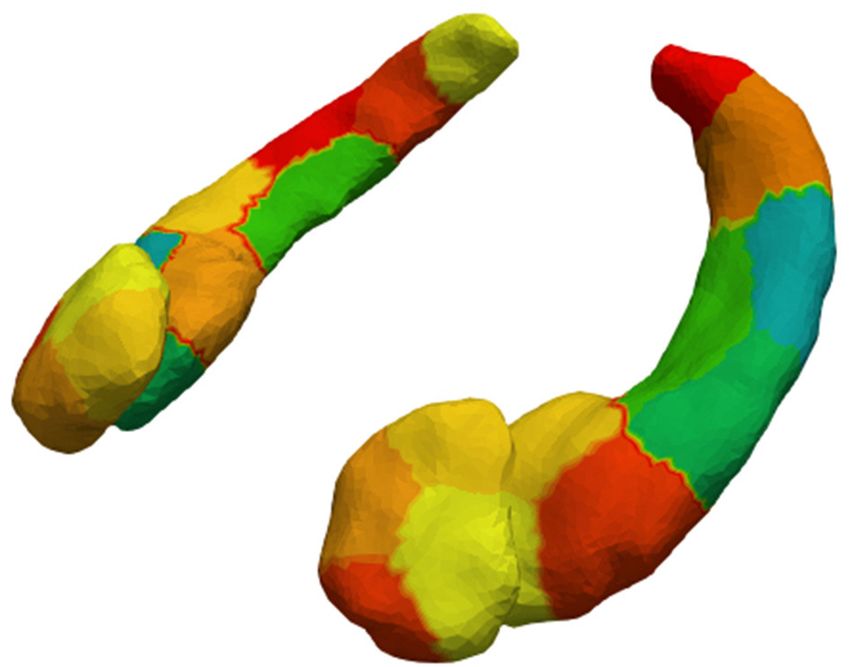
FIGURE 2 | Non-responders were found to have 15% atrophy in a surface
patch on the ventral side of the left hippocampus (in red), when compared
We combined an examination of local effects in subcortical
to responders. structure with a focus on individual differences in response to
lithium treatment and observed a significant difference in a
region of the ventral left hippocampus, near the CA1/subiculum
junction, which was relatively atrophied in non-responders as
disparate findings related to effects of lithium use on structure of compared to responders. CA1 is the primary output of the
amygdala and hippocampus in the literature (17, 21, 31, 59, 60). hippocampus and is integral in encoding memory related to space
In our sample, all participants with BD were treated with lithium (63), novel objects (64), and fear (65). While there is limited
monotherapy and were prospectively assessed for their response. literature on morphological differences between patients with
Our surface mapping tools allowed for analysis of more localized BD taking and not taking lithium, our results are consistent
shape changes that might not be detected by less detailed metrics with one previous study that identified smaller left CA1 and
like volume. CA2/3 volumes in patients with BD not using lithium treatment
While identification of neuroimaging markers holds potential than in a group using lithium, but only among participants
to predict treatment response, only a few previous studies with numerous affective episodes (33). Alterations in right
have used neuroimaging to examine response to lithium hippocampus have also been reported, including a deficit in
treatment in BD. Task-based brain activation changes have right CA1 in unmedicated patients with BD as compared to
been reported in lithium responders as compared to non- lithium treated patients and reduced volume of right CA2/3 and
responders using functional MRI. One study found greater CA4/DG in patients with psychotic BD not taking vs. taking
activation to an emotional faces task in prefrontal cortex and lithium (31, 32). Other studies have not detected a difference
lesser activation in limbic regions in lithium responders as between lithium treated vs. not-treated patients with BD when
compared to non-responders (25). Another study comparing examining measures of hippocampal shape (23, 34). We note that
patients with first episode mania responding vs. not responding these inconsistencies in the literature could be at least partially
to either lithium or quetiapine observed differential changes in explained by the focus on lithium treatment, not taking into
activation in subcortical regions in response to a continuous account individual differences in response.
performance task with emotional distractors (29). Studies Our observation of a morphological difference in left
using functional MRI methods have also identified correlations hippocampus in lithium non-responders as compared to
between lithium response and amygdala-ventromedial prefrontal responders builds upon previous work describing lithium’s
cortex functional connectivity and a normalizing effect of effects in the brain. Using 7 Li magnetic resonance imaging,
lithium on resting state connectivity measures (27, 28). Emerging euthymic patients with BD who were treated with lithium for
research suggests these normalizing changes could come 2 or more years were found to have the highest brain lithium
from neuroprotective effects of lithium against glutamatergic content within a defined cluster in the left hippocampus (66).
excitotoxicity or its association with higher levels of brain- Additional support for a laterality effect in lithium response
derived neurotrophic factor (61). One study using structural MRI comes from a longitudinal study showing a decrease in left
Frontiers in Psychiatry | www.frontiersin.org 6 February 2021 | Volume 12 | Article 614010Athey et al. Amygdalar-Hippocampal Analysis of Lithium Response
hippocampus volume over the course of treatment in patients neuroimaging studies are needed to establish whether there
with BD who were non-responders (67). Hippocampal laterality are any appreciable differences between responders and non-
effects have also been shown with respect to patients with responders and whether those differences can predict response
BD taking vs. not taking lithium, where left hippocampal prior to treatment initiation or at an early stage of treatment.
volume or subfield volume has been shown to be smaller in In this paper, we describe a possible approach to studying
those not taking lithium compared to those taking lithium lithium response via neuroanatomy and report on a specific sub-
or HC (33, 68, 69). Taken together, these findings suggest region of the hippocampus, CA1, which may be associated with
that left hippocampus may play a key role in lithium’s lithium response.
mood stabilizing effects, and coupled with existing evidence
of neurogenesis within the hippocampus lend support for DATA AVAILABILITY STATEMENT
the hypothesis of a neurogenic mechanism of action for
lithium (70). The datasets presented in this article are not readily available
Interpretation of this study is limited by the small sample because they require specialized training to interpret.
size. There are no males in our non-responder group, which Requests to access the datasets should be directed to
may impact on the generalizability of our findings. There mood@bwh.harvard.edu.
may exist potential confounding by clinical variables such as
duration of illness (71), duration of treatment (21), depressive ETHICS STATEMENT
predominant polarity (72), or stressful life events (73) and
these variables should be examined in a larger sample powered The studies involving human participants were reviewed and
to do so. It is also important to note that the images in approved by Johns Hopkins Institutional Review Board. The
this study were collected after treatment was initiated so patients/participants provided their written informed consent to
these results indicate correlations between brain shape and participate in this study.
response, not predictors of response. Although we utilized a
manual segmentation process, it was primarily performed by AUTHOR CONTRIBUTIONS
a single trained person blinded to clinical features and so
should not differ systematically between groups. Subregions in PBM, PPZ, JTR, JRD, JRK, and CMN contributed to the
this study were split along the surfaces and thus any changes study design and implementation. TLA, CC, DJT, KSK, and
occurring within the amygdalae or hippocampi would not PBM performed the data analysis. FSG, FM, KR-M, KG, and
have been detected. However, these methods could support PBM acquired participant data. All authors contributed to the
deeper subregion analysis in future studies by segmenting manuscript preparation.
images for each subregion, rather than for the whole amygdalae
and hippocampi. FUNDING
This study, to our knowledge, is the first in-vivo shape
analysis of human brain structures in BD using 7T MRI. This work was supported by grants from the National
Previous morphological studies in humans used MRI field Institutes of Health K01MH093870 (PBM), R01MH110797
strengths of 3T or less (17, 21–23). Higher field strengths (PBM), U01MH092758 (JRK), P41EB015909 (JTR), and
produce images with a higher signal to noise ratio (74) R01EB020062 (JTR).
and might detect more subtle differences in neuroanatomy.
MRICloud’s implementation of LDDMM allowed for both a fast ACKNOWLEDGMENTS
segmentation process and detection of localized shape changes in
brain structures. We are appreciative of the PGBD study as this work utilizes
In order to answer the important question of how to clinical information obtained at the Johns Hopkins site as part
predict lithium response in BD, larger and longitudinal of that study (PI: JRK; Site PI: PPZ).
REFERENCES 4. Geddes JR, Burgess S, Hawton K, Jamison K, Goodwin GM. Long-
term lithium therapy for bipolar disorder: systematic review and meta-
1. Merikangas KR, Akiskal HS, Angst J, Greenberg PE, Hirschfeld RMA, analysis of randomized controlled trials. Am J Psychiatry. (2004) 161:217–22.
Petukhova M, et al. Lifetime and 12-month prevalence of bipolar spectrum doi: 10.1176/appi.ajp.161.2.217
disorder in the National Comorbidity Survey replication. Arch Gen Psychiatry. 5. Yildiz A, Vieta E, Leucht S, Baldessarini RJ. Efficacy of antimanic treatments:
(2007) 64:543–52. doi: 10.1001/archpsyc.64.5.543 meta-analysis of randomized, controlled trials. Neuropsychopharmacology.
2. Kendall T, Morriss R, Mayo-Wilson E, Marcus E. Assessment and (2011) 36:375. doi: 10.1038/npp.2010.192
management of bipolar disorder: summary of updated NICE guidance. Brit 6. Rybakowski JK. Response to lithium in bipolar disorder: clinical and genetic
Med J. (2014) 349:g5673. doi: 10.1136/bmj.g5673 findings. ACS Chem Neurosci. (2014) 5:413–21. doi: 10.1021/cn5000277
3. Wyatt RJ, Henter ID, Jamison JC. Lithium revisited: savings brought 7. Tighe SK, Mahon PB, Potash JB. Predictors of lithium response
about by the use of lithium, 1970-1991. Psychiatr Q. (2001) 72:149–66. in bipolar disorder. Therapeut Adv Chronic Dis. (2011) 2:209–26.
doi: 10.1023/A:1010319610021 doi: 10.1177/2040622311399173
Frontiers in Psychiatry | www.frontiersin.org 7 February 2021 | Volume 12 | Article 614010Athey et al. Amygdalar-Hippocampal Analysis of Lithium Response
8. Kleindienst N, Engel RR, Greil W. Which clinical factors predict response 27. Altinay M, Karne H, Anand A. Lithium monotherapy associated clinical
to prophylactic lithium? A systematic review for bipolar disorders. Bipolar improvement effects on amygdala-ventromedial prefrontal cortex resting
Disord. (2005) 7:404–17. doi: 10.1111/j.1399-5618.2005.00244.x state connectivity in bipolar disorder. J Affect Disord. (2018) 225:4–12.
9. Etain B, Lajnef M, Brichant-Petitjean C, Geoffroy P, Henry C, Gard S, et al. doi: 10.1016/j.jad.2017.06.047
Childhood trauma and mixed episodes are associated with poor response 28. Spielberg JM, Matyi MA, Karne H, Anand A. Lithium monotherapy associated
to lithium in bipolar disorders. Acta Psychiatr Scand. (2017) 135:319–27. longitudinal effects on resting state brain networks in clinical treatment of
doi: 10.1111/acps.12684 bipolar disorder. Bipolar Disord. (2019) 21:361–71. doi: 10.1111/bdi.12718
10. Chen CH, Lee CS, Lee MTM, Ouyang WC, Chen CC, Chong MY, et al. Variant 29. Strakowski SM, Fleck DE, Welge J, Eliassen JC, Norris M, Durling M, et al.
GADL1 and response to lithium therapy in bipolar I disorder. N Engl J Med. fMRI brain activation changes following treatment of a first bipolar manic
(2014) 370:119–28. doi: 10.1056/NEJMoa1212444 episode. Bipolar Disord. (2016) 18:490–501. doi: 10.1111/bdi.12426
11. Hou L, Heilbronner U, Degenhardt F, Adli M, Akiyama K, Akula N, et al. 30. Hibar DP, Westlye LT, Doan NT, Jahanshad N, Cheung JW, Ching CRK, et al.
Genetic variants associated with response to lithium treatment in bipolar Cortical abnormalities in bipolar disorder: an MRI analysis of 6503 individuals
disorder: a genome-wide association study. Lancet. (2016) 387:1085–93. from the ENIGMA bipolar disorder working group. Mol Psychiatry. (2018)
doi: 10.1016/S0140-6736(16)00143-4 23:932–42. doi: 10.1038/mp.2017.73
12. Song J, Bergen SE, Di Florio A, Karlsson R, Charney A, Ruderfer DM, 31. Bearden CE, Thompson PM, Dutton RA, Frey BN, Peluso MA, Nicoletti
et al. Genome-wide association study identifies SESTD1 as a novel risk gene M, et al. Three-dimensional mapping of hippocampal anatomy in
for lithium-responsive bipolar disorder. Mol Psychiatry. (2016) 21:1290–7. unmedicated and lithium-treated patients with bipolar disorder.
doi: 10.1038/mp.2015.165 Neuropsychopharmacology. (2008) 33:1229–38. doi: 10.1038/sj.npp.1301507
13. Perlis RH, Smoller JW, Ferreira MAR, McQuillin A, Bass N, Lawrence J, 32. Giakoumatos CI, Nanda P, Mathew IT, Tandon N, Shah J, Bishop JR,
et al. A genomewide association study of response to lithium for prevention et al. Effects of lithium on cortical thickness and hippocampal subfield
of recurrence in bipolar disorder. Am J Psychiatry. (2009) 166:718–25. volumes in psychotic bipolar disorder. J Psychiatr Res. (2015) 61:180–7.
doi: 10.1176/appi.ajp.2009.08111633 doi: 10.1016/j.jpsychires.2014.12.008
14. Reinbold CS, Forstner AJ, Hecker J, Fullerton JM, Hoffmann P, Hou L, 33. Hartberg CB, JÃ8rgensen KN, Haukvik UN, Westlye LT, Melle I,
et al. Analysis of the influence of microRNAs in lithium response in bipolar Andreassen OA, et al. Lithium treatment and hippocampal subfields and
disorder. Front Psychiatry. (2018) 9:207. doi: 10.3389/fpsyt.2018.00207 amygdala volumes in bipolar disorder. Bipolar Disord. (2015) 17:496–506.
15. Arnone D, Cavanagh J, Gerber D, Lawrie SM, Ebmeier KP, McIntosh doi: 10.1111/bdi.12295
AM. Magnetic resonance imaging studies in bipolar disorder and 34. Vecchio D, Piras F, Piras F, Banaj N, Janiri D, Simonetti A, et al. Lithium
schizophrenia: meta-analysis. Brit J Psychiatry. (2009) 195:194–201. treatment impacts nucleus accumbens shape in bipolar disorder. Neuroimage
doi: 10.1192/bjp.bp.108.059717 Clin. (2020) 25:102167. doi: 10.1016/j.nicl.2020.102167
16. McDonald C, Zanelli J, Rabe-Hesketh S, Ellison-Wright I, Sham P, 35. Miller MI, Younes L, Ratnanather JT, Brown T, Trinh H, Lee DS,
Kalidindi S, et al. Meta-analysis of magnetic resonance imaging brain et al. Amygdalar atrophy in symptomatic Alzheimer’s disease based on
morphometry studies in bipolar disorder. Biol Psychiatry. (2004) 56:411–7. diffeomorphometry: the BIOCARD cohort. Neurobiol Aging. (2015) 36:S3–10.
doi: 10.1016/j.biopsych.2004.06.021 doi: 10.1016/j.neurobiolaging.2014.06.032
17. Hibar DP, Westlye LT, van Erp TGM, Rasmussen J, Leonardo CD, Faskowitz J, 36. Younes L, Ratnanather JT, Brown T, Aylward E, Nopoulos P, Johnson H, et al.
et al. Subcortical volumetric abnormalities in bipolar disorder. Mol Psychiatry. Regionally selective atrophy of subcortical structures in prodromal HD as
(2016) 21:1710–6. doi: 10.1038/mp.2015.227 revealed by statistical shape analysis. Hum Brain Mapp. (2014) 35:792–809.
18. Phillips M, Ladouceur C, Drevets W. Neural systems underlying voluntary doi: 10.1002/hbm.22214
and automatic emotion regulation: toward a neural model of bipolar disorder. 37. Oedegaard KJ, Alda M, Anand A, Andreassen OA, Balaraman Y, Berrettini
Mol Psychiatry. (2008) 13:829. doi: 10.1038/mp.2008.82 WH, et al. The Pharmacogenomics of Bipolar Disorder study (PGBD):
19. Phillips ML, Swartz HA. A critical appraisal of neuroimaging studies of bipolar identification of genes for lithium response in a prospective sample. BMC
disorder: toward a new conceptualization of underlying neural circuitry Psychiatry. (2016) 16:129. doi: 10.1186/s12888-016-0732-x
and a road map for future research. Am J Psychiatry. (2014) 171:829–43. 38. Nurnberger JI, Blehar MC, Kaufmann CA, York-Cooler C, Simpson SG,
doi: 10.1176/appi.ajp.2014.13081008 Harkavy-Friedman J, et al. Diagnostic interview for genetic studies: rationale,
20. Langan C, McDonald C. Neurobiological trait abnormalities in bipolar unique features, and training. Arch Gen Psychiatry. (1994) 51:849–59.
disorder. Mol Psychiatry. (2009) 14:833–46. doi: 10.1038/mp.2009.39 doi: 10.1001/archpsyc.1994.03950110009002
21. Sani G, Simonetti A, Janiri D, Banaj N, Ambrosi E, De Rossi 39. Beck AT, Ward CH, Mendelson M, Mock J, Erbaugh J. An inventory
P, et al. Association between duration of lithium exposure and for measuring depression. Arch Gen Psychiatry. (1961) 4:561–71.
hippocampus/amygdala volumes in type I bipolar disorder. J Affect Disord. doi: 10.1001/archpsyc.1961.01710120031004
(2018) 232:341–8. doi: 10.1016/j.jad.2018.02.042 40. Altman EG, Hedeker DR, Janicak PG, Peterson JL, Davis JM.
22. Savitz J, Nugent AC, Bogers W, Liu A, Sills R, Luckenbaugh DA, et al. The clinician-administered rating scale for mania (CARS-M):
Amygdala volume in depressed patients with bipolar disorder assessed using development, reliability, and validity. Biol Psychiatry. (1994) 36:124–34.
high resolution 3T MRI: the impact of medication. Neuroimage. (2010) doi: 10.1016/0006-3223(94)91193-2
49:2966–76. doi: 10.1016/j.neuroimage.2009.11.025 41. Sheehan DV, Lecrubier Y, Sheehan KH, Amorim P, Janavs J, Weiller E, et al.
23. van Erp TGM, Thompson PM, Kieseppä T, Bearden CE, Marino AC, Hoftman The Mini-International Neuropsychiatric Interview (MINI): the development
GD, et al. Hippocampal morphology in lithium and non-lithium-treated and validation of a structured diagnostic psychiatric interview for DSM-IV
bipolar I disorder patients, non-bipolar co-twins, and control twins. Hum and ICD-10. J Clin Psychiatry. (1998) 59:22–33. doi: 10.1037/t18597-000
Brain Mapp. (2012) 33:501–10. doi: 10.1002/hbm.21239 42. Schretlen DJ, Winicki JM, Meyer SM, Testa SM, Pearlson GD, Gordon
24. Anand A, Nakamura K, Spielberg JM, Cha J, Karne H, Hu B. Integrative B. Development, psychometric properties, and validity of the Hopkins
analysis of lithium treatment associated effects on brain structure and Adult Reading Test (HART). Clin Neuropsychol. (2009) 23:926–43.
peripheral gene expression reveals novel molecular insights into mechanism doi: 10.1080/13854040802603684
of action. Transl Psychiatry. (2020) 10:1–10. doi: 10.1038/s41398-020-0784-z 43. Folstein MF, Folstein SE, McHugh PR. “Mini-mental state”: a
25. Rootes-Murdy K, Glazer K, Mondimore FM, Goes FS, Zandi PP, Bakker A, practical method for grading the cognitive state of patients for the
et al. A pilot fMRI study of lithium response in bipolar disorder. Psychiatry clinician. J Psychiatr Res. (1975) 12:189–98. doi: 10.1016/0022-3956(75)
Res Neuroimaging. (2019) 286:1. doi: 10.1016/j.pscychresns.2019.02.003 90026-6
26. Lyoo IK, Dager SR, Kim JE, Yoon SJ, Friedman SD, Dunner DL, et al. 44. Nasreddine ZS, Phillips NA, Bédirian V, Charbonneau S, Whitehead V,
Lithium-induced gray matter volume increase as a neural correlate of Collin I, et al. The Montreal Cognitive Assessment, MoCA: a brief screening
treatment response in bipolar disorder: a longitudinal brain imaging study. tool for mild cognitive impairment. J Am Geriatr Soc. (2005) 53:695–9.
Neuropsychopharmacology. (2010) 35:1743–50. doi: 10.1038/npp.2010.41 doi: 10.1111/j.1532-5415.2005.53221.x
Frontiers in Psychiatry | www.frontiersin.org 8 February 2021 | Volume 12 | Article 614010Athey et al. Amygdalar-Hippocampal Analysis of Lithium Response
45. Tang X, Oishi K, Faria AV, Hillis AE, Albert MS, Mori S, et al. Bayesian 63. Hartley T, Lever C, Burgess N, O’Keefe J. Space in the brain:
parameter estimation and segmentation in the multi-atlas random orbit how the hippocampal formation supports spatial cognition. Philos
model. PLoS ONE. (2013) 8:e65591. doi: 10.1371/journal.pone.0065591 Trans R Soc B Biol Sci. (2014) 369:20120510. doi: 10.1098/rstb.20
46. CIBC. Seg3D: Volumetric Image Segmentation and Visualization. Scientific 12.0510
Computing and Imaging Institute (SCI) (2016). Available online at: http:// 64. Cohen SJ, Stackman RW Jr. Assessing rodent hippocampal involvement in the
www.seg3d.org novel object recognition task. A review. Behav Brain Res. (2015) 285:105–17.
47. Malone IB, Leung KK, Clegg S, Barnes J, Whitwell JL, Ashburner J, doi: 10.1016/j.bbr.2014.08.002
et al. Accurate automatic estimation of total intracranial volume: a 65. Izquierdo I, Furini CR, Myskiw JC. Fear memory. Physiol Rev. (2016)
nuisance variable with less nuisance. Neuroimage. (2015) 104:366–72. 96:695–750. doi: 10.1152/physrev.00018.2015
doi: 10.1016/j.neuroimage.2014.09.034 66. Stout J, Hozer F, Coste A, Mauconduit F, Djebrani-Oussedik N, Sarrazin S,
48. Mai JK, Majtanik M, Paxinos G. Atlas of the Human Brain. Academic et al. Accumulation of lithium in the hippocampus of patients with bipolar
Press (2015). disorder: a lithium-7 magnetic resonance imaging study at 7 Tesla. Biol
49. Entis JJ, Doerga P, Barrett LF, Dickerson BC. A reliable protocol for Psychiatry. (2020) 88:426–33. doi: 10.1016/j.biopsych.2020.02.1181
the manual segmentation of the human amygdala and its subregions 67. Selek S, Nicoletti M, Zunta-Soares GB, Hatch JP, Nery FG, Matsuo K, et al. A
using ultra-high resolution MRI. Neuroimage. (2012) 60:1226–35. longitudinal study of fronto-limbic brain structures in patients with bipolar
doi: 10.1016/j.neuroimage.2011.12.073 I disorder during lithium treatment. J Affect Disord. (2013) 150:629–33.
50. Berron D, Vieweg P, Hochkeppler A, Pluta JB, Ding SL, Maass A, doi: 10.1016/j.jad.2013.04.020
et al. A protocol for manual segmentation of medial temporal lobe 68. Hajek T, Cullis J, Novak T, Kopecek M, Höschl C, Blagdon R, et al.
subregions in 7 Tesla MRI. Neuroimage Clin. (2017) 15:466–82. Hippocampal volumes in bipolar disorders: opposing effects of illness
doi: 10.1016/j.nicl.2017.05.022 burden and lithium treatment. Bipolar Disord. (2012) 14:261–70.
51. Ye C, Ma T, Wu D, Ceritoglu C, Miller MI, Mori S. Atlas pre- doi: 10.1111/j.1399-5618.2012.01013.x
selection strategies to enhance the efficiency and accuracy of multi- 69. Zung S, Souza-Duran F, Soeiro-de Souza M, Uchida R, Bottino C, Busatto
atlas brain segmentation tools. PLoS ONE. (2018) 13:e0200294. G, et al. The influence of lithium on hippocampal volume in elderly bipolar
doi: 10.1371/journal.pone.0200294 patients: a study using voxel-based morphometry. Transl Psychiatry. (2016)
52. Mori S, Wu D, Ceritoglu C, Li Y, Kolasny A, Vaillant MA, et al. MRICloud: 6:e846. doi: 10.1038/tp.2016.97
delivering high-throughput MRI neuroinformatics as cloud-based software as 70. Toda T, Gage FH. Adult neurogenesis contributes to hippocampal
a service. Comput Sci Eng. (2016) 18:21–35. doi: 10.1109/MCSE.2016.93 plasticity. Cell Tissue Res. (2018) 373:693–709. doi: 10.1007/s00441-017-
53. Wang H, Pouch A, Takabe M, Jackson B, Gorman J, Gorman R, et al. Multi- 2735-4
atlas segmentation with robust label transfer and label fusion. In: International 71. Javadapour A, Malhi GS, Ivanovski B, Chen X, Wen W, Sachdev P.
Conference on Information Processing in Medical Imaging. Springer (2013) p. Hippocampal volumes in adults with bipolar disorder. J Neuropsychiatry Clin
548–59. doi: 10.1007/978-3-642-38868-2_46 Neurosci. (2010) 22:55–62. doi: 10.1176/jnp.2010.22.1.55
54. Mahon PB, Lee DS, Trinh H, Tward D, Miller MI, Younes 72. Janiri D, Simonetti A, Piras F, Ciullo V, Spalletta G, Sani G. Predominant
L, et al. Morphometry of the amygdala in schizophrenia and polarity and hippocampal subfield volumes in Bipolar disorders. Bipolar
psychotic bipolar disorder. Schizophrenia Res. (2015) 164:199–202. Disord. (2020) 22:490–7. doi: 10.1111/bdi.12857
doi: 10.1016/j.schres.2015.02.011 73. Janiri D, Sani G, De Rossi P, Piras F, Banaj N, Ciullo V, et al. Hippocampal
55. Chew LP. Constrained Delauney tirangulations. Algorithmica. (1989) subfield volumes and childhood trauma in bipolar disorders. J Affect Disord.
4:97–108. doi: 10.1007/BF01553881 (2019) 253:35–43. doi: 10.1016/j.jad.2019.04.071
56. Ma J, Miller MI, Younes L. A Bayesian generative model for surface template 74. Vaughan JT, Garwood M, Collins CM, Liu W, DelaBarre L, Adriany G, et al.
estimation. Int J Biomed Imaging. (2010) 2010:1–14. doi: 10.1155/2010/974957 7T vs. 4T: RF power, homogeneity, and signal-to-noise comparison in head
57. Faria AV, Ratnanather JT, Tward DJ, Lee DS, van den Noort F, Wu images. Magnet Reson Med. (2001) 46:24–30. doi: 10.1002/mrm.1156
D, et al. Linking white matter and deep gray matter alterations in
premanifest Huntington disease. Neuroimage Clin. (2016) 11:450–60. Conflict of Interest: JRD reports that he is Chairperson of the Board of Directors
doi: 10.1016/j.nicl.2016.02.014 of the National Network of Depression Centers and receives reimbursement for
58. Nichols T, Hayasaka S. Controlling the familywise error rate in functional official travel (amounting to less than $1500 annually). He has been an unpaid
neuroimaging: a comparative review. Stat Methods Med Res. (2003) 12:419–46. consultant for Myriad Neuroscience (formerly Assurex Health, Inc.) on behalf
doi: 10.1191/0962280203sm341ra of the NNDC for meetings in 2017 and 2019. The NNDC was compensated for
59. Lopez-Jaramillo C, Vargas C, Diaz-Zuluaga AM, Palacio JD, Castrillon G, his effort. JRD owns stock in CVS-Health (275 shares valued today at just over
Bearden C, et al. Increased hippocampal, thalamus and amygdala volume $20,000).
in long—term lithium—treated bipolar I disorder patients compared with
unmedicated patients and healthy subjects. Bipolar Disord. (2017) 19:41–9. The remaining authors declare that the research was conducted in the absence of
doi: 10.1111/bdi.12467 any commercial or financial relationships that could be construed as a potential
60. Hajek T, Kopecek M, Hoschl C, Alda M. Smaller hippocampal volumes in conflict of interest.
patients with bipolar disorder are masked by exposure to lithium: a meta-
analysis. J Psychiatry Neurosci. (2012) 37:333. doi: 10.1503/jpn.110143 Copyright © 2021 Athey, Ceritoglu, Tward, Kutten, DePaulo, Glazer, Goes, Kelsoe,
61. Machado-Vieira R. Lithium, stress, and resilience in bipolar disorder: Mondimore, Nievergelt, Rootes-Murdy, Zandi, Ratnanather and Mahon. This is an
deciphering this key homeostatic synaptic plasticity regulator. J Affect Disord. open-access article distributed under the terms of the Creative Commons Attribution
(2018) 233:92–9. doi: 10.1016/j.jad.2017.12.026 License (CC BY). The use, distribution or reproduction in other forums is permitted,
62. Blumberg HP, Kaufman J, Martin A, Whiteman R, Zhang JH, Gore provided the original author(s) and the copyright owner(s) are credited and that the
JC, et al. Amygdala and hippocampal volumes in adolescents and original publication in this journal is cited, in accordance with accepted academic
adults with bipolar disorder. Arch Gen Psychiatry. (2003) 60.12:1201–08. practice. No use, distribution or reproduction is permitted which does not comply
doi: 10.1001/archpsyc.60.12.1201 with these terms.
Frontiers in Psychiatry | www.frontiersin.org 9 February 2021 | Volume 12 | Article 614010You can also read