Response of global evaporation to major climate modes in historical and future Coupled Model Intercomparison Project Phase 5 simulations ...
←
→
Page content transcription
If your browser does not render page correctly, please read the page content below
Hydrol. Earth Syst. Sci., 24, 1131–1143, 2020
https://doi.org/10.5194/hess-24-1131-2020
© Author(s) 2020. This work is distributed under
the Creative Commons Attribution 4.0 License.

Response of global evaporation to major climate modes in
historical and future Coupled Model Intercomparison
Project Phase 5 simulations
Thanh Le1,2 and Deg-Hyo Bae1,2
1 Department   of Civil & Environmental Engineering, Sejong University, Seoul, South Korea
2 Climate   Change Adaptation for Water Resources, Sejong University, Seoul, South Korea

Correspondence: Deg-Hyo Bae (dhbae@sejong.ac.kr)

Received: 24 August 2019 – Discussion started: 28 August 2019
Revised: 8 February 2020 – Accepted: 10 February 2020 – Published: 11 March 2020

Abstract. Climate extremes, such as floods and droughts,         to obtain insight about the predictability of evaporation and
might have severe economic and societal impacts. Given the       hence, may improve the early-warning systems of climate ex-
high costs associated with these events, developing early-       tremes and water resource management.
warning systems is of high priority. Evaporation, which is
driven by around 50 % of solar energy absorbed at surface of
the Earth, is an important indicator of the global water bud-
get, monsoon precipitation, drought monitoring and the hy-       1   Introduction
drological cycle. Here we investigate the response of global
evaporation to main modes of interannual climate variabil-       The North Atlantic Oscillation (NAO; e.g., Hurrell et al.,
ity, including the Indian Ocean Dipole (IOD), the North At-      2003), the Indian Ocean Dipole (IOD; Saji et al., 1999;
lantic Oscillation (NAO) and the El Niño–Southern Oscilla-       Webster et al., 1999) and the El Niño–Southern Oscillation
tion (ENSO). These climate modes may have an influence           (ENSO; e.g., Bjerknes, 1969; Neelin et al., 1998) are ma-
on temperature, precipitation, soil moisture and wind speed      jor modes of global climate variability. These climate modes
and are likely to have impacts on global evaporation. We         may have an influence on important drivers of evaporation
utilized data of historical simulations and RCP8.5 (repre-       such as surface temperature (e.g., Arora et al., 2016; Leung
sentative concentration pathway) future simulations derived      and Zhou, 2016; Sun et al., 2016; Thirumalai et al., 2017;
from the Coupled Model Intercomparison Project Phase 5           Wang et al., 2017), precipitation (Dai and Wigley, 2000),
(CMIP5). Our results indicate that ENSO is an important          soil moisture (Nicolai-Shaw et al., 2016), humidity (Hegerl
driver of evaporation for many regions, especially the trop-     et al., 2015) and wind speed (Hurrell et al., 2003; Yeh et al.,
ical Pacific. The significant IOD influence on evaporation is    2018). Hence, these climate modes are likely to have impacts
limited in western tropical Indian Ocean, while NAO is more      on global evaporation and transpiration (hereafter simply re-
likely to have impacts on evaporation of the North Atlantic      ferred to as “evaporation”). Evaporation, which is driven by
European areas. There is high agreement between models in        around 50 % of the solar energy absorbed at the surface of the
simulating the effects of climate modes on evaporation of        Earth (Cavusoglu et al., 2017; Jung et al., 2010), is an impor-
these regions. Land evaporation is found to be less sensitive    tant variable contributing to the global water budget, mon-
to considered climate modes compared to oceanic evapora-         soon precipitation, drought monitoring and the hydrological
tion. The spatial influence of major climate modes on global     cycle (Friedrich et al., 2018; Kitoh, 2016; Lee et al., 2019;
evaporation is slightly more significant for NAO and the IOD     van Osnabrugge et al., 2019; Son and Bae, 2015). Addition-
and slightly less significant for ENSO in the 1906–2000 pe-      ally, changes in global evaporation are expected to feedback
riod compared to the 2006–2100 period. This study allows us      on global and regional climate. For example, land evapora-
                                                                 tion is shown to have an influences on carbon cycles (Cheng

Published by Copernicus Publications on behalf of the European Geosciences Union.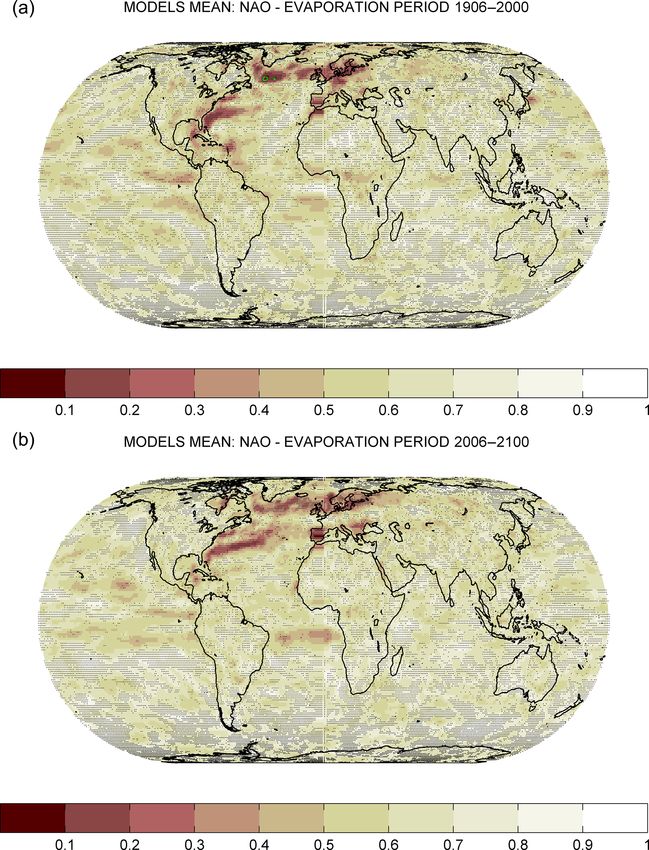
1132                                          T. Le and D.-H. Bae: Response of global evaporation to major climate modes

et al., 2017), cloud cover (Teuling et al., 2017) and air tem-    ration are compared between the historical period and the fu-
perature (Miralles et al., 2012).                                 ture period. Hence, in our analyses, we only use the data for
   While previous studies emphasize the importance of             the 1906–2000 historical period as a reference (with similar
ENSO (Martens et al., 2018; Miralles et al., 2013), the At-       data length) for the future period 2006–2100. We use dif-
lantic Multidecadal Oscillation, the Tropical Northern At-        ferent data variables, including monthly sea level pressure
lantic Dipole, Tropical Southern Atlantic Dipole and the IOD      (i.e., “psl” in CMIP5 datasets), sea surface temperature (i.e.,
(Martens et al., 2018) on global land evaporation, the role of    “ts”) and evaporation (i.e., “evspsbl”). For each model, we
the NAO remains elusive. In addition, the future influence        only utilize one simulation (i.e., “r1i1p1”). The models em-
of these climate modes on global evaporation under a warm-        ployed in this study are listed in Table S1 (Supplement). As
ing environment remain unclear. Climate change and rising         we use 15 different models for our analysis, the uncertainties
temperature might increase surface evaporation (Miralles et       related to the effects of climate modes on evaporation are
al., 2013) and thus, might reduce global water availability       reduced. The results based on multi-model mean are gener-
and cause change in the hydrological cycle (e.g., Naumann         ally better and more reliable than single model results (e.g.,
et al., 2018). Moreover, most previous works (e.g., Shinoda       Weigel et al., 2010). Terrestrial evaporation is the flux of wa-
and Han, 2005; Xing et al., 2016; Zveryaev and Hannachi,          ter at the surface into the atmosphere due to transformation
2011) mainly address the connection between individual cli-       of both solid and liquid phases to vapor (from vegetation
mate modes and evaporation; however, the role of other cli-       and underlying surface). Most of the climate models do not
mate modes might not be included in the analyses. As long-        provide separately the data of evaporation from canopy (i.e.,
term and reliable evaporation data are lacking (e.g., Hegerl      transpiration) and water evaporation from soil (i.e., evapora-
et al., 2015; Miralles et al., 2016), climate model simula-       tion), which complicates attributing changes in evaporation
tions provide additional opportunity to examine the impacts       to canopy or soil related processes.
of main climate modes on global evaporation. Besides, eval-          There might exist model biases in simulating ENSO (e.g.,
uating the models’ consistency in reproducing the impacts         Taschetto et al., 2014), the IOD (Chu et al., 2014; Weller and
of internal climate variability on evaporation is important for   Cai, 2013) and NAO (Gong et al., 2017; Lee et al., 2018), and
understanding the difference between models.                      there is uncertainty in the capability of land surface models in
   Here we investigate the causal impacts of major climate        modeling evaporation (Mueller and Seneviratne, 2014; Wang
modes (i.e., ENSO, IOD and NAO) on global terrestrial             and Dickinson, 2012). However, CMIP5 data are useful for a
and oceanic evaporation in Coupled Model Intercomparison          better understanding of past and future climate and provides
Project Phase 5 (CMIP5) model simulations for the 1906–           additional understanding about the connections between ma-
2000 and the 2006–2100 periods. For this investigation,           jor climate modes and global evaporation.
we use multivariate predictive models and tests of Granger
causality which consider the simultaneous impact of climate       2.2   Methods
modes on global evaporation (see Methods Sect. 2.2).
                                                                  The NAO index (Hurrell et al., 2003) is computed as
                                                                  the first empirical orthogonal function (EOF) of boreal-
                                                                  winter (December–January–February – DJF) sea level pres-
2     Data and methods
                                                                  sure (SLP) anomalies in the North Atlantic area (90◦ W–
2.1    Data                                                       40◦ E, 20–70◦ N). We compute the dipole mode index (DMI)
                                                                  (Saji et al., 1999) as the discrepancy of sea surface tem-
The data used in the present study were obtained from             perature (SST) anomalies between the western tropical In-
CMIP5 model simulations. We employ data of historical sim-        dian Ocean (50–70◦ E; 10◦ N–10◦ S) and the southeastern
ulations (experiment name “historical” in CMIP5) and fu-          tropical Indian Ocean (90-110◦ E; 0◦ N–10◦ S) in the boreal
ture simulations with a high-emission climate change sce-         fall (September–October–November – SON). We define the
nario (experiment name “rcp85” – representative concentra-        ENSO index as the average sea surface temperature anoma-
tion pathway 8.5) (Taylor et al., 2012). The RCP8.5 is a very-    lies in the Niño 3.4 region (120–170◦ W; 5◦ N–5◦ S) during
high-emission scenario with radiative forcing of 8.5 W m−2        boreal winter. We include ENSO, the IOD and NAO in our
in 2100 relative to the preindustrial level (van Vuuren et al.,   analyses as these indices are three major climate modes of the
2011). A warming environment in the RCP8.5 scenario in-           tropical Pacific, tropical Indian and North Atlantic oceans.
creases the frequency of extreme ENSO and IOD events (Cai         These climate modes are the main sources of global climate
et al., 2014, 2015) and potentially modulates the impacts         variability at interannual timescales (e.g., Abram et al., 2003;
of these climate modes on global evaporation. The starting        Hurrell et al., 2003; McPhaden et al., 2006).
year of historical simulations is roughly 1850, and the end-         We evaluate the causal effects of a climate mode (i.e.,
ing year is roughly 2005, while the starting year of future       NAO, DMI or ENSO) on evaporation by using the follow-
simulations is roughly 2006, and the ending year is roughly       ing predictive model (e.g., Mosedale et al., 2006):
2100. The results of the effects of climate modes on evapo-

Hydrol. Earth Syst. Sci., 24, 1131–1143, 2020                                   www.hydrol-earth-syst-sci.net/24/1131/2020/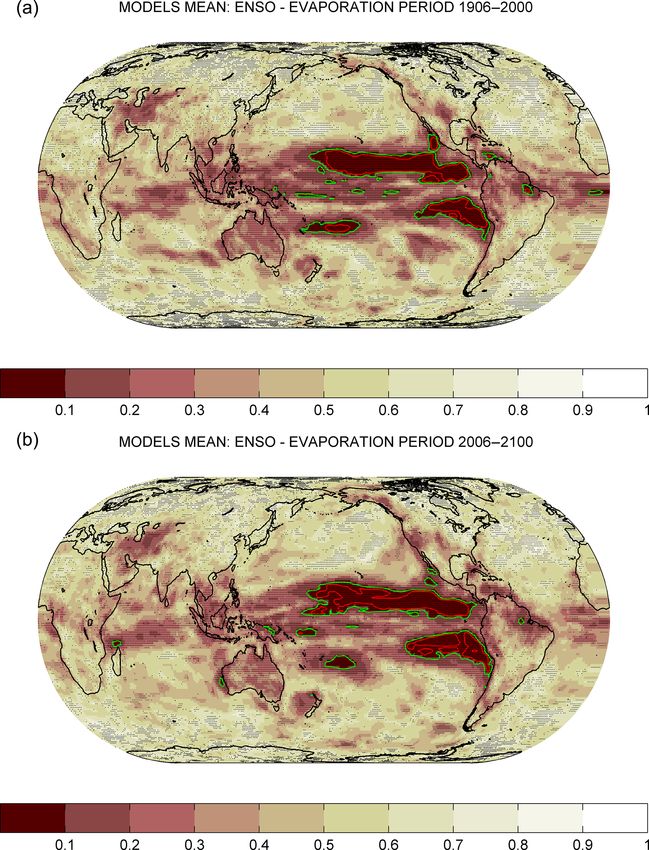
T. Le and D.-H. Bae: Response of global evaporation to major climate modes                                                                 1133

                                                                               relationship, provide a robust assessment about the causal in-
       p                 p                   p
                                                                               fluence of the considered climate mode on global evapora-
                                           m X
Xt =
       X
             αi Xt−i +
                         X
                               βi Yt−i +
                                           X
                                                      δj,i Zj,t−i + εt , (1)   tion. In addition, these approaches account for the concur-
       i=1               i=1               j =1 i=1
                                                                               rent influence of confounding variables and hence, provide
                                                                               more realistic evidence of the response of global evaporation
where Xt is the annual mean (or seasonal mean) evaporation                     to major climate modes.
for year t, Yt is the selected index (i.e., ENSO, NAO or DMI)                     Modes of climate variability might be correlated to each
for evaluating the causal effects on evaporation for year t,                   other, and this correlation might have effects on the relation-
Zj,t is the confounding variable j for year t, p ≥ 1 is the or-                ship between these modes and other variables (e.g., evapora-
der (or the number of lagged time series) of the causal model,                 tion) (Gonsamo et al., 2016; Martens et al., 2018). However,
and m is the total number of confounding variables. The op-                    in the approach of Granger causal analysis, the conclusion
timal order p is computed by minimizing the Bayesian infor-                    for the causal effects from variable Y (i.e., the considered cli-
mation criterion or Schwarz criterion (Schwarz, 1978). We                      mate mode) to variable X (i.e., evaporation) is independent
note that the optimal orders might be different for each grid                  from the relationship between Y and other factors (i.e., the
cell, depending on evaporation data of the selected grid cell.                 relationship between climate modes) (Mosedale et al., 2006;
The optimal orders are normally less than 8 in our analysis,                   Stern and Kaufmann, 2013).
suggesting that the impact of major climate modes on evap-                        We apply the methods described above to all the single
oration is evaluated at interannual timescales. Confounding                    models. We then rescale the results of a single model to
variables (e.g., if NAO is the selected index of possible causal               1◦ longitude × 1◦ latitude spatial resolution. We use the
influence on evaporation, the confounding variables are DMI                    rescaled results to compute the multi-model mean, which is
and ENSO) may have impacts on the links between the se-                        shown as a map of probability for no Granger causal impact
lected index and global evaporation. There are two forms of                    from the individual climate mode to global evaporation.
confounding variables in our analysis; hence, m is equal to                       We note that the temporal resolution of all analyses is
2 in Eq. (1). The regression coefficients αi , βi and δj,i and                 yearly (i.e., the index t in Eq. 1 denotes year). Although the
the noise residuals εt are computed by using multiple lin-                     definition of the predictand (i.e., Xt in Eq. 1) is either the an-
ear regression analysis and least-squares method. All climate                  nual mean or seasonal mean values, the analyses related to
indices and evaporation data are normalized (by using a z                      Granger causality are computed on annual basis. We report
score) and detrended (by subtracting the trending line from                    the analyses using the annual mean of evaporation (i.e., the
given data; the trending line or the best-fit line is identified               predictand Xt ) as the main results of this study (Figs. 1–7),
using least-squares method). Detrending the data (for stan-                    while the analyses using the seasonal mean of evaporation
dardizing) does not alter the results and conclusions.                         provide additional information (Figs. S3–S4, S6–S7 and S9–
   We apply the test for Granger causality for the predictive                  S10 in the Supplement).
model described in Eq. (1). Specifically, in order to assess the
causal influence from Y to X, we compute the probability of
the null hypothesis for an absence of Granger causality from                   3     Results and discussions
Y to X. The model shown in Eq. (1) is defined as a com-
plete predictive model where all variables (i.e., past data of                 3.1    ENSO influence on evaporation
evaporation and climate indices) are used to estimate evap-
oration. The null model of no causal effects from a given                      The probability maps of no Granger causality between ENSO
climate mode (i.e., variable Y ) to evaporation is defined by                  and global evaporation for the periods 1906–2000 and 2006–
removing the terms related to Y (i.e., by setting βi = 0, with                 2100 are shown in Fig. 1. In both periods, ENSO is more
i = 1, . . ., p) in Eq. (1). The complete model and the null                   likely to have an influence on numerous regions (highlighted
model are then compared by using the following indicator:                      in brown shades) of both hemispheres, including middle
                                                                              Asia (regions close to the Caspian Sea; details are shown
LY →X = n log p,βi =0 − log p ,                                              in Fig. S1a in the Supplement), the Indian Ocean, south-
                                                                               eastern Asia, Australia (Fig. S1b), the tropical Pacific and
where |p | is the determinant of the covariance matrix of                     northeastern South America (i.e., Amazonia, Fig. S1c), and
the noise residual and n is the length of the data time series.                the Pacific coast of America (Fig. S1d). There is high agree-
We test the significance of the complete model by compar-                      ment between models (indicated by stippling in Fig. 1) in
ing the LY →X indicator against a χp2 null distribution. This                  simulating ENSO–evaporation connection of these regions.
test results in a probability for no causal effect of the consid-              ENSO might indirectly influence global evaporation by mod-
ered variable Y on evaporation. Additional information on                      ulating regional climate factors associated with evaporation
the test of Granger causality is explained in earlier works                    processes. For example, ENSO significantly influences near-
(e.g., Le, 2015; Le et al., 2016). The techniques employed                     surface wind, which is the main contributor to variations
in the present study, which are designed to detect the causal                  of evaporation (Xing et al., 2016). The ENSO impacts on

www.hydrol-earth-syst-sci.net/24/1131/2020/                                                  Hydrol. Earth Syst. Sci., 24, 1131–1143, 2020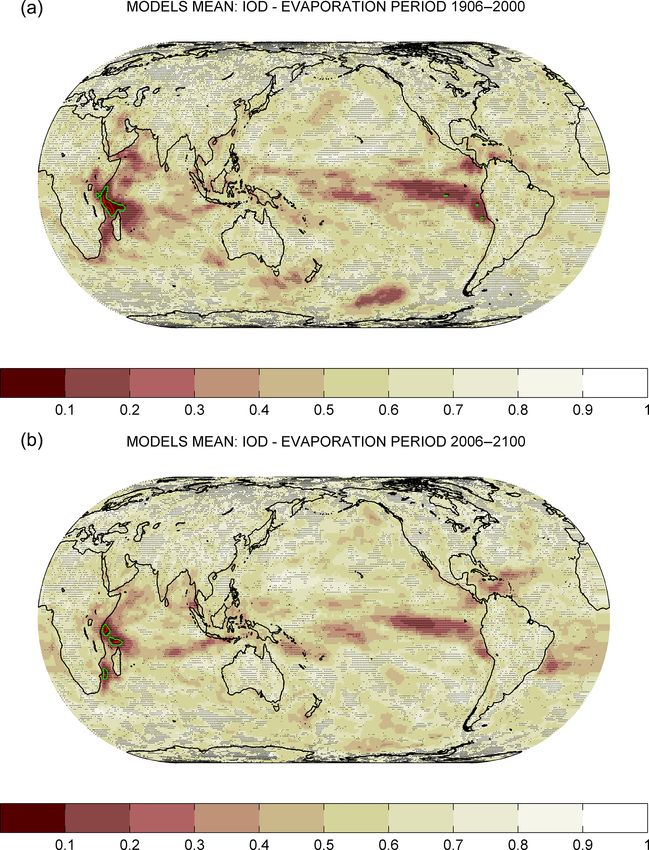
1134                                           T. Le and D.-H. Bae: Response of global evaporation to major climate modes

a large part of the tropical Pacific Ocean are robust at 5 %
and 10 % significance levels (here we reject the null hy-
pothesis of the absence of Granger causal effects between
ENSO and evaporation at 5 % and 10 % significance levels;
hence, we conclude that there is a significant causal impact;
we note that the 5 % and 10 % significance levels are com-
puted from the test for the absence of Granger causality).
Further analyses reveal that ENSO has significant impacts
on SST (Fig. S2a) and zonal winds (Fig. S2b) over the trop-
ical Pacific for the 1906–2000 period (similar patterns are
observed for the 2006–2100 period, not shown). Hence, the
influence of ENSO on evaporation might be associated with
the wind–evaporation–SST (WES) effect (Cai et al., 2019).
The WES effect occurs when warm (cold) water becomes
warmer (colder) due to a decrease (increase) in evaporation
and weakened (strengthened) surface winds. Besides, ENSO
is known to induce changes in global precipitation with a
decrease in rainfall in Africa, southeastern Asia, Indonesia,
Australia and Amazonia during the El Niño phase (Dai and
Wigley, 2000) and thus indirectly influences evaporation of
these regions. ENSO causal effects on global precipitation
are shown in Fig. S2c, which indicates the close connection
between precipitation and evaporation processes in several
regions (e.g., the tropical Pacific, Australia, Amazonia and
regions closed to the Caspian Sea).
   Additional analyses show a more robust influence from
ENSO on global evaporation in the boreal spring compared
to other seasons (Fig. S3 in the Supplement). The ENSO in-          Figure 1. Multi-model mean probability map for the absence of
fluence on boreal-winter evaporation is mainly found in the         Granger causality between ENSO and annual mean evaporation for
tropical Pacific, while land evaporation is less likely to be in-   the periods 1906–2000 (a) and 2006–2100 (b). Stippling demon-
fluenced by ENSO in winter (Fig. S3a). The limited response         strates that at least 70 % of models show agreement on the mean
of Northern Hemisphere boreal-winter evaporation to ENSO            probability of all models at a given grid point. An individual
might be related to a low energy supply (i.e., incoming so-         model’s agreement is determined when the difference between the
lar radiation), which leads to a reduction in land evaporation      multi-model mean probability and the selected model’s probabil-
(Martens et al., 2018). Although ENSO strength peaks in bo-         ity is less than 1 standard deviation of multi-model mean probabil-
real winter, the weak response of evaporation to ENSO dur-          ity. The green (red) contour line designates a p value of 0.1 (0.05).
                                                                    Brown shades indicate low probability for the absence of Granger
ing this specific time of the year suggests the important role
                                                                    causality. ENSO: El Niño–Southern Oscillation.
of other internal climate modes or external factors (i.e., so-
lar radiation). The boreal-winter evaporation in the Southern
Hemisphere might be controlled by local background con-
ditions (e.g., surface temperature) and other major climate         3.2   IOD influence on evaporation
modes (e.g., Southern Annular Mode – SAM). The response
of global evaporation to ENSO is found to be the most robust        Figure 2 describes the evaporation response to the IOD which
in boreal spring and gradually decreases in summer, fall and        is mainly found in the Indian Ocean and the tropical Pacific.
winter (Figs. S3 and S4). These results indicate the persistent     The IOD impacts are shown to be significant in the west-
and lagged influence of ENSO on regional evaporation (e.g.,         ern tropical Indian Ocean close to the eastern coast of Africa
Australia, northeastern South America and the tropical Pa-          (Fig. 2a and b; see Fig. S5a for additional details). The evap-
cific are influenced during boreal spring, summer and fall).        oration response in the western tropical Indian Ocean to the
The seasonal connection between ENSO and global evapo-              IOD may be associated with the impact of the IOD on short
ration in future simulations (Fig. S4) shows similar patterns       rains in eastern Africa (Behera et al., 2006; Black et al.,
compared to historical simulations (Fig. S3).                       2003). The IOD signature is also found in the areas close to
                                                                    the Horn of Africa (Fig. 2a). This result is in agreement with
                                                                    previous work (Martens et al., 2018) which proposed a pos-
                                                                    sible evaporation response of the Horn of Africa to positive
                                                                    phase of the IOD. The IOD shows remote control of evapo-

Hydrol. Earth Syst. Sci., 24, 1131–1143, 2020                                      www.hydrol-earth-syst-sci.net/24/1131/2020/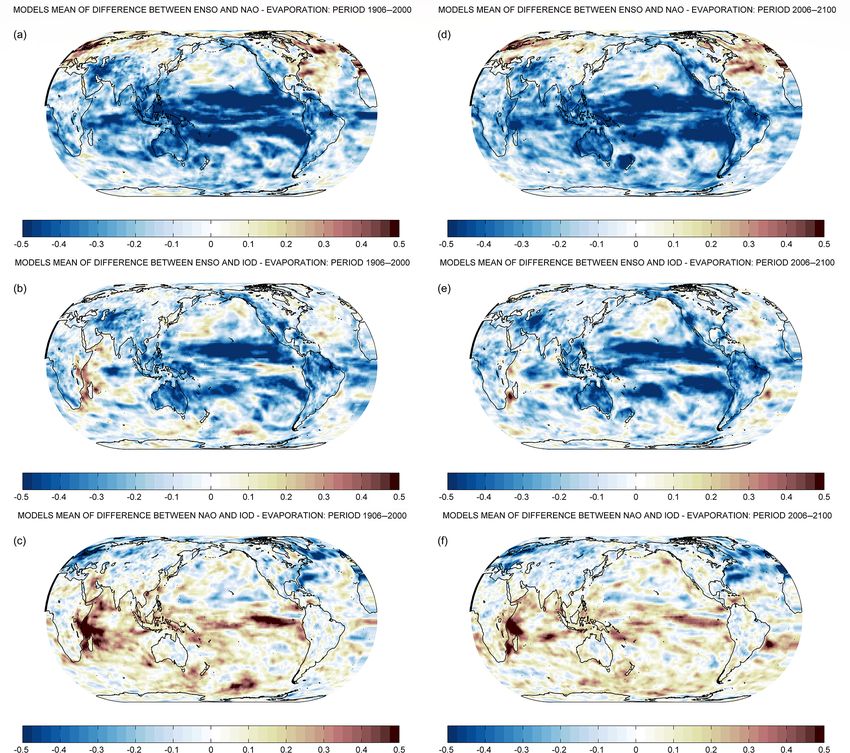
T. Le and D.-H. Bae: Response of global evaporation to major climate modes                                                  1135

                                                                   the IOD indicate similar patterns between different times of
                                                                   the year (Figs. S6 and S7). Specifically, in all four seasons,
                                                                   the IOD influence on evaporation is mainly shown in parts of
                                                                   the tropical Indian and Pacific oceans. Although there is still
                                                                   uncertainty, the IOD signal is found in evaporation change
                                                                   of Amazonia (i.e., northeastern South America; Figs. S6a
                                                                   and S7a) in boreal winter (December–February) for several
                                                                   model simulations. These results are in agreement with pre-
                                                                   vious study (Martens et al., 2018), which showed the sensi-
                                                                   tivity of evaporation in the rainforest to the IOD.

                                                                   3.3   NAO influence on evaporation

                                                                   The global evaporation response to NAO, which is limited in
                                                                   the Northern Hemisphere, is shown in Fig. 3. NAO mainly
                                                                   contributes to change in evaporation of the North Atlantic
                                                                   European sector where high agreement between models is
                                                                   found (see Fig. S8 for additional details). This conclusion
                                                                   shows consistency with earlier works and indicates the capa-
                                                                   bility of models in simulating the connection between NAO
                                                                   and regional evaporation. Particularly, the positive phase of
                                                                   NAO leads to changes in temperature; the transport of atmo-
                                                                   spheric moisture; and precipitation in northern, central and
                                                                   western Europe and parts of southern Europe and thus causes
                                                                   change in evaporation (Hurrell et al., 2003). Given signifi-
                                                                   cant economic losses from floods in Europe caused by NAO
                                                                   (Hurrell et al., 2003; Zanardo et al., 2019), the predictabil-
Figure 2. As in Fig. 1 but for Granger causality between the IOD   ity of regional evaporation using the NAO index might be
and annual mean evaporation. IOD: Indian Ocean Dipole.             potentially helpful to mitigate the flood impacts. There is un-
                                                                   certainty of NAO impacts on the southern North Atlantic and
                                                                   eastern Europe. In several models, the NAO impact is found
                                                                   in small areas of the eastern tropical Pacific and South At-
ration in parts of the tropical Pacific, especially the eastern    lantic (Fig. 3a). NAO might also influence evaporation in
regions (Fig. S5b). This teleconnection might be associated        parts of central North America and the coast of northeast-
with the IOD effects on ENSO and SST in the eastern parts          ern South America; however, these signatures are unclear
of the tropical Pacific (e.g., Izumo et al., 2010; Le and Bae,     (Fig. 3a). The sensitivity of evaporation in the western coast
2019). In historical simulations (Fig. 2a), the IOD impacts        of North America shown in Fig. 3a is somewhat in agreement
might reach as far as the Southern Ocean (region close to          with the findings of a previous study (Martens et al., 2018).
150 to 120◦ W; 45 to 60◦ S), where there is high agreement            The seasonal evaporation response to NAO is much
between models. This IOD–Southern Ocean teleconnection             weaker in boreal fall and winter compared to spring and sum-
might be indirect and is possibly related to other major cli-      mer (Figs. S9 and S10). In the Northern Hemisphere, this re-
mate mode of the Southern Hemisphere (e.g., SAM).                  sult might be due to a decrease in seasonal solar radiation
   Although the IOD is shown to contribute to droughts in          (Martens et al., 2018). The NAO impacts on northwestern
eastern Asia (Kripalani et al., 2009) and Australia (Ashok         Europe in boreal spring (Figs. S9b and S10b) suggests sev-
et al., 2003; Cai et al., 2009; Ummenhofer et al., 2009),          eral months lagged effect of NAO on evaporation of this re-
our analyses imply that the IOD impacts on evaporation of          gion. The global evaporation response to NAO is the most
these regions are unclear, particularly in the future period of    robust in boreal spring where NAO signature might exist in a
2006–2100 (Figs. 2b, S6 and S7). Additionally, there is un-        large area of the northern Eurasian continent and parts of the
certainty in the impact of the IOD on evaporation in other         Pacific Ocean (Fig. S9b).
regions, including the Middle East, southern Asia and south-
eastern Asia, where there is complex interactions between          3.4   Comparing the impacts of different climate modes
different climate modes (e.g., ENSO, the IOD and the In-
dian summer monsoon rainfall; Cai et al., 2011; Le and Bae,        Figure 4 shows the difference in multi-model mean probabil-
2019). Unlike seasonal responses of evaporation to ENSO            ity for the absence of Granger causality between a pair of cli-
(Figs. S3 and S4), the seasonal responses of evaporation to        mate modes and annual mean evaporation. Specifically, the

www.hydrol-earth-syst-sci.net/24/1131/2020/                                     Hydrol. Earth Syst. Sci., 24, 1131–1143, 2020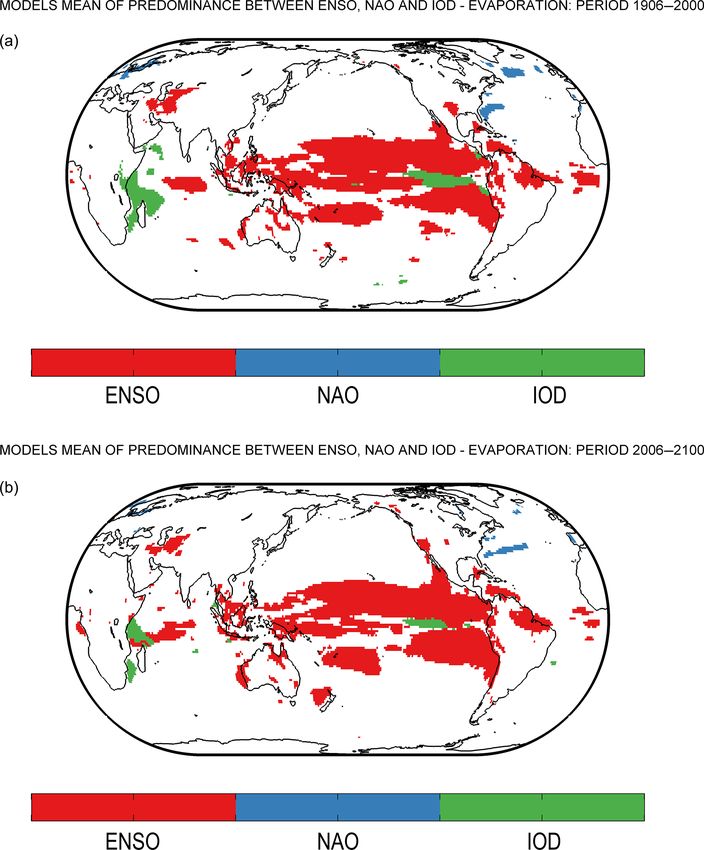
1136 T. Le and D.-H. Bae: Response of global evaporation to major climate modes
3.5 Discussions
The map of the ENSO–evaporation connection presented
here (Figs. 1, S1, S3 and S4) confirms the results obtained
previously (e.g., ENSO influence on evaporation of Australia
and Amazonia, where there is high consistency between
models as shown in Fig. 1). The results shown here (Figs. 1
and S2c) are partly in agreement with a previous study (Mi-
ralles et al., 2013), which showed lower evaporation during
El Niño events due to a decrease in precipitation in eastern
and central Australia and eastern South America. In addition,
the robust signature of ENSO on evaporation of tropical re-
gions is consistent with the findings of Miralles et al. (2013),
which showed negative (positive) anomalies of evaporation
for most of the tropics under El Niño (La Niña) conditions.
Besides, our results also show new features of the connection
between ENSO and global evaporation. Specifically, ENSO
is more likely to have an influence on the Pacific coasts of
both North and South America. The IOD is suggested to be
the main climate mode to have impacts on evaporation of
both hemispheres (Martens et al., 2018); however, our re-
sults indicate that ENSO influence also has similar character-
istics (Figs. 1, S1 and S3). In addition, there is uncertainty of
ENSO impacts on land evaporation, especially regarding the
regions of southern Asia, Africa and southern South Amer-
ica. The result of ENSO influence on eastern Australia shows
consistency with past findings (Martens et al., 2018; Miralles
Figure 3. As in Fig. 1 but for Granger causality between NAO and et al., 2013); however, we further indicate that there is also
annual mean evaporation. NAO: North Atlantic Oscillation. close connection between western Australia evaporation and
ENSO variations (Figs. 1, S1 and S3). In fact, evaporation
in the Australian continent was shown to have highest sen-
effects of ENSO on evaporation are more significant com- sitivity to ENSO conditions compared to other continents
pared to NAO in large parts of the tropical region (high- (Miralles et al., 2013). Additionally, our results suggest that
lighted in blue shades, which indicate a lower probability of ENSO is more likely to have impacts on evaporation of Aus-
no causal impacts), while NAO effects are more significant in tralia during both the historical period of 1906–2000 and fu-
the high-latitude region of the Northern Hemisphere (high- ture period 2006–2100. We note that in the present study,
lighted in red shades), especially regarding the North At- we use longer data periods (i.e., 1906–2000 and 2006–2100
lantic European sector (Fig. 4a and d). We observe a stronger model simulations) compared to recent works (e.g., 1982–
signature of ENSO compared to the IOD in the Middle East, 2012 in Martens et al., 2018; 1980–2011 in Miralles et al.,
the Pacific coast of North America and large parts of the trop- 2013). Hence, the length of the data period might affect the
ics, except for the western tropical Indian Ocean (Fig. 4b and statistical significance tests and the interpretation of results.
e). Figure 4e indicates the increase in ENSO spatial impact There are different factors that contribute to the ambiguity of
over the western Indian Ocean in the 21st century compared climate mode impacts on evaporation of several regions (e.g.,
to 20th century. Interestingly, the IOD effects are found to southern Asia, Africa and southern South America). Specifi-
be slightly stronger compared to ENSO in the North Pacific cally, these factors include the large discrepancies of current
and North Atlantic, suggesting the potential role of the IOD estimations of land evaporation for recent decades (Dong and
in these regions. The impacts of NAO are more significant Dai, 2017; Miralles et al., 2016), the limitations of climate
compared to the IOD in the North Atlantic European sector, models in simulating climate modes (Gong et al., 2017; Lee
while IOD impacts are stronger in the tropical Pacific and In- et al., 2018; Taschetto et al., 2014; Weller and Cai, 2013)
dian oceans and high-latitude region of the Southern Hemi- and the overestimation of simulated evaporation in most re-
sphere (Fig. 4c and f). Overall, ENSO is the dominant mode gions (Mueller and Seneviratne, 2014). Specifically, there are
of tropical evaporation, while NAO largely contributes to re- systematic biases in simulating yearly average evaporation in
gional evaporation in the high-latitude region of the Northern Australia, China, western North America, Europe, Africa and
Hemisphere. parts of Amazonia (Mueller and Seneviratne, 2014). Thus,
these biases contribute to the uncertainties in the effects of
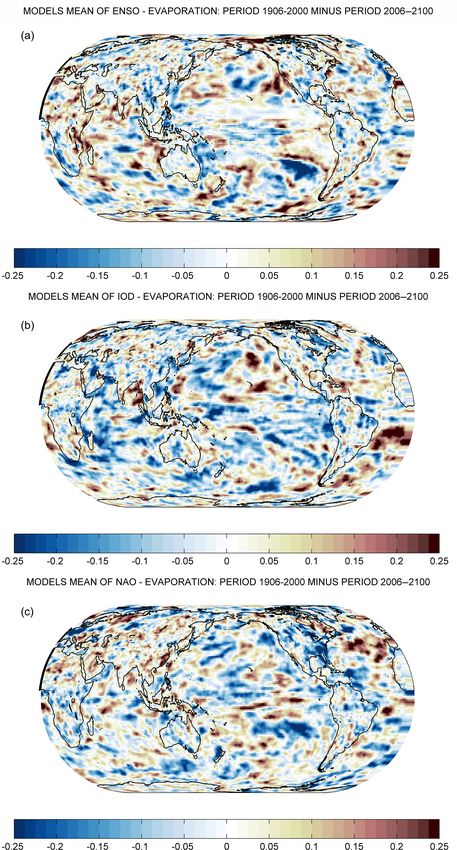
Hydrol. Earth Syst. Sci., 24, 1131–1143, 2020 www.hydrol-earth-syst-sci.net/24/1131/2020/T. Le and D.-H. Bae: Response of global evaporation to major climate modes 1137 Figure 4. Difference in multi-model mean probability for the absence of Granger causality between a pair of climate modes and annual mean evaporation. The results are shown for the periods 1906–2000 (a, b, c) and 2006–2100 (d, e, f). ENSO minus NAO (a, d). ENSO minus the IOD (b, e). NAO minus the IOD (c, f). Blue shades indicate a lower probability for the absence of Granger causality. ENSO: El Niño–Southern Oscillation. NAO: North Atlantic Oscillation. IOD: Indian Ocean Dipole. climate modes on evaporation. Nevertheless, the methods area is substantially smaller if p value < 0.05). Specifically, based on multi-model mean and Granger causality tests (see during the period 1906-2000, nearly 1.039 % of land area is Sect. 2.2) help to reduce the uncertainties and provide robust affected by ENSO at a 10 % significance level, while the af- results and conclusions. fected land areas by NAO and the IOD are 0 % and 0.017 %, Figure 5 shows the fraction area of Earth surface for land respectively (Fig. 5a). The area of oceanic evaporation influ- and ocean with a probability of the absence of Granger enced by ENSO, NAO and the IOD are 2.908 %, 0.01 % and causality between climate modes and evaporation less than 0.196 %, respectively (Fig. 5a). We observe an increase in 0.1 (i.e., p value < 0.1; here, the null hypothesis of no land area affected by ENSO to 1.38 % during the 2006–2100 Granger causality from climate modes to evaporation is re- period, while the affected land areas by NAO and the IOD are jected at a 10 % significance level; hence, we conclude that 0 % (Fig. 5b). The increase of ENSO effects on land evapo- there are significant causal effects; we note that the fraction ration might be associated with the increase in frequency of www.hydrol-earth-syst-sci.net/24/1131/2020/ Hydrol. Earth Syst. Sci., 24, 1131–1143, 2020
1138                                          T. Le and D.-H. Bae: Response of global evaporation to major climate modes

extreme ENSO events in the future period (Cai et al., 2015).
The area of oceanic evaporation influenced by ENSO, NAO
and the IOD are 2.944 %, 0.003 % and 0.122 %, respectively
(Fig. 5b). This result shows a minor decrease in NAO and
IOD effects on oceanic evaporation during the 2006–2100
period compared to the 1906–2000 period. Figure S11 shows
additional analyses for the fraction area of Earth surface for
land and ocean with a probability for the absence of Granger
causality between climate modes and evaporation less than
0.25 (i.e., climate modes are unlikely to have no causal ef-
fects on evaporation; Stocker et al., 2013). Figure S11 indi-
cates that the land and ocean area influenced by the IOD is
slightly higher compared to NAO. The influence of climate
modes on land evaporation shown in the present study is gen-
erally lower than the results reported in previous works (e.g.,
Martens et al., 2018). This difference is due to the use of dif-
ferent methods and different data periods.
   The considered climate modes (i.e., ENSO, NAO and the
IOD) are more likely to have an influences on global evap-
oration over oceans, while they have limited signature in
change of land evaporation for many regions (Figs. 1, 2, 3,
5 and S11). These results indicate the role of other factors
in modulating land evaporation. Particularly, the influence
of major climate modes on land evaporation might be off-
set by other factors like greenhouse gases, aerosols or solar
radiation (Dong and Dai, 2017; Hegerl et al., 2015; Liu et
al., 2011). Besides, climate modes may affect meteorological
variables that do not drive land evaporation dynamics. For in-
stance, NAO might affect precipitation (water availability) in
northern Europe during winter (Hurrell et al., 2003), but in
wintertime, land evaporation is mainly driven by solar radi-
ation in this region. Thus, NAO will apparently only have a
small (or no) impact on the dynamics of land evaporation in
that case. The impacts of climate modes on ocean evapora-
                                                                   Figure 5. Fraction of Earth surface for land and ocean with the
tion contribute to change in the global hydrological cycle as
                                                                   probability for the absence of Granger causality between climate
ocean evaporation might affect land water cycle by inducing
                                                                   modes and evaporation less than 0.1 (i.e., p value < 0.1). The re-
change in regional precipitation (Diawara et al., 2016). For       sults are shown for the influence of an individual climate mode on
example, the evaporation of the eastern North Pacific is the       annual mean evaporation for the periods 1906–2000 (a) and 2006–
main moisture supply for precipitation in California (Wei et       2100 (b). Fraction areas influenced by ENSO, NAO and the IOD
al., 2016).                                                        are shown in blue, red and yellow bars, respectively. Several frac-
   Changes in the spatial influences of major modes of cli-        tion areas are close to zero. ENSO: El Niño–Southern Oscillation.
mate variability on regional evaporation for the future period     NAO: North Atlantic Oscillation. IOD: Indian Ocean Dipole.
2006–2100 and the historical period 1906–2000 depend on
each climate mode (Figs. 1, 2 and 3). Analyses in details
of the difference between these two periods are shown in           lighted in blue shades, Fig. 6), the important drivers of evapo-
Fig. 6. Specifically, the fraction area of Earth surface show-     ration processes in the 21st century (e.g., precipitation, near-
ing a lower probability of ENSO effects for the 2006–2100          surface air temperature, wind speed and soil moisture) tend
period is approximately 52.9 % (Fig. 6a). This result indi-        to be not affected by the modes of climate variability in the
cates that ENSO slightly expands the impacted regions (high-       models. For example, the response of regional evaporation to
lighted in red shades, Fig. 6a) during the 2006–2100 period        climate warming depends on precipitation (Parr et al., 2016;
compared to the 1906–2000 period. Conversely, the fraction         Zhang et al., 2018), and a projected rise of surface tempera-
area of Earth surface for effects of NAO and the IOD during        ture is shown to mainly contribute to the increase in regional
the 2006–2100 period are decreased with 47.2 % and 45.7 %,         evaporation (Laîné et al., 2014). Because the volume of mois-
respectively (Fig. 6b and c). These results suggest that, for      ture carried by air increases with air temperature, the atmo-
several regions of declining impacts of climate modes (high-       spheric water vapor demand is expected to increase with ris-

Hydrol. Earth Syst. Sci., 24, 1131–1143, 2020                                    www.hydrol-earth-syst-sci.net/24/1131/2020/
T. Le and D.-H. Bae: Response of global evaporation to major climate modes 1139
ing air temperature and rising greenhouse gases concentra-
tion (Miralles et al., 2013). In addition, the declines in pan
evaporation in southern and western Australia are mainly
caused by decreases in wind speeds (Stephens et al., 2018).
The dominance of an individual climate mode on evapo-
ration is summarized in Fig. 7 for historical and future peri-
ods. Figure 7 shows the regions where the lowest probability
for the absence of Granger causality between climate modes
and evaporation is less than 0.25 (i.e., climate modes are un-
likely to have no causal effects on evaporation). This result
indicates the important role of ENSO on global evaporation
with dominant effects in the tropical Pacific and parts of mid-
dle Asia, southeastern Asia, Australia and northeastern South
America. The IOD has dominant effects in the western trop-
ical Indian Ocean and a small part of the eastern tropical Pa-
cific, while NAO is a dominant mode in the North Atlantic
and European regions. The shift from one dominant climate
mode to another indicates a shift in the dynamics related to
their respective climate modes, which could change the tim-
ing and magnitude of evaporation. There is a minor change
of the dominance of climate modes between historical and
future periods, with a slight reduction in the dominance of
the IOD in the future.
4 Conclusions
The CMIP5 historical and RCP8.5 future simulations provide
an opportunity to assess the influence of major climate modes
on global evaporation, which plays an important role in the
hydrological cycle, drought monitoring and water resource
management. This paper employed tests of Granger causality
and showed vigorous evaluation of possible impacts of NAO,
the IOD and ENSO on global evaporation.
The results show that ENSO is likely to have impacts on
evaporation of different regions in both hemispheres, includ-
ing the tropical Pacific and Indian oceans, southeastern Asia,
middle Asia (regions closed to the Caspian Sea), Australia,
northeastern South America (i.e., Amazonia) and the Pacific
coast of North and South America. The impacts of NAO are
mainly found in the North Atlantic and European regions,
while the notable influence of the IOD is limited in the west-
Figure 6. Difference of the probability for the absence of Granger
ern tropical Indian Ocean and part of the eastern tropical
causality of the individual climate mode on annual mean evapo-
Pacific. There is high agreement between models in simu- ration between the periods 1906–2000 and 2006–2100 (i.e., pe-
lating the effects of climate modes on evaporation of these riod 1906–2000 minus period 2006–2100). The results are shown
regions. Despite more extreme IOD events being expected for ENSO (a), the IOD (b) and NAO (c). Blue shades indicate a
in the future (Cai et al., 2013, 2014), the spatial influences lower probability of no Granger causality during the period 1906–
of the IOD on evaporation are slightly less significant in the 2000 compared to the period 2006–2100. Brown shades indicate a
2006–2100 period compared to the 1906–2000 period. These lower probability of no Granger causality during the period 2006–
results imply that the effects on evaporation of the extreme 2100 compared to the period 1906–2000. ENSO: El Niño–Southern
states of the IOD do not persist long enough to be signif- Oscillation. NAO: North Atlantic Oscillation. IOD: Indian Ocean
icant. Moreover, in the climate system, the effects of these Dipole.
extreme IOD events might be compensated by the extreme
events of other climate modes (e.g., ENSO). The weak im-
pacts of ENSO, NAO and the IOD on evaporation of sev-
www.hydrol-earth-syst-sci.net/24/1131/2020/ Hydrol. Earth Syst. Sci., 24, 1131–1143, 20201140 T. Le and D.-H. Bae: Response of global evaporation to major climate modes
prediction as evaporation is an important metric for quanti-
fying drought (McEvoy et al., 2016) and flood events.
Uncertainty regarding the impact of major climate modes
on evaporation of several regions (e.g., ENSO impacts on
evaporation of South Asia, South Africa, eastern North
America, southern South America; the IOD impacts on west-
ern Africa and South Asia; and the NAO impacts on the
North Atlantic and surrounding areas) suggests that addi-
tional works are necessary. Further investigation about the
effects of other internal climate modes (e.g., the Southern
Annular Mode, the Indian Ocean basin – IOB – mode and the
North Tropical Atlantic – NTA – mode) on evaporation might
improve our understanding of the response of the global hy-
drological cycle to internal climate variability. Little effort
has been made to quantify the influences of external climate
factors (i.e., volcanic eruptions, solar variations and changes
in the concentration of greenhouse gases) on global evapora-
tion; thus, these analyses might be a subject of forthcoming
studies.
Data availability. CMIP data can be downloaded from the ESGF
website at https://esgf-data.dkrz.de/search/cmip5-dkrz/ (ESGF,
2019) . The World Climate Research Programme’s Working Group
on Coupled Modeling is responsible for CMIP. The climate mod-
eling groups (listed in Table S1 of this paper) are responsible for
Figure 7. The predominance of a single climate mode on regional producing and making available their model output.
evaporation for periods 1906–2000 (a) and 2006–2100 (b). The pre-
dominance of a climate mode at a grid point is defined when the
lowest p value of all climate modes (see also Figs. 1, 2 and 3) at Supplement. The supplement related to this article is available on-
the given grid point is less than 0.25 (i.e., climate modes are un- line at: https://doi.org/10.5194/hess-24-1131-2020-supplement.
likely to have no causal effects on evaporation). The predominance
of ENSO, NAO and the IOD on evaporation are shown in red, blue
and green shades, respectively. ENSO: El Niño–Southern Oscilla-
Author contributions. TL designed the study, performed the data
tion. NAO: North Atlantic Oscillation. IOD: Indian Ocean Dipole.
analysis and wrote the paper. DHB supervised the project, con-
tributed to the interpretation of results and the writing of the paper.
eral regions suggest the importance of external forcings (e.g.,
greenhouse gases, radiative forcing and solar forcing) and Competing interests. The authors declare that they have no conflict
other climate modes on global evaporation variability. We of interest.
emphasize the strong connection between considered climate
modes (i.e., ENSO, the IOD and NAO) and oceanic evapora-
tion at interannual timescales. Land evaporation is shown to Acknowledgements. We thank Ryan Teuling, Brecht Martens and
have a weak connection with teleconnection indices in sev- Jasper Denissen for valuable comments and suggestions. We ac-
eral regions, suggesting the weak effects of climate modes knowledge the World Climate Research Programme’s Working
Group on Coupled Modeling, which is responsible for CMIP, and
on important drivers of land evaporation, such as local wind
we thank the climate modeling groups (listed in Table S1 of this
speed (Stephens et al., 2018), surface temperature (Laîné et
paper) for producing and making available their model output.
al., 2014; Miralles et al., 2013), moisture supply (Jung et al., For CMIP, the US Department of Energy’s Program for Climate
2010) and the amount of precipitation (Parr et al., 2016). Model Diagnosis and Intercomparison provided coordinating sup-
Our results may have suggestions for the predictability of port and led the development of software infrastructure in partner-
regional evaporation (e.g., Australia, the tropical Pacific, the ship with the Global Organization for Earth System Science Portals.
tropical Indian and North Atlantic oceans, the Pacific coast Thanh Le is supported by a research grant from Sejong University.
of North and South America, Amazonia, Europe, southeast- This work was supported by the Korea Environmental Industry and
ern Asia and middle Asia) by using past time series of major Technology Institute through the Advanced Water Management Re-
climate modes for a short term of several years. The results search Program, funded by the South Korean Ministry of Environ-
of this study might provide information for drought and flood ment (grant no. 83079).
Hydrol. Earth Syst. Sci., 24, 1131–1143, 2020 www.hydrol-earth-syst-sci.net/24/1131/2020/T. Le and D.-H. Bae: Response of global evaporation to major climate modes 1141
Financial support. This research has been supported by the Ko- G., Chikamoto, Y., Ng, B., McPhaden, M. J., Du, Y., Dom-
rea Environmental Industry and Technology Institute through Ad- menget, D., Jia, F., Kajtar, J. B., Keenlyside, N., Lin, X.,
vanced Water Management Research Program, funded by the South Luo, J.-J., Martín-Rey, M., Ruprich-Robert, Y., Wang, G.,
Korean Ministry of Environment (grant no. 83079). Xie, S.-P., Yang, Y., Kang, S. M., Choi, J.-Y., Gan, B.,
Kim, G.-I., Kim, C.-E., Kim, S., Kim, J.-H., and Chang,
P.: Pantropical climate interactions, Science, 363, eaav4236,
Review statement. This paper was edited by Ryan Teuling and re- https://doi.org/10.1126/SCIENCE.AAV4236, 2019.
viewed by Jasper Denissen and one anonymous referee. Cavusoglu, A. H., Chen, X., Gentine, P., and Sahin, O.: Potential for
natural evaporation as a reliable renewable energy resource, Nat.
Commun., 8, 617, https://doi.org/10.1038/s41467-017-00581-w,
2017.
References Cheng, L., Zhang, L., Wang, Y. P., Canadell, J. G., Chiew, F. H. S.,
Beringer, J., Li, L., Miralles, D. G., Piao, S., and Zhang, Y.: Re-
Abram, N. J., Gagan, M. K., McCulloch, M. T., Chappell, J., and cent increases in terrestrial carbon uptake at little cost to the wa-
Hantoro, W. S.: Coral reef death during the 1997 Indian Ocean ter cycle, Nat. Commun., 8, 110, https://doi.org/10.1038/s41467-
Dipole linked to Indonesian wildfires, Science, 301, 952–955, 017-00114-5, 2017.
https://doi.org/10.1126/science.1094047, 2003. Chu, J. E., Ha, K. J., Lee, J. Y., Wang, B., Kim, B. H., and
Arora, A., Rao, S. A., Chattopadhyay, R., Goswami, T., George, G., Chung, C. E.: Future change of the Indian Ocean basin-wide
and Sabeerali, C. T.: Role of Indian Ocean SST variability on and dipole modes in the CMIP5, Clim. Dynam., 43, 535–551,
the recent global warming hiatus, Global Planet. Change, 143, https://doi.org/10.1007/s00382-013-2002-7, 2014.
21–30, https://doi.org/10.1016/j.gloplacha.2016.05.009, 2016. Dai, A. and Wigley, T. M. L.: Global patterns of ENSO-induced
Ashok, K., Guan, Z., and Yamagata, T.: Influence of the Indian precipitation., Geophys. Res. Lett., 27, 1283–1286, 2000.
Ocean Dipole on the Australian winter rainfall, Geophys. Res. Diawara, A., Tachibana, Y., Oshima, K., Nishikawa, H., and Ando,
Lett., 30, 3–6, https://doi.org/10.1029/2003GL017926, 2003. Y.: Synchrony of trend shifts in Sahel boreal summer rainfall
Behera, S. K., Luo, J. J., Masson, S., Rao, S. A., Sakuma, and global oceanic evaporation, 1950–2012, Hydrol. Earth Syst.
H., and Yamagata, T.: A CGCM study on the interac- Sci., 20, 3789–3798, https://doi.org/10.5194/hess-20-3789-2016,
tion between IOD and ENSO, J. Climate, 19, 1688–1705, 2016.
https://doi.org/10.1175/JCLI3797.1, 2006. Dong, B. and Dai, A.: The uncertainties and causes of the re-
Bjerknes, J.: Atmospheric Teleconnections From cent changes in global evapotranspiration from 1982 to 2010,
the Equatorial Pacific, Mon. Weather Rev., Clim. Dynam., 49, 279–296, https://doi.org/10.1007/s00382-
97, 163–172, https://doi.org/10.1175/1520- 016-3342-x, 2017.
0493(1969)0972.3.CO;2, 1969. Earth System Grid Federation (ESGF): CMIP5 (Coupled Model In-
Black, E., Slingo, J. M., and Sperber, K. R.: An ob- tercomparison Project Phase 5), available at: https://esgf-data.
servational study of the relationship between excessively dkrz.de/search/cmip5-dkrz/, last access: 15 November 2019.
strong short rains in coastal East Africa and Indian Ocean Friedrich, K., Grossman, R. L., Huntington, J., Blanken, P. D.,
SST, Mon. Weather Rev., 74–94, https://doi.org/10.1175/1520- Lenters, J., Holman, K. D., Gochis, D., Livneh, B., Prairie, J.,
0493(2003)1312.0.CO;2, 2003. Skeie, E., Healey, N. C., Dahm, K., Pearson, C., Finnessey,
Cai, W., Cowan, T., and Sullivan, A.: Recent unprecedented skew- T., Hook, S. J., and Kowalski, T.: Reservoir Evaporation
ness towards positive Indian Ocean Dipole occurrences and its in the Western United States: Current Science, Challenges,
impact on Australian rainfall, Geophys. Res. Lett., 36, 1–4, and Future Needs, B. Am. Meteorol. Soc., 99, 167–187,
https://doi.org/10.1029/2009GL037604, 2009. https://doi.org/10.1175/BAMS-D-15-00224.1, 2018.
Cai, W., Sullivan, A., and Cowan, T.: Interactions of ENSO, the Gong, H., Wang, L., Chen, W., Chen, X., and Nath, D.: Bi-
IOD, and the SAM in CMIP3 models, J. Climate, 24, 1688–1704, ases of the wintertime Arctic Oscillation in CMIP5 models,
https://doi.org/10.1175/2010JCLI3744.1, 2011. Environ. Res. Lett., 12, 014001, https://doi.org/10.1088/1748-
Cai, W., Zheng, X.-T., Weller, E., Collins, M., Cowan, T., 9326/12/1/014001, 2017.
Lengaigne, M., Yu, W., and Yamagata, T.: Projected response of Gonsamo, A., Chen, J. M., and Lombardozzi, D.: Global veg-
the Indian Ocean Dipole to greenhouse warming, Nat. Geosci., etation productivity response to climatic oscillations dur-
6, 999–1007, https://doi.org/10.1038/ngeo2009, 2013. ing the satellite era, Glob. Change Biol., 22, 3414–3426,
Cai, W., Santoso, A., Wang, G., Weller, E., Wu, L., Ashok, K., Ma- https://doi.org/10.1111/gcb.13258, 2016.
sumoto, Y., and Yamagata, T.: Increased frequency of extreme Hegerl, G. C., Black, E., Allan, R. P., Ingram, W. J., Polson, D.,
Indian Ocean Dipole events due to greenhouse warming, Nature, Trenberth, K. E., Chadwick, R. S., Arkin, P. A., Sarojini, B. B.,
510, 254–258, https://doi.org/10.1038/nature13327, 2014. Becker, A., Dai, A., Durack, P. J., Easterling, D., Fowler, H. J.,
Cai, W., Wang, G., Santoso, A., McPhaden, M. J., Wu, L., Jin, Kendon, E. J., Huffman, G. J., Liu, C., Marsh, R., New, M., Os-
F.-F., Timmermann, A., Collins, M., Vecchi, G., Lengaigne, born, T. J., Skliris, N., Stott, P. A., Vidale, P.-L., Wijffels, S.
M., England, M. H., Dommenget, D., Takahashi, K., and Guil- E., Wilcox, L. J., Willett, K. M., and Zhang, X.: Challenges in
yardi, E.: Increased frequency of extreme La Niña events Quantifying Changes in the Global Water Cycle, B. Am. Mete-
under greenhouse warming, Nat. Clim. Chang., 5, 132–137, orol. Soc., 96, 1097–1115, https://doi.org/10.1175/BAMS-D-13-
https://doi.org/10.1038/nclimate2492, 2015. 00212.1, 2015.
Cai, W., Wu, L., Lengaigne, M., Li, T., McGregor, S., Kug, J.-
S., Yu, J.-Y., Stuecker, M. F., Santoso, A., Li, X., Ham, Y.-
www.hydrol-earth-syst-sci.net/24/1131/2020/ Hydrol. Earth Syst. Sci., 24, 1131–1143, 20201142 T. Le and D.-H. Bae: Response of global evaporation to major climate modes Hurrell, J. W., Kushnir, Y., Ottersen, G., and Visbeck, M.: An modes of climate variability, npj Clim. Atmos. Sci., 1, 43, overview of the North Atlantic Oscillation, in Geophysical https://doi.org/10.1038/s41612-018-0053-5, 2018. Monograph American Geophysical Union, American Geophysi- McEvoy, D. J., Huntington, J. L., Mejia, J. F., and Hobbins, M. cal Union, 1–35, 2003. T.: Improved seasonal drought forecasts using reference evap- Izumo, T., Vialard, J., Lengaigne, M., de Boyer Montegut, C., otranspiration anomalies, Geophys. Res. Lett., 43, 377–385, Behera, S. K., Luo, J.-J., Cravatte, S., Masson, S., and Yam- https://doi.org/10.1002/2015GL067009, 2016. agata, T.: Influence of the state of the Indian Ocean Dipole McPhaden, M. J., Zebiak, S. E., and Glantz, M. H.: ENSO as an on the following year’s El Niño, Nat. Geosci., 3, 168–172, integrating concept in earth science, Science, 314, 1740–1745, https://doi.org/10.1038/ngeo760, 2010. https://doi.org/10.1126/science.1132588, 2006. Jung, M., Reichstein, M., Ciais, P., Seneviratne, S. I., Sheffield, Miralles, D. G., Van Den Berg, M. J., Teuling, A. J., and De J., Goulden, M. L., Bonan, G., Cescatti, A., Chen, J., De Jeu, R. A. M.: Soil moisture-temperature coupling: A mul- Jeu, R., Dolman, A. J., Eugster, W., Gerten, D., Gianelle, tiscale observational analysis, Geophys. Res. Lett., 39, 2–7, D., Gobron, N., Heinke, J., Kimball, J., Law, B. E., Mon- https://doi.org/10.1029/2012GL053703, 2012. tagnani, L., Mu, Q., Mueller, B., Oleson, K., Papale, D., Miralles, D. G., van den Berg, M. J., Gash, J. H., Parinussa, Richardson, A. D., Roupsard, O., Running, S., Tomelleri, E., R. M., de Jeu, R. A. M., Beck, H. E., Holmes, T. R. H., Viovy, N., Weber, U., Williams, C., Wood, E., Zaehle, S., and Jiménez, C., Verhoest, N. E. C., Dorigo, W. A., Teuling, A. J., Zhang, K.: Recent decline in the global land evapotranspira- and Johannes Dolman, A.: El Niño–La Niña cycle and recent tion trend due to limited moisture supply, Nature, 467, 951–954, trends in continental evaporation, Nat. Clim. Chang., 4, 1–5, https://doi.org/10.1038/nature09396, 2010. https://doi.org/10.1038/nclimate2068, 2013. Kitoh, A.: The Asian Monsoon and its Future Change in Climate Miralles, D. G., Jiménez, C., Jung, M., Michel, D., Ershadi, A., Mc- Models: A Review, J. Meteorol. Soc. Jpn. Ser. II, 95, 7–33, Cabe, M. F., Hirschi, M., Martens, B., Dolman, A. J., Fisher, J. https://doi.org/10.2151/jmsj.2017-002, 2016. B., Mu, Q., Seneviratne, S. I., Wood, E. F., and Fernández-Prieto, Kripalani, R. H., Oh, J. H., and Chaudhari, H. S.: Delayed influence D.: The WACMOS-ET project – Part 2: Evaluation of global ter- of the Indian Ocean Dipole mode on the East Asia-West Pacific restrial evaporation data sets, Hydrol. Earth Syst. Sci., 20, 823– monsoon: possible mechanism, Int. J. Climatol., 30, 197–209, 842, https://doi.org/10.5194/hess-20-823-2016, 2016. https://doi.org/10.1002/joc.1890, 2009. Mosedale, T. J., Stephenson, D. B., Collins, M., and Mills, T. C.: Laîné, A., Nakamura, H., Nishii, K., and Miyasaka, T.: A Granger causality of coupled climate processes: Ocean feedback diagnostic study of future evaporation changes projected on the North Atlantic Oscillation, J. Climate, 19, 1182–1194, in CMIP5 climate models, Clim. Dynam., 42, 2745–2761, https://doi.org/10.1175/JCLI3653.1, 2006. https://doi.org/10.1007/s00382-014-2087-7, 2014. Mueller, B. and Seneviratne, S. I.: Systematic land climate Le, T.: Solar forcing of Earth’s surface temperature in PMIP3 sim- and evapotranspiration biases in CMIP5 simulations, Geophys. ulations of the last millennium, Atmos. Sci. Lett., 16, 285–290, Res. Lett., 41, 128–134, https://doi.org/10.1002/2013GL058055, https://doi.org/10.1002/asl2.555, 2015. 2014. Le, T. and Bae, D.-H.: Causal links on interannual Naumann, G., Alfieri, L., Wyser, K., Mentaschi, L., Betts, timescale between ENSO and the IOD in CMIP5 fu- R. A., Carrao, H., Spinoni, J., Vogt, J., and Feyen, L.: ture simulations, Geophys. Res. Lett., 46, 2820–2828, Global Changes in Drought Conditions Under Different https://doi.org/10.1029/2018GL081633, 2019. Levels of Warming, Geophys. Res. Lett., 45, 3285–3296, Le, T., Sjolte, J., and Muscheler, R.: The influence of ex- https://doi.org/10.1002/2017GL076521, 2018. ternal forcing on subdecadal variability of regional sur- Neelin, J. D., Battisti, D. S., Hirst, A. C., Jin, F.-F., Wakata, Y., face temperature in CMIP5 simulations of the last mil- Yamagata, T., and Zebiak, S. E.: ENSO theory, J. Geophys. Res., lennium, J. Geophys. Res.-Atmos., 121, 1671–1682, 103, 14261, https://doi.org/10.1029/97JC03424, 1998. https://doi.org/10.1002/2015JD024423, 2016. Nicolai-Shaw, N., Gudmundsson, L., Hirschi, M., and Lee, J., Sperber, K. R., Gleckler, P. J., Bonfils, C. J. W., and Taylor, Seneviratne, S. I.: Long-term predictability of soil mois- K. E.: Quantifying the agreement between observed and sim- ture dynamics at the global scale: Persistence versus ulated extratropical modes of interannual variability, Springer large-scale drivers, Geophys. Res. Lett., 43, 8554–8562, Berlin Heidelberg, Germany, 2018. https://doi.org/10.1002/2016GL069847, 2016. Lee, M. H., Im, E. S., and Bae, D. H.: A comparative assessment of Parr, D., Wang, G., and Fu, C.: Understanding evapotran- climate change impacts on drought over Korea based on multiple spiration trends and their driving mechanisms over the climate projections and multiple drought indices, Clim. Dynam., NLDAS domain based on numerical experiments us- 53, 389–404, https://doi.org/10.1007/s00382-018-4588-2, 2019. ing CLM4.5, J. Geophys. Res.-Atmos., 121, 7729–7745, Leung, M. Y. T. and Zhou, W.: Direct and indirect ENSO modula- https://doi.org/10.1002/2015JD024398, 2016. tion of winter temperature over the Asian-Pacific-American re- Saji, N. H., Vinayachandran, P. N., and Yamagata, T.: A dipole in gion, Sci. Rep., 6, 1–7, https://doi.org/10.1038/srep36356, 2016. the tropical Indian Ocean, Nature, 401, 360–363, 1999. Liu, X., Luo, Y., Zhang, D., Zhang, M., and Liu, C.: Recent changes Schwarz, G.: Estimating the dimension of a model, Ann. Statist., 6, in pan-evaporation dynamics in China, Geophys. Res. Lett., 38, 461–464, https://doi.org/10.1214/aos/1176344136, 1978. 10–13, https://doi.org/10.1029/2011GL047929, 2011. Shinoda, T. and Han, W.: Influence of the Indian Ocean dipole on Martens, B., Waegeman, W., Dorigo, W. A., Verhoest, N. E. atmospheric subseasonal variability, J. Climate, 18, 3891–3909, C., and Miralles, D. G.: Terrestrial evaporation response to https://doi.org/10.1175/JCLI3510.1, 2005. Hydrol. Earth Syst. Sci., 24, 1131–1143, 2020 www.hydrol-earth-syst-sci.net/24/1131/2020/
You can also read