Results 2018 - CCPI Embargo until Wednesday, 15th of November 2017 10.00 am (CET) - Legambiente
←
→
Page content transcription
If your browser does not render page correctly, please read the page content below
Climate Change
           CCPI                       Performance
                                      Index

Embargo until
Wednesday, 15th of November 2017
10.00 am (CET)

      Results 2018
        Jan Burck, Franziska Marten, Christoph Bals, Niklas Höhne

                                                                    Foto: Fotolia, Nightman 1965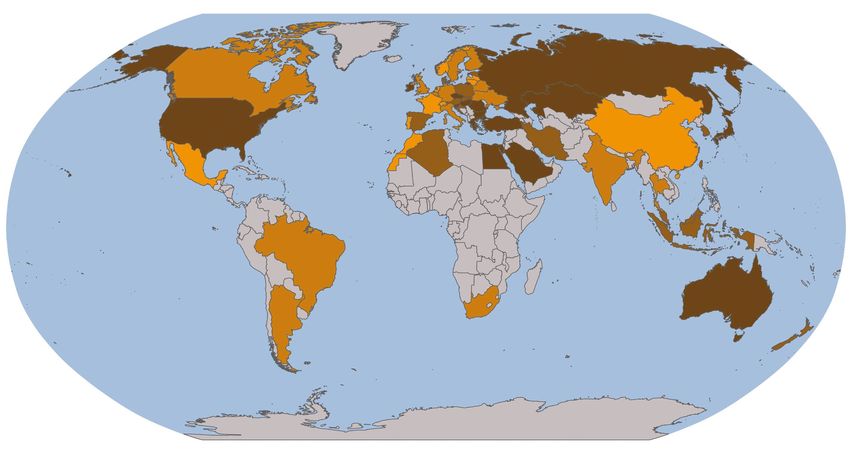
CCPI • Results 2018 Germanwatch, NewClimate Institute & Climate Action Network CCPI • Results 2018 Germanwatch, NewClimate Institute & Climate Action Network
Imprint Foreword
Germanwatch – Bonn Office Dear Reader,
Kaiserstraße 201
D-53113 Bonn, Germany
Recognizing the urgency to take immediate action in protect- house gas emissions of the 56 countries and the EU that are
Ph.: +49 (0) 228 - 60492-0
Fax: +49 (0) 228 - 60492-19 ing the global climate, the 21st Conference of the Parties, held assessed in the CCPI. In addition to that, the index now is
in December 2015 in Paris, made a groundbreaking achieve- suited even better to measure how well countries are on track
Germanwatch – Berlin Office
ment in adopting the goal to limit global warming to “well to the global goals of the Paris Agreement. It does so by not
Stresemannstraße 72
D-10963 Berlin, Germany
below” 2°C and to pursue efforts to limit warming to 1.5°C. only comparing countries by their development and recent
Ph.: +49 (0) 30 - 28 88 356-0 Under the Paris Agreement, for the first time climate action trends in the three categories “GHG Emissions”, “Renewable
Fax: +49 (0) 30 - 28 88 356-1 was anchored in the context of international law. This requires Energy” and “Energy Use”, but also the 2°C-compatibility of
countries to make their own unique contribution to the pre- their current status and future targets in each of these catego-
E-mail: info@germanwatch.org
www.germanwatch.org vention of dangerous climate change. The next crucial step ries. The index also continues to evaluate countries’ ambition
to follow this agreement is the rapid implementation by the and progress in the field of climate policy.
signing parties of concrete measures to make their individual
CAN
Climate Action Network International contributions to the global goal. For the past 13 years, the The following publication is issued by Germanwatch, the
Rmayl, Nahr Street, Climate Change Performance Index (CCPI) has been keeping NewClimate Institute and the Climate Action Network.
Jaara Building, 4th floor track of countries’ efforts in combating climate change. The However, only with the help of around 300 energy and climate
P.O.Box: 14-5472, varying initial positions, interests and strategies of the numer- experts from all over the world we are able to include a re-
Beirut, Lebanon ous countries make it difficult to distinguish their strengths view of each country’s national and international policies. The
Phone: +961.1.447192 and weaknesses and the CCPI has been an important tool in review charts the efforts that have been made to avoid dan-
contributing to a clearer understanding of national and inter- gerous climate change, and also evaluates the various coun-
NewClimate Institute national climate policy. tries’ current efforts regarding the implementation of the Paris
Cologne Office
Agreement. We greatly appreciate these experts for their time,
Am Hof 20-26
50667 Cologne, Germany To demonstrate existing measures more accurately and to efforts and knowledge in contributing to this publication. The
encourage steps toward effective climate policy, we evaluated experts are mainly representatives of NGOs who work within
Berlin Office the design of the CCPI this year with several achievements: their respective countries, fighting for the implementation of
Brunnenstr 195
For the first time, it is monitoring the development of all green- the climate policy that we all so desperately need.
10119 Berlin, Germany
Best regards,
Authors:
Jan Burck, Franziska Marten,
Contents
Christoph Bals, Niklas Höhne,
Carolin Frisch, Niklas Clement,
Kao Szu-Chi
With support of:
Foreword3
Pieter van Breenvoort, Mia Moisio
Editing: 1. Key Country Results 4
Lindsay Munro
2. Key Developments 8
Maps:
Carolin Frisch
3. About the CCPI 8
Design:
Dietmar Putscher 4. Overall Results CCPI 2018 10
November 2017 4.1 Partial Results – GHG Emissions 12 Wael Hmaidan Niklas Hoehne Franziska Marten Jan Burck
4.2 Partial Results – Renewable Energy 14 (Climate Action (NewClimate Institute) (Germanwatch) (Germanwatch)
Purchase Order Number: 18-2-03e Network-International)
4.3 Partial Results – Energy Use 16
ISBN 978-3-943704-59-4
4.4 Partial Results – Climate Policy 18
You can find this publication as well
as interactive maps and tables at 5. Country Example: Germany 20
www.climate-change-performance-index.org
6. Sources and Further Reading Recommendations 22
A printout of this publication can be ordered at:
www.germanwatch.org/en/14639
With financial support from
the Barthel Foundation
2 3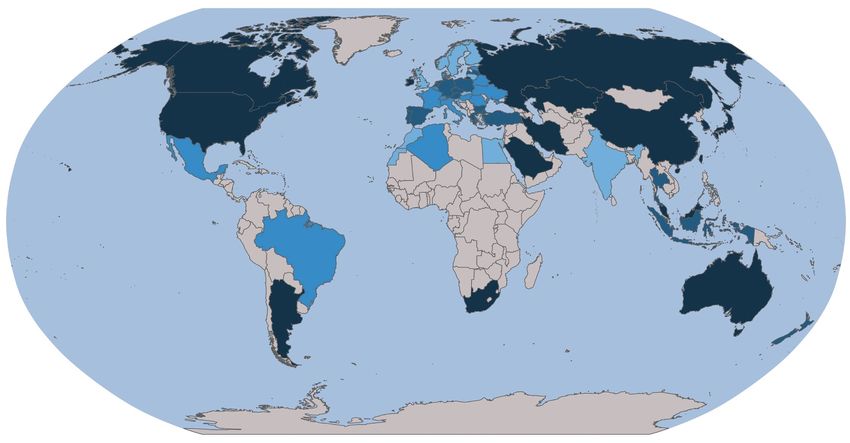
CCPI • Results 2018 Germanwatch, NewClimate Institute & Climate Action Network CCPI • Results 2018 Germanwatch, NewClimate Institute & Climate Action Network
1. Key Country Results climate policy category with its plans for further promoting re-
newables. Despite India‘s significant deployment of renewables,
medium when comparing its 2030 reduction target to a well-
below-2°C pathway.
the country should further improve the targets for this category.
After a historic success in agreeing on a new international cli- current level of per capita energy use and its corresponding Ukraine 20
mate treaty in 2015 in Paris, the success of the Paris Agreement well-below-2°C compatibility, result in a high rating in this cat- France 15
must now be measured by the implementation of mitigation egory. The Ukraine is ranked 20th in this year’s edition of the CCPI. It is
targets on a national level. As in all past editions of the CCPI, the Driven by a high performance in the policy category, France the highest ranking country in the energy use category, where
places 1 to 3 remain unoccupied because even after the Paris Norway 7 secured 15th position in this year`s CCPI ranking. National ex- it performs comparably high to very high in all four indicators.
Agreement came into force, no country has yet done enough to perts especially lauded the country`s conduct in international Despite having a good emissions reduction trend, the country
prevent the dangerous impacts of climate change. The following Slightly behind Morocco, Norway occupies seventh rank. While climate diplomacy. Yet it is noteworthy that this leading role has is only rated medium in the emissions section as its 2030 target
overview highlights the performance of 27 selected countries Norway ranks high in every indicator of the emissions category, not meant sufficient implementation at national level so far. lacks ambition. The same counts for the category renewable
and the EU. The results of all 56 countries and the EU can be experts criticize that, as a result of high government subsidies, Experts criticize their country, because it will very likely miss its energy, where a comparably very high rated trend is not able to
found in chapter 4. the country exports a lot of fossil fuels leading to higher emis- 2020 target for renewable energy. Its performance in the GHG counterbalance the very low current level and the weak target.
sions in other countries. This is reflected in the assessment of emissions category is only medium, as France is not currently on
Sweden 4 national policy, yet due to its role in international negotiations track for well below 2°C, nor has it set sufficient targets for 2030. EU 21
the country still ranks high in the policy section. Rating also high In the energy use section, France is rated low.
Driven in particular by a comparably high performance in the in the renewables category of the index, Norway’s overall perfor- Being evaluated in the CCPI for the first time, the European
index’ emissions category, Sweden ranks fourth in this year’s mance is dampened by a low rating in energy use. Italy 16 Union–the only supranational entity in the index–lands at place
CCPI. Per capita emissions have showed a relatively positive de- 21 in the ranking. As the union consists of 28 nations, there
velopment from 2010 - 2015 with and without LULUCF. However, United Kingdom 8 Not having set an ambitious enough mitigation target to be are wide differences in the performance of individual member
GHG emissions without LULUCF are decreasing at a much slow- aligned with a well-below-2°C pathway yet, Italy–ranking 16th states. The EU as a whole accounts for about 8% of global GHG
er pace. Main drivers for the drop within Sweden‘s LULUCF emis- The UK ranks number eight in this year’s CCPI. A strongly de- in this year‘s CCPI–is rated medium in the emissions category emissions. The EU Emissions Trading Scheme is the largest car-
sions are net forest growth but also natural fluctuations in emis- creasing emissions trend over the last years, mainly driven by a of the index. Despite playing a constructive role in the context bon market in operation but carbon prices are significantly
sions from the agricultural sector. Another cause of concern is shift from a production-based to a service-oriented economy, of the G7 process, Italian experts criticize their country for not insufficient. In the CCPI, the EU rates medium in emissions, re-
that whilst having a very high scoring in terms of the current has resulted in a high performance in the index‘ emissions cat- being proactive enough. They also maintain that Italy lacks clear newables and energy use. EU experts emphasize the union‘s
share of renewable energies, the country’s renewable energy egory. After weakened climate policy in the past years and cut- measures for implementing its long-term strategies domesti- constructive role in international climate diplomacy but criticize
target for 2030 is still not sufficient for the well below 2°C limit. backs especially on the promotion of renewables, the newly cally. The same goes for instruments to reduce energy use. In the slow progress in putting in place new and more ambitious
National experts criticize the restricting extent of the renewable passed clean growth strategy includes a commitment to off- terms of renewable energy, the country has made progress and policies and targets. Disagreements about the future of the
energy target that only focuses on the electricity sector. They shore wind, and to coal phase-out. If consistently implemented, achieved high ratings in three of the four indicators defining this European project would lead to weak agreements based on
further argue for a near-term phase out of nuclear energy and national experts see the country’s power sector on the way to category. lowest common denominators, with the failure to substantially
fossil fuels, especially emphasizing natural gas, and demand getting back on track. The plan also includes policy on clean reform the Emissions Trading System being the most symp-
action on Sweden’s transport sector and consumption-based vehicles which could be effective in further driving decarbonisa- Denmark 17 tomatic example. They see current discussions on new clean
emissions that are twice the size of territorial emissions, and tion, experts claim. Within the UK the level of ambition varies: energy policies and how to ensure the EU budget supports
not decreasing. While Scotland, for example, has gone for a 2032 petrol and While Denmark ranks 17th in the CCPI 2018, experts criticize that such policies as ideal opportunities to increase the ambition of
diesel car ban, the UK aims for 2040. Yet, the country’s long-term the current government cancelled plans for a coal phase-out as climate action.
Lithuania 5 2030 targets for emissions and renewable energy are not ambi- well as the existing reduction targets after taking office, which
tious enough for a well-below-2°C pathway. results in a relatively low performance in terms of climate policy. Germany 22
Lithuania secured fifth rank in the CCPI 2018. It is to be noted The country still ranks high in terms of renewables as well as
that the country, while receiving a very high rating for being on Finland 9 regarding energy use due to positive trends in both categories. Germany ranks number 22 in this year’s CCPI edition. As the
track regarding a well below 2°C trajectory in terms of emis- Nonetheless, the low rating for Denmark’s 2030 emissions target world’s biggest user of lignite, Germany still has relatively high
sions, the emissions trend over the past five years has increased As the third Nordic country to make it into the top 10, Finland and the country’s compliance with a well below 2°C pathway, it GHG emissions with nearly no improvements regarding GHG
and therefore is rated low. The same can be observed in the reached ninth rank. This is especially due to it being the second receives a medium rating in that category. trends within the last years and is rated low in this category.
energy use section, where a weak trend is offset by a very high best performing country in the emissions category, profiting Its dependence on coal remains a major decelerator to achiev-
rated target as well as very good compliance with a well below from a very high rated trend as well as from complying with Brazil 19 ing alignment with the well-below-2°C emissions pathway. The
2°C pathway. For renewables the reverse is true: the country’s its well-below-2°C trajectory. Yet, concerning energy use, the energy use per capita (low) is higher than the EU average but
2030 target is rather unambitious and therefore rated low, while country ranks very low due to very high energy use levels as Ranking 19th, Brazil is leading the group of medium-performing has shown little improvement over the last years. Germany’s
the recent trend points into a positive direction. well as an insufficient target for 2030. Experts acknowledge countries. Domestic experts criticize climate policy under the renewable growth rates are rated as high but regarding the
the introduction of plans to phase out coal but criticize their current government, saying it lacks substance, especially with 2030 renewable energy target, national experts see room for
Morocco 6 government for at the same time still subsidizing other fossil regard to the implementation of already existing measures. Due improvement. Germany has taken on an increasingly vocal
fuels such as peat, which is why the country ranks only medium to its large share of hydropower and therefore its high current role within the international climate negotiations and during
Driven by a high rating in the policy and energy use categories, in the policy section. level of renewables in the energy mix, Brazil is rated relatively the G20 summit, for which the country receives a high rating.
Morocco is rated in the group of high performers within the high in the renewables category of the index. In the GHG emis- Domestically, experts criticize their last (and still acting) gov-
overall tableau of this year’s CCPI. The country profits from a India 14 sions category, the country managed to barely reach the upper ernment for insufficient action on implementing the promises
low emissions level and an ambitious GHG emissions reduction third under the influence of its weak tendencies over the past it made into national law in Paris (low rating).
target by 2030. Morocco was able to install many new renewable With a high rating in the emissions and energy use categories, years. Promising signals of a reduction in emissions from for-
energy capacities within the last five years, which most likely India secured 14th place in the ranking. With its still low per-cap- estry were relativized recently when the government cut back The CCPI 2018 takes a closer look on Germany’s performance in
will lead to a better rating regarding renewables next year. The ita emissions, the country‘s emissions level is showing compat- on important policies targeting that sector. The same holds for this year‘s country special in chapter 5).
country shows a high performance in the energy use category, ibility with a well-below-2°C pathway. Yet emissions over the last energy use, where, compared to the other countries, Brazil rates
targeting an ambitious level for 2030. Furthermore, Morocco’s years have increased relatively strong. India ranks medium in the very low in its developments within the last five years but still
4 5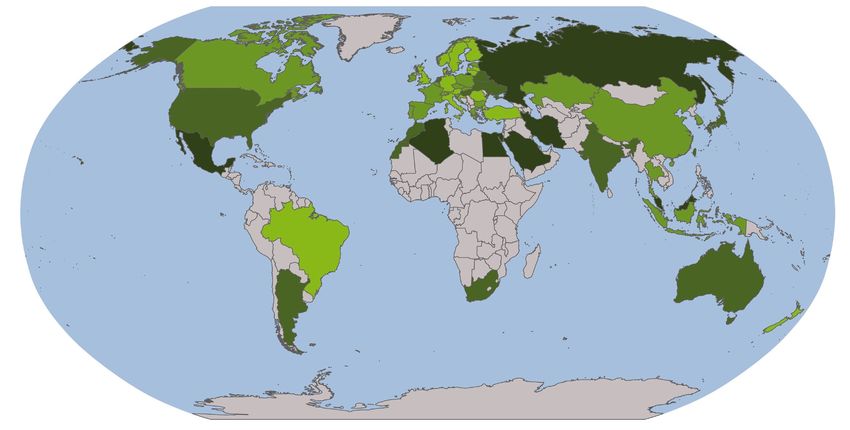
CCPI • Results 2018                                                                            Germanwatch, NewClimate Institute & Climate Action Network   CCPI • Results 2018                                                                            Germanwatch, NewClimate Institute & Climate Action Network

Mexico                                                       27          China develops renewable energy at a very high speed, but its                      Japan                                                         50          as by the economic sector to counterbalance the disastrous
                                                                         share of renewables within the energy mix in 2015 was still rela-                                                                                            developments in federal policy. And ambitious action would be
Coming in at place 27, Mexico is performing relatively well in           tively low. And with a still insufficiently ambitious 2030 renewable               Japan ranks 50 th in this year’s CCPI and shows a very low to             crucially needed with the USA being the second largest emitter
the policy category. This is due to national experts appreciat-          energy target, the country has a medium rating for this category.                  low performance in all categories except energy use, where the            in the world and emission levels therefore being considerably
ing recent actions taken by the government, like a significant                                                                                              country scored medium. National experts see the continued                 too high to be in line with a well-below-2°C pathway. A high-
reduction in fossil fuel subsidies for example which, combined           Argentina                                                                 46       increase in the number coal-fired power plants as becoming a              rated growth rate of renewables over the course of the past
with a strong appearance on the international stage, leads to a                                                                                             major threat to achieving Japan’s already weak 2030 mitigation            years led to a slightly more positive rating in the renewables
high rating. A very low-rated 2030 target for renewable energy           Argentina holds position 46 in this year’s CCPI ranking. The                       target. One bright spot can be seen in developments in renew-             category compared to the other index categories. There are
and a lack of compliance with a well-below-2°C compatible                country is performing very low on emissions and is currently                       able energy throughout the last five years, where the country             positive signs showing this development could be secured even
pathway make Mexico one of the worst performing countries                far removed from meeting a well-below-2°C compatible trajec-                       received a high rating.                                                   against current policy developments.
in the renewables section, while ranking slightly above average          tory. Argentina further ranks low in both the energy use and
concerning energy use as well as GHG emissions.                          renewable energy categories. While there is progress in the use                    Canada                                                        51          Australia                                                                57
                                                                         of renewables, which is already reflected in the trend indicator,
Indonesia                                                    37          national experts criticize Argentina for its vast investments in                   As one of the largest producers of absolute greenhouse gases as           Australia ranks among the very low-performing countries in
                                                                         unconventional fossil fuels, such as shale gas and shale oil.                      well as per-capita emissions, Canada is ranked 51st in this year’s        three of the CCPI’s categories–GHG emissions, energy use and
Indonesia is classified as a low-performing country in this year’s       While acknowledging their country would have shown its inten-                      CCPI edition. Additionally, having a very low-rated 2030 GHG              climate policy–and among the low performers regarding renew-
ranking. Although the rating of its GHG emissions reduction tar-         tion of going ahead with mitigation plans and recognizing the                      reduction target, the country will need higher ambitions to be            able energy, which results in position 57 in the overall tableau.
get for 2030 is relatively high, Indonesia’s past trends and cur-        challenges of also moving forward with their implementation,                       on track with a well-below-2°C compatible pathway. Regarding              Experts emphasize the need to strengthen the country’s 2030
rent status of GHG emissions per capita are rated comparably             experts also demand for more ambition.                                             the category energy use, Canada’s performance is very low in              targets especially in terms of emissions reduction and renew-
very low and low. Its relatively high emissions due to deforesta-                                                                                           terms of the current level as well as the 2030 target. Having large       able energy and demand that their government sufficiently im-
tion and forest degradation in particular have a large impact            Turkey                                                                    47       hydropower capacities and a very positive trend from other re-            plement credible policies for meeting these targets.
on Indonesia’s ranking. With its large amounts of hydropower,                                                                                               newable capacities as wind or solar, Canada receives a medium
Indonesia rates high in share of renewables compared to other            Turkey ranks 47th in the CCPI 2018. This partly results from                       rating in the renewables category. Canada gets relatively high
countries, yet lacks ambition in aligning its 2030 targets for re-       Turkey being rated very low concerning climate policy with ex-                     grades for its performance in international climate diplomacy.            Republic Korea                                                           58
newable energy and energy use to a well below 2°C compatible             perts criticizing unambitious targets, weak implementation and                     Domestically, experts grant that the leadership of several prov-
pathway. The lack of bold action to phase out fossil fuels and a         counterproductive policy measures domestically as well as a                        inces having ambitious 2030 targets for their per capita emis-            South Korea ranks in the bottom 3 of this year’s CCPI with a
new policy, which according to national experts prevents invest-         weak performance in international climate diplomacy. Turkey                        sions and energy supply from renewable sources. Nonetheless,              comparably very low and severely misaligned performance with
ments in renewables, might be reasons for not moving forward,            also ranks low in emissions and energy use due to negative                         experts also criticize the lack of a joined climate responsibility        regard to a well below 2°C pathway in the GHG emissions and
the experts claim.                                                       developments in both categories. One upside is the renewables                      on the national level and demand more specific strategies in              energy use categories. Coming from a very low level of renewa-
                                                                         section, where positive developments over the course of the last                   order to progress on decarbonizing the country’s economy.                 bles in the energy supply, the country’s very high rating in the
Poland                                                       40          years resulted in a high rating.                                                                                                                             development of renewable energy adds a bright spot to its over-
                                                                                                                                                            Russia                                                        53          all performance. Nonetheless, national experts worry about the
Poland ranks 40th in this year’s edition of the Climate Change           South Africa                                                              48                                                                                 increasing installation of coal capacity and coal consumption
Performance Index. National experts specifically point out that                                                                                             The Russian Federation ranks 53rd in the CCPI 2018. With its high         and criticize their government for its unambitious 2030 emis-
the country hasn’t played a constructive role in international           South Africa ranks 48th in the CCPI this year. The country faces a                 level of GHG emissions and a mitigation target that drastically           sions reduction target
negotiations especially within the EU, where it continues to fight       very low rating concerning GHG emissions, due to an insufficient                   overshoots the benchmark for a well-below-2°C compatible
sufficient climate legislation targeting higher carbon prices in         2030 target and its current level of emissions, both being incom-                  pathway, the country is rated very low in emissions and low
the EU Emissions Trading Scheme for example. Domestically,               patible with a well-below-2°C trajectory. Experts emphasize                        in energy use in comparison to the other countries. Not ac-               Saudi Arabia                                                             60
the country is heavily reliant on coal, and climate protection           that, even though the country is performing well in international                  counting for large hydro power in its own official assessment of
policies are mainly driven by the implementation of EU legis-            negotiations, it lacks ambition and stringent implementation of                    renewable energy, the country is rated very low in all of the four        Saudi Arabia is this year’s worst performing country ranks 60th.
lation, experts criticize. Poland rates low in every indicator of        policies at home, which results in a medium rating in the CCPI’s                   indicators defining this category. National experts report about          The kingdom is rated very low in every single category and in
the emissions category besides the trend, where it was able to           policy section. An only medium-rated development of renewa-                        useful policies for the support of renewables being in place              all indicators for Emissions, Energy Use and Renewable energy.
achieve a medium rating. The country also rates medium in the            bles and a very low-rated 2030 target for renewables are reasons                   but too small in scale. Generally, experts criticize Russia’s low         Policy is lacking as well with experts criticizing the country’s
renewable energy section of the index, since it shows a positive         for a low performance with regard to this category.                                ambition in domestic climate policy and a lack of implementing            very poor appearance in international negotiations.
development over the past years, while at the same time is still                                                                                            concrete measures.
lacking a sufficient 2030 target.                                        Ireland                                                                   49
                                                                                                                                                            USA                                                           56
China                                                        41          Being the worst performing European country in the CCPI,
                                                                         Ireland ranks 49th. According to national experts, Ireland is one                  Already in the first months of the Trump Administration, the
China is the world’s largest emitter of GHG emissions. In the            of the few EU countries to miss its 2020 emission reduction tar-                   USA started to take several steps backwards on climate action,
emissions category of the index, the country is to be found in           gets under the EU effort-sharing decision, which is one reason                     especially by declaring its withdrawal from the Paris Agreement
the group of very low performers, even though per capita GHG             why the country rates very low in climate policy. Its performance                  and dismantling the Clean Power Plan. As such, policy evalua-
emissions have hardly increased since 2013. The 2030 reduction           in the field of GHG emissions is also very low as the country is                   tions dropped dramatically, especially regarding international
target and past emissions trends are rated very low compared to          nowhere close to being on track concerning its well below 2°C                      climate diplomacy, where national experts rated its country’s
the other countries and not in line with a well-below-2°C com-           compatible pathway with both its current level as well as its                      performance very low. National policy grades are still slightly
patible pathway. However, the country is ambitious concern-              2030 target. We observe a very positive trend in the develop-                      more positive, as (1) the new government has not yet erased
ing assuming a leading role in international climate diplomacy.          ment of renewable energy, but as the current share of renew-                       all the efforts of the previous administration and (2) there are
Domestically, China has developed a series of policies to pro-           able energy in energy supply–as well as the 2030 target–are in-                    positive signs that more ambitious action on climate protection
mote renewables and phase out coal capacity, experts claim.              sufficient, Ireland rates only medium in the renewables category.                  will be taken by cities and states on the subnational level as well

                                                                     6                                                                                                                                                            7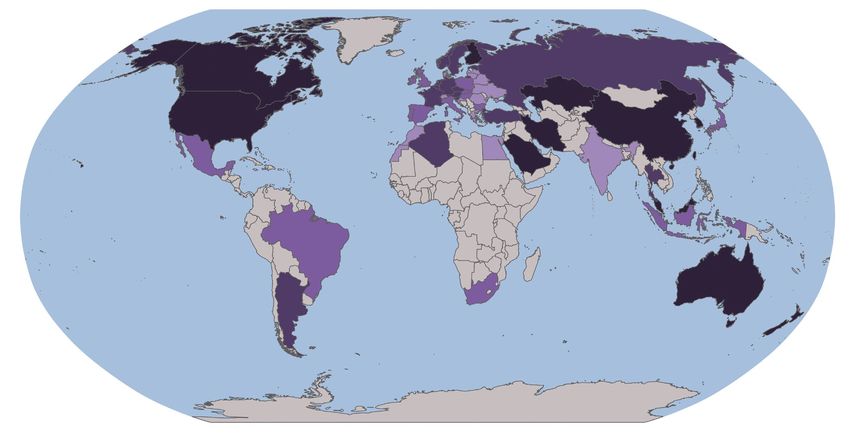
CCPI • Results 2018 Germanwatch, NewClimate Institute & Climate Action Network CCPI • Results 2018 Germanwatch, NewClimate Institute & Climate Action Network
2. Key Developments In 2017 the design of the CCPI was revised, due to recent global
climate policy developments in the last years. One of the major
egories GHG Emissions, Renewable Energy and Energy Use are
defined by four indicators each (recent developments, current
events that marked a milestone in the international climate levels and 2°C compatibility of the current performance as well
Two years after agreeing to limit global warming to well below threshold of global warming. Prices for oil, gas and coal are drop- negotiations was the entry into force of the Paris Agreement. as an evaluation of the countries’ 2030 targets in the respective
2°C, and to pursue efforts to even aim for a 1.5°C limit, we still see ping, which sets an incentive to use them also in the longer term. For the first time, it is possible to measure the performance of categories). With these complements, the CCPI covers the evalu-
a huge ambition gap1 in the countries‘ greenhouse gas reduction To maintain the positive developments in renewables, the need states based on the promises they themselves formulated in ation of the countries promises as well as their current progress
targets and their progress regarding a sufficient implementation to set more ambitious renewable energy targets and appropriate their Nationally Determined Contributions (NDCs). So far 169 7 in terms of climate protection.
of the Paris agreement in national legislation. carbon regulation including prices is increasing every day. Parties have ratified the Paris Agreement and promised to com-
bat dangerous climate change in limiting global temperature For the pathways, we set three ambitious targets that are es-
Nonetheless, there are encouraging signs that a global energy The global reaction to Donald Trump’s withdrawal of the rise to well-below-2°C or even 1.5° C. sential to stay well below 2°C, which have to be reached until
transition is underway. Numbers show that, in 2014, 2015 and USA from the Paris Agreement has so far made the other 2050: nearly zero GHG emissions (taking into account country-
2016, global energy-related carbon dioxide emissions did not countries present a united front in holding on to the goals The CCPI aims to capture the fulfillment of those promises specific pathways, which give developing countries a bit more
grow further - the first time since industrial revolution in years of the Agreement. It still remains to be shown whether this and evaluates the countries’ 2030 targets within the impor- time to reach this goal), a share of 100% energy from renewable
without a big economic crisis. Also, according to the recent UNEP will hold true when it comes to the real implementation of nec- tant categories greenhouse gas emissions, renewable energy sources, and remaining at today’s global energy use per capita
“Emission Gap Report” all global greenhouse gas emissions de- essary policies. Positive signs have also come from US towns, and energy use to determine, how well they are on track to a levels. The CCPI compares where countries actually are and
clined in 2016 for the first time since the early 1980s.2 However, states and companies, as well as actors in the financial market. well-below-2°C pathway. The CCPI now also reflects countries’ where they need to be, to meet these ambitious and necessary
preliminary data published by the Global Carbon Project indi- Many of them implement their own strategies and at the same current performances towards this pathway in absolute terms, benchmarks. Following a similar logic, the CCPI evaluates the
cates that the emission in 2017 increased again by 2%.3 time demand more ambitious climate action internationally and in addition to the remaining relative indicators measuring the countries’ own 2030 targets in comparing them to the same
nationally. They ask for a reliable and stringent policy framework current level and past trends in all three categories. 40% of the benchmarks.
The decarbonisation of energy systems plays a key role in limiting and investment-relevant CO2 price signals. evaluation is based on indicators of emissions, 20% on renew-
emissions and in reducing them in the future. In addition, it is an able energies and 20% on energy use. The remaining 20% of Still, more than half of the CCPI ranking indicators are qualified
encouraging sign for ongoing decarbonisation that global energy- One of the key tasks of ongoing climate negotiations is to the CCPI evaluation is based on climate policy assessments in relative terms (better–worse) rather than absolute. Therefore,
related emissions have not grown, while primary energy demand establish an “ambition mechanism”, thus continuously rais- by experts from the respective countries. Besides changes in even those countries with high rankings have no reason to sit
has grown by an annual average of around 1.8% since 2011.4 ing ambition in order to close the remaining gap between the weighting and smaller modifications within the calculation back and relax. On the contrary, the results illustrate that even
the countries‘ emissions reduction targets and the global method, the addition of indicators, which measure the progress if all countries were as involved as the current front runners,
Investments in renewable energies continue to dominate limit for temperature rise. This is not only a request to raise of countries on their way not to overshoot the well-below-2°C efforts would not yet be sufficient to prevent dangerous climate
the new investments in the energy system worldwide. At the the mitigation target, but also the level of climate financing and limit, are the major changes in the new design. The three cat- change.
same time coal use is declining. Last year the world consump- innovative ways of cooperation, regarding technologies as well
tion of coal was 1.7% less than in 2015. Even though coal prices as beyond technology. To find new ways of cooperation, it is
have fallen, coal production already peaked in 2013 globally5 equally important for countries to deliver on their promises and
and among the world‘s largest emitters, China, the USA, as well adopt sufficient legislation domestically. As Paris has requested
as in the EU. In 2015, almost all countries included in the index and G19 has promised, countries should put forward their plans
Components of the CCPI
maintained double-digit growth rates in renewable energy and for moving towards greenhouse gas neutrality until 2050.
we see solar and wind technologies being more competitive International Climate Policy Current Status of GHG Emissions
from year to year. While growth rates of renewables have been The design of the Climate Change Performance Index (CCPI) 10% 10% per Capita
particularly strong in industrialised countries in the past, emerg- has now been changed, taking into account the new reality after
ing economies are playing an increasingly crucial role in the adopting the Paris Agreement. It is now suited to measure the National Climate Policy Past Emission Trends of GHG
global energy transition. China is leading the upsurge in renew- progress of countries towards contributing to the temperature 10% 10% Emissions per Capita
able energy, but Middle Eastern, North African and Central- and limit the global community agreed to in Paris. 20%
South American countries are also expected to increase their Climate
Future TPES/Capita 2030 Target Policy
installed capacity drastically by 2018. 51% of global capacity It is also important to note that data show none of the 56 coun- compared to a well-below-2°C 40%
5% Emissions
Past Trends compared to a
in wind energy and 53% in solar6 energy is already installed in tries or the EU on a well-below-2°C pathway in their overall per- compatible pathway well-below-2°C compatible
emerging economies, indicating the potential of leapfrogging a formance, while there are some initial indications that this might 20% 10% pathway
Past TPES/Capita Trends 5% Efficiency
fossil-fuel-based industrialisation. change for a few countries during the next years. Countries have
compared to a well-below-2°C
to prove consistency in implementing necessary policies compatible Pathway 20%
Shrinking costs for renewable energies (wind and solar) is also to reach national mitigation targets and raise ambition in 5% Renewable
an opportunity to more rapidly phasing out fossil fuels in the adapting their targets to what would be well-below-2°C or Past Trends of TPES/Capita Energies 10% GHG Emissions Reduction
order of magnitude that is necessary to meet the well-below-2°C 1.5°C compatible. 2030 Target compared
Current Status of Energy Use
5% to a well-below-2°C
per Unit of TPES/Capita compatible pathway
5% 5%
3. About the CCPI
5% 5%
Future Renewable Energy 2030 Current Share of Renewables
Target compared to a well-below-2°C per TPES
compatible pathway
The Climate Change Performance Index (CCPI) is an instrument On the basis of standardised criteria, the index evaluates and Past Renewable Trends compared to a Development of Energy Supply from Renewable
designed to enhance transparency in international climate poli- compares the climate protection performance of 56 countries well-below-2°C compatible pathway Energy Sources
tics. Its aim is to put political and social pressure on those coun- and the EU, which are together responsible for more than 90
tries which have, up until now, failed to take ambitious action on percent of global greenhouse gas (GHG) emissions.
GHG = Greenhouse Gas Emissions | TPES = Total Primary Energy Supply © Germanwatch 2017
climate protection. It also aims to highlight those countries with
best practice climate policies. 1 UNEP (2017) 4 REN21 (2017)
2 UNEP (2017) 5 BP (2017)
3 http://www.globalcarbonproject.org/ 6 Financial Times (2017) 7 11.11.2017
8 9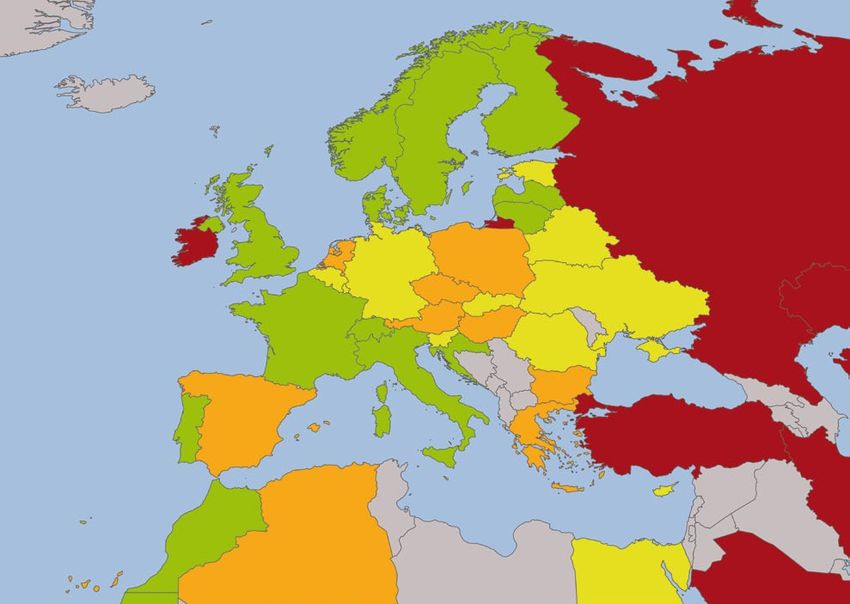
CCPI • Results 2018 Germanwatch, NewClimate Institute & Climate Action Network CCPI • Results 2018 Germanwatch, NewClimate Institute & Climate Action Network
4. Overall Results CCPI 2018 Rank Country Score**
1.* – –
2. – –
3. – –
4. Sweden 74.32
5. Lithuania 69.20
6. Morocco 68.22
7. Norway 67.99
8. United Kingdom 66.79
9. Finland 66.55
10. Latvia 63.02
11. Malta 61.87
© Germanwatch 2017
12. Switzerland 61.20
13. Croatia 61.19
14. India 60.02
15. France 59.80
16. Italy 59.65
17. Denmark 59.49
18. Portugal 59.16
19. Brazil 57.86
20. Ukraine 57.49
21. European Union (28) 56.89
22. Germany 56.58
23. Belarus 56.38
24. Slovak Republic 56.04
25. Luxembourg 55.54
26. Romania 55.32
27. Mexico 54.77
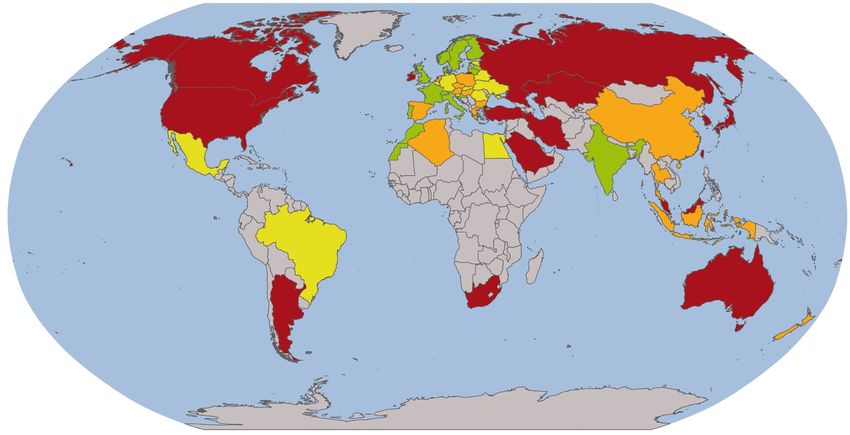
This section shows the overall results of this year’s
28. Egypt 54.02
Climate Change Performance Index 2018. The ranking
29. Cyprus 52.29
results of this category are defined by a country’s ag-
gregated performance regarding 14 indicators within 30. Estonia 52.02
the four categories GHG Emissions, Renewable Energy, 31. Slovenia 50.54
Energy Use and Climate Policy. 32. Belgium 49.60
33. New Zealand 49.57
The CCPI 2018 results illustrate the main regional differ- 34. Netherlands 49.49
ences in climate protection and perfor-mance within the 35. Austria 49.49
56 evaluated countries and the EU. Despite decreasing 36. Thailand 49.07
© Germanwatch 2017
growth rates in CO2 emissions, still no country performed 37. Indonesia 48.94
well enough to reach the rating “very good” in this year’s 38. Spain 48.19
index. 39. Greece 47.86
40. Poland 46.53
The world map shows the aggregated results and overall 41. China 45.84
performance of countries. The table on the right indicates 42. Bulgaria 45.35
how the countries perform in the different categories. 43. Czech Republic 45.13
Rating 44. Hungary 44.00
In this year’s index, Sweden is leading the list, followed by Very High 45. Algeria 43.61
Lithuania and Morocco. The group of medium-perform- High 46. Argentina 41.21
ing countries consists of countries like Brazil, Germany, 47. Turkey 41.02
Medium
Mexico and Ukraine while New Zealand, the Netherlands 48. South Africa 40.61
and Austria are classified as low performers in the over Low 49. Ireland 38.74 Index Categories
all rating. Very Low 50. Japan 35.76 GHG Emissions
51. Canada 33.98 (40% weighting)
Not included in assessment
Saudi Arabia, Islamic Republic of Iran, Republic Korea, 52. Malaysia 32.61 Renewable Energy
Australia and the United States form the bottom five of 53. Russian Federation 29.85 (20% weighting)
this classification, scoring low or very low across almost 54. Chinese Taipei 29.43 Energy Use
all categories. 55. Kazakhstan 28.17 (20% weighting)
56. United States 25.86
Climate Policy
57. Australia 25.03 (20% weighting)
58. Republic Korea 25.01
59. Islamic Republic of Iran 23.05
60. Saudi Arabia 11.20
* None of the countries achieved positions one to three. No country is doing enough to prevent dangerous climate change. ** rounded © Germanwatch 2017
10 11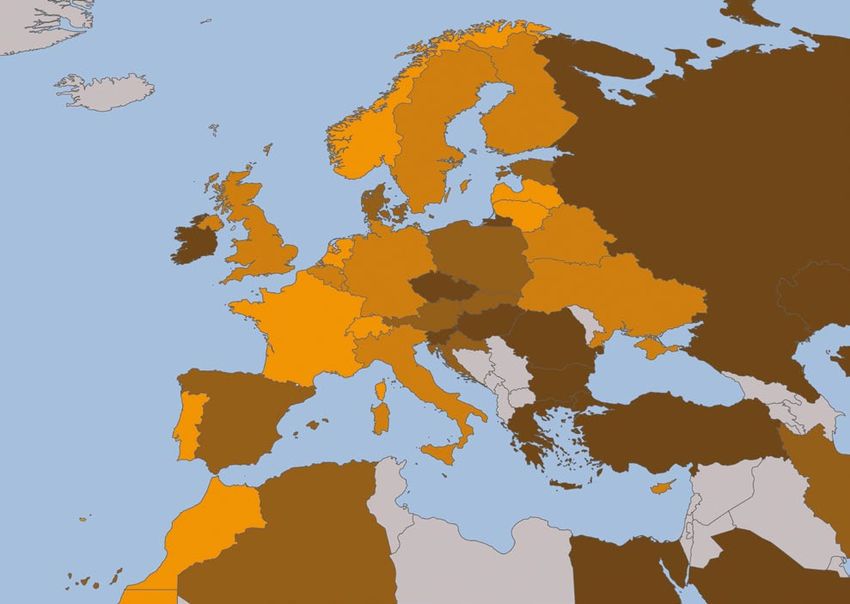
CCPI • Results 2018 Germanwatch, NewClimate Institute & Climate Action Network CCPI • Results 2018 Germanwatch, NewClimate Institute & Climate Action Network
4.1 Partial Results – GHG* Emissions Greenhouse Gas Emissions – Rating Table for the 20 Largest CO2 Emitters*
Rank Country Total Current Status Recent Emission Recent Trends GHG Emissions
Rating of GHG Emissions Trends of GHG compared to a Reduction Target
per Capita Emissions per well-below-2°C compared to a
Capita compatible well-below-2°C
pathway compatible
pathway
9. United Kingdom High Medium High Medium Medium
14. India High Very High Very low Very High High
21. Brazil Medium Medium Very low High Medium
26. Mexico Medium High Low Medium Low
© Germanwatch 2017
27. France Medium Medium High Low Low
Rating 29. European Union (28) Medium Medium High Low Low
Very High 39. Indonesia Low Low Very low Medium High
High 40. Germany Low Low Medium Low Low
Medium
45. Turkey Low High Very low High Very low
Low
46. Argentina Very low Low Low Very low Very low
Very Low
48. Japan Very low Low Low Very low Very low
Not included
in assessment 49. South Africa Very low Low Low Very low Very low
50. Russian Federation Very low Very low Low Medium Very low
52. China Very low Medium Very low Low Very low
53. United States Very low Very low Medium Very low Very low
The sub-ranking results of the index category “GHG
55. Canada Very low Very low Low Very low Very low
Emissions” are defined by a country’s aggregated per-
formance regarding four indicators, each reflecting a 57. Australia Very low Very low Medium Very low Very low
© Germanwatch 2017
different dimension and aspect of how well the coun-
58. Islamic Republic of Iran Very low Low Very low Very low Very low
try is doing in terms of GHG emissions.
59. Republic Korea Very low Very low Very low Very low Very low
The evaluation looks at (1) the current levels of per
capita GHG emissions; (2) the developments in GHG 60. Saudi Arabia Very low Very low Very low Very low Very low
emissions in the last five years in absolute terms, * The ratings for all 56 countries and the EU can be found here: www.climate-change-performance-index.org © Germanwatch 2017
(3) the current level of per capita GHG emissions com-
pared to a country specific well-below-2°C pathway Emissions per capita (tCO2-eq/capita, incl. LULUCF**), historic
and (4) the country’s own 2030 emissions reduction values and 2°C compatibility of current level and 2030 target Historic emissions per capita
target compared to its well-below-2°C pathway. 30 Well-below-2°C pathway
2030 target below
The world map shows the aggregated results and well-below-2°C pathway
overall performance of countries in the category “GHG 25
2030 target above
Emissions”. The table provides more detailed informa- well-below-2°C pathway
tion on the top CO2-emitting countries‘ performance 20
with regard to the different indicators defining the cat-
egory. The graph on the bottom indicates how emis-
sions developed from 1990 until 2015 and visualises 15
the 2°C compatibility of both a country’s recent trend
and its 2030 target. 10
Considering emissions from LULUCF** in the new in-
dex design, Sweden is the best performing country 5
no target
regarding GHG emissions, followed by Finland, Egypt
and Croatia, while Iran, Republic Korea and Saudi 0
Arabia perform very low in every indicator of this
2030 target & 2°C pathway
2030 target & 2°C pathway
2030 target & 2°C pathway
2030 target & 2°C pathway
2030 target & 2°C pathway
2030 target & 2°C pathway
2030 target & 2°C pathway
2030 target & 2°C pathway
2030 target & 2°C pathway
2030 target & 2°C pathway
2030 target & 2°C pathway
2030 target & 2°C pathway
Emissions 2015
2030 target & 2°C pathway
Emissions 2015
2030 target & 2°C pathway
2030 target & 2°C pathway
2030 target & 2°C pathway
2030 target & 2°C pathway
2030 target & 2°C pathway
2030 target & 2°C pathway
2030 target & 2°C pathway
1990
2015
1990
2015
1990
2015
1990
2015
1990
2015
1990
2015
1990
2015
1990
2015
1990
2015
1990
2015
1990
2015
1990
2015
1990
1990
1990
2015
1990
2015
1990
2015
1990
2015
1990
2015
1990
2015
category and build the bottom three. Generally, miti-
gation targets for 2030 are too low and not on track
for a pathway towards well below 2°C or even 1.5°C
warming.
* Greenhouse Gas Emissions
** Land Use, Land-Use Change and Forestry Argentina Australia Brazil Canada China France Germany India Indonesia Islamic Japan Republic Mexico Russian Saudi South Turkey United United European
Rep. of Iran Korea Federation Arabia Africa Kingdom States Union (28)
12 13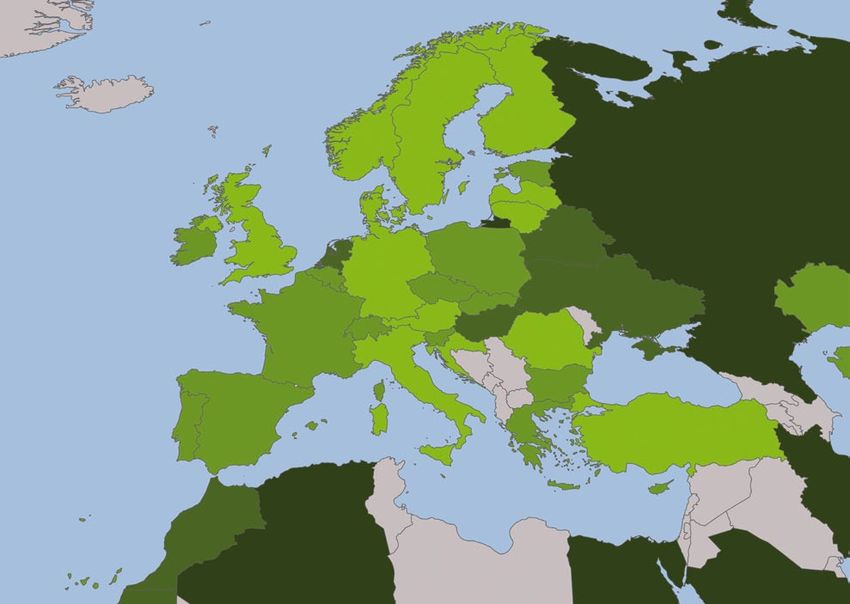
CCPI • Results 2018 Germanwatch, NewClimate Institute & Climate Action Network CCPI • Results 2018 Germanwatch, NewClimate Institute & Climate Action Network
4.2 Partial Results – Renewable Energy Renewable Energy – Rating Table for the 20 Largest CO2 Emitters*
Rank Country Total Current Share Development of Recent Renewable Renewable
Rating of Renewables Energy Supply Trends compared Energy 2030
per TPES from Renewable to well-below Target compared
Energy Sources 2°C compatible to a well-below-
pathway 2°C compatible
pathway
12. United Kingdom High Medium Very High Medium Medium
13. Brazil High Very High Medium Medium Medium
14. Turkey High Medium Very High Medium Low
15. Germany High High High Medium Medium
© Germanwatch 2017
22. European Union (28) Medium High High Medium Low
Rating 24. China Medium Low Very High Low Very Low
Very High 30. Republic Korea Medium Very Low Very High Very Low Very Low
High 34. France Medium Low High Low Medium
Medium
36. Indonesia Medium High Medium Low Low
Low
39. Canada Medium High High Low Very Low
Very Low
42. India Low Medium High Very Low Very Low
Not included
in assessment 44. United States Low Low High Low Very Low
45. Japan Low Low High Low Very Low
47. Argentina Low Medium High Very Low Very Low
49. Australia Low Low High Low Very Low
The sub-ranking results of the index category “Renew
51. South Africa Low Low Medium Low Very Low
able Energy” are defined by a country’s aggregated per-
formance regarding four indicators, each reflecting a dif- 54. Mexico Very Low Low Medium Very Low Very Low
© Germanwatch 2017
ferent dimension and aspect of how well the country is
57. Russian Federation Very Low Very Low Very Low Very Low Very Low
doing in terms of renewable energy.
58. Saudi Arabia Very Low Very Low Very Low Very Low Very Low
The evaluation looks at (1) current levels of the share
of renewable energy in total primary energy supply; 60. Islamic Republic of Iran Very Low Very Low Very Low Very Low Very Low
(2) developments of renewable energy in the last five * The ratings for all 56 countries and the EU can be found here: www.climate-change-performance-index.org © Germanwatch 2017
years in absolute terms; (3) current levels of the share of
renewable energy in total primary energy supply com- Renewable Energy target (% of TPES*), historic values and Historic share of Renewable
pared to a country-specific pathway that is in line with 2°C compatibility benchmarks Energy in TPES
the well-below-2°C temperature limit; (4) the countries’
100% Well-below-2°C pathway
own 2030 renewable energy targets compared its well-
below-2°C pathway. 90% 2030 target of share of renewable
energies per TPES
80%
The world map shows the aggregated results and overall Gap from 2030 target to
performance of countries in the category “Renewable 70%
well-below-2°C pathway
Energy”. The table provides more detailed information
60%
on the top CO2-emitting countries’ performance with
regard to the different indicators defining the category. 50%
The graph on the bottom indicates how renewable en-
40%
ergy developed from 2010 until 2015 and visualises the
2°C compatibility of both a country´s current level and 30%
2030 target. 20%
Since the energy sector contributes greatly to the CO2 10%
emissions of a country, renewable energies are a key 0%
driver for mitigating emissions. Traditionally, relatively
2030 target & 2°C pathway
2030 target & 2°C pathway
2030 target & 2°C pathway
2030 target & 2°C pathway
2030 target & 2°C pathway
2030 target & 2°C pathway
2030 target & 2°C pathway
2030 target & 2°C pathway
2030 target & 2°C pathway
2030 target & 2°C pathway
2030 target & 2°C pathway
2030 target & 2°C pathway
Emissions 2015
2030 target & 2°C pathway
2030 target & 2°C pathway
2030 target & 2°C pathway
2030 target & 2°C pathway
2030 target & 2°C pathway
2030 target & 2°C pathway
2030 target & 2°C pathway
2030 target & 2°C pathway
2010
2015
2010
2015
2010
2015
2010
2015
2010
2015
2010
2015
2010
2015
2010
2015
2010
2015
2010
2015
2010
2015
2010
2015
1990
2010
2015
2010
2015
2010
2015
2010
2015
2010
2015
2010
2015
2010
2015
well performing countries in this category are the ones
with a high share of renewables, such as Denmark,
Norway, Sweden, Austria, New Zealand, Latvia, and
Germany, for instance. This year, Latvia is top of the list,
followed by New Zealand. The group of very poorly per-
forming countries includes Mexico, Malaysia, Egypt, the
Russian Federation, Saudi Arabia, Algeria, and the Islamic Argentina Australia Brazil Canada China France Germany India Indonesia Islamic Japan Republic Mexico Russian Saudi South Turkey United United European
Republic of Iran. Rep. of Iran Korea Federation Arabia Africa Kingdom States Union (28)
* Total Primary Energy Supply
14 15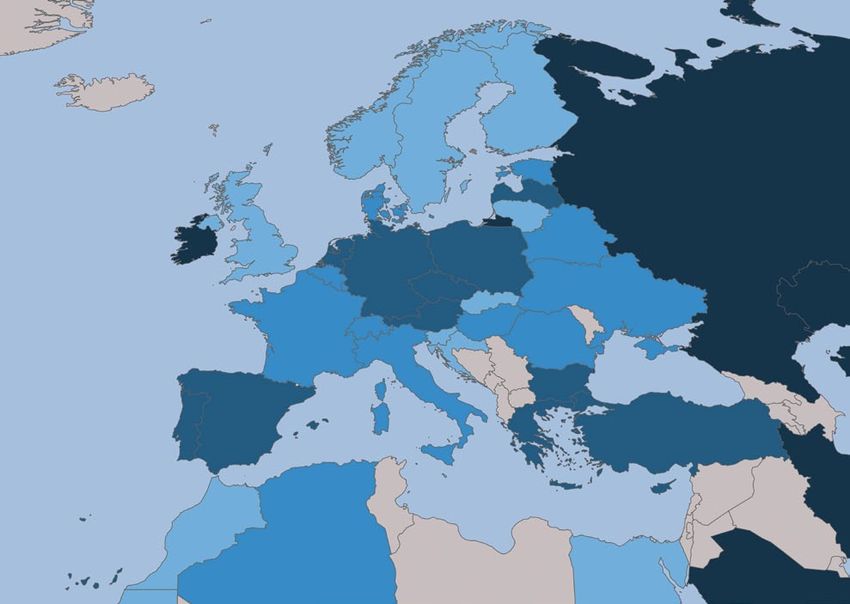
CCPI • Results 2018 Germanwatch, NewClimate Institute & Climate Action Network CCPI • Results 2018 Germanwatch, NewClimate Institute & Climate Action Network
4.3 Partial Results – Energy Use Energy Use – Rating Table for the 20 Largest CO2 Emitters*
Rank Country Total Current Status of Recent Trends of Recent TPES/ TPES/Capita 2030
Rating Energy Use per TPES/Capita Capita Trends Target compared
Unit of TPES**/ compared to a to a well-below-
Capita well-below-2°C 2°C compatible
compatible pathway
pathway
11. India High Very High Very Low Very High High
18. United Kingdom Medium Medium High Medium Low
19. Indonesia Medium Very High Low Very High Low
25. Brazil Medium Very High Very Low Low High
© Germanwatch 2017
27. Mexico Medium High Low Medium Very Low
Rating 29. South Africa Medium Medium Medium Very Low Low
Very High 30. Japan Medium Low High Very Low Very Low
High 31. European Union (28) Medium Low Medium Low Low
Medium
35. Germany Low Low Medium Low Medium
Low
36. France Low Low Medium Very Low Medium
Very Low
39. Argentina Low High Low Very Low Low
Not included
in assessment 42. Turkey Low High Very Low Very Low High
46. Russian Federation Low Very Low Low Low Medium
51. Australia Very Low Very Low Medium Very Low Very Low
52. China Very Low High Very Low Very Low Very Low
The sub-ranking results of the index category “Energy
54. United States Very Low Very Low Medium Very Low Very Low
Use” are defined by a country’s aggregated performance
regarding four indicators, each reflecting a different di- 57. Islamic Republic of Iran Very Low Medium Very Low Very Low Very Low
© Germanwatch 2017
mension and aspect of how well the country is doing in
58. Canada Very Low Very Low Low Very Low Very Low
terms of energy use.
59. Republic Korea Very Low Very Low Low Very Low Very Low
The evaluation looks at (1) current levels of per capita
energy use; (2) developments of per-capita energy use 60. Saudi Arabia Very Low Very Low Very Low Very Low Very Low
in the last five years in absolute terms; (3) current levels * The ratings for all 56 countries and the EU can be found here: www.climate-change-performance-index.org ** Total Primary Energy Supply © Germanwatch 2017
of per capita energy use compared to a country-specific
pathway that is in line with the well-below-2°C tempera- Total Primary Energy Supply per capita (GJ/capita), historic
ture limit; (4) the countries’ own 2030 energy use targets Historic Energy Use per capita
values, targets and 2°C compatible benchmarks
compared its well-below-2°C pathway. Well-below-2°C pathway
450
2030 target below
The world map shows the aggregated results and overall well-below-2°C pathway
400
performance of countries in the category “Energy Use”.
2030 target above
The table provides more detailed information on the top 350 well-below-2°C pathway
CO2-emitting countries‘ performance with regard to the
300
different indicators defining the category. The graph on
the bottom indicates how energy use per capita devel- 250
oped from 1990 until 2015 and visualises the 2°C compat-
ibility of both a country’s current level and 2030 target. 200
150
Ukraine, Malta, Morocco as well as Romania are the front-
runners in the Energy Use section, mostly due to low 100
current levels of energy use and relatively good ratings
regarding a 2°C compatible pathway in this category. New 50
Zealand, Iran, Canada, Republic Korea and Saudi Arabia
0
are this year’s worst-performing countries, scoring low
2030 target & 2°C pathway
2030 target & 2°C pathway
2030 target & 2°C pathway
2030 target & 2°C pathway
2030 target & 2°C pathway
2030 target & 2°C pathway
2030 target & 2°C pathway
2030 target & 2°C pathway
2030 target & 2°C pathway
2030 target & 2°C pathway
2030 target & 2°C pathway
2030 target & 2°C pathway
2030 target & 2°C pathway
2030 target & 2°C pathway
2030 target & 2°C pathway
2030 target & 2°C pathway
2030 target & 2°C pathway
2030 target & 2°C pathway
2030 target & 2°C pathway
2030 target & 2°C pathway
1990
2015
1990
2015
1990
2015
1990
2015
1990
2015
1990
2015
1990
2015
1990
2015
1990
2015
1990
2015
1990
2015
1990
2015
1990
2015
1990
2015
1990
2015
1990
2015
1990
2015
1990
2015
1990
2015
1990
2015
or very low across nearly all indicators. While emerging
economies tend to perform decently in this category,
Algeria, Turkey, India and China have been rapidly in-
creasing their energy use in the last few years.
Argentina Australia Brazil Canada China France Germany India Indonesia Islamic Japan Republic Mexico Russian Saudi South Turkey United United European
Rep. of Iran Korea Federation Arabia Africa Kingdom States Union (28)
16 17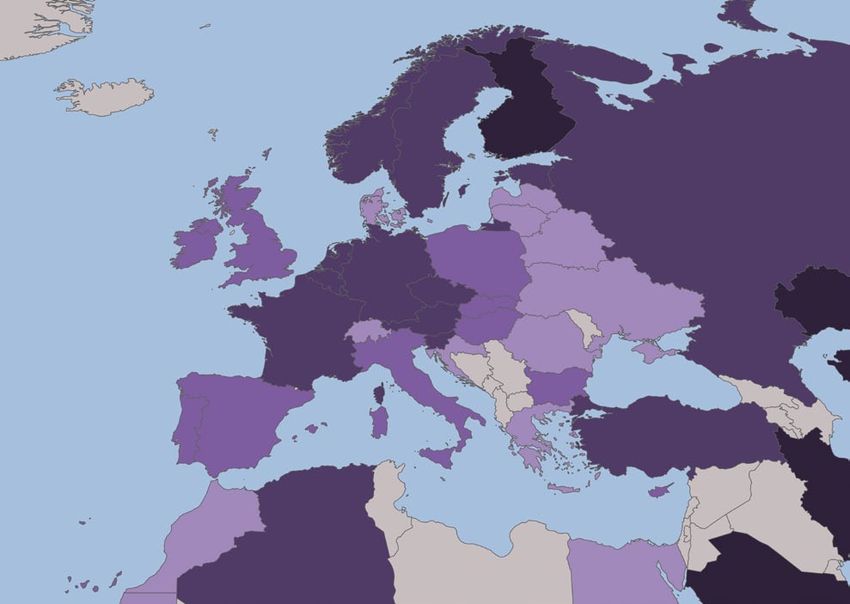
CCPI • Results 2018 Germanwatch, NewClimate Institute & Climate Action Network CCPI • Results 2018 Germanwatch, NewClimate Institute & Climate Action Network
4.4 Partial Results – Climate Policy Climate Policy – Rating Table for all Countries
Rank Country Total Rating National International
Policy Performance Policy Performance
4. Morocco high high Very High
5. China high high high
6. France high medium Very High
7. Portugal high high high
8. Mexico high medium high
9. Switzerland high medium high
10. Norway high medium high
11. Lithuania high medium medium
© Germanwatch 2017
12. Netherlands high medium high
13. Latvia high medium medium
14. European Union (28) high low high
15. Germany medium low high
16. India medium medium high
17. Belarus medium medium medium
18. United Kingdom medium medium high
19. Finland medium medium high
20. Luxembourg medium low high
21. Cyprus medium high low
22. Canada medium very low Very High
23. Sweden medium low medium
24. Argentina medium low high
25. South Africa medium low medium
26. Italy medium low medium
27. Thailand medium low medium
With the index category “Climate Policy”, we consider 28. Belgium medium low medium
the fact that measures taken by governments to reduce 29. Ukraine medium low medium
GHG often take several years to show their effect on the 30. Brazil medium low medium
emissions, renewable energy and energy use indicators.
31. Republic Korea low low medium
On top of this, the most current GHG emissions data
32. Austria low low medium
provided by PRIMAP and the IEA is about two years old.
33. Estonia low low low
However, the assessment of climate policy includes very
34. Islamic Republic of Iran low medium very low
recent developments. The effect that current govern-
35. Indonesia low low medium
ments benefit or suffer from the consequences of the
36. Malta low low medium
preceding administration’s climate actions is thereby
37. Slovak Republic low low low
© Germanwatch 2017
reduced.
38. Malaysia low low medium
The qualitative data of the indicators in the field of ‘cli- 39. New Zealand low low low
mate policy’ is assessed annually in a comprehensive 40. Chinese Taipei low very low medium
research study. Its basis is the performance rating by 41. Spain low very low medium
about 300 climate change experts from civil society 42. Poland low low low
within the countries that are evaluated. By means of a 43. Algeria low low low
questionnaire, they give a judgement and rating on the Rating 44. Croatia low very low low
most important policies and concrete measures of their Very High 45. Denmark low very low medium
governments as well as its implementation status and 46. Ireland very low very low medium
effects on the country’s decarbonisation progress. High
47. Saudi Arabia very low low very low
Medium 48. Greece very low very low low
The policy category of the CCPI is led by Morocco, China,
Low 49. Czech Republic very low very low low
France and Portugal who all score high regarding na-
Very Low 50. Egypt very low low very low
tional and international climate policy, while Hungary,
Bulgaria, the United States and Turkey form the group 51. Slovenia very low very low low
Not included
of the worst-performing countries not only lacking cli- in assessment 52. Russian Federation very low very low low
mate-friendly legislation at home, but also often hinder- 53. Australia very low very low very low
ing progress in international negotiations. It is notewor- 54. Japan very low low very low
thy that many countries, including Canada, Germany, 55. Romania very low very low very low
Argentina and South Africa, for example, are performing 56. Kazakhstan very low very low very low
relatively well on the international stage, yet seem to 57. Hungary very low very low very low
be failing to deliver on sufficiently implementing policy 58. Bulgaria very low very low very low
measures at the national level. 59. United States very low very low very low
60. Turkey very low very low very low
© Germanwatch 2017
18 19You can also read


