Key Performance Indicators to evaluate the integration of solar heating in industrial processes
←
→
Page content transcription
If your browser does not render page correctly, please read the page content below

Key Performance Indicators to
evaluate the integration of solar
heating in industrial processes
Deliverable 2.3
WP2. SHIP2FAIR Use cases and Boundary conditions

SHIP2FAIR - Solar Heat for Industrial Process towards Food and Agro
Industries commitment in Renewables

Grant agreement: 792276
From April 2018 to March 2022

 Prepared by: CEA
 Date: 06/11/2018

 This project has received funding from the European Union’s Horizon 2020 research
 and innovation programme under grant agreement No 792276.
 Disclaimer: The sole responsibility for any error or omissions lies with the editor. The
 content does not necessarily reflect the opinion of the European Commission. The
 European Commission is also not responsible for any use that may be made of the
Document: D2.3. Key Performance Indicators to evaluate the integration of solar heating in industrial
 processes
 Author: CEA Version: 1
 Reference: D2.3 SHIP2FAIR ID GA 792276 Date: 14/11/18

DELIVERABLE FACTSHEET
 Deliverable no.: Deliverable 2.3 Key Performance Indicators to evaluate the integration of
 solar heating in industrial processes
 Responsible Partner: CEA
 WP no. and title: 2. SHIP2FAIR Use Cases and Boundary Conditions
 Task no. and title: 2.4. Demonstration KPIs definition
 Version: 1
 Version Date: 06/11/2018

Dissemination level

 X PU = Public
 PP = Restricted to other programme participants (including the EC)
 RE = Restricted to a group specified by the consortium (including the EC)
 CO = Confidential, only for members of the consortium (including the EC)

Approvals
 Company
 Author/s CEA
 Reviewers RINA-C, CIRCE
 Task Leader CEA
 WP Leader CEA

 2/45
Document: D2.3. Key Performance Indicators to evaluate the integration of solar heating in industrial
 processes
 Author: CEA Version: 1
 Reference: D2.3 SHIP2FAIR ID GA 792276 Date: 14/11/18

DISCLAIMER OF WARRANTIES
“This project has received funding from the European Union’s Horizon 2020 research and innovation program
under Grant Agreement No 792276”.

This document has been prepared by SHIP2FAIR project partners as an account of work carried out within
the framework of the EC-GA contract no 792276.
Neither Project Coordinator, nor any signatory party of SHIP2FAIR Project Consortium Agreement, nor any
person acting on behalf of any of them:
 (a) makes any warranty or representation whatsoever, expressed or implied,

 (i). with respect to the use of any information, apparatus, method, process, or similar item
 disclosed in this document, including merchantability and fitness for a particular purpose,
 or
 (ii). that such use does not infringe on or interfere with privately owned rights, including any
 party's intellectual property, or
 (iii). that this document is suitable to any particular user's circumstance; or

 (b) assumes responsibility for any damages or other liability whatsoever (including any consequential
 damages, even if the Project Coordinator or any representative of a signatory party of the SHIP2FAIR
 Project Consortium Agreement has been informed of the possibility of such damages) resulting from
 your selection or use of this document or any information, apparatus, method, process, or similar
 item disclosed in this document.

 3/45
Document: D2.3. Key Performance Indicators to evaluate the integration of solar heating in industrial
 processes
 Author: CEA Version: 1
 Reference: D2.3 SHIP2FAIR ID GA 792276 Date: 14/11/18

ABREVIATIONS
CAPEX: CAPital Expenditures
CSP: Concentrated Solar Power
DNI: Direct Normal Irradiation
DSS: Decision Support System
EPTB: Energy Pay Back Time
EROI: Energy Return On Energy Invest
FTE: Full Time Equivalent Job
GNI: Global Normal Irradiation
HCV: High Calorific Value
KPI: Key performance Indicator
LCoH: Levelized Cost of Heat
LCV: Low Calorific Value
OPEX: OPerational Expenditures
PP: Payback Period
ROI: Return On Investment
SDT: Relative Shut Down Time
SHIP: Solar Heat for Industrial Process
STE: Solar Thermal Energy
WACC: Weight Average Cost of Capital

PARTNERS SHORT NAMES
CIRCE: FUNDACIÓN CIRCE CENTRO DE INVESTIGACIÓN DE RECURSOS Y CONSUMOS ENERGÉTICOS
RINA-C: RINA Consulting S.p.A.
CEA: Commissariat à l'énergie atomique et aux énergies alternatives
ISMB: Istituto Superiore Mario Boella sulle tecnologie dell’informazione e delle telecomunicazioni
SOLID: S.O.L.I.D. Gesellschaft für Solarinstallation und Design mbh
TVP: TVP Solar
ISG: Industrial Solar GmbH
BE2020: Bioenergy 2020+ GmbH
M&R: Martini & Rossi S.p.A.
RODA: Bodegas Roda S.A.
RAR: RAR – Refinarias de Açúcar Reunidas S.A.
ABC: ABC Industrie SAS
EDF: Electricité de France
EUREC: EUREC EESV
SPANISH CO-OPS: Cooperativas Agro-alimentarias de España, U. de Coop.

 4/45
Document: D2.3. Key Performance Indicators to evaluate the integration of solar heating in industrial
 processes
 Author: CEA Version: 1
 Reference: D2.3 SHIP2FAIR ID GA 792276 Date: 14/11/18

PUBLISHABLE SUMMARY
This report establishes a list of indicators to assess the benefit of solar heat integration in industrial processes
(SHIP). These indicators are Key Performance Indicators (KPI), they are linked to determined quantities
calculated with relations approved by the consortium. Used in the frame of the present SHIP2FAIR project,
these KPIs are generic and usable for future replication projects.

In the first part, the required inputs to calculate KPIs are identified and listed. These inputs are to be supplied
by equipment providers, engineering and design offices, and end-users. These data characterize the state of
reference of the process before SHIP integration and the new state after SHIP integration.

In the second part, KPIs are listed. To facilitate their understanding, they are split into five different categories
related to technical, economic, environmental, social and regulation aspects. When necessary, a calculation
method is proposed. As solar energy is not a constant resource, data collection is spread over time. To this
effect, a reference period and a sampling rate are suggested. Depending on differences between different
projects, some KPIs can be more relevant than others, a selection is to be done. At this step, it will be useful
to define KPI's target and then check the degree of matching between target and actual value.

When conversions are required for data reduction, in the absence of precise conversion factor, generic values
are proposed to complete calculations.

To evaluate economic indicators, a table of different energies cost is proposed for European countries, with
a focus on electricity and natural gas costs.

The set of KPIs selected during this analysis will enable the assessment of impacts related to the
implementation of solar plants.

All the KPIs and their characteristics are to be validated by the consortium of SHIP2FAIR to have a common
basis of evaluation for the project and for future SHIP replications (Replication Tool). Some of these KPIs will
be selected and implemented in the future monitoring system and decision support system (DSS).

 5/45
Document: D2.3. Key Performance Indicators to evaluate the integration of solar heating in industrial
 processes
 Author: CEA Version: 1
 Reference: D2.3 SHIP2FAIR ID GA 792276 Date: 14/11/18

 TABLE OF CONTENTS
TABLE OF CONTENTS .......................................................................................................................................... 6
1. INTRODUCTION .......................................................................................................................................... 9
2. METHODOLOGY........................................................................................................................................ 10
3. INPUTS LIST............................................................................................................................................... 11
 3.1. REAL ONSITE SOLAR RESOURCE AND AMBIENT CONDITIONS ......................................................... 11
 3.2. TEMPERATURE DEMAND PROFILE ................................................................................................... 11
 3.3. THERMAL POWER DEMAND PROFILE .............................................................................................. 11
 3.4. FOSSIL ENERGY CONSUMPTION ....................................................................................................... 11
 3.5. ADDITIONAL AND SAVED POWER CONSUMPTION .......................................................................... 11
 3.6. CAPEX ............................................................................................................................................... 12
 3.7. OPEX ................................................................................................................................................. 13
 3.8. SPACE AVALAIBLE AND CHARACTERISTICS ....................................................................................... 14
 3.9. PRODUCTION UNIT REFERENCE ....................................................................................................... 14
 3.10. DISTANCE FROM PROCESS ........................................................................................................... 14
 3.11. INTERFACE WITH END-USER......................................................................................................... 14
4. TECHNICAL INDICATORS ........................................................................................................................... 15
 4.1. TOTAL SOLAR ENERGY PRODUCTION ............................................................................................... 15
 4.1.1. Total solar energy production: absolute value......................................................................... 15
 4.1.2. Total solar energy production: specific value........................................................................... 17
 4.2. SATISFACTION OF REQUIRED TEMPERATURE LEVEL(S) ................................................................... 18
 4.3. SOLAR OVERALL EFFICIENCY ............................................................................................................ 19
 4.4. THERMAL POWER SIMULTANEITY .................................................................................................... 20
 4.5. THERMAL STORAGE EFFICIENCY ...................................................................................................... 21
 4.6. THERMAL STORAGE EFFICACY .......................................................................................................... 22
 4.7. VOLUMETRIC ENERGY DENSITY ........................................................................................................ 22
 4.8. STORAGE BY SOLAR SURFACE RATIO ............................................................................................... 23
 4.9. ADDITIONAL SPECIFIC ENERGY CONSUMPTION (OR COP) ............................................................... 23
 4.10. EXTENDED ENERGY SAVING RATE ................................................................................................ 24
 4.11. OVERALL EQUIPMENT EFFECTIVENESS ........................................................................................ 25
5. ECONOMIC INDICATORS .......................................................................................................................... 26
 5.1. IMPACT ON ENERGY BILL.................................................................................................................. 27

 6/45
Document: D2.3. Key Performance Indicators to evaluate the integration of solar heating in industrial
 processes
 Author: CEA Version: 1
 Reference: D2.3 SHIP2FAIR ID GA 792276 Date: 14/11/18

 5.2. IMPACT ON PROCESS DURING BUILDING ........................................................................................ 28
 5.3. SOLAR ENERGY COST (LCoH: Levelized Cost of Heat) ...................................................................... 29
 5.4. RETURN ON INVESTMENT (ROI) ....................................................................................................... 30
 5.5. COST OF STORED HEAT..................................................................................................................... 31
 5.6. PAYBACK PERIOD (PP) ...................................................................................................................... 32
6. ENVIRONMENTAL INDICATORS ................................................................................................................ 33
 6.1. FOSSIL ENERGY SAVING .................................................................................................................... 33
 6.2. EQUIVALENT CO2 REDUCTION .......................................................................................................... 34
 6.3. ENERGY RETURN ON ENERGY INVEST (EROI) ................................................................................... 35
 6.4. ENERGY PAY BACK TIME (EPBT) ....................................................................................................... 35
 6.5. RATIO OF STE/TOTAL ENERGY .......................................................................................................... 35
 6.6. OTHER POLLUTIONS SOURCES ......................................................................................................... 35
 6.7. VISUAL IMPACT................................................................................................................................. 35
 6.8. RESOURCES USED OR SAVED ............................................................................................................ 36
7. SOCIAL INDICATORS ................................................................................................................................. 37
 7.1. SOCIAL IMPACT................................................................................................................................. 37
 7.1.1. Intranet level ............................................................................................................................ 37
 7.1.2. Internet level ............................................................................................................................ 37
 7.2. DIRECT/INDIRECT JOBS CREATION (FTE) .......................................................................................... 38
 7.3. LOCAL EMPLOYMENT ....................................................................................................................... 38
 7.4. GENDER EQUITY ............................................................................................................................... 38
 7.5. SAFETY .............................................................................................................................................. 38
8. REGULATORY ............................................................................................................................................ 39
 8.1. INCENTIVIZATION ............................................................................................................................. 39
 8.2. INVOLVEMENT OF PUBLIC AUTHORITIES ......................................................................................... 39
 8.3. COMPARISON BETWEEN THE COMPANY RENEWABLE ENERGY INTEGRATION AND THE EUROPEAN
 ROADMAP (ENER-SHARE)............................................................................................................................. 39
9. CONCLUSIONS .......................................................................................................................................... 40
REFERENCES ..................................................................................................................................................... 42
ANNEXES........................................................................................................................................................... 43
 ANNEX I: Natural gas cost for European countries ...................................................................................... 43
 ANNEX II: Energy cost for European countries ............................................................................................. 44
 ANNEX III: Electricity cost for European countries ....................................................................................... 45

 7/45
Document: D2.3. Key Performance Indicators to evaluate the integration of solar heating in industrial
 processes
 Author: CEA Version: 1
 Reference: D2.3 SHIP2FAIR ID GA 792276 Date: 14/11/18

List of figures

Figure 4-1. Links between Inputs and ‘’Total Solar Energy Production’’ KPI ...................................................15
Figure 4-2. Solar field, liquid heat carrier ......................................................................................................... 15
Figure 4-3. Solar field, direct steam production............................................................................................... 16
Figure 4-4. Links between Inputs and ‘’Satisfaction of required temperature level(s)’’ KPI............................18
Figure 4-5. Parameters for the calculation of the temperature level(s) .......................................................... 18
Figure 4-6. Links between Inputs and ‘’Solar overall efficiency’’ KPI ............................................................... 19
Figure 4-7. TVP collector efficiency .................................................................................................................. 19
Figure 4-8. Required and supplied thermal power .......................................................................................... 20
Figure 4-9. Thermocline thermal storage, inputs and ouputs ......................................................................... 21
Figure 4-10. Links between Inputs and ‘’Extended energy saving rate’’ KPI....................................................24
Figure 4-11. Links between Inputs and ‘’Overall equipment effectiveness’’ KPI .............................................25
Figure 5-1. Links between Inputs and ‘’Impact on energy bill’’ KPI ................................................................. 27
Figure 5-2. Links between Inputs and ‘’Levelized Cost of Heat’’ KPI ................................................................ 29
Figure 5-3. Links between Inputs and ‘’Return on Investment’’ KPI ................................................................ 30
Figure 5-4. Links between Inputs and ‘’Payback period’’ KPI ........................................................................... 32
Figure 6-1. List of environmental indicators .................................................................................................... 33
Figure 7-1. List of social indicators ................................................................................................................... 37

 8/45
Document: D2.3. Key Performance Indicators to evaluate the integration of solar heating in industrial
 processes
 Author: CEA Version: 1
 Reference: D2.3 SHIP2FAIR ID GA 792276 Date: 14/11/18

1. INTRODUCTION
The objective of this deliverable is to establish a list, as exhaustive as possible, of objective criteria to evaluate
the benefits of SHIP implementation in existing industrial processes of demonstration sites. This guideline
can be replicated for future projects. When criteria are only qualitative, it is more difficult to allow
comparisons between different sites or scenarios. On the other hand, they become very relevant when they
are associated to figures and targets if possible. For that purpose, their method of calculation must be very
clear and transparent to have a common understanding on their meaning. The acceptation of the method at
least by the equipment supplier and end user is mandatory. Only under these conditions, a criterion can be
regarded as a key performance indicator (KPI).

To help the understanding of the impact of solar heat integration in a process, relevant information can also
be highlighted by the use of different type of KPIs. They can be used in expertise and analyze tasks. For
example, in the case of a thermocline thermal storage integrated to smooth the available thermal power,
tracking the stratification degree of the storage is useful to be correlated with heat storage efficiency, even
if finally, only overall thermal efficiency is a KPI. Some of these KPIs will be useful for the monitoring of the
solar plant. These indicators will be used to check and make sure that the plant is aging as expected.

A relevant list of KPIs, accompanied by their method of calculation is proposed. Objectives are suggested for
some KPIs. But in the replication tool, the designer will choose the KPI driving his sizing. Economic and
environmental (CO2, and other greenhouse gas emissions) aspects seems to be the main drivers, but in this
document we will not define neither KPI priority neither KPI fixed targets.

An appreciation of the KPIs scope of application is also defined: It is worth noting that the priority of the KPI
relevance may vary in function of the subject perspective. For example, the KPI associated to environment
will be strongly supported by the community while the more technical and economical KPI would be crucial
for the plant operation.

A normalization of number of KPIs is necessary to take into account that their value can depend on a variable
volume of production, what leads to calculate specific quantities instead of absolute quantities. Additionally,
some KPIs can be expressed in term of overall energy or in term of specific energy.

The main results are summarised in the conclusions section at the end of the document (section 9).

Deliverable 2.3 has been developed under the activities of the Task 2.4 Demonstration KPIs definition, within
the Document of Action of SHIP2FAIR project.

 9/45
Document: D2.3. Key Performance Indicators to evaluate the integration of solar heating in industrial
 processes
 Author: CEA Version: 1
 Reference: D2.3 SHIP2FAIR ID GA 792276 Date: 14/11/18

2. METHODOLOGY
The list of criteria to be determined and then regarded as KPIs, is split into five categories:

 • Technical
 • Economic
 • Environmental
 • Social
 • Regulatory

Links between categories are mainly the following:

 • The adequate technical integration of solar installations in industrial processes allows considerable
 energy savings, which mean direct economic savings in energy sources for the ownership, but also
 environmental benefits for the whole society.
 • Furthermore, the environmental impact has economic benefits due to regulations: reduction of CO2
 emissions decreases carbon tax to be paid. Social impact can be evaluated by jobs creation: a cost
 for a manufacturing company but mostly net profits for it and less unemployed persons for the
 community.

As mentioned in the introduction, a great number of criteria can be tracked but only a part will be regarded
as KPIs. When possible, each KPI is described by characteristics listed hereafter.

 • KPI title and description.
 • Unit: indicator unit is not always trivial, especially when defining specific quantities. Basis of
 normalization must be clearly defined.
 • Required inputs: calculations need input data. They must be identified all well as their precision level
 to guarantee an accuracy level of KPIs. The unit system used in these inputs should be verified in
 order to assure the validation of the calculations.
 • Calculation method: it must be detailed clearly, without confusing source.
 • Reference period: an indicator or an input is leveled over a representative period. Characteristic time
 can be less than one hour up to one year after integration of shorter periods.
 • Accuracy level (expected error): standard measurement errors can give a good idea about the
 uncertainty to be expected on KPIs.

All the KPIs and their characteristics are to be validated by the consortium of SHIP2FAIR to have a common
basis of evaluation for the project and for future SHIP replications (Replication Tool). Some of these KPIs will
be selected and implemented in the future monitoring system and decision support system (DSS).

 10/45
Document: D2.3. Key Performance Indicators to evaluate the integration of solar heating in industrial
 processes
 Author: CEA Version: 1
 Reference: D2.3 SHIP2FAIR ID GA 792276 Date: 14/11/18

3. INPUTS LIST
A generic list of inputs can be established because they are mandatory to evaluate the relevance of solar
heat integration and, thus, most of the related KPIs.

 3.1. REAL ONSITE SOLAR RESOURCE AND AMBIENT CONDITIONS
This data is extremely relevant since it drives the thermal power able to be supplied to processes. The real
solar resource needs to be measured on site, in real time with global normal irradiation (GNI) and direct
normal irradiation (DNI) sensors. Other weather data like wind direction, speed and ambient temperature
may also be useful for analysis tasks. The sampling rate is at least mean values over one hour, hour per hour
for each day of the year. This data must be collected before SHIP implementation for design purposes and
during operation for evaluation purposes. When no measurement is available, it is possible to use services
like ‘’Meteonorm’’ to evaluate the solar resource. During operation, it is mandatory to have a measurement
of this resource. This input parameter will depend on the solar field technology, typically DNI for CSP or solar
field with tracker and GNI for stationary collector.

 3.2. TEMPERATURE DEMAND PROFILE
This is a requirement of the SHIP end-user. The temperature profile of the heat source must match with the
demand profile. Thermal storage management and control system are key points to achieve this
requirement. Daily, hour per hour data is the minimum sampling rate; at least, this is to be known for typical
days over the year to size properly the system and then to evaluate the benefit of solar heat. Control of
temperature is possible as soon as the stagnation temperature is higher than the required temperature.
Actual thermal power delivered adjusts according with the collectors' characteristic. With the thermal power
demand, it is one of the most important inputs for the engineering step.

 3.3. THERMAL POWER DEMAND PROFILE
With temperature profile, this is an important input data to size properly the solar field and the thermal
storage answering to an objective of low carbon energy supply. If an hourly sampling rate all over the year
cannot be established, the profile should be established at least hour per hour, for a typical day of each
month of the year. In any case, it must be consistent with temperature profile.

 3.4. FOSSIL ENERGY CONSUMPTION
Precise counting of primary energy consumption with a timeline is mandatory. The reason is that it is a key
input in order to evaluate fossil energy saving, cost saving and payback time. Records in a monthly basis prior
to SHIP integration for 2-3 years would be very useful, if available; however, a minimum of one year
recordings is mandatory. A daily gas consumption is easy to measure; in the case of fuel oil, a flow counter is
probably required as the accuracy of the fuel tank filling frequency is not enough.

 3.5. ADDITIONAL AND SAVED POWER CONSUMPTION
This is the electric consumption of additional or cancelled systems to operate SHIP and process. If SHIP
integration decreases the consumption of the process itself, it can be taken into account here as a negative

 11/45
Document: D2.3. Key Performance Indicators to evaluate the integration of solar heating in industrial
 processes
 Author: CEA Version: 1
 Reference: D2.3 SHIP2FAIR ID GA 792276 Date: 14/11/18

quantity. As variable speed pumps are frequently used to control flow rates and minimize electric
consumption, energy counting with an hourly sampling rate may be preferable.

 3.6. CAPEX
The Capital Expenditures (CAPEX) includes the cost of solar field factory onboard and all other costs to be
supported until the solar plant start up:

 - Direct construction costs
 · Solar field
 · Thermal storage
 · Electrical and instrumentation systems
 · Civil engineering for site preparation
 · Transportation
 · Auxiliary utilities
 · Buildings
 · Construction
 · Start up, commissioning and acceptance testing
 - Project engineering
 · Preliminary engineering
 · Detailed design
 · Construction management and oversight
 - Project development
 · Administration, contracting, management
 · Environmental permitting
 · Legal services
 - Project financing costs
 · Interest during construction
 · Debt service reserve
 · Other financing costs
 - Contingency

The CAPEX could be expressed in k€ (or M€). In order to make a comparison between solar technologies or
between solar fields with different sizes it may be useful to use €/m² for the collectors: the reference area
represents the gross area of the solar collector for stationary solar field or the area of the mirror for the CSP.
It allows making a link with a physical component: a solar collector, a tracker with its mirrors… All these costs
may depend on the site and country where SHIP is implemented. They also strongly depend on the
characteristics of the installation: roof / floor, size (number of collector, etc.), environmental constraints,
type of financing…

In order to have an overview of these variations, table 3-1 gives the collector's cost determined by different
literature values. The cost curve for solar technology is steep, so exact value is difficult to be determined
before studies in the frame of a concrete project.

 12/45
Document: D2.3. Key Performance Indicators to evaluate the integration of solar heating in industrial
 processes
 Author: CEA Version: 1
 Reference: D2.3 SHIP2FAIR ID GA 792276 Date: 14/11/18

 Table 3-1 Cost range of different collector technologies

 Motion Collector type Absorber type Unit cost [€/kW]
 Flat plate collector (FPC) Flat 250 - 700
 Evacuated tube collector (ETC) Flat 800 - 1,100
 Stationary
 Ultra High Vacuum FPC (UHV-FPC) Flat 1,200
 Compound Parabolic Collector (CPC) Tubular 600 - 1,300
 1 tracker Linear Fresnel Tubular 1,000 - 1,500

 3.7. OPEX
The Operational Expenditures (OPEX) involve the ongoing costs for operating the solar system in an industrial
plant, such as maintenance works and energy consumption to operate. It can be expressed in euros per a
reference period - day, month, year…- or in euros per unit of "delivered service" - kWhth, etc.

Fixed costs and variable components contribute to OPEX.

 - Fixed costs
 · Labor costs
 · Maintenance costs
 · Plant performance monitoring costs
 · Indirect operation and maintenance costs (i.e. subcontracted tasks)
 - Variable costs
 · Power
 · Chemicals
 · Wastes disposal

OPEX are quite difficult to estimate: some parameters can be evaluated (like the power consumption of the
auxiliaries) but others are more uncertain (cleaning of the mirrors, defective piece replacement…). Annual
maintenance costs are often taken as a percentage of investment cost, but contingency may have a strong
effect on them. In order to give an idea, for large solar field, the OPEX is about 0.3 to 0.5% of the CAPEX. As
for CAPEX, OPEX can be site and country dependant.

Table 3-2 lists OPEX for different collector technologies in term of €/kW. Unlike conventional installations,
the OPEX of solar installations is quite low. The OPEX is higher for CSP technologies because they involve
trackers.
 Table 3-2 OPEX range of different collector technologies

 Motion Collector type Absorber type OPEX [€/kW]
 Flat plate collector (FPC) Flat 3
 Evacuated tube collector (ETC) Flat 3
 Stationary
 Ultra High Vacuum FPC (UHV-FPC) Flat 3
 Compound Parabolic Collector (CPC) Tubular -
 Linear Fresnel reflector (LFR) Tubular 4 - 10
 Single axis tracking
 Parabolic trough collector (PTC) Tubular -
 Parabolic dish reflector (PDR) Point -
 Two axis tracking
 Heliostat field collector (HFC) Point -

 13/45
Document: D2.3. Key Performance Indicators to evaluate the integration of solar heating in industrial
 processes
 Author: CEA Version: 1
 Reference: D2.3 SHIP2FAIR ID GA 792276 Date: 14/11/18

When designing the plant, forecasted OPEX can be reduced by increasing CAPEX - i.e. selection of more
efficient collectors -. Contribution of CAPEX amortization in final cost is higher. Optimization by cost of service
minimization helps to share OPEX and CAPEX in final cost.

Regarding power costs, although they may be low compared to other OPEX contributions, ANNEX III:
Electricity cost for European countries gives electricity cost for European countries. These data can be used
for evaluation tasks.

 3.8. SPACE AVALAIBLE AND CHARACTERISTICS
This is a site data. Space may limit the collector surface to be installed, but also the additional equipment for
the solar system, with a direct consequence on the interest of SHIP integration. Then, if all available space is
occupied, it is used to calculate the ratio aperture/available space. If space is directly or indirectly costly, a
maximum ratio may be among the decision criteria to be considered to select the solar collector technology
and the temperature range of solar energy supplied to the process. In parallel, space characteristics are
important. For example, different types of roof-top or ground spaces and their specific features have
advantages and drawbacks to be considered during collector's selection and their structural supporting
system. The orientation of available space and shading are also major parameters: it is important to take care
of the surrounding environment (building, trees, mountains, etc.) which may shade the solar field and then
reduce the solar resource. Special location with respect to the potential link(s) with existing facilities and
process(es) needs to be considered. Specific software tools may be used to calculate the shading mask on
the solar field.

 3.9. PRODUCTION UNIT REFERENCE
Some of the KPIs will be used during the whole lifetime of the solar plant. Since the annual energy need can
change from a period to another according to the volume of the production, it maybe be necessary to refer
to specific value of production. The end-user must define a production unit reference (volume of wine, liquor,
mass of sugar, etc.). This approach supposes that there will be no changes in the manufacturing process.
This input is also need to compare some KPIs before and after the use of solar heat.

 3.10. DISTANCE FROM PROCESS
The distance between the solar field and point(s) of use needs to be considered in heat transportation cost
contribution in CAPEX and OPEX. Also, it is a parameter to consider when determining the global solar plant
efficiency taking into account thermal losses.

 3.11. INTERFACE WITH END-USER
The calculation of OPEX could be significantly affected if the site buys solar heat to an independent owner
and energy provider. Another situation that should be taken into account is if the solar plant is included in
the site technical staff scope.

 14/45
Document: D2.3. Key Performance Indicators to evaluate the integration of solar heating in industrial
 processes
 Author: CEA Version: 1
 Reference: D2.3 SHIP2FAIR ID GA 792276 Date: 14/11/18

4. TECHNICAL INDICATORS
The different KPIs are listed in the following sections. Figure 4-1 shows who is usually in charge of supply
inputs, end-user or solar system provider, and who is the most concerned by the KPI.

 4.1. TOTAL SOLAR ENERGY PRODUCTION

 Figure 4-1. Links between Inputs and ‘’Total Solar Energy Production’’ KPI

This refers to the gross thermal power delivered by the solar field. This KPI can be expressed in two forms:
an absolute value and a specific value. Concerning the specific value, it can be referred to the solar field area
(see below).

 4.1.1. Total solar energy production: absolute value
A thermal power counter with an integration function is able to give delivered energy during a sampling time.
Cumulating this energy over a given period gives an accurate indicator about collected solar heat. The
method of measurement depends on the collectors' technology. In the case of a liquid heat carrier (Figure
4-2, flat collectors), a single flowrate with inlet and outlet temperature measurements give the instant
thermal power, to be integrated. Calculation is done according to equation 1.

 Figure 4-2. Solar field, liquid heat carrier

 ESE = ṁ hc . Cp. (Tout − Tin ). dt (1)

ESE: delivered solar energy over period dt, kWh (1 kWh = 3.6 MJ)
ṁ hc : heat carrier flowrate, kg·s-1
Cp: mean heat carrier specific heat capacity, J·kg-1·K
Tout: temperature at solar field outlet, K

 15/45
Document: D2.3. Key Performance Indicators to evaluate the integration of solar heating in industrial
 processes
 Author: CEA Version: 1
 Reference: D2.3 SHIP2FAIR ID GA 792276 Date: 14/11/18

Tin: temperature at solar field inlet, K
dt: sampling period, s
If the solar field is used to produce steam directly (Figure 4-3), it is fed by pressurized liquid water and after
partial vaporization and separation of the remaining liquid fraction, saturated steam is supplied to the
process. In this case, thermal energy is calculated from enthalpy balance, according to equation 2.

 Figure 4-3. Solar field, direct steam production

 = �� ̇ , − ̇ , �. ℎ , + ̇ , . ℎ , − ̇ , . ℎ , �. (2)

ESE: delivered solar energy over period dt, kWh (1 kWh = 3.6 MJ)
ṁ , : inlet liquid water flowrate, kg·s-1
ṁ , : outlet liquid water flowrate, kg·s-1
hS,out: steam enthalpy at separator outlet, J·kg-1
hW,out: water enthalpy at separator outlet, J·kg-1
hW,in: water enthalpy at solar field inlet, J·kg-1
dt: sampling period, s
The calculation of enthalpies assumes that temperature and pressure sensors are available at the solar field
inlet and outlet.

For both cases, the reference period will be one year. The scope of application is the solar field itself,
excluding a possible thermal storage. The degree of accuracy of this KPI must be high. According to equation
1, Table 4-1 gives an example of error propagation from each parameter to ESE, in the case of water at low
temperature as liquid heat carrier.
 Table 4-1 Error estimation for liquid water heat carrier

 Parameter Reference value Parameter error ESE absolute deviation ESE relative deviation
 ̇ kg/s 1.2 2% 0.004 kWh 2.0%
 Inlet temperature °C 80 0.2°C 0.003 kWh 1.3%
 Outlet temperature °C 95 0.2°C 0.003 kWh 1.3%
 Sampling time s 10 0.05 s 0.001 kWh 0.5%
 ESE calculated value kWh 0.21 - - 5.1%

The error to be expected about ESE value is about 5%.

Table 4-2 gives the same evaluation for a solar saturated steam generator at 8 bars (other demonstration
sites).

 16/45
Document: D2.3. Key Performance Indicators to evaluate the integration of solar heating in industrial
 processes
 Author: CEA Version: 1
 Reference: D2.3 SHIP2FAIR ID GA 792276 Date: 14/11/18

 Table 4-2 Error estimation for saturated steam heat carrier

 Parameter Reference value Parameter error ESE absolute deviation ESE relative deviation
 ̇ , kg/s 0.45 2% 0.063 kWh 2.2%
 ̇ , kg/s 0.045 (10% of ṁ , ) 2% 0.006 kWh 0.2%
 Condensate return 0.03%
 60 0.2°C 0.001 kWh
 temperature °C
 Steam temperature °C 170 0.5°C 0.0 kWh 0.03%
 Sampling time s 10 0.05 s 0.014 kWh 0.5%
 ESE calculated value kWh 2.98 - - 3.0%

It will not be possible to expect an error less than 3% to determine ESE.

 4.1.2. Total solar energy production: specific value
Delivered solar energy per unit of occupied surface is calculated, considering that no room remains available
for another use. This takes into account the effective area occupied to deliver a given thermal energy. This
can give recommendation for duplicated projects, keeping in mind that this depends strongly on location,
collector's technology and integration, and on temperature of thermal power supply. Reference period for
this indicator must be large, at least one year.

Equation (3) is a suggestion for the calculation.
 (3)
 =

Es: delivered solar energy per unit surface over the reference period, kWh/year
ESE: delivered solar energy over the reference period, kWh/year
Sref: two surfaces maybe defined,
 Soccupied: overall area occupied by collector's field, m²
 Scollector: gross area of the solar collector for stationary solar field (or mirror area for the CSP), m²

Using the overall surface of the solar field allows to compare two technologies in term of occupied area.
Using the gross area of the solar collector allows to compare two suppliers with a same technology, for
example two kinds of solar flat collectors. Of course, these comparisons suppose same temperature and solar
resource.

 17/45
Document: D2.3. Key Performance Indicators to evaluate the integration of solar heating in industrial
 processes
 Author: CEA Version: 1
 Reference: D2.3 SHIP2FAIR ID GA 792276 Date: 14/11/18

 4.2. SATISFACTION OF REQUIRED TEMPERATURE LEVEL(S)

 Inputs KPI

 End-user Provider End-user

 Real onsite solar
 Space available Solar plant
 resource
 Technical

 SATISFACTION OF
 REQUIRED TEMPERATURE
 LEVEL(S)
 Thermal demand Temperature
 Thermal storage
 profile demand profile

 Figure 4-4. Links between Inputs and ‘’Satisfaction of required temperature level(s)’’ KPI

Although the required temperature level(s) does not characterize the performance of the solar unit, it is
important to check if it is able to supply thermal energy at a suitable temperature level. When used only as
preheating, temperature level of solar energy always meets the need as the solar unit is in series with a
conventional heating system. Only a target of preheating energy to reach can be defined. When the solar
plant is used in parallel of a conventional heater, if the thermal power is not always available at required
level, it will not be used and then it will be probably lost. This indicator can be defined by the fraction of time
with solar heat available at the required temperature level. The reference period can be days covering one
year. Equation (4) proposes a method of calculation of temperature availability.

 Figure 4-5. Parameters for the calculation of the temperature level(s)

 @ 1 @ 2 @
 1 = 2 = …. = (4)

τ1, τ2, τn: fraction of time with heat available at accurate temperature for process 1, 2,… n
TP1…n: required temperature for process 1 to n
 @ 1.. : duration of heat supply at accurate temperature for process 1 ton, hours
tsolar: duration of solar field in service, hours
The scope of application of this indicator is the whole solar system, including thermal storage if any.

As time measurements are the only input of this indicator, its precision is high. A source of error may result
of the estimation of solar temperature matching with the required process one.

 18/45
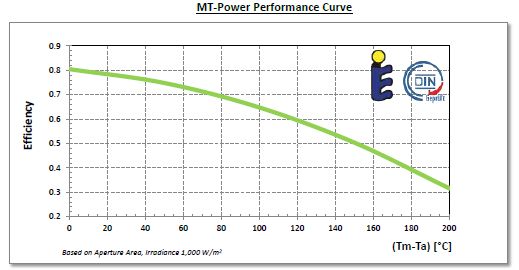
Document: D2.3. Key Performance Indicators to evaluate the integration of solar heating in industrial
 processes
 Author: CEA Version: 1
 Reference: D2.3 SHIP2FAIR ID GA 792276 Date: 14/11/18

 4.3. SOLAR OVERALL EFFICIENCY

 Inputs KPI

 End-user Provider End-user Provider

 Total solar energy
 Real onsite solar production
 Space available Solar plant
 resource
Technical

 Thermal demand Temperature
 Thermal storage
 profile demand profile
 SOLAR OVERALL
 EFFICIENCY

 Figure 4-6. Links between Inputs and ‘’Solar overall efficiency’’ KPI

The combination of GNI/DNI, ambient conditions, characteristics of solar field and delivered solar energy
allows to calculate overall solar efficiency which is done over a long time period for the field itself, including
or not thermal storage. Value for instant, or short time efficiency is useful to check if collectors' characteristic
is the expected one. Mean efficiency over a long period - i.e. a year - characterizes global operation giving a
rough idea about thermal energy able to be collected for a given site over the period.

However, normalization procedures for solar thermal efficiency assessment, for extended technologies as
flat plate collectors, have been developed during last years, and registered and updated in the corresponding
UNE standards in Europe. Figure 4-7 gives an example of the efficiency curve for a flat vacuum solar collector.

 Figure 4-7. TVP collector efficiency

 19/45
Document: D2.3. Key Performance Indicators to evaluate the integration of solar heating in industrial
 processes
 Author: CEA Version: 1
 Reference: D2.3 SHIP2FAIR ID GA 792276 Date: 14/11/18

This thermal efficiency can be defined as the ratio of collected energy and incident energy, according to
equation (5):
 (5)
 ∫0 ℎ ( )
 =
 ∫0 ( )

T: duration of the period considered, days, month or year
Pthermal: thermal power delivered by the solar field. This power can be evaluated at the solar field level or at
the solar installation level (solar field + storage…), kW, MW
ϕsolar: solar resource on the solar field. For the calculation of this resource, it is necessary to take into account
the orientation of the collector, the shading... The reference area is the gross area for the stationary collectors
(flat, ETC…) and the mirror area for the CSP collectors, kW, MW.

 4.4. THERMAL POWER SIMULTANEITY
Availability of thermal power at the right temperature level must meet thermal demand. This can be
completed by the use of thermal storage. Simultaneity can be measured for both cases: with and without
thermal storage. The percentage of operation time when both match can be a good indicator calculation. A
ponderation by amount of heat demand may be useful to highlight those periods with high demand being
more important than periods with low demand. The level of mismatching would help to analyse the adequate
dimension for the solar thermal storage.

 Figure 4-8. Required and supplied thermal power

To calculate this indicator, required and supplied thermal power (P, p inFigure 4-8) must be known or
measured. For above example, the average thermal power is calculated for each step:

 1 0 + 1 1 0 + 1 + 2 + 3 (6)
 1 = �
 ��� ( ) ;
 ���2 = ; 3 =
 ��� � ( )
 1 0 3 0 + 1 + 2

Simultaneity can be defined by the ratio of duration fully satisfying the required thermal power:
 2 (7)
 =

 20/45
Document: D2.3. Key Performance Indicators to evaluate the integration of solar heating in industrial
 processes
 Author: CEA Version: 1
 Reference: D2.3 SHIP2FAIR ID GA 792276 Date: 14/11/18

When supplied thermal power satisfies only partially or fully the required power, a second indicator can be
calculated for the period:
 ∑ 1 . (8)
 =
 min( . ; ∑ 1 . )

CF: time fraction at full thermal power satisfied, dimensionless
CP: time fraction at full or partial thermal power satisfied, dimensionless
P: required thermal power, kW or MW
 � : averaged thermal power over period ti, kW or MW
p(t): instant thermal power, kW or MW
ti: period duration, hours
T: duration of required thermal power, hours

 4.5. THERMAL STORAGE EFFICIENCY
In case of using thermal storage, thermocline or steam heat storage, its efficiency can be considered as a
relevant indicator. For a given time period including a significant charge/discharge number of cycles, i.e. over
one full year, it can be defined as the ratio of thermal energy output and thermal energy input. This gives a
good idea of the overall efficiency of the thermal storage. This suppose that power or energy counting has
been implemented in the system, with an accurate sampling rate (i.e. some minutes).

 Figure 4-9. Thermocline thermal storage, inputs and ouputs

For a thermocline thermal storage, overall thermal efficiency ( ) can be calculated with equation
(9). This is the ratio between the energy delivered by the storage during discharging and the energy delivered
to the storage during charging:

 ∑ 1 ̇ℎ , . . � , , − , , �. Δ (9)
 =
 ∑ 1 ̇ℎ , . . ( , , − , , ) . Δ

 ̇ℎ : thermal storage heat carrier flowrate, kg·s-1
Cp: mean heat carrier specific heat capacity, J·kg-1·K
∆t: time step, s

 21/45
Document: D2.3. Key Performance Indicators to evaluate the integration of solar heating in industrial
 processes
 Author: CEA Version: 1
 Reference: D2.3 SHIP2FAIR ID GA 792276 Date: 14/11/18

Tin,C: temperature of heat carrier at thermal storage inlet during charging, K
Tin,D: temperature of heat carrier at thermal storage inlet during discharging, K
Tout,C: temperature of heat carrier at thermal storage outlet during charging, K
Tout,D: temperature of heat carrier at thermal storage outlet during discharging, K
i: index of time step during discharging
j: index of time step during charging

It is worth noting that the storage efficiency depends on the technology and kind of storage, where is placed
in the plant, on the dynamic factors of the plant (temperature and flow, depending in turn on demand and
solar supply) and also on a static factor, namely the insolation. Equation (9) can be use in the case of a sensible
heat storage associated with a solar field using a liquid heat carrier (Figure 4-2). In the case of solar field
producing steam (Figure 4-3), the associated storage maybe more complex (multi-stages storage, steam
storage…), equation (9) is no more applicable, but the KPI remains the same : ratio between the energy
delivered by the storage and the energy delivered to the storage. The detailed definition depends on the
storage system.

 4.6. THERMAL STORAGE EFFICACY
This KPI is used to evaluate the efficacy of the thermal storage in order to:

 • Evaluate if the proper storage is in place
 • Evaluate the part of the solar energy which is stored

This indicator is calculated as the ratio between the energy delivered by the thermal storage and the energy
delivered by the solar plant over a given period (net energy delivered to the processes).
 ∑ 1 ̇ℎ , . . � , , − , , �. Δ (10)
 =
 ,

 ̇ℎ : thermal storage heat carrier flowrate, kg·s-1
Cp: mean heat carrier specific heat capacity, J·kg-1·K
∆t: time step, s
Tin,D: temperature of heat carrier at thermal storage inlet during discharging, K
Tout,D: temperature of heat carrier at thermal storage outlet during discharging, K
i: index of time step during discharging
Esolar,net: net solar energy delivered by the solar plant to the processes over the period, kWh (1 kWh = 3.6
MJ)
As in §4.5, equation (10) needs to be adapt in the case of a solar field producing steam.

 4.7. VOLUMETRIC ENERGY DENSITY
The concept of thermal storage efficiency could be also seen as the energy saved thanks to storage that
otherwise would have been lost, in a time basis (i.e. one cycle, one week, or one year of operation) depending
on the production process. This is the volumetric energy density (Ev ).

This indicator is calculated as the ratio between all the energy that has been delivered by the thermal storage,
which otherwise would have been just released to the environment or wasted, divided by the volume of the
overall thermal storage system able to recovered the heat (i.e. heat exchanger, water/steam accumulation

 22/45
Document: D2.3. Key Performance Indicators to evaluate the integration of solar heating in industrial
 processes
 Author: CEA Version: 1
 Reference: D2.3 SHIP2FAIR ID GA 792276 Date: 14/11/18

tank, or any other thermochemical or latent heat storage system). It can be measured in kWh/m3 or
MJ/m3and it is calculated according to equation (11):

 ∑ 1 ̇ℎ , . . ( , , − , , ) . Δ (11)
 Ev =
 V

Ev : volumetric energy density, MJ/m3 or kWh/m3
 ̇ℎ : thermal storage heat carrier flowrate, kg·s-1
Cp: mean heat carrier specific heat capacity, J·kg-1·K
∆t: time step, s
Tin,C: temperature of heat carrier at thermal storage inlet during charging, K
Tout,C: temperature of heat carrier at thermal storage outlet during charging, K
j: index of time step during charging
VTESs: Volume of TES system, m3

 4.8. STORAGE BY SOLAR SURFACE RATIO
This ratio aims at defining ratio between the volume of the thermal storage system and the surface of the
solar collector field, according to equation (12). This KPI is applicable to sensible heat storage.

Given an energy density for a specific storage technology, higher ratios mean that there is a clear necessity
of storage during the operation, since it is needed to store the energy generated by the solar field.
Conversely, if the ratio is low, it means that the overall process requires almost all the solar energy generated.
 (12)
 =

 : ratio between the thermal storage volume and the solar collector surface, m3/ m2
VTESs: volume of TES system, m3
Sref: two surfaces maybe defined,
 Soccupied: overall area occupied by collector's field, m²
 Scollector: gross area of the solar collector for stationary solar field, m²

 4.9. ADDITIONAL SPECIFIC ENERGY CONSUMPTION (OR COP)
This is the electric consumption of additional pumps and other auxiliaries which are necessary for the
operation of the SHIP. Since the solar may include storage, the reference period for this indicator must be
large, at least one month and ideally one year. The COP (Coefficient of Performance) can be expressed as the
ratio between the energy delivered by the solar plant (solar field and storage) to the process and the electrical
consumption of the solar plant.

 ∑ 1 ̇ℎ , . . � , − , �. Δ (13)
 =
 ∑ 1 ( ) . ∆

 ̇ℎ , : heat carrier flowrate at process inlet during step i, kg·s-1
Cp: mean heat carrier specific heat capacity, J·kg-1·K
∆t: time step, s

 23/45
Document: D2.3. Key Performance Indicators to evaluate the integration of solar heating in industrial
 processes
 Author: CEA Version: 1
 Reference: D2.3 SHIP2FAIR ID GA 792276 Date: 14/11/18

Tin,i: temperature of heat carrier at process inlet, K
Tout,i: temperature of heat carrier at process outlet, K
Was: power to solar plant auxiliaries during time step i, W

 4.10. EXTENDED ENERGY SAVING RATE

 Inputs KPI

 End-user Provider End-user

 Real onsite solar
 Space available Solar plant
 resource
 ADDITIONNAL SPECIFIC
 Technical

 ENERGY CONSUMPTION
 Thermal demand Temperature
 Thermal storage
 profile demand profile

 Additional power
 consumption

 Figure 4-10. Links between Inputs and ‘’Extended energy saving rate’’ KPI

The extended energy saving rate is defined as bellow. It characterizes the share of final energy consumption
saved by the use of solar energy. This calculation must be made for a large period, typically month or year.
 (14)
 +

 ∑

 , = 1 −

 +

 ∑

Cas: thermal fossil energy consumption with the solar plant, kWh
Css: thermal fossil energy consumption without the solar plant, kWh
Was: power consumption of the auxiliaries with the solar plant, kWh
Wss: power consumption of the auxiliaries without the solar plant, kWh
EEpi: energy expense over period i kWh
ηel: power generation and transmission efficiency. Typically, 1 kWhelec. = 2.58 kWhtherm. 1/2.58 = 0.39 but this
efficiency needs to be adapted to each country and site characteristics.

The objective is to maximize Fsav,ext.

 24/45
Document: D2.3. Key Performance Indicators to evaluate the integration of solar heating in industrial
 processes
 Author: CEA Version: 1
 Reference: D2.3 SHIP2FAIR ID GA 792276 Date: 14/11/18

 4.11. OVERALL EQUIPMENT EFFECTIVENESS

 Inputs KPI

 End-user Provider End-user

 Real onsite solar
 Space available Solar plant
 resource
 OVERALL EQUIPMENT
 Technical

 EFFECTIVENESS
 Thermal demand Temperature
 Thermal storage
 profile demand profile

 Additional power
 consumption

 Figure 4-11. Links between Inputs and ‘’Overall equipment effectiveness’’ KPI

The integration of SHIP, including or not thermal storage, will lead to additional maintenance operations or
troubleshooting to be supported by the end-user. This should be transparent and without any impacts and
consequences on the solar plant process. A good way to survey this parameter is the overall equipment
effectiveness: it is the ratio, over a given period, between the time period during which the solar field is really
operated and the time period during which the solar field is supposed to be operated (regarding the
availability of solar resource). This indicator can be used to survey the solar plant during its 20 years (or more)
of exploitation. This ratio should be equal to 1. A decrease of this ratio should lead to a detailed analysis:
maintenance operation to improve, degradation of the solar field…
 (15)
 ̇
 ∫0 ( > 0)
 =
 ∫0 ( > , )

T: duration of the period considered, typically month or year
ϕsolar: solar heat flux measured, W/m²
ϕsolar, ref: solar heat flux which allow to operate the solar file, typically 50-100 W/m²
Vsolar field: volume flow measured in the solar field, any unit

 25/45
You can also read