U.S. Power Sector Outlook 2021 - Rapid Transition Continues To Reshape Country's Electricity Generation - Institute for Energy ...
←
→
Page content transcription
If your browser does not render page correctly, please read the page content below
Dennis Wamsted, IEEFA Energy Analyst                                                      1
Seth Feaster, IEEFA Data Analyst
David Schlissel, IEEFA Director of Resource Planning Analysis
March 2021

U.S. Power Sector Outlook 2021
Rapid Transition Continues To Reshape Country’s
Electricity Generation
Executive Summary
The scope and speed of the transition away from fossil fuels, particularly coal, has
been building for the past decade. That transition, driven by the increasing adoption
of renewable energy and battery storage, is now nearing exponential growth,
particularly for solar. The impact in the next two to three years is going to be
transformative.

In recognition of this growth, IEEFA’s 2021 outlook has been expanded to include
separate sections covering wind and solar, battery storage, coal, and gas—
interrelated segments of the power generation sector that are marked by vastly
different trajectories:

   •   Wind and solar technology improvements and the resulting price
       declines have made these two generation resources the least-cost
       option across much of the U.S. IEEFA expects wind and solar capacity
       installations to continue their rapid rise for the foreseeable future, driven
       not only by their cost advantage but also by their superior environmental
       characteristics.

   •   Coal generation capacity has fallen 32% from its peak 10 years ago—and its
       share of the U.S. electricity market has fallen even faster, to less than 20% in
       2020. IEEFA expects the coal industry’s decline to accelerate as the
       economic competition from renewables and storage intensifies;
       operational experience with higher levels of wind and solar grows; and
       public concern about climate change rises.

   •   Gas benefitted in the 2010s from the fracking revolution and the assumption
       that it offered a bridge to cleaner generation. IEEFA believes that the “gas
       bridge” has now been closed. The rise of wind and solar, plus the linked
       development of battery storage, has given utilities an option to largely
       bypass gas. In addition, growing evidence about methane emissions—a
       powerful greenhouse gas—throughout the gas production, distribution and
       consumption chain has undercut its previous environmental claims. IEEFA
       concludes that the sharp rise in gas-fired capacity (specifically combined
       cycle units) in the 2010s has reached a plateau.

This year’s outlook also includes a section on the significant expansion in power
sector applications of battery storage. Little more than a demonstration-scale
technology four years ago, utility scale storage installations topped the 1 gigawatt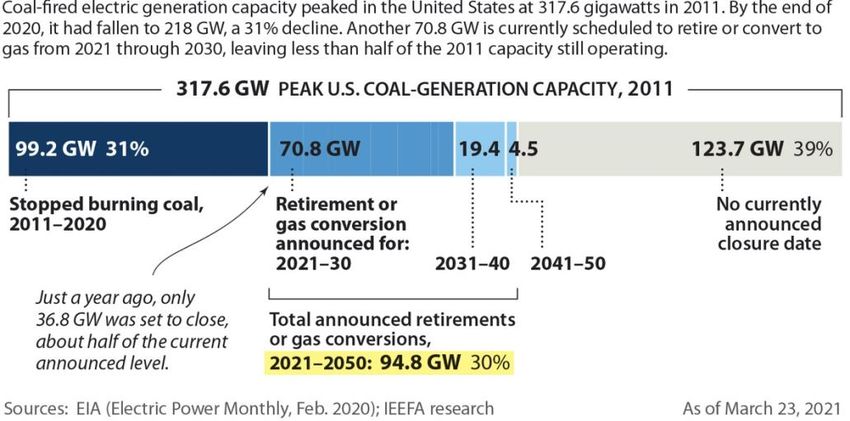
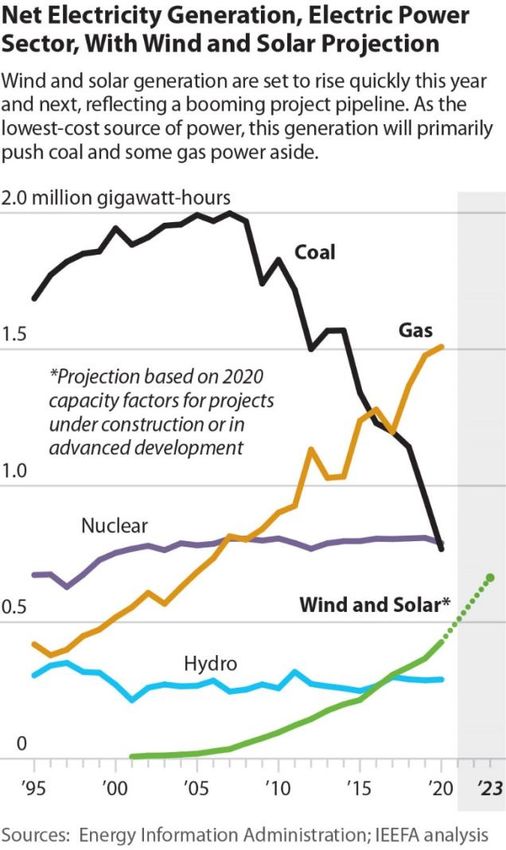
2021 Power Sector Outlook
The Rapid Reshaping Continues                                                                  2

mark this year and are pegged to jump to almost 6 GW annually by 2025.1 These
developments, currently largely using four-hour duration lithium batteries, give
utilities the ability to store wind and solar generation when it is not needed and use
it during periods of peak demand. As one utility executive has described it, this
enables “solar after sunset.” IEEFA expects the coming surge in battery storage
deployment to further undercut the economics of both coal and gas-fired
generation, speeding future fossil retirements.

On top of these market-driven changes, it is clear
the new Biden administration is going to take a
much more aggressive policy approach over the
next four years to quickly push the U.S. electricity
sector to be less carbon-intensive. In her first
speech, Energy Secretary Jennifer Granholm said:
“The Department of Energy is one of our
government’s most fighting forces as we pursue
the goal of a carbon-pollution free country. We
have to add hundreds of gigawatts to the grid
over the next four years. It’s a huge amount. And
there’s so little time.”2

The Energy Information Administration expects
a slight upward bounce in coal generation in
2021 due to higher gas prices, but even if that
does happen, IEEFA’s analysis indicates that it
will be a short-lived reprieve, with coal’s
downward trajectory resuming toward the end
of the year or early in 2022. We projected last
year that coal’s share of the U.S. generation
sector could drop to 10% by 2025; that scenario
still appears realistic.

Longer term, coal will be pushed out of the
electricity sector completely, with gas set to
decline as well. Cleaner and lower-cost wind and
solar, coupled with battery storage, will drive
fossil fuels out of the market. Furthermore, the
high levels of investment pouring into research
and innovations in storage and hydrogen suggest
that the competitive pressure on fossil fuels will
only increase.

1 Energy Storage Association. US energy storage market shatters quarterly deployment record.
March 3, 2021.
2 Department of Energy. Remarks as Prepared for Delivery by Secretary of Energy Jennifer

Granholm. March 3, 2021.
2021 Power Sector Outlook
The Rapid Reshaping Continues                                                                                                                         3

 Table of Contents
 Executive Summary ............................................................................................................... 1
 Rapid Rise of Renewables ................................................................................................... 4
 Battery Storage Breaks Into the Big Leagues ............................................................10
 Continued Contraction of Coal ........................................................................................17
 Gas Reaches a Plateau .........................................................................................................24
 Developments to Watch .....................................................................................................27
 About IEEFA............................................................................................................................30
 About the Authors ................................................................................................................30

 Table of Figures
 Figure 1: Renewables Top Coal as Biggest SPP Generation Source ................... 7
 Figure 2: Wind and Solar Generation Climbing Quickly in MISO ........................ 8
 Figure 3: MISO, PJM Interconnection Queues Dominated by Solar, Wind ...... 9
 Figure 4: Battery Storage Installations To Climb Sharply in Next Five
 Years ..........................................................................................................................................10
 Figure 5: NextEra Energy's Battery Storage Cost Estimates ...............................11
 Figure 6: LBNL - Added Cost of Battery Storage ~$10/MWh ............................12
 Figure 7: California ISO Monthly Wind and Solar Curtailments ........................16
 Figure 8: Plant Scherer Annual Capacity Factor (%) .............................................17
 Figure 9: Retirement Forecast to 2030 Shows Continued Decline in Coal ...19
 Figure 10: Wind Was the Largest Source of Electricity in SPP in 2020 ..........20
 Figure 11: The Status of U.S. Coal Plant Retirements ............................................22
 Figure 12: Combined Cycle Gas Plants Hit a Plateau in ERCOT .........................26
 Figure 13: ISO-New England Energy Forecast..........................................................27
2021 Power Sector Outlook
The Rapid Reshaping Continues                                                                            4

Rapid Rise of Renewables
The speed of the growth in the renewable energy sector—limited here to wind and
solar—and the scope of future increases are difficult to convey.

Installed wind capacity has doubled since 2012, and installed solar capacity has
doubled just since 2016. 3 The result of this rapid growth is utility-scale wind and
solar accounted for more than 10% of total U.S. electricity generation in 2020 for the
first time. Looking ahead, this is just the start of a transition that is rapidly
accelerating, driven by sharp declines in cost, stricter environmental regulations for
coal generation and mounting public concern about climate change.

On the wind side, there are 34,757 megawatts (MW) of new capacity in what
America Clean Power calls the near-term development pipeline; half is already
under construction and should be commercially operational in the next two years.
The coming increases in solar are even more pronounced. The Solar Energy
Industries Association projects that approximately 54 gigawatts (GW) of new utility-
scale solar will enter commercial operation by the end of 2023—doubling the
53.4GW of existing capacity.

These near-term capacity additions will
exacerbate the already serious economic
threats facing fossil fuel generators,
particularly in the coal sector. Already, coal
resources are finding it hard to compete.                        “It’s an economics
Chris Beam, president of Appalachian                             decision,” he said.
Power, told lawmakers in West Virginia                          “These units are no
recently that the company’s proposal to                        longer economical.”
close the 1,560MW Mitchell coal plant in
2028 was based solely on cost. “It’s an
economics decision,” he said. “These units
are no longer economical.”4

Jim Robo, chief executive of renewables giant NextEra, made the same point on the
company’s January earnings call to discuss the company’s 2020 results: "There is
not a regulated coal plant in this country that is economic today full period and stop
when it’s dispatched on any basis, not a single one, OK."5

Together, this new capacity, coupled with an equally steep increase in the amount of
battery storage (which is covered in greater detail beginning on p. 10), is reshaping

3 Unless otherwise noted, solar in this analysis refers to utility-scale installations. Rooftop solar,
both residential and commercial applications, is also a rapidly growing segment of the market.
Adding it would boost solar and wind’s share of 2020 electricity generation to 11.7% from 10.6%.
4 Mountain State Spotlight. W.Va. lawmakers remain desperate to prop up the dying coal industry.

Residents are paying the cost with higher electric bills. March 11, 2021.
5 NextEra Energy. CEO Jim Robo on Q4 2020 Results – Earnings Call Transcript. January 26, 2021.
2021 Power Sector Outlook
The Rapid Reshaping Continues                                                                     5

the U.S. electricity sector, raising the possibility of a quicker-than-expected
transition away from fossil fuels to cleaner renewable generation resources.

The Texas Example
The transformation in the Electric
Reliability Council of Texas (the grid                       The Texas Freeze
operator responsible for distributing
most of the electricity consumed in              The catastrophic events in Texas from Feb.
the state) is indicative of the changes          14-19 revealed a series of interrelated
under way across the electric sector.            problems that will take time to fully
                                                 understand. During the height of the event,
At the end of 2011, installed wind
                                                 the ERCOT grid operator lost more than
capacity in ERCOT was 9,603MW.
                                                 35,000MW of fossil fuel generation, but
That capacity generated 28.3 million
                                                 there is still uncertainty as to how much of
megawatt-hours (MWh) during the
                                                 the capacity shut because units were directly
year, accounting for 8.5% percent of
                                                 affected by the freezing weather, and how
ERCOT’s electricity demand. By
                                                 much was unable to secure gas that was
contrast, natural gas and coal both
                                                 needed to keep operating. Gas producers,
generated more than 130 million
                                                 suppliers and utilities are still at odds over
MWh that year, supplying 40.4% and
                                                 what happened.
39% of ERCOT’s electricity needs,
respectively. Even nuclear                       Lessons from earlier winter storms,
outperformed wind, producing 39.6                particularly one in 2011, appear to have
million MWh and meeting 11.9% of                 been largely ignored; the most notable
the market.6                                     omission was a recommendation for strong
                                                 winterization efforts.
Fast forward to the end of 2020, and
the situation had changed                        Finally, there have been calls to restructure
dramatically. The total amount of                ERCOT’s energy-only market, but significant
installed wind capacity in ERCOT                 changes are unlikely to happen for months.
climbed to 25,121MW, more than
two times higher than 2011. That                 While the outcome of the investigations and
capacity generated 87.1 million MWh              reviews is uncertain, IEEFA believes that
during the year, making wind, with a             because they are the least-cost generation
22.8% market share, the second-                  option, the rapid buildout of wind and solar
largest electricity resource behind              energy across ERCOT will continue
gas, which supplied 45.5%. In                    unabated.
contrast, coal generation dropped to
68.5 million MWh, accounting for
17.9% of the generation in ERCOT.

ERCOT’s forecasts show continued growth in wind capacity over the next three
years, with another 13,554MW in its near-term development pipeline. Almost half of
that total is already built but not yet cleared for full commercial operation. Much of
the remainder is in advanced development, meaning most of it will be online by
2023.

6   ERCOT’s generation data can be found here.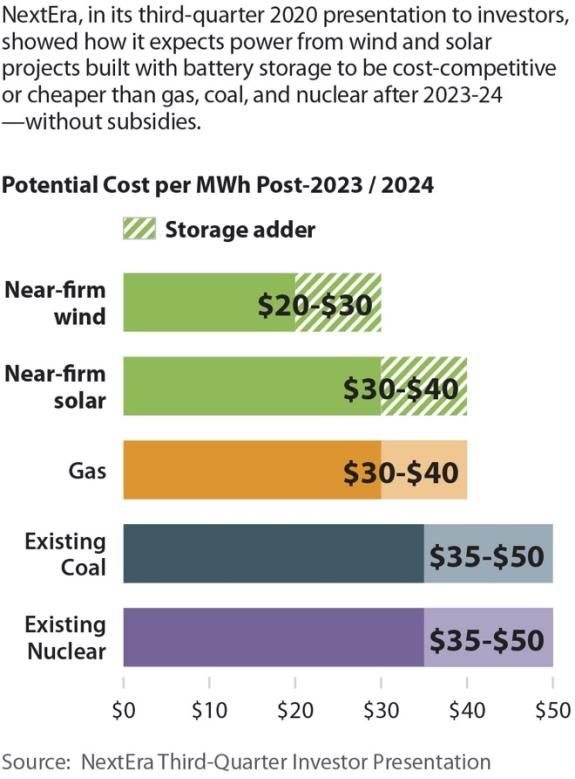
2021 Power Sector Outlook
The Rapid Reshaping Continues                                                                        6

This means that by the end of 2023, wind generation can be expected to climb by
approximately 47.5 million megawatt-hours (MWh).7 This would be an increase of
more than 50% from 2020’s total, significantly raising the economic threat to fossil
fuel generators in ERCOT.

Total demand in ERCOT in 2020 amounted to 381.9 million MWh, roughly
unchanged from the 384.1 million MWh level recorded in 2019. If we assume that
the state returns to the 2.1% average electricity growth it posted from 2010 to
2019, this would push ERCOT electricity demand to roughly 406.5 million MWh in
2023, an increase of 24.6 million MWh.

Putting the calculations together, the new wind capacity will cover the expected
growth and continue eating away at the market share of ERCOT’s fossil fuel
generators—to the tune of at least 20 million MWh.

And then there is the ERCOT solar market. Solar is still a small factor in the system,
but it is growing exponentially. Installed capacity rose to almost 4,000MW by the
end of 2020, with generation climbing to 8.7 million MWh and accounting for 2.3%
of ERCOT demand. This amounted to a doubling in market share in a year—a
growth rate that is likely to continue in the near term.

Current ERCOT estimates show that
12,259MW of solar capacity is expected
online by the end of 2021, and anywhere
from roughly 18,000MW to 25,500MW                        The potential growth in
could be in service by the end of 2023.                 solar and wind generation
Following the same steps outlined earlier,              poses a serious threat for
we estimate the capacity factor of ERCOT’s                  ERCOT’s fossil fuel
solar capacity was 25.1% in 2020.8 Using
this estimate yields some impressive
                                                                generators.
increases in solar generation in the next
three years.

Assuming current forecasts are accurate, ERCOT’s solar output in 2022 will climb to
at least 26.9 million MWh—pushing solar’s market share in ERCOT to more than
6%. Similarly, with installed capacity expected to total 17,265MW by the end of
2022, total solar generation in 2023 should top 37.9 million MWh, which would
boost solar’s market share to more than 9%. These calculations are conservative, as
they are based on the lower end of the solar capacity in the ERCOT generation
queue.

7 We calculated wind’s average capacity factor using ERCOT’s 2020 year installed capacity of
25,121MW and the region’s yearly production of 87.1 million megawatt-hours. 8,784 (total
hours) x 25,121 = 220,662,864 (total maximum production). 87100000/220662864=39.5%.
Since the entire 25,121MW of capacity was not online for the full year, we rounded up to 40%.
8 It was almost certainly higher than this since almost 1,700MW of solar capacity was added

during the year; had that capacity been operating all year, total solar generation would have been
higher, raising the overall capacity factor.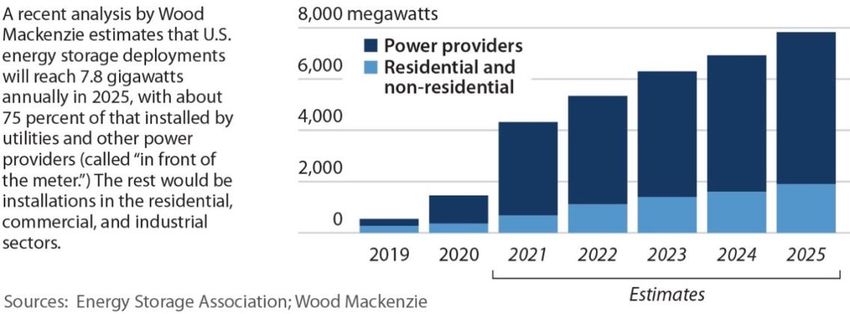
2021 Power Sector Outlook
The Rapid Reshaping Continues                                                            7

The potential growth in solar and wind generation poses a serious threat for
ERCOT’s fossil fuel generators. If the projected growth in these two resources
continues as projected, even after accounting for systemwide demand increases,
there will be roughly 60 million MWh of additional, zero-fuel-cost electricity
available in the ERCOT market in 2023. Those electrons are going to push out other
resources, almost certainly coal and gas. Here, it is worth remembering total coal-
fired generation in ERCOT in 2020 was 68.5 million MWh; by 2023 most of that
generation, or a comparable amount of gas, could be pushed out of the market.

In addition, the expected increase in wind and particularly solar generation is likely
to keep ERCOT energy market prices under control during the high-demand
summer months, cutting into the profits previously earned by coal and gas
generators during these peak periods. Battery storage, which is beginning to play a
bigger role in ERCOT, will only exacerbate these trends for fossil fuel generators by
enabling renewable generation to be stored during periods of peak output (the 11
a.m. to 2 p.m. period for solar in the summer, for example) and then used later in
the day when demand for electricity rises.

A Broader View
The Texas transition will not be replicated precisely in other areas of the country,
but the broad themes are certainly going to hold true, particularly the surge in new
wind and solar generation through 2024.

For example, installed wind capacity in the Southwest Power Pool (SPP) grew
almost tenfold from 2008 to 2020, climbing from 2,750MW to more than
27,000MW. As a result of this rapid growth, wind was the leading source of
generation in SPP in 2020, topping both coal and gas for the first time.

Figure 1: Renewables Top Coal as Biggest SPP Generation Source

Source: Southwest Power Pool.
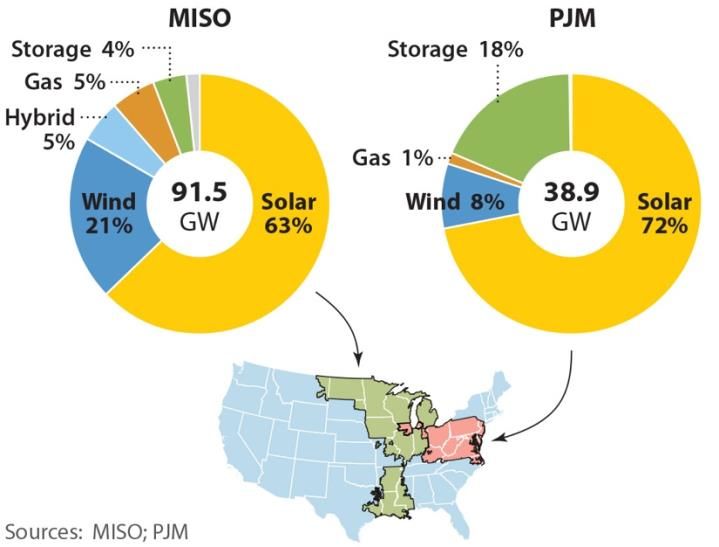
2021 Power Sector Outlook
The Rapid Reshaping Continues                                                              8

And significantly more renewable generation capacity is on the way in the region:
As of late January, more than 80GW of wind and solar generation were in SPP’s
active generator interconnection queue. Developers are also proposing 8.8GW of
battery storage, a key technology for firming the availability of wind and solar, in the
region. In contrast, only a small portion of the proposed generating capacity in the
development queue is gas-fired and none is coal-based.

Similarly, wind has grown dramatically as a resource within the footprint of the
Midcontinent Independent System Operator (MISO), with installed capacity growing
from 7,625MW in 2009 to more than 24,000MW in 2020.

Figure 2: Wind and Solar Generation Climbing Quickly in MISO

Source: MISO.

And, as in SPP, significantly more wind and solar capacity is in both the MISO and
PJM project development queues.
2021 Power Sector Outlook
The Rapid Reshaping Continues                                                              9

Figure 3: MISO, PJM Interconnection Queues Dominated by Solar, Wind

Not all this capacity will get built in the next several years, but the queues show that
the capacity that is built will almost certainly be renewable, which (as with the
Texas example above) will heighten the economic pressure on existing fossil fuel
generation resources. Adding to this pressure is the likelihood that the growth in
renewable generation will outpace growth in U.S. electricity demand, which has
been essentially flat for the past decade.

Further, most of the U.S. has plenty of excess power generation capacity. For
example, SPP is awash in excess capacity, with a reserve of 31 percent above the
actual peak load in 2019.9 This is far more than the 12 percent reserve margin in the
region’s planning criteria. PJM forecasts that its summer peak reserve margins will
range between 32% in 2021 and nearly 36% in 2024. 10 Finally, MISO’s peak demand
in the summer of 2020 was 117GW,11 8.5% below the region’s all-time peak set in
2011 and significantly below the 152GW of capacity available to MISO operators.12
Thus, as new no-fuel-cost resources come online, existing fossil fuel resources are
going to be hard hit.

9 Southwest Power Pool. SPP 2019 State of the Market Report. May 11, 2020, p. 225.
10 PJM. PJM Forecasted Reserve Margins. 2020.
11 Potomac Economics. IMM Quarterly Report: Summer 2020. September 15, 2020, p.2.
12 MISO. 2020 Summer Readiness Workshop. April 28, 2020, p. 5.
2021 Power Sector Outlook
The Rapid Reshaping Continues 10
Battery Storage Breaks Into the Big Leagues
U.S. battery storage installations topped 1 GW in 2020 for the first time, and that is
just the beginning of what is projected to be a dramatic increase through 2025.
The latest Standard & Poor’s forecast projects that 15,000MW of utility-scale energy
storage will be put into service by the end of 2023. 13 The Energy Storage Association
(ESA) is similarly bullish, estimating that annual energy storage additions will jump
to more than 4,000MW in 2021 from 1,464MW in 2020, and climb steadily from
there to 7,830MW in 2025. Of those totals, ESA said, roughly three-quarters are
expected to be utility-scale installations.14
Figure 4: Battery Storage Installations To Climb Sharply in Next Five Years
These numbers point to two key developments:
• Rapidly falling costs, like those posted in the wind and solar sectors in the
2010s, are quickly making energy storage economically competitive across a
range of applications.
• Utility executives from across the industry are increasingly comfortable with
the technical capabilities of energy storage, using it as a capacity resource, a
peak reduction tool and a transition tool away from gas.
Compelling Economics
Five years ago, battery storage was a niche product with limited applications, either
as a standalone unit or linked with solar and/or wind. Today, rapidly falling costs
and expectations of continued declines have changed the discussion, opening
markets for storage across the board.
13 Standard & Poor’s Global Market Intelligence. The 2021 U.S. Renewable Energy Outlook.
January 2021.
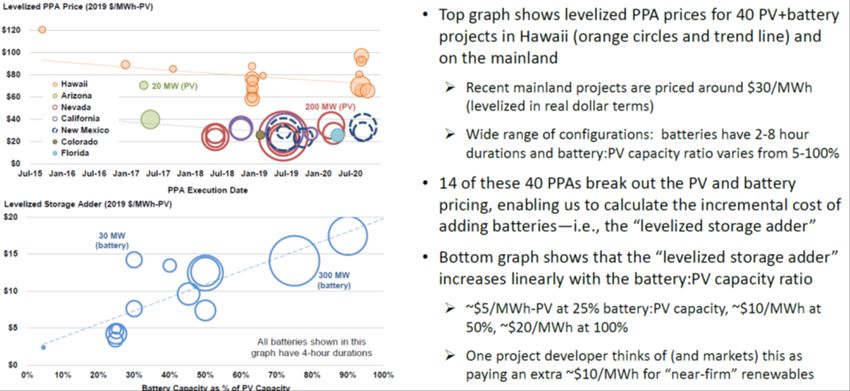
14 ESA/Wood Mackenzie. U.S. Energy Storage Monitor Q4 2020, p. 9.2021 Power Sector Outlook The Rapid Reshaping Continues 11 NextEra, the largest renewable energy developer in the country, now uses the term near-firm renewables because of its ability to pair battery storage with its conventional wind and solar projects, and still compete on price with existing coal and new gas (see figure below). 15 Figure 5: NextEra Energy's Battery Storage Cost Estimates It is important to note these estimates are subsidy-free costs. NextEra expects to be able to compete on price even without the extension of the existing production tax or investment tax credits, or the creation of a storage tax credit, which is currently being discussed in Congress. Indeed, the economics are so compelling that NextEra estimated in its yearend 2020 financial presentation that it would install between 4,350MW and 6,300MW of battery storage capacity through 2024. An analysis of recent solar-plus-storage power purchase agreements conducted by Lawrence Berkeley National Laboratory (LBNL) reached essentially the same conclusion, as the figure below illustrates. The costs of storage go up as the size of the battery increases, LBNL said, but in the most common configuration (a battery 50% the size of the linked solar project), the price adder amounts to roughly $10/MWh. 15 Full presentation is available here.
2021 Power Sector Outlook
The Rapid Reshaping Continues                                                             12

Figure 6: LBNL - Added Cost of Battery Storage ~$10/MWh

Source: Lawrence Berkeley National Laboratory16

While those figures already make solar-plus-storage economically competitive, costs
are almost certain to decline in the years ahead. In December 2020, the Department
of Energy launched a storage challenge to cut costs across the board. One of its key
goals is to reach a levelized cost of storage for long-duration stationary applications
of $0.05/kWh by 2030. According to DOE’s estimates this would be a 90% cost
reduction; using Lazard’s latest estimates for late 2020, it would amount to about a
60% cut from current costs. In either case, reaching the $0.05/kWh goal would
further speed the transition from fossil fuels.

Coupled with this, the department set a goal in February 2021 of pushing PV costs
down to $0.03/kWh by 2025 and $0.02/kWh by 2030. Hitting both the solar and
long-duration storage cost goals would be a game changer.

A Growing Number of Applications
The examples that follow illustrate the broad sweep of current applications for
battery storage and its adoption by utilities and other companies of all sizes, from
some of the sector’s smallest to the largest.

Plus Power and ISO-New England’s Capacity Market
Plus Power’s win in ISO-New England’s latest forward capacity auction is one of the
most telling developments for energy storage in the past year. The California
company was successful with two bids in the auction, one a 150MW/300MWh

16   Full presentation can be found here.
2021 Power Sector Outlook
The Rapid Reshaping Continues                                                             13

storage facility that will be built south of Boston, the second a 175MW/350MWh
project to be built in Maine. The auction was for capacity beginning in 2024.

According to the company, this is the first time a standalone battery storage unit has
won a capacity contract in the region. The prices bid by Plus Power almost certainly
undercut those of a conventional fossil fuel option, and did so without subsidy
support.

The project south of Boston is particularly interesting. It is in the same transmission
zone as Exelon’s aging gas-fired Mystic Power Station, which is currently scheduled
to close in 2024. Plus Power’s new battery storage project would cover 10 percent
of the closing station’s peak capacity. Also, the new storage facility is being built
where the transmission lines from Massachusetts’ currently planned offshore wind
projects, Vineyard Wind and Mayflower Wind, are expected to make landfall.

Green Mountain Power’s Peak Reduction Program
In Vermont, Green Mountain Power has been running a successful effort to cut its
power demand during ISO-New England’s peak load periods, saving ratepayers
more than $5 million in the past three years.

The program began in 2016 and now has about 2,700 participants. Customers can
participate by bringing their own battery storage device into the program, in which
case they receive a credit from the utility, or have GMP install two Tesla Powerwalls
at their home, for which they pay a monthly fee over 10 years. The key to the
program is that customers agree to let the utility use the batteries during peak
periods to lower the utility’s demand on the ISO-NE system.

Utilities in New England are subject to two
charges from ISO-NE. The first, essentially a
capacity charge, is based on each company’s
peak demand during the region’s annual
peak demand hour. The amount of this
charge is derived from the region’s forward        The savings have grown
capacity market. The second charge, a fee              as the number of
covering the use of regional network              participants has increased.
services, is based on a utility’s demand
during the monthly peak transmission hour
in its state. Cutting demand during those
periods enables GMP to reduce costs for all
its ratepayers.

GMP first demonstrated its ability to lower these costs in 2016, tapping into a small
solar-plus-storage microgrid that it built to provide backup power for an emergency
shelter in Rutland. That summer, GMP used the microgrid—which includes 2MW of
solar PV capacity and 4MW/3.4MWh of battery storage—to cut its demand during
2021 Power Sector Outlook
The Rapid Reshaping Continues                                                                    14

the region’s peak demand hour on Aug. 12 by two megawatts. The reduction saved
the utility’s customers $200,000. 17

The savings have grown as the number of participants has increased and the
company says it saved roughly $3 million in the first three quarters of 2020. In
addition to these savings, the battery storage units provided 16,000 hours of backup
power during the first nine months of the year.18

Small Co-Op Sees Big Potential for Battery Storage
The Northeastern Rural Electric Membership Corporation (NREMC) in Indiana
announced in late December that it was teaming up with FlexGen to deploy
108MWh of battery storage across its territory over the next five years. The co-op
plans to install batteries at each of its five substations, with a total capacity of
31MW. The first two batteries are scheduled for completion by this summer.

NREMC said the storage projects will save $35 million over the next two decades,
primarily by enabling it to reduce transmission costs from PJM during summer peak
hours. In addition, the batteries will allow the co-op to provide backup power for a
portion of its members during system outages.

Eric Jung, the co-op’s chief executive, says the batteries will pay for themselves by
2027 and he is optimistic those savings will be even higher than estimated. “We feel
the savings assumptions are conservative. The value presented to us today is
already greater than the additional costs, and this will only rise as transmission and
capacity costs increase,” he said.19

“We wish we had it [the batteries] in a year ago!”20

Enabling the Transition Away From Gas
Florida Power and Light’s Manatee battery storage project is designed to replace the
power provided by the utility’s aging gas-fired facility at the same location. The two
steam turbines at the gas plant have a generating capacity of 1,618MW, but for the
past decade have been used almost exclusively during peak demand periods. Since
2011, the plant’s annual capacity factor has never exceeded 17.8% and has been at
or below 10% in four years—making the facility a perfect candidate for battery
storage replacement.

Construction on the battery project, which will be 409MW/900MWh, began in
January and is scheduled for completion by the end of the year. The batteries are

17 Green Mountain Power. GMP’s Solar Storage Project Becomes First in New England to use Solar
Battery Storage to Reduce Peak Demand. October 24, 2016.
18 Green Mountain Power. GMP’s Energy Storage Programs Deliver $3 Million In Savings for All

Customers During 2020 Energy Peaks. September 29, 2020.
19 NRECA. Battery System Will Save Indiana Co-op Millions in Power Costs. January 13, 2021.
20 Ibid.
2021 Power Sector Outlook
The Rapid Reshaping Continues                                                             15

being built adjacent to an existing 74.5MW solar facility, allowing the unit to be
charged with zero fuel-costs.

FPL says the project will save utility customers more than $100 million in avoided
fuel costs over its operating lifetime compared to keeping the gas units online. It
also will reduce the utility’s carbon dioxide emissions; from 2011 to 2019, the gas
plant emitted an average of 1.3 million tons of CO2 annually.

Vistra’s Big Bet on Battery Storage Capacity
Vistra said in early January that it had begun commercial operations at its Moss
Landing Energy Storage Facility in California. The facility, now sized at
300MW/1200MWh, is currently the largest operating battery storage facility in the
world, and expansion plans are already in process. The company says it is adding
100MW/400MWh to the project, with the goal of getting the additional capacity up
and running by August to help meet summer peak demand.

The company has a long-term contract to supply the capacity from the storage
facility to Pacific Gas & Electric. The project is reusing the structures of the former
gas plant at the site, the two-unit, 1,404MW Moss Landing station that was closed in
2017. The company says the site could support further expansion, up to a previously
unheard-of 1,500MW/6,000MWh, but that would require long-term contracts for
the capacity.

One thing is clear: There will be plenty of excess solar most of the year to help
charge the system. In December, the California ISO reported that the system had
curtailed 48,217MWh of solar generation, and as the figure below makes clear,
curtailments topped 100,000MWh in six months in 2020.
2021 Power Sector Outlook
The Rapid Reshaping Continues                                  16

Figure 7: California ISO Monthly Wind and Solar Curtailments

Source: California ISO website.
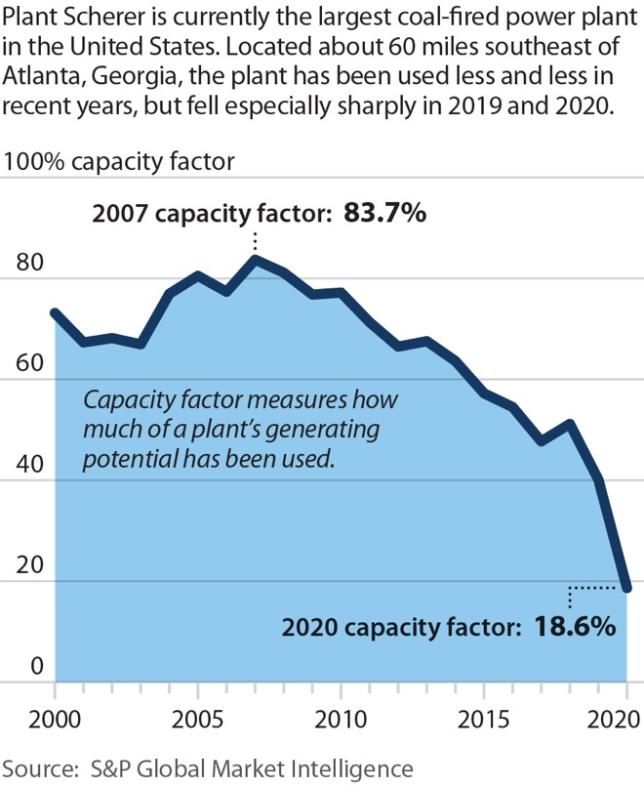
2021 Power Sector Outlook
The Rapid Reshaping Continues                                                            17

Continued Contraction of Coal
The nation’s largest coal-fired power plant, the four-unit, 3,440MW Scherer station
in Georgia, posted a 2020 capacity factor of just 18.6%—a stunning drop from the
already low 40% capacity factor recorded by the plant in 2019.

Figure 8: Plant Scherer Annual Capacity Factor (%)

The results at Scherer are far from unique: The overall capacity factor of the
222.6GW of operating coal-fired capacity in the U.S. dropped to 40.2% in 2020. 21
The result caps a decade-long downward trend. In 2011, the 317.6GW of operating
coal capacity posted an overall capacity factor of 67.1 percent; fast-forward to 2019,
and that had fallen to 47.5 percent, even as the amount of operating capacity
tumbled to 235.1GW.

In other words, even as the fleet has gotten smaller, it has been needed less. Another
way of looking at this trend is the sharp decline in the number of plants operating at
high capacity factors, coupled with the significant rise in the number of plants
operating below the industry average. In 2020, there were 455 operating coal-fired
units in the U.S. larger than 50MW. Of that total, only 13 posted a capacity factor

21   EIA. Electric Power Monthly. February 2021.
2021 Power Sector Outlook
The Rapid Reshaping Continues 18
above 80%; while 60 had capacity
factors below 10%; 103 had capacity Even the Best Performing Coal Plants
factors below 20%; and 233 had Are at Risk
capacity factors below 40%.22
Even being among the best operating coal-fired
This declining performance is generators doesn’t guarantee that a unit is
important as it increases the cost of a financially viable or is the lowest-cost option for
unit’s output by requiring it to spread consumers.
fixed costs over a smaller number of
kilowatt-hours of production. Given Five of the 16 coal units with the highest average
that coal is increasingly competing annual capacity factors between 2016 and 2020 are
against resources with zero fuel costs, currently scheduled by their owners to be retired
any cost increase further widens the by 2025. These include Coal Creek Units 1 and 2
competitive gap between the two, to and AES Hawaii, planned to be closed in 2022, and
coal’s detriment. Naughton Unit 1 and 2, which PacifiCorp plans to
retire in 2025.
IEEFA expects this growing
performance gap to widen. Some Great River Energy, the owner of Coal Creek, has
plants (but a steadily shrinking explained that the decision to retire the plant “was
number) probably will be able to based on economics and done in the best interests
maintain a high level of performance, of our member-owner cooperatives.”1
but most of the rest will continue to
see their generation decline, lowering Another of the top performers is Longview Power,
their capacity factors and which emerged in August 2020 from its second trip
undercutting their economic viability. into bankruptcy.
This will be driven by several
Finally, Bonanza Unit 1 and Rawhide Unit 1, both
interrelated factors: The continued
top performers, are now slated for closure in 2030.
surge in wind and solar capacity
However, as we have seen in recent years,
coming on to the grid in the next two
announced plant retirements are frequently
to three years; the rapid rise in
accelerated into earlier years.
battery storage installation; continued
price drops in both sectors; flat 1Great River Energy. Plant closure, renewable plans
demand growth; and expectations of detailed at industry event. October 14, 2020.
relatively low natural gas prices.
The Retirement Forecast
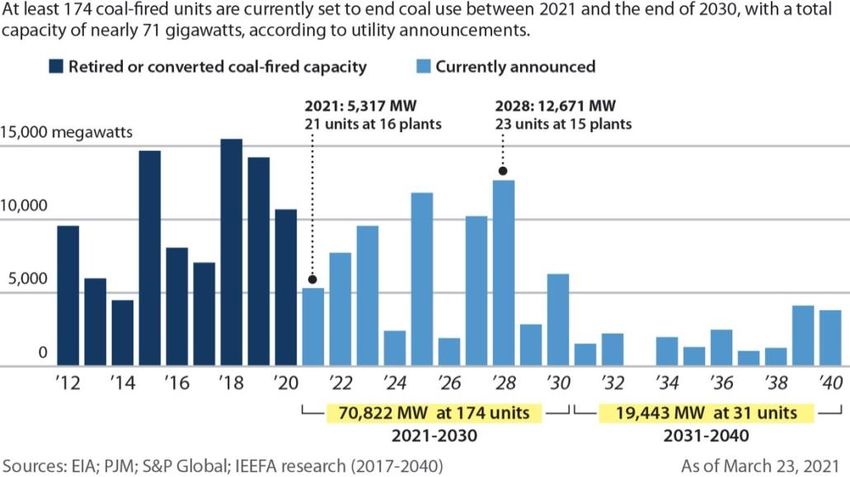
The numbers have been changing quickly in the past several months, but there are
at least 70.8GW of coal capacity already slated for retirement by 2030, cutting our
current estimate of that year’s total installed coal capacity to roughly 150GW—well
under half the peak total in 2011. While significant, IEEFA believes the amount of
capacity currently scheduled for retirement is just the starting point and that the
amount of coal-fired capacity that will be retired in the coming decade is going to
climb sharply. These adjustments will come as the current round of utility planning
work is completed using updated, lower-cost figures for renewable energy and
battery storage; the likelihood that public concern about climate change and desire
22 EIA Form 923 data downloaded from S&P Global Market Intelligence on March 8, 2020.2021 Power Sector Outlook The Rapid Reshaping Continues 19 for cleaner energy will increase; and the Biden administration’s push for a net-zero electricity grid. Figure 9: Retirement Forecast to 2030 Shows Continued Decline in Coal While IEEFA expects the transition to speed up in the coming two to three years, major changes are already taking place. The generation trends in the Southwest Power Pool in 2020 demonstrate that clearly. For the first time since the transmission operator was established, coal was not the largest source of electricity in the SPP service territory in 2020. Instead, wind took the top spot in the sprawling, 14-state system that stretches from North Dakota to the Texas Panhandle. For the year, wind generated 31.4% of the electricity in SPP, topping the 30.9% produced by coal. The results capped a decade-long transition in the region (see figure below) in which the amount of installed wind capacity jumped fivefold, from roughly 5,000MW in 2010 to more than 27,000MW in 2020. In turn, that pushed the output of wind generation to almost 82,000 gigawatt-hours (GWh) from 10,000GWh in 2010.
2021 Power Sector Outlook
The Rapid Reshaping Continues                                                            20

Figure 10: Wind Was the Largest Source of Electricity in SPP in 2020

This shift, while both dramatic and swift, is just a precursor for a broader move
away from fossil fuels in the region, to be driven by a coming influx of additional
wind, new solar and battery storage.

For example, according to SPP data, solar accounted for just 0.2% of the system’s
generation in 2020. But there is now more than 36,000MW of proposed solar
capacity in the SPP generation interconnection queue.23 If even one-third of that
planned capacity comes online in the next five years, that will add significantly to
the economic hurdles facing the region’s fossil fuel generators. Using 25.1% as the
estimated solar capacity factor (see pp. 5-6 for details), 12,000MW of solar capacity
can be expected to generate roughly 26,400GWh of electricity annually. In 2020,
total SPP generation was 262,000GWh, meaning solar soon could account for 10%
of the region’s total electric demand.

This new solar will be paired with still more
wind; there are almost 40,000MW of
proposed wind capacity in the SPP generation
queue. The capacity factor for the region’s
existing wind units was roughly 37.5% in
                                                          The threat to coal is clear:
2020; if we assume that 15,000MW of the                   More than 75,000GWh of
wind capacity in the queue is built, that would              clean, zero-fuel-cost
add another 49,000GWh of wind-generated
                                                            generation is likely to
energy to SPP’s annual electric output by the
mid-2020s.                                                  enter the SPP market.
Coal’s output in both 2019 and 2020 was
roughly 81,000GWh.

The threat to coal is clear: More than 75,000GWh of clean, zero-fuel-cost generation
is likely to enter the SPP market in the next several years. And even the “renewables
are variable” trope will be muted in the years to come, with the presence of more

23   SPP. SPP 101: An Introduction to Southwest Power Pool.
2021 Power Sector Outlook The Rapid Reshaping Continues 21 than 9,600MW of battery storage projects in the SPP queue. Coal will not win that economic competition. Maintenance Retirements, Zombie Closures Another development becoming increasingly clear in the coal sector is, for lack of a better term, the maintenance retirement. What this boils down to is simple: Coal plants are increasingly uneconomic in the market, so any new cost can push them out. Indiana utility Nipsco, for example, announced in February that it would retire Units 14 and 15 at the R.M. Schahfer Generating Station by the end of 2021. The company had previously said it was going to retire the units, which have a total capacity of 903MW, in 2023, but a fire at the facility in late 2020 would have required some costly maintenance, effectively forcing the earlier retirement. "As we continue to evaluate the economics of our generating fleet and the ongoing costs and investments required to keep the coal units operational, we determined that the right path forward for us is to initiate the retirement of two of the four coal units at Schahfer," NiSource Chief Strategy and Risk Officer Shawn Anderson said on the company's fourth-quarter 2020 earnings call. "Units 14 and 15 will retire by the end of 2021, which is the most economic decision for our customers." 24 In January, Florida’s Lakeland Electric said it was going to close Unit 3 at its C.D. McIntosh generating station in March 2021, almost three years earlier than planned. The decision to close the 342MW coal-fired unit, the muni said, will save customers $13.1 million.25 "It makes no sense to continue spending money on coal-based operation past March," said Joel Ivy, the utility’s general manager.26 A similar development is the zombie closure. In the past several years, there has been a significant rise in the number of coal-fired plants remaining technically available, but operating so sporadically as to justifiably be dubbed zombie units— alive, but not really. As with the maintenance examples above, however, costs eventually drive the decision-making process to close the plant. Here, Duke Indiana’s Gallagher station is a prime example. The company agreed in 2015 to close the remaining two units, each with 140MW of generating capacity, at the plant by the end of 2022. From 2016 to 2019, the two units posted an average capacity factor of just 8.4%, falling to just 1.6% in 2020. In February, the company announced it would close the two units in June—18 months ahead of the deadline. Duke spokesperson Angeline Protogere said: “In 24 S&P Global. NiSource Q4 Earnings Call. February 17, 2021. 25 The Ledger. Lakeland Electric touts $13.1M savings by shuttering Unit 3 early. January 5, 2021. 26 Ibid.
2021 Power Sector Outlook
The Rapid Reshaping Continues                                                            22

recent years, it's been operating at a much limited capacity. And so it was more of an
economic decision and we decided to retire it by June 1.”27

IEEFA expects an increase in these announcements, as companies acknowledge that
additional investments in their aging coal plants no longer make economic sense
and/or admit that the unit’s capacity is no longer needed given the surge in new
wind and solar generation resources, battery storage and flat demand growth that
are quickly changing grid dynamics.

Figure 11: The Status of U.S. Coal Plant Retirements

The Reality of Net Zero
Pressure is building rapidly for utilities and merchant power plant owners to
address climate change concerns. Since 2018, at least 35 utilities and independent
power producers have embraced climate change policies that generally call for
reaching a net-zero target by 2050. Those decisions were made at lightning speed
given the generally cautious nature of the utility sector, and it is likely many
executives believed making that pledge would reduce the need for major action in
the near term. That is clearly not the case, with climate change concerns mounting
and a new administration supportive of strong action to cut carbon emissions.

IEEFA expects these mounting pressures to pull already-announced coal-fired
power retirements dates forward and push other companies that haven’t acted at all
to begin the transition to a zero-carbon future.

DTE Energy embraced net-zero carbon emissions for the electric side of its company
in September 2019. As part of that plan, the utility said it would be closing the
1,270MW Belle River coal plant in 2030 and its last coal plant, the 3,086MW Monroe
facility in 2040. CEO Jerry Norcia said: “We are doing as much as we can, as fast as

27   WFYI. Duke Energy To Retire Gallagher Coal Plant Early. February 25, 2021.
2021 Power Sector Outlook
The Rapid Reshaping Continues                                                                     23

we can, to provide our customers and the state of Michigan with clean energy that is
affordable and reliable.”

Last month, answering a question on its 2020 yearend earnings call, Norcia said: “As
you know, we still have a very large coal operation. And currently, we’re forecasted
to retire our Belle River Power Plant … in 2030. So, we’re looking at ways to
accelerate that … and then our Monroe Power Plant … We’re looking at ways to
potentially accelerate the retirement of that up from 2040. So much more to come
on that, but we are deep into that analysis right now.“

Xcel Energy was the first major utility to commit to a 2050 net-zero emissions goal,
but that commitment had not specifically addressed the fate of Comanche 3, its
750MW coal-fired plant in Colorado that only entered commercial operations in
2010. The plant has had serious operational issues since it was built, including being
offline for almost all of 2020, but had not been scheduled for retirement until 2070.
In February, the company released a new plan pledging to retire the plant in 2040
and said it would run at reduced capacity after 2030.28

Importantly, after 2030, Comanche 3 will be
the only coal-fired power plant still
operating in the state of Colorado, making it
extremely likely local advocates will target           After 2030, Comanche 3
the plant and seek to pull the final                  will be the only coal-fired
retirement still closer. Data from a recent           power plant still operating
report by the Colorado PUC staff also show
that the plant already is not the least-cost           in the state of Colorado.
option for Xcel ratepayers during lower
demand months in the fall.

The report, looking into Comanche 3’s performance from 2010 to 2020 following an
almost year-long outage last year found:

“These negative results for the non-summer months raise the question of whether
seasonal operation of Comanche 3 in future years, as well as other coal plants
owned by PSCo with incremental costs above Comanche 3, might be in the public
interest. The results suggest that, had Comanche been operating during these
months, PSCo consumers would have paid more for energy. As such, there may be a
system benefit from taking Comanche 3 offline for economic reasons from
September through December (and potentially other seasons as well).”29

If the plant is already uneconomic at least some of the time in 2020, the likelihood of
it running until 2040 is remote.

It is also worth noting that these changes have occurred at the beginning of the
Biden administration’s tenure. Pressures to move toward a less-carbon intensive
electric grid are only going to intensify in the coming years.

28 Denver Post. Xcel Energy ups ante on cutting greenhouse-gas emissions, pledges 85% reduction
by 2030. February 25, 2021.
29 Colorado Public Utilities Commission. PUC Staff Report. March 1, 2021, p.49.
2021 Power Sector Outlook
The Rapid Reshaping Continues 24
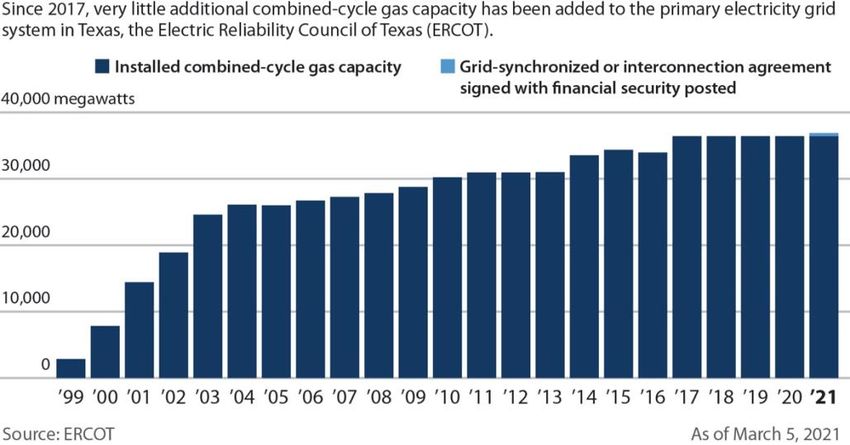
Gas Reaches a Plateau
IEEFA believes that the surge in gas-fired generation capacity that occurred in the
2010s is over, particularly for combined-cycle units.
During the decade, total installed combined-cycle gas capacity climbed by more than
50GW, rising from 224.8GW in 2013 (the first year EIA separately tracked gas
capacity technology, which also includes steam turbines and combustion turbines)
to 276.1GW at the end of 2020. But the signs of a plateau are obvious in the data.
For example, EIA’s 2020 data point to a clear slowdown in the building boom. All
told, the agency lists 29.4GW of combined cycle capacity in some stage of
development. But this number is misleadingly high. Out of that total, just 4.7GW is
under construction. Of the remaining capacity, almost 80% is merchant power,
putting developers at heightened risk of rapidly changing market dynamics and
growing difficulty in securing financial backing for construction.
Of this planned merchant capacity, which amounts to 19.8GW, projects totalling
5.9GW haven’t even begun the regulatory review process where they are located.
More telling, while projects with 11.3GW of capacity have secured the needed
regulatory approvals, none of them have yet begun construction. This almost
certainly points to an inability to secure project financing.
Problematic now, IEEFA believes project
financing is going to become increasingly
difficult to secure as growing climate change
concerns, a more progressive administration,
and lingering over-capacity across the country
shift the flow of funds increasingly toward
wind, solar and battery storage investments. IEEFA believes project
Another indicator of the slowdown in new gas financing is going to
generation can be seen in Lawrence Berkeley become increasingly
National Laboratory’s (LBNL) interconnection
queue data for U.S. power projects. The only
difficult to secure.
region with a significant amount of planned gas
projects is the Southeast, where LBNL showed
that 34.6GW of gas-fired capacity was proposed
as of the end of 2019. Of that, 24.5GW or 71% of
the total, was planned by Duke in either its
Carolina or Florida service territories.
Duke’s massive gas buildout plans, which only began to take shape in 2019 when
the company proposed 15.5GW of new projects, have sparked significant backlash.
IEEFA believes the plans conflict directly with the company’s 2050 net-zero carbon
pledge and would impose significant unjustifiable costs on its ratepayers across the2021 Power Sector Outlook The Rapid Reshaping Continues 25 region.30 Given that virtually all this new capacity is planned for the late 2020s and 2030s, we believe regulators should put a hold on these gas development plans and require the utility to re-evaluate available renewable energy and storage options. Two other barriers to gas projects going forward are likely to take shape over the next several years under the Biden administration. The first is an administration- wide pledge to focus on environmental justice issues. This focus could easily prompt financiers to back away from several existing gas plant proposals, as IEEFA discussed previously in an analysis of two pending projects in Virginia.31 These projects, dubbed C4GT and Chickahominy, are in that group of planned gas plants noted above: They have secured the needed state permits to proceed but are still not under construction. In other words, they haven’t been able to nail down their financing. And investors certainly should take note of the significant issues facing the proposals. They are located in the PJM service territory, which has plenty of existing generation capacity; the plants would have to retire by 2050 due to the state’s 2020 climate change legislation; and they already have sparked an environmental justice backlash, certainly putting them at risk for close evaluation by the current administration. Another threat to future gas generation proposals is the possibility that the Federal Energy Regulatory Commission (FERC) will re-examine its current hands-off approach to the approval of new interstate gas pipelines. Traditionally, the commission has relied on developers to self-certify the need for a project instead of examining the project independently. Under the current system, once a project is certified, a developer can then use eminent domain powers to secure the land needed for the pipeline, greatly speeding the construction process. If FERC becomes more involved in the evaluation process, that could certainly slow future pipeline development efforts, and potentially undercut supplies needed for new gas generation.32 30 IEEFA. IEEFA U.S.: Duke IRPs focus on new gas-fired generation, creating serious stranded- asset risks. January 26, 2010. Also: IEEFA. IEEFA U.S.: Duke IRPs overstate likely future demand growth. February 3, 2021. Also: IEEFA. IEEFA U.S.: Duke Energy’s North Carolina gas IRPs fail to consider battery storage as viable option. February 18, 2021. 31 IEEFA. IEEFA U.S.: Investors would best avoid two proposed Virginia combined-cycle gas plants. December 23, 2020. 32 Ibid.
2021 Power Sector Outlook
The Rapid Reshaping Continues                                                        26

Figure 12: Combined Cycle Gas Plants Hit a Plateau in ERCOT

Finally, there is the example of Texas. The amount of installed combined-cycle gas
capacity grew steadily from 2000-2017, but has remained flat since then. That was
the year installed wind capacity first topped 20,000MW. Wind capacity has now
climbed above 30,000MW and solar is growing rapidly as well. IEEFA expects the
gas plateau to continue in Texas, and spread to other regions.
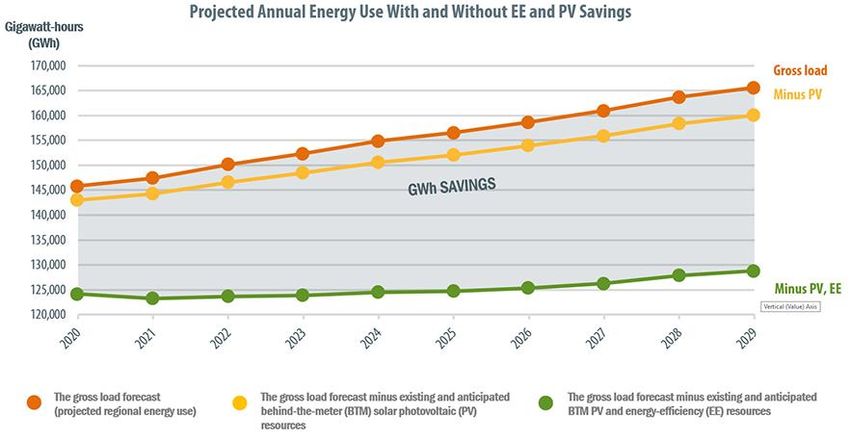
2021 Power Sector Outlook
The Rapid Reshaping Continues                                                           27

Developments To Watch
Offshore Wind, Coming Soon
The Biden administration announced plans on March 29 to install 30GW of offshore
wind capacity in the U.S. by 2030, a move that will have a major impact on the speed
of existing development efforts along the East Coast. Twelve of the fourteen East
Coast states already were working on installing almost 29GW of offshore wind
capacity over the next 15 years, with upward of 6.5GW of that total expected online
by 2025. Now, a much faster rollout is in the offing.

This new resource will have a major impact on future generation needs in coastal
states. In New England, for example, projects with a capacity of 4,044MW have been
contracted and are in various stages of development. It is likely all will be in
commercial operation by the mid-2020s. That new capacity will have the ability to
generate at least 16,000GWh annually. This calculation is based on the results at the
30MW Block Island offshore wind farm, the first such operating facility in the U.S.
The facility’s average capacity factor in the four years since it began operation has
been 44.7%; the new, larger turbines slated for the current developments are likely
to have better performance, but for this calculation we used 45%.

Figure 13: ISO-New England Energy Forecast

Source: ISO-NE

The latest forecast from ISO-New England projects that total demand in the region
will climb from 124,184GWH in 2020 to 128,781 GWh in 2029 (see figure below)—
a 10-year increase of roughly 4,600GWh. In other words, the new offshore wind will
be able to meet that increase and much more. That extra wind capacity will certainly
2021 Power Sector Outlook
The Rapid Reshaping Continues                                                           28

undercut any need for new fossil fuel generation in the region, as well as vying for
market share with existing fossil fuel generators.

Two other factors also need to be considered. First, while ISO-NE is projecting a
small increase in demand in the coming decade, regional demand has fallen in the
past decade, dropping from more than 130,000GWh in 2010. If that trend were to
continue going forward, the impact of the new offshore wind on the regional market
would be even greater. Second, this analysis includes only projects in active
development. If additional projects are added to the active queue, and the federal
permitting bottleneck eases, more capacity could be online by 2030.

Additional projects with at least 7,000MW of planned capacity are in varying stages
of development in New York, New Jersey, Delaware, Maryland, Virginia and North
Carolina.

Offshore wind is still relatively expensive, but the costs have come down
significantly in recent years and new work by the U.S. Department of Energy should
help spur continued reductions. In 2016, the National Renewable Energy Laboratory
pegged the levelized cost of an offshore wind farm in the U.S. at $173 per megawatt-
hour. That estimate assumed that the turbine used in the development would be
4.71 MW.33 The same review in 2018 put the levelized offshore wind cost at
$89/MWh using a 5.5MW turbine and assuming a capacity factor of 48.6%. 34

Now, the department has launched a wind challenge program with the goal of
cutting the cost to $50/MWh by 2030. Here, the advent of significantly larger
turbines is going to help push prices down even without DOE help. Offshore wind
turbine size has more than doubled since the 2018 report, with Siemens Gamesa,
Vestas and GE all introducing 14MW to 15MW turbines that are expected to be
ready for commercial use in the coming buildout.

Another benefit that will drive costs down is the first-time extension of the
investment tax credit to offshore wind farms. This provision, included in the
December 2020 budget reconciliation bill, provides developers a 30% tax credit
through the end of 2025.

The administration’s 30GW by 2030 plan indicates clearly that offshore wind is
going to have a major impact on the grid in the eastern U.S. in the next decade. This
clean electricity needs to be considered by utilities and regulators looking at
projected generation resource expansion in the mid-to-late 2020s.

33   NREL. 2016 Cost of Wind Energy Review. December 2017.
34   NREL. 2018 Cost of Wind Energy Review. December 2019.
You can also read