RELIABILITY, RESILIENCE AND THE ONCOMING WAVE OF RETIRING BASELOAD UNITS - VOLUME I: THE CRITICAL ROLE OF THERMAL UNITS DURING EXTREME WEATHER EVENTS
←
→
Page content transcription
If your browser does not render page correctly, please read the page content below

RELIABILITY, RESILIENCE AND THE
ONCOMING WAVE OF RETIRING
BASELOAD UNITS
VOLUME I: THE CRITICAL ROLE OF THERMAL
UNITS DURING EXTREME WEATHER EVENTS

March 13, 2018

DOE/NETL-2018/1883
Disclaimer

This report was prepared as an account of work sponsored by an agency of the United
States Government. Neither the United States Government nor any agency thereof, nor
any of their employees, makes any warranty, express or implied, or assumes any legal
liability or responsibility for the accuracy, completeness, or usefulness of any
information, apparatus, product, or process disclosed, or represents that its use would
not infringe privately owned rights. Reference therein to any specific commercial
product, process, or service by trade name, trademark, manufacturer, or otherwise
does not necessarily constitute or imply its endorsement, recommendation, or favoring
by the United States Government or any agency thereof. The views and opinions of
authors expressed therein do not necessarily state or reflect those of the United States
Government or any agency thereof.
RELIABILITY, RESILIENCE AND THE ONCOMING WAVE OF RETIRING BASELOAD UNITS

Author List:

National Energy Technology Laboratory (NETL)
Peter Balash, Ken Kern, John Brewer, Justin Adder, Christopher
Nichols, Gavin Pickenpaugh, and Erik Shuster

            All images in this report were created by NETL, unless otherwise noted.

The authors appreciate the comments provided by Jarad Daniels, Angelos Kokkinos,
Anhar Karimjee, and Kristin Gerdes. Technical writing support from Hannah Hoffman
and Robert Wallace, Key Logic, is also appreciated. Any errors remain those of the
authors. As this report addresses recent events at a time of ongoing regulatory review,
NETL welcomes comments from interested parties.
RELIABILITY, RESILIENCE AND THE ONCOMING WAVE OF RETIRING BASELOAD UNITS

                 This page intentionally left blank.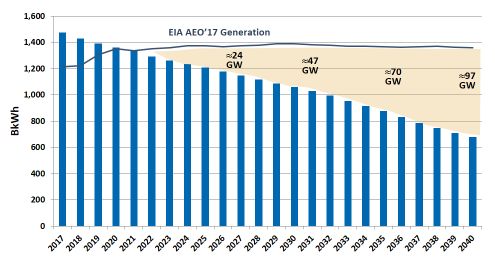
RELIABILITY, RESILIENCE AND THE ONCOMING WAVE OF RETIRING BASELOAD UNITS

TABLE OF CONTENTS
List of Exhibits .....................................................................................................................................ii
Acronyms and Abbreviations........................................................................................................ iii
Key Takeaways ................................................................................................................................ 1
Executive Summary ......................................................................................................................... 3
       The Bomb Cyclone .................................................................................................................. 6
   1.1        Power Generation Resilience ......................................................................................... 9
   1.2        New York and New England ........................................................................................ 10
   1.3        PJM and the “Bomb Cyclone” .................................................................................... 12
   1.4        Six-ISO Summary.............................................................................................................. 18
   1.4 Comparison to the Polar Vortex ....................................................................................... 20
     The Prospect of Further Large-scale Retirements ............................................................. 25
   2.1   Uncertainty in Baseload Retirement Projections ....................................................... 25
   2.2        Alternatives for Reliability and Resilience with Baseload Retirements .................. 31
       Areas of Further Study ........................................................................................................... 34
       References .............................................................................................................................. 35

                                                                           i
RELIABILITY, RESILIENCE AND THE ONCOMING WAVE OF RETIRING BASELOAD UNITS
LIST OF EXHIBITS
Exhibit ES-1. Fuel based generation resilience during the Bomb Cyclone, six ISOs ............. 3
Exhibit 1-1. Average peak hour generation mix, December 27, 2017 to January 8, 2018 . 6
Exhibit 1-2. Regional natural gas spot prices, December 28, 2017–January 8, 2018 ........... 7
Exhibit 1-3. Daily load weighted average marginal electricity price, December 28, 2017–
January 8, 2018 ................................................................................................................................ 7
Exhibit 1-4. Regional natural gas spot prices, 01/01/2016–01/08/2018................................... 8
Exhibit 1-5. Comparison of generation, average December day vs. cold snap, 5 RTOs ... 9
Exhibit 1-6. Fuel oil resilience and renewable output, ISO-NE, Dec 22, 2017–Jan 18, 2018
.......................................................................................................................................................... 10
Exhibit 1-7. Contribution of fuel oil generation to daily peak, ISO-NE .................................. 11
Exhibit 1-8. PJM output December 2017-January 2018, average daily GWh ..................... 12
Exhibit 1-9. PJM coal plant resilience during the Bomb Cyclone ......................................... 13
Exhibit 1-10. PJM nuclear plant performance during the Bomb Cyclone........................... 14
Exhibit 1-11. PJM natural gas generation performance during the Bomb Cyclone ......... 15
Exhibit 1-12. PJM solar and wind generation performance during the Bomb Cyclone ... 16
Exhibit 1-13. Notional resilience value ........................................................................................ 17
Exhibit 1-14. Hypothetical PJM Bomb Cyclone peak hour dispatch without coal ............ 18
Exhibit 1-15. Six-ISO load change comparison December 1-26, 2017 to Bomb Cyclone
(December 27,2017 – January 8, 2018) ..................................................................................... 19
Exhibit 1-16. Fuel resilience to load changes from December 1-26, 2017 to Bomb
Cyclone (December 27,2017 – January 8, 2018) ..................................................................... 19
Exhibit 1-17. Fuel based power generation resilience during the Bomb Cyclone, six ISOs
.......................................................................................................................................................... 20
Exhibit 1-18. Daily peak load, 2014 v. 2018................................................................................ 21
Exhibit 1-19. Peak generation mix comparison, 2014 v. 2018, five-ISO footprint ................ 22
Exhibit 1-20. Regional natural gas spot prices, 2014 vs. 2018 ................................................. 23
Exhibit 1-21. Daily load weighted average marginal electricity price, 2014 vs. 2018 ....... 23
Exhibit 1-22. Natural gas pipeline miles and capacity, 2000-2020 ........................................ 24
Exhibit 1-23. Natural gas pipeline capacity by year - Inflow to Northeast .......................... 24
Exhibit 2-1. Age distribution of baseload units, 2017 ............................................................... 26
Exhibit 2-2. Unit age in 2040, per AEO 2017 ............................................................................... 26
Exhibit 2-3. California solar additions and Palo Verde Prices................................................. 27
Exhibit 2-4. Reduced capacity factors in the Western Interconnect ................................... 27
Exhibit 2-5. Average capacity factor for coal units by age of each units in year of
operation 1998-2017 ..................................................................................................................... 28
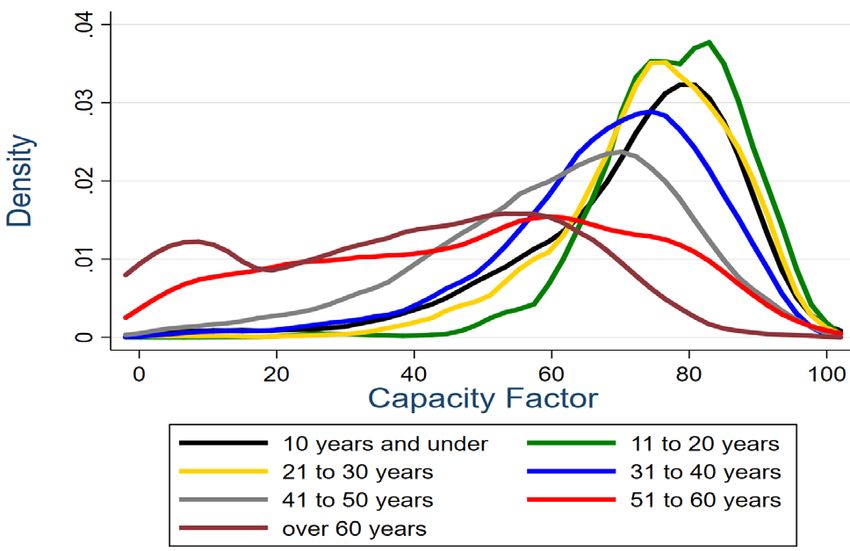
Exhibit 2-6. Kernel density plots of capacity factor by age range (1998 to 2017),
weighted by nameplate capacity ............................................................................................ 29
Exhibit 2-7. Implicit capacity gap due to aging ...................................................................... 30
Exhibit 2-8. Monthly U.S. wind output vs. installed capacity .................................................. 32
Exhibit 2-9. Peak vs. trough wind generation............................................................................ 33
Exhibit 2-10. Monthly wind capacity factors, 2015-2017 ......................................................... 33
iiRELIABILITY, RESILIENCE AND THE ONCOMING WAVE OF RETIRING BASELOAD UNITS
ACRONYMS AND ABBREVIATIONS
BC Bomb Cyclone MMBtu Million Btu
Bcf Billion cubic feet MMcf Million cubic feet
Btu British thermal unit MW, MWe Megawatt electric
DOE Department of Energy MWh Megawatt-hour
EIA Energy Information NERC North American Electric
Administration Reliability Corporation
ERCOT Electric Reliability Council of NETL National Energy Technology
Texas Laboratory
FERC Federal Energy Regulatory NYISO New York ISO
Commission PADD Petroleum Administration for
GWh/d GigaWatt-hours per day Defense District
ISO Independent system operators PJM PJM Interconnection
ISO-NE ISO New England SPP Southwest Power Pool
kWh Kilowatt-hour RTO Regional Transmission
lb Pound Organization
MISO Midcontinent ISO U.S. United States
iiiRELIABILITY, RESILIENCE AND THE ONCOMING WAVE OF RETIRING BASELOAD UNITS
This page intentionally left blank.
ivRELIABILITY, RESILIENCE AND THE ONCOMING WAVE OF RETIRING BASELOAD UNITS
KEY TAKEAWAYS
This study examines the cold weather event now known as the “Bomb Cyclone,” the
winter storm accentuated by a period of deep freeze, blanketing much of the eastern
half of the United States from December 27, 2017 through January 8, 2018. During the
event, the Department of Energy analysis focused on five areas of organized markets
administered by independent system operators (ISOs): ISO New England (ISO-NE), New
York ISO (NYISO), PJM Interconnection (PJM), Midcontinent ISO (MISO), and the
Southwest Power Pool (SPP). [1] Subsequently, analysis has been expanded to include
the Electric Reliability Council of Texas (ERCOT). This report finds:
• Across the six ISOs, coal provided 55% of the incremental daily generation
needed, or 764 out of 1,213 Gigawatt-hours per day (GWh/d)
• Combined, fossil and nuclear energy plants provided 89% of electricity during
peak demand across all the ISOs, with 69% coming from fossil energy plants
(nearly all from traditional baseload a sources)
• Due to natural gas pipeline and delivery constraints, fuel oil provided almost all
the surge capacity in the Northeast, barely enabling ISO-NE, in particular, to meet
demand, as it experienced rapid depletion of its fuel oil storage reserves
• In PJM, the largest of the ISOs, coal provided the most resilient form of
generation, due to available reserve capacity and on-site fuel availability, far
exceeding all other sources (providing three times the incremental generation
from natural gas and twelve times that from nuclear units); without available
capacity from partially utilized coal units, PJM would have experienced shortfalls
leading to interconnect-wide blackouts
• In PJM, the value of fuel-based power generation resilience during this event was
estimated at $3.5 billion
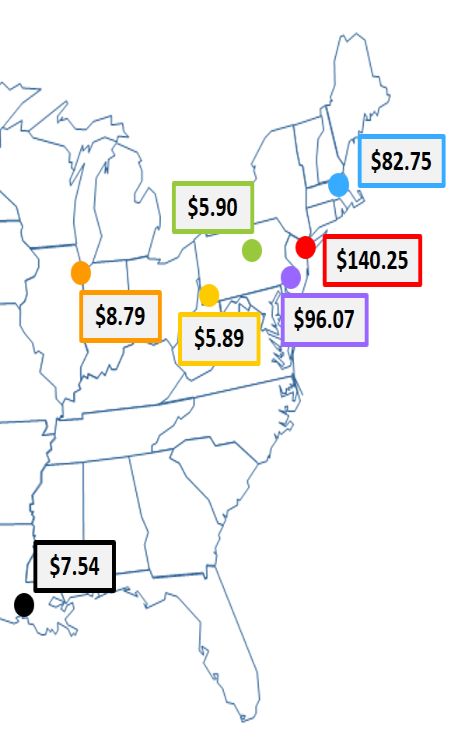
• Lack of sufficient natural gas pipeline infrastructure and the surge in natural gas
demand for heating led to sharp increases in natural gas spot prices exceeding
300% across the Northeast and Mid-Atlantic. The spike was particularly acute in
New York with Transco Zone 6 NY spot prices rising nearly 700% from December
28 ($17.65/MMBtu) to January 5 ($140.25/MMBtu).
• Natural gas prices and availability for power resulted in units with dual-fuel
capability (the ability to use different fuels) playing an important role. Fuel
switching enabled units, which would have otherwise been uneconomic or taken
a For the sake of this report, baseload sources are defined as those that were designed for and have historically
operated at above a 65% annualized capacity factor.
1RELIABILITY, RESILIENCE AND THE ONCOMING WAVE OF RETIRING BASELOAD UNITS
offline due to natural gas prices, to provide resilient capacity by firing fuel oil,
particularly in ISO-NE where in excess of 2 million barrels of oil were burned over
the 12-day period (representing more than 50% of the capacity available under
the ISO’s Winter Reliability Program). An estimated 60% of fuel oil in the Petroleum
Administration for Defense District (PADD) I is directly imported or derived from
imported crude oil
• Nuclear energy, while vital to a stable grid, generally ran at maximum output,
with negligible additional capacity to bring online during this event
• Available wind energy was 12% lower during the Bomb Cyclone than for a typical
winter day resulting in a need for dispatchable fossil generation to make up this
generation in addition to its resiliency role in meeting the greater demand during
the event
• Retirement of aging coal and nuclear generation infrastructure may be
underestimated which could give rise to reliability concerns and an inability to
meet projected electricity demand; however, more study is required to evaluate
the impact
2RELIABILITY, RESILIENCE AND THE ONCOMING WAVE OF RETIRING BASELOAD UNITS
EXECUTIVE SUMMARY
This study examines power plant performance at elevated demand requirements during
the explosive cyclogenesis cold weather event, now known as the “Bomb Cyclone (BC),”
the winter storm that highlighted a period of deep freeze blanketing much of the
eastern half of the United States from December 27, 2017, through January 8, 2018.
Fossil fuels, particularly coal, responded to the system’s needs during this event (Exhibit
ES-1).
Exhibit ES-1. Fuel based generation resilience during the Bomb Cyclone, six ISOs
1,400
Incremental Daily Avg. Generation During BC
1,200
Coal, +764.0;
1,000 +35.7% over early
Dec.
800
(GWh)
600
Oil/Dual Fuel, +300.7;
>> +1,000% over
400 early Dec.
Natural Gas, +245.2;
200 +14.2% over early
Dec.
Nuclear, +63.9; +4.3% over early Dec.
0
Wind, -144.3; -11.9% over early Dec. Other*, -13.2
Hydro, -2.6
-200
Wind Other* Hydro Nuclear Natural Gas Oil/Dual Fuel Coal
* 'Other' includes misc. categories, including other, refuse, solar, diesel, and multiple fuels
During the worst of the storm from January 5-6, 2018, actual U.S. electricity market
experience demonstrated that without the resilience of coal- and fuel oil/dual-firing
plants—its ability to add 24-hour baseload capacity—the eastern United States would
have suffered severe electricity shortages, likely leading to widespread blackouts.
Experience with such blackouts indicates the potentially enormous toll in both economic
losses and human suffering associated with widespread lack of electricity, utilized as the
primary home heating source for nearly 40 percent of U.S. households, and necessary
for running the electric fans of natural gas furnaces, for extended periods. [2] The need
for reasonable compensation to maintain resilient capacity to endure such periodically-
certain threats to the nation formed the basis of the Department of Energy’s (DOE)
resilience compensation proposal to the Federal Energy Regulatory Commission (FERC).
[3] Markets do not currently compensate resilience, and thus that capability is steadily
diminishing due to competitive pressures of ongoing, baseload power plant early
retirements.
3RELIABILITY, RESILIENCE AND THE ONCOMING WAVE OF RETIRING BASELOAD UNITS
FERC has initiated an analysis to define grid “resilience.” and asserts in its January 8
order initiating Docket AD18-7 that “the resilience of the bulk power system will remain
a priority of this commission.” [4] FERC explained
in order to appropriately study the resilience of the bulk power system in the regional
transmission organization (RTO)/independent system operator (ISO) regions, we think it
is appropriate to first achieve a common understanding of what resilience is in the
context of the bulk power system. [4]
Though currently lacking a commonly agreed upon definition of “resilience,” power plant
capacity resilience can be examined during the Bomb Cyclone (hereinafter “BC”) event.
In this report, we examine resilience afforded by each source of power generation by
assessing the incremental daily average gigawatt hours during the BC event above those
of a typical winter day. Across the six RTOs in the eastern half of the United States, coal
exhibited significant resilience and was responsible for 63% of the GWh increase during
the BC event (Exhibit ES-1). Oil/dual fuel, natural gas, and nuclear contributed 25%,
20%, and 5%, respectively. Intermittent renewables experienced reduced overall average
daily contribution to the grid during the BC event.
In the PJM Interconnection (PJM), of the three major sources of electricity generation,
only coal-fired generation exhibited significant resilience in response to the extreme
weather event. As shown in this report, the two major contributors to PJM giga-Watt
hours (GWh) increase during the BC were coal with 74 percent of the increase and oil
(partly from conversion of natural gas units) representing 22 percent. Between the two,
96 percent of the resilience in meeting the extreme BC weather event load were
accomplished with all other forms of generation composing the remaining 4 percent.
While contributions from other forms of generation remained flat or grew, cloud cover
and wind speeds outside of operational parameters caused a reduction in average daily
contribution from intermittent renewables during the BC event, essentially imparting a
resilience penalty to the system. This resulted in a need for dispatchable fossil
generation to make up this generation in addition to its resiliency role in meeting the
greater demand during the event.
Some smaller RTOs reflect little direct reliance on coal-fired generation leading many to
conclude the necessity of dispatchable thermal capacity, particularly coal-fired, no
longer exists for them. However, these systems can be stretched to the limits of current
capacity to endure extreme weather events, needing transfers from larger RTOs (with
significant coal-fired generation, in the case of PJM for NYISO) and heavy reliance on
fuel oil dual fueled units, to provide resilience and electricity supply security. The
limitation of natural gas supply via pipeline for power generation in New York ISO
(NYISO) and ISO New England (ISO-NE) stands out as a key takeaway from the BC event.
ISO-NE, which burned over 2 million barrels of oil during the event, acknowledges that
4RELIABILITY, RESILIENCE AND THE ONCOMING WAVE OF RETIRING BASELOAD UNITS
other generating fuel options must be quickly considered but indicates that added
pipelines to access the abundant natural gas supply from the Marcellus/Utica region is
currently out of consideration. [5]
The low availability of renewables, particularly wind power, in PJM was substantially
more evident in the Midcontinent ISO (MISO), Southwest Power Pool (SPP) and Electric
Reliability Council of Texas (ERCOT) RTOs with declines in wind and solar output during
the BC of 19 percent, 29 percent, and 32 percent, respectively.
Finally, an examination is made of planned and prospective coal and nuclear plant
retirements barring compensation either for resilience value or significant and reliable
baseload supply. The tendency to overestimate the ongoing contribution with age of
these already mature generating assets is also considered. To the extent that electricity
generation projections ignore this factor, the asset replacement scale and lead-time to
maintain a diverse electricity fuel mix will be greatly underestimated.
5RELIABILITY, RESILIENCE AND THE ONCOMING WAVE OF RETIRING BASELOAD UNITS
THE BOMB CYCLONE
From December 27, 2017, to January 8, 2018, a cold weather event—known as the
“Bomb Cyclone” (hereinafter “BC”)—stressed the reliability of the affected areas,
particularly the Mid-Atlantic and the Northeast. During this event, the Department of
Energy asked NETL to assist in monitoring events in a five-ISO area. Periods of high
electricity demand, for example January 4-6, accounted for three of the top ten winter
demand days in PJM Interconnection’s (PJM) history. Coal and nuclear generation,
traditionally considered baseload b, produced nearly three-fifths of the output at peak
across the 5-independent system operator (ISO) footprint over the 12-day period
starting December 28, 2017 (Exhibit 1-1). Prices and natural gas-fired generation output
remained relatively flat in Midcontinent ISO (MISO) and Southwest Power Pool (SPP) due
to plentiful gas supply, but in eastern PJM, ISO New England (ISO-NE), and New York ISO
(NYISO), gas and electric transmission were severely constrained, leading to all-time
high gas prices in New York and elevated natural gas and electricity prices across each
region (Exhibit 1-2 and Exhibit 1-3).
Exhibit 1-1. Average peak hour generation mix, December 27, 2017 to January 8, 2018 c
Oil
Hydro 7%
4%
Coal
38%
Gas
24%
Other
Nuclear
Wind 1%
20%
6%
b For the sake of this report, baseload sources are defined as those that were designed for and have historically
operated at above a 65% annualized capacity factor.
c Data from websites of ISO-New England, New York ISO, PJM, MISO, and SPP.
6RELIABILITY, RESILIENCE AND THE ONCOMING WAVE OF RETIRING BASELOAD UNITS
Exhibit 1-2. Regional natural gas spot prices, December 28, 2017–January 8, 2018 d
$160
$140
$120
$100
$/MMBtu
$80
4x 5x 8x
$60
$40
$20
2x 2x
$0
ISO-NE PJM NYISO MISO SPP
12/28/2017 12/29/2017 1/2/2018 1/3/2018 1/4/2018 1/5/2018 1/8/2018
Exhibit 1-3. Daily load weighted average marginal electricity price, December 28, 2017–January 8, 2018 e
$350
$300
$250
2x
$200
$/MWh
4x 9x
$150
$100
3x 3x
$50
$0
ISO-NE PJM NYISO MISO SPP
12/28/2017 12/29/2017 12/30/2017 12/31/2017 1/1/2018 1/2/2018
1/3/2018 1/4/2018 1/5/2018 1/6/2018 1/7/2018 1/8/2018
d Data from SNL Energy, Spot Natural Gas Prices through 1/8/2018.
e Data from ISO Websites.
7RELIABILITY, RESILIENCE AND THE ONCOMING WAVE OF RETIRING BASELOAD UNITS
While gas at the benchmark Henry Hub more than doubled from $3.00 to $7.00 per
MMBtu, spot prices in New York reached $175/MMBtu, and averaged $140 on January 5
(Exhibit 1-2 and Exhibit 1-4). [6] Gas withdrawn from storage reached an all-time high of
359 Bcf, 25 percent higher than the previous record set for the week ending January 10,
2014. Consequently, electricity prices during this period also escalated, to be eventually
borne by consumers. Compared to a mild day, three weeks earlier, coal- and oil-firing
generation met the surge in demand while gas and wind generation fell (Exhibit 1-5). On
average, coal capacity dispatch increased 34 GW, natural gas 2 GW, nuclear 2 GW, and
gas/oil 18 GW, while wind output declined 10 GW across the five-ISO footprint. Load-
weighted marginal electricity prices remained lowest in the regions with the most
generation under cost of service terms (MISO and SPP, Exhibit 1-3).
Exhibit 1-4. Regional natural gas spot prices, 01/01/2016–01/08/2018 f
$20
Transco Z 6 NY averaged
$140/MMBtu on January 5, 2018
$15
$/MMBtu
$10
$5
$0
f Data from SNL Energy, Spot Natural Gas Prices through 1/8/2018 with January 2018 Mapped.
8RELIABILITY, RESILIENCE AND THE ONCOMING WAVE OF RETIRING BASELOAD UNITS
Exhibit 1-5. Comparison of generation, average December day vs. cold snap, 5 RTOs
Dispatched Average Peak
Capacity Dispatch Capacity Average Net
Fuel Contribution (%)
(GW) @ Peak (GW) Contribution (%) Change
12/6/2017 12/28/17 to 1/8/18
Coal 78.3 31.5% 112.6 37.8% 6.3%
Natural Gas 69.6 28.0% 72.5 24.3% -3.6%
Nuclear 57.6 23.2% 59.5 20.0% -3.2%
Hydro 11.8 4.8% 12.7 4.3% -0.5%
Wind 26.0 10.5% 16.3 5.5% -5.0%
Natural Gas/Oil g 2.7 1.1% 20.5 6.9% 5.8%
Other h
2.7 1.1% 3.9 1.3% 0.2%
Total 248.8 100.0% 297.9 100.0% 0.0%
Source: Websites of ISO-NE, PJM, NYISO, MISO, and SPP
1.1 POWER GENERATION RESILIENCE
In 2009, the National Infrastructure Advisory Council (NIAC) issued a report focusing on
critical infrastructure resilience and adopted the following definition of resilience:
“Infrastructure resilience is the ability to reduce the magnitude and/or duration of
disruptive events. The effectiveness of a resilient infrastructure or enterprise depends
on its ability to anticipate, absorb, adapt to, and/or rapidly recover from a potentially
disruptive event.” [7]
Later in the report, the NAIC went on to define three additional terms that are key to
examining the resilience of the power system to events like the BC: absorptive capacity,
adaptive capacity, and recoverability. i Historically, resilience discussions have focused
primarily on the recoverability of the system through the expediency of transmission and
distribution service restoration after an event, and the ability of generating capacity to
provide black start services, in the event of a system collapse. The BC, however, provides
an opportunity to evaluate resilience from the perspective of the first two terms, as both
the absorptive and adaptive capacities of the system, particularly from a generation
perspective, to provide resilience were tested.
g Natural Gas/Oil includes units that are reported as oil firing or dual fueled in ISO generation reports.
h Other includes units reported as 'Other,' 'Other Fossil Fuels,' and 'Other Renewables' in ISO generation reports.
i Absorptive capacity is defined as the ability to endure a disruption without significant deviation from normal operating
performance; Adaptive capacity is defined as the ability to adapt to a shock to normal operating conditions; and
recoverability is defined as the ability to recover quickly and at low cost from disruptive events.
9RELIABILITY, RESILIENCE AND THE ONCOMING WAVE OF RETIRING BASELOAD UNITS
1.2 NEW YORK AND NEW ENGLAND
In New England, wind and solar contributed 1-5 percent of generation at peak. In
addition, over 160,000 barrels per day of oil were consumed in ISO-NE (Exhibit 1-6), and
more in NYISO, due to constrained gas supply and lack of alternative, competitive
generation. j As most fuel oil consumed in Petroleum Administration for Defense District
(PADD) 1A & B is imported or derived from imported crude k, one may infer that the
Northeast relied on foreign sources of energy for its emergency electricity production.
Exhibit 1-6. Fuel oil resilience and renewable output, ISO-NE, Dec 22, 2017–Jan 18, 2018
2.0 million barrels of 3.9 million barrel
150,000 initial stock (51%) used in 12 days
125,000
Daily Generation (MWh)
Maximum: 30.1% of
daily gen
100,000
75,000
Maximum: 5.1% of
daily gen
50,000
Minimum: 2.2% of
daily gen
25,000
0
12/22/2017 12/27/2017 1/1/2018 1/6/2018 1/11/2018 1/16/2018
Oil Fired Wind & Solar
Average of 166,000 barrels per day consumed during cold period, 1.06 trillion Btus per day
In regions with severely constrained capacity, the situation is more than economic. In
the Northeast, oil generation just barely met the need during the BC, accounting for
over 30 percent of output on some days in New England and New York. In ISO-NE, fuel
oil met or exceeded gas generation every day from December 28, 2017, to January 7,
2018, accounting for 26-36 percent of power generation peak output (Exhibit 1-7).
j It is not immediately apparent from the NYISO website how much of the “dual-fuel” capacity ran on fuel oil during the
event. Public unit generation data becomes available beginning in March, based on EPA emissions data, and even that
will be an estimate based on reported CO2 emissions rates (110-141 lbs/MMBtu for natural gas; 150-176 lbs/MMBtu for oil).
k Based on Energy Information Administration (EIA) data, approximately 82 percent of crude oil consumed in PADD I is
imported and around 60 percent of middle distillates (kerosene, distillate fuel oil, and residual fuel oil) consumed in PADD
I were imported or derived from imported crude. Dividing PADD I imports by the sum of PADD I imports, PADD I
production, and flows from other PADDs into PADD I yields a proxy for import dependence. [22]
10RELIABILITY, RESILIENCE AND THE ONCOMING WAVE OF RETIRING BASELOAD UNITS
Exhibit 1-7. Contribution of fuel oil generation to daily peak, ISO-NE
Date Fuel Oil Generation (MW) Share of Peak (%)
12/27 3,464 27.7
12/28 5,625 30.3
12/29 5,147 30.8
12/30 4,350 26.6
12/31 4,493 27.4
1/1 4,970 27.5
1/2 5,987 31.1
1/3 5,556 29.3
1/4 4,624 26.7
1/5 6,064 32.8
1/6 6,274 35.7
1/7 6,168 34.9
As the BC intensified, ISO-NE maxed out its oil-firing capacity of approximately 6,200
MW. As a result, oil generation averaged approximately 115,000 MWh/day over the
period, compared to only 16,200 MWh/day in 2014, a factor of 7 difference (Exhibit 1-6).
Having enough fuel oil was, in part, a testament to ISO-NE’s Winter Reliability Program
of storing fuel oil at dual-fuel facilities. l However, the stores of fuel oil were 51 percent
depleted by this event, with some plants nearly or fully exhausting their on-site supplies.
Additionally, refueling these depleted fuel supplies is a complex and logistically intense
operation; ISO-NE is serviced by a single 50,000 barrel per day oil pipeline to which only
two of the region’s 83 dual-fuel capable units are connected, which also services home
heating oil and other petroleum product demands in the region, necessitating the
delivery of fuel oil for power via truck and/or rail, creating supply issues should a similar
event last for a longer period.
Gas substitution for this fuel oil would have required 5 Bcf, or a pipeline throughput of
175 MMcf/day. The gas was unavailable due to pipeline constraints, despite available
natural gas in nearby Pennsylvania, leading to the extended price spikes. Exacerbating
this reliance are the closures of Brayton Point, a 1,530 MW Massachusetts coal plant
equipped with modern emissions controls, and Vermont Yankee, a nuclear plant, which
together would have generated approximately 700,000 MWh.
l The Winter Reliability Program was instituted as a short-term market solution as result of the 2014 Polar Vortex until ISO-
NE’s Forward Capacity Market ‘Pay-for-Performance’ incentives (expected to be effective for the 2018/2019 winter
season) could take effect. [29]
11RELIABILITY, RESILIENCE AND THE ONCOMING WAVE OF RETIRING BASELOAD UNITS
1.3 PJM AND THE “BOMB CYCLONE”
In PJM, coal and nuclear provided 70 percent of output during the BC, gas 22 percent,
and renewables 4 percent. Coal increased an average of 367 GWh/day or approximately
30,000 MW. The surge in coal accounts for 74 percent of incremental energy, with fuel
oil 22 percent. Other sources provided little to no surge capacity: natural gas, primarily
because of economics; nuclear, because of maxed-out capacity; and wind, due to highly
variable output (Exhibit 1-8). On average, wind declined. As detailed above, fuel oil
was critical to the northeast, but, in terms of scale, was dwarfed by PJM coal output
growth. According to EIA, peak coal generation in PJM of 1,200 GWh on January 5
exceeded the total output of NYISO (500 GWh) and ISO-NE (370 GWh) combined; the
aforementioned increase in PJM coal generation was as large as the output of ISO-NE.
[8]
Exhibit 1-8. PJM output December 2017-January 2018, average daily GWh m
Fuel 12/1-12/26 12/27-1/9 Delta Percentage Change Share of Increase
Coal 746 1,113 367 49% 74%
Gas 607 619 12 2% 2%
Renewables 127 123 -4 -4% -1%
Nuclear 846 851 5 1% 1%
Oil 2 111 109 455% 22%
Total 2,328 2,817 496 21% 100%
The most prominent example of generation resilience in action, occurred in PJM, the
largest of six U.S. RTOs affected by the BC. From the start of the BC, December 27, some
coal-fired units were suddenly brought on line and others ramped up to accommodate
the rapid increase in PJM electricity demand, providing both absorptive and adaptive
capacity. In review and retrospect, coal units in PJM were uniquely positioned to provide
the resilience needed at this critical point in time.
As reflected in Exhibit 1-9, during the BC, coal generation in PJM grew from 20 to 51 GW
of supplied capacity, utilizing 82 percent of the coal total, to provide 44 percent of total
PJM generation on January 4.
m Data from PJM generation fuel data 12/1/17 – 1/25/18 and EIA’s “Today in Energy” [7]; Totals do not add up precisely
due to rounding.
12RELIABILITY, RESILIENCE AND THE ONCOMING WAVE OF RETIRING BASELOAD UNITS
Exhibit 1-9. PJM coal plant resilience during the Bomb Cyclone
50,000 50.8 GW 1,500
1/5
1,400
Steady 24x7 Contribution
40,000 above 45 GW 1,300
Hourly Output (MW)
1,200
Total Daily Output (GWh)
30,000 1,100
+97% 1,000
+589 GWh daily +148%
20,000 900
20.5 GW
12/25 800
10,000 700
600
"Bomb Cyclone"
0 500
Hourly Daily
Although nuclear generation represents the quintessentially reliable baseload
component of U.S. electricity supply and is critical to meeting base power needs, as
shown in Exhibit 1-10, nuclear only provided absorptive resilience capacity because it
was already operating at capacity and cannot easily ramp up and down to provide
adaptive resilience.
13RELIABILITY, RESILIENCE AND THE ONCOMING WAVE OF RETIRING BASELOAD UNITS
Exhibit 1-10. PJM nuclear plant performance during the Bomb Cyclone
50,000 1,000
No capacity for Steady ≈ 35.5 GW/h
hourly adaptive 24x7 950
40,000 resilience
Total Daily Output (GWh)
Hourly Output (MW)
900
30,000
850
20,000 No capacity for
daily adaptive
Steady ≈ 852 GWh/d resilience
800
10,000
750
"Bomb Cyclone"
0 700
Hourly Daily
Due to the inherently reliable, but already maxed out operation, of the nuclear portion
of the PJM energy mix, as demand increased during the BC, the nuclear share of overall
generation dropped from 44 percent before the BC to as low as 26 percent of all
generation at peak BC demand on January 5, essentially the converse of coal
generation’s energy share growth during the BC.
As for natural gas-fired electricity generation, two significant constraints inhibit its fuel
resilience contribution during extreme weather events such as the BC. Most importantly,
demand from competing sectors, especially from residential and commercial space
heating, takes priority over electricity for natural gas use, limiting and even diminishing
the capacity potential for natural gas-based electricity. Compounding this constraint is
that of pipeline capacity. Even though abundant natural gas may be available, it must
flow through the same limited pipeline capacity already delivering to increased heating
demand. PJM stands out as a source for low-cost natural gas for electricity, due to
rapidly growing Marcellus/Utica regional supply reaching 20 Bcf per day, with
constrained pipeline transport, far exceeding its slowly growing 6 Bcf per day regional
natural gas demand. When competing space heating demand for natural gas surges
during an extreme weather event, natural gas prices rapidly increase, quickly setting the
stage for severe spikes in electricity prices as natural gas-fired capacity clears the
market. In the case of the BC, natural gas in PJM spiked from a normal level near
$3/MMBtu to $96/MMBtu at the Texas Eastern M3 interface, in Southeastern PA, at the
BC peak on January 5.
14RELIABILITY, RESILIENCE AND THE ONCOMING WAVE OF RETIRING BASELOAD UNITS
Notably, although natural gas fired generation averaged about 25 GW, wide swings in
hourly output of up to 4 GW imply that increment was met by cycling natural gas
combined cycle units (Exhibit 1-11), and confirmed in PJM’s Cold Snap Performance
Report of February 26. [9]. Due to these factors natural gas was unable to add
significantly to the 22 percent higher daily GWh demand in PJM during the BC. In fact,
as total PJM demand increased near the end of the BC event, the natural gas total daily
GWh production fell by 21 percent, from January 2-8. As the BC event progressed,
natural gas fired generation diminished from a high of 29 percent of PJM hourly
electricity on December 26 to a contribution of 16 percent of hourly electricity on
January 4. It was coal, and secondarily fuel oil, fired primarily in fuel switching natural
gas units, that provided the electricity crucial for keeping natural gas-fired residential
furnace fans operating during the extreme cold of the BC. n
Exhibit 1-11. PJM natural gas generation performance during the Bomb Cyclone
50,000 800
No daily GWh resilience to
Wide 2 to 4 GW hourly swings support demand; 21% decline
(-147 GWh) from 1/2 to 1/8 750
40,000 (partly due to heating and
Total Daily Output (GWh)
dual fuel conversion)
700
Hourly Output (MW)
30,000
650
600
20,000
Operation in band of 540 to 550
10,000 710 GWh daily; declining at
peak BC demand due to 500
heating demand;
(negative-resilience) "Bomb Cyclone"
0 450
Hourly Daily
Intermittent generating sources experienced a significant decline nearly inverse to
growth in demand. As the storm settled over the Mid-Atlantic region, PJM saw
decreased output from solar and wind resources (Exhibit 1-12). This decrease in output
essentially imparted a resilience penalty to the system during this event, as it was neither
n Dual fuel capability allows for adaptive capacity technology resilience, but does not ensure fuel security and
absorptive capacity resilience. In fact, dual fuel switching in some units requires the unit to be completely offline and
unavailable while fuel switching occurs, taking 4 to 8 hours on average, essentially creating a window of higher resilience
risk. [33]
15RELIABILITY, RESILIENCE AND THE ONCOMING WAVE OF RETIRING BASELOAD UNITS
absorptive or adaptive, requiring the remaining available dispatchable resources to
provide both forms of resilience to offset the decrease and increasing demand.
Exhibit 1-12. PJM solar and wind generation performance during the Bomb Cyclone
7,000 140,000
~48% decrease from
peak wind on 12/30 to
135,000
Solar and Wind Hourly Generation (MW)
6,000 peak demand on 1/5
130,000
5,000 125,000
Metered Load (MW)
120,000
4,000
115,000
3,000
110,000
2,000 105,000
100,000
1,000 ~30% increase in demand
95,000
from peak wind on 12/30 to
peak demand on 1/5
0 90,000
12/27/2017 12/29/2017 12/31/2017 1/2/2018 1/4/2018 1/6/2018 1/8/2018
Hourly Solar and Wind Generation (MW) Metered Load
Examining the performance of the major sources of power in PJM leads to the
conclusion that it was primarily coal that responded resiliently, with some contribution
from oil-firing units. The value of the resilient coal- and oil-fired generation can be
quantified by integrating over the term of the BC. The increase in the cost of energy
services over the two-week period from December 27 to January 9 was $288M per day,
equivalent to $98 per MW, compared with costs from the preceding two-week period,
and $225M per day, or $73 per MW, higher than the following two-week period that
featured a short return of extreme cold. This, in effect, represents a value of resilience
(Exhibit 1-13), which, during the BC, rose to $3.5 billion. Simulating the event for a
future state with anticipated coal retirements is expected to produce higher energy costs
(including any costs associated with loss of load) and subsequently a higher value of
resilience. Further study is needed to quantify this impact.
16RELIABILITY, RESILIENCE AND THE ONCOMING WAVE OF RETIRING BASELOAD UNITS
Exhibit 1-13. Notional resilience value o
700
600
Daily Cost of Load ($M)
500
400
300
200
$3.5 Billion
100
0
12/1/17 12/8/17 12/15/17 12/22/17 12/29/17 1/5/18 1/12/18 1/19/18 1/26/18
In the case of PJM, it can also be shown that the demand could not have been met
without coal. At peak demand, January 5, 2018, natural gas prices exceeded
$95/MMBtu in eastern PJM. Had coal been removed, a 9-18 GW capacity shortfall
would have developed, depending on assumed imports and generation outages,
leading to system collapse (Exhibit 1-14).
o Data from PJM. [31]
17RELIABILITY, RESILIENCE AND THE ONCOMING WAVE OF RETIRING BASELOAD UNITS
Exhibit 1-14. Hypothetical PJM Bomb Cyclone peak hour dispatch without coal p
2,000
1,800
1,600
Variable O&M ($/MWh)
1,400
1,200
1,000
800
600
400
200
0
0 20,000 40,000 60,000 80,000 100,000 120,000 140,000 160,000
Cumulative Capacity (MW)
Biomass Coal Natural Gas Other Fuel Petroleum Products Solar Uranium Water Wind
*Minimum Effective System Load is hypothetical and does not indicate actual conditions seen by the
system, whereas, the Net Effective System Load was seen by the system.
The 30 GW of coal that ramped up to meet the surge in PJM load clearly includes the
units most likely to retire due to insufficient market support, given those units were not
running at baseload levels before the event. As more of these units retire, the ability of
the system to respond to extreme events with reliance, let alone economically,
deteriorates. To maintain the resilience seen in this event, any retiring units that were
dispatched during the event would have to be replaced with other resilient generation
sources and their associated infrastructure (e.g. pipelines, transmission). Due to the
timeframe required for permitting, development, and construction, these projects must
be well underway prior to potential unit retirements to ensure their availability.
1.4 SIX-ISO SUMMARY
Moving to a broader perspective, summing across six ISOs affected by large demand
changes (Exhibit 1-15 and Exhibit 1-16) shows that coal is the most resilient form of
generation, contributing 63 percent of the 1.2 million GWh net increase in load, with gas
following at 20 percent. Fuel oil leapt to 17 percent. Nuclear, being either on or off,
contributed 5 percent of the increase. Note however, that across the six ISOs, wind
p “Raw Load” is the peak system load reported by PJM during the BC. “Outage Effective Load” is the raw load plus
generation outages seen at the peak of the BC. “Net Effective Load” is the outage effective load net of coincident
transmission interchange. “Minimum Effective System Load” is outage effective load net of the Capacity Benefit Margin
Import Capacity and the Capacity Emergency Import Transfer Limit; this limit is shown to illustrate the best-case scenario
for operating the PJM system during the BC without coal-fired assets, and does not indicate actual conditions
experienced by the system. Data from NETL analysis utilizing data from S&P Global Market Intelligence and publicly
available data from PJM Interconnection.
18RELIABILITY, RESILIENCE AND THE ONCOMING WAVE OF RETIRING BASELOAD UNITS
generation declined over 144,000 GWh. Accounting for the reduction in wind yields
nearly 1.4 million GWh of additional generation needed, of which coal provided over 55
percent, fuel oil nearly 22 per cent, natural gas 18%, and nuclear over 4% (Exhibit 1-17).
Exhibit 1-15. Six-ISO load change comparison December 1-26, 2017 to Bomb Cyclone (December 27,2017 –
January 8, 2018)
Total Daily Avg.
Total Daily Avg.
Bomb Cyclone Delta Daily Avg. % Delta Avg.
RTO/ISO Load (MWh)
Load (MWh) Load (MWh) MWh Load
12/1 to 12/26
12/27 to 1/8
PJM 2,334,041 2,833,454 499,413 21.4%
MISO 1,692,145 2,040,515 348,369 20.6%
ERCOT 949,142 1,038,023 88,882 9.4%
SPP 706,587 819,208 112,622 15.9%
NYISO 353, 199 452,003 98,804 28.0%
ISO-NE 282,556 348,155 65,559 23.2%
Total 6,317,670 7,531,359 1,213,690 19.2%
Exhibit 1-16. Fuel-based power generation resilience to load changes from December 1-26, 2017 to Bomb
Cyclone (December 27,2017 – January 8, 2018)
% Incremental
Fuel MWh Delta Share of Net
Delta
Coal 763,986 62.9%
Natural Gas 245,227 20.2%
Nuclear 63,915 5.3%
Hydro (2,591) -0.2%
Wind (144,342) -11.9%
Coal/Oil 20,677 1.7%
Dual Fuel 70,646 5.8%
Residual Oil 209,398 17.3%
Other (13,226) -1.1%
Total 1,213,690 —
19RELIABILITY, RESILIENCE AND THE ONCOMING WAVE OF RETIRING BASELOAD UNITS
Exhibit 1-17. Fuel based power generation resilience during the Bomb Cyclone, six ISOs
1,400
Incremental Daily Avg. Generation During BC
1,200
Coal, +764.0;
1,000 +35.7% over early
Dec.
800
(GWh)
600
Oil/Dual Fuel, +300.7;
>> +1,000% over
400 early Dec.
Natural Gas, +245.2;
200 +14.2% over early
Dec.
0 Nuclear, +63.9; +4.3% over early Dec.
Wind, -144.3; -11.9%
Other*, -13.2
over early Dec.
Hydro, -2.6
-200
Wind Other* Hydro Nuclear Natural Gas Oil/Dual Fuel Coal
* 'Other' includes misc. categories, including other, refuse, solar, diesel, and multiple fuels
1.4 COMPARISON TO THE POLAR VORTEX
A similar event transpired in January 2014, which saw two distinct weather events,
occurring at the beginning and end of the month, the first of which is known as the
“Polar Vortex.” Natural gas regularly traded above $20/MMBtu in New England, well
above the annual average of $5.50/MMBtu, with elevated prices occurring throughout
the rest of the nation as well. [10]
In PJM in January 2014, the event was particularly severe due to equipment failures
(from the cold temperatures) and unavailability of fuel. Generation forced outages
exceeded 10 percent of installed capacity during both 2014 events with a record
effective 22 percent forced outage rate (40,200 MW out of 183,000 MW was unavailable)
occurring simultaneously with the all-time system winter peak on January 7, well
exceeding the 7 percent average winter outage rate normally seen. Natural gas fired
generators accounted for 47 percent of the out of service capacity in PJM during this
event. [11] In addition to equipment failure, the inability to obtain fuel to start up and/or
run the units accounted for 24 percent of the outages. The contemporary PJM report
also revealed that over 35 percent of the gas units were unavailable, compared to 18
percent of the coal units. [11]
North American Electric Reliability Corporation (NERC) also analyzed the Polar Vortex. It
noted that installed capacity across the Eastern Interconnect and ERCOT was 40 percent
natural gas, 31 percent coal, and 19 percent nuclear. With respect to outages, NERC
20RELIABILITY, RESILIENCE AND THE ONCOMING WAVE OF RETIRING BASELOAD UNITS
found that while nuclear was mostly unaffected and coal outages were 26 percent of the
total, natural gas units composed 55 percent of total outages. This finding led to NERC’s
conclusion that system planners need to pay particular regard to the performance of
natural gas units during extreme weather events. [12]
To bring focus to comparisons of the Polar Vortex with the recent BC, NETL compared
similar three-day peak demand periods, January 6-8, 2014, with three consecutive days
between January 4-7, 2018 (depending on ISO (Exhibit 1-18)).
Exhibit 1-18. Daily peak load, 2014 v. 2018 q
160,000
140,000
120,000
Daily Peak Load (MW)
100,000
80,000
60,000
40,000
20,000
0
PJM ISO-NE NYISO MISO SPP
Polar Vortex Bomb Cyclone
1/6/2014 1/7/2014 1/8/2014 1/4/2018 1/5/2018 1/6/2018 1/7/2018
Across the five-ISO footprint in 2014, coal generation contributed almost half of total
output. Coal and nuclear together provided in excess of 67 percent of generation, gas
and oil 33 percent, and renewables less than 0.1 percent, on average (Exhibit 1-19).
q Data from ABB Velocity Suite for 2014 Data and ISO Websites for 2018 Data.
21RELIABILITY, RESILIENCE AND THE ONCOMING WAVE OF RETIRING BASELOAD UNITS
Exhibit 1-19. Peak generation mix comparison, 2014 v. 2018, five-ISO footprint r
Avg. Contribution from Avg. Contribution from
Fuel Net Change
1/6/2014 to 1/8/2014 12/28/17 to 1/8/18
Coal 47.8% 37.8% -10%
Natural Gas/Oil 33.0% 31.2% -1.8%
Nuclear 19.1% 20.0% 0.9%
Renewables/Other* 0.1% 11.0% 10.9%
Total 100.0% 100.0% 0.0%
*Renewables/Other includes: Biomass, Wind, Solar, Geothermal, Waste Heat, and other non-traditional generating sources
Due to retirements since 2014, the installed coal and nuclear capacity has fallen, to less
than 40 percent in 2018, so that coal and nuclear together compose 57 percent of
output in 2018. Remarkably, the share of natural gas did not rise over the four-year
interval, despite a 4 percent increase in installed natural gas-fired capacity. Over the
five-ISO footprint, the difference was closed with non-intermittent renewables, the vast
majority of which are wood-based. s Wind and solar capacity increased by 19.6 GW
(nameplate); however, only 2.6 GW of that increase is anticipated by the regions at peak
in planning studies based on historical peak period performance. t
Comparing gas prices for the peak demand day of January 7, 2014, to January 4, 2018,
(Exhibit 1-20Exhibit 1-20) reveals peak gas prices two-three times higher in ISO-NE, PJM,
and NYISO in 2018 than in 2014. Comparison of electricity prices is more nuanced, as
the January 7, 2014, record outage rate (and severe snowstorm, which knocked out
transmission) in PJM produced electricity price spikes that had knock-on effects in
neighboring NYISO (Exhibit 1-21). Otherwise, electricity price spikes were roughly similar
between the period for PJM, ISO-NE, and NYISO. Power prices were lower in MISO and
SPP during the 2018 event. An inference to be drawn, then, is that as gas capacity (and
therefore gas demand) increases with insufficient deliverability, peak gas prices surge.
Very little pipeline capacity has been added in the Northeast (Exhibit 1-22). As a result,
flows of natural gas to the Northeast have been static (Exhibit 1-23). u In economic
terms, the supply of natural gas to the Northeast is essentially fixed by aggregate
pipeline throughput.
r Data from ABB Velocity Suite for 2014 Data and ISO Websites for 2018 Data. Over both periods, particularly the 2017-
2018 period, a preponderance (>75 percent) of generation from sources in this category came from biomass-firing and
cogeneration resources.
sThere is only 89 MW of wood and municipal solid waste facilities planned across the area, with 51 MW of additional
capacity planned for ISO-NE.
tFor a discussion of this, see NETL 2017, Tracking New Energy Infrastructure, NETL Pub. 21047,
https://www.netl.doe.gov/research/energy-analysis/search-publications/vuedetails?id=2212.
u The EIA has a very broad definition of the Northeast in its state-to-state data, Finer analysis is necessary to determine net
flows to New York and New England.
22RELIABILITY, RESILIENCE AND THE ONCOMING WAVE OF RETIRING BASELOAD UNITS
Exhibit 1-20. Regional natural gas spot prices, 2014 vs. 2018
$160
$140
$120
$100
$/MMBtu
8x
$80
$60 5.5x
2.5x 4x
$40
3x 4x
$20
$0
ISO-NE PJM NYISO MISO SPP
1/6/2014 1/7/2014 1/8/2014 1/3/2018 1/4/2018 1/5/2018 1/8/2018
Exhibit 1-21. Daily load weighted average marginal electricity price, 2014 vs. 2018
$800
$700
$600
$500
$400
$/MWh
$300
$200
$100
$0
PJM ISO-NE NYISO MISO SPP
1/6/2014 1/7/2014 1/8/2014 1/4/2018 1/5/2018 1/6/2018 1/7/2018
23RELIABILITY, RESILIENCE AND THE ONCOMING WAVE OF RETIRING BASELOAD UNITS
Exhibit 1-22. Natural gas pipeline miles and capacity, 2000-2020 v
4,000 50
*Announced 45
3,500
Miles of Pipeline Added
40
Capacity Added (Bcf/day)
3,000
35
2,500 30
2,000 25
1,500 20
15
1,000
10
500 5
0 0
Northeast Miles Total U.S. Miles Northeast Capacity Total U.S. Capacity
Exhibit 1-23. Natural gas pipeline capacity by year - Inflow to Northeast w
18,000
16,000
Inflow pipeline capacity (MMcfd)
14,000
12,000
10,000
8,000
6,000
4,000
2,000
0
2010 2011 2012 2013 2014 2015 2016
Northeast from - Canada Northeast from - Midwest Northeast from - Southeast
Northeast includes VA, WV, MD, DC, DE, PA, NJ, NY, CT, RI, MA, NH, VT, ME
v Data from EIA. [24]
w Data from EIA State-to-state Pipeline capacity. [24]
24RELIABILITY, RESILIENCE AND THE ONCOMING WAVE OF RETIRING BASELOAD UNITS
THE PROSPECT OF FURTHER LARGE-SCALE RETIREMENTS
Generally, the retirement of coal and nuclear generation would reduce reserve margins
unless and until sufficient gas-fired power generation capacity is built and adequately
served by firm pipeline capacity. However, the tendency to overestimate the ongoing
contribution with age of these already mature generating assets is not fully considered
in many projections. To the extent that electricity generation projections ignore this
factor, the asset replacement scale and lead-time to maintain a diverse electricity fuel
mix will be greatly underestimated.
2.1 UNCERTAINTY IN BASELOAD RETIREMENT PROJECTIONS
Based on the analysis presented here, the extent of oncoming coal and nuclear
retirements may be underestimated. Through 2025, announced coal retirements total
31 GW across the United States. [13] EIA projects 41 GW of coal and 10 GW of nuclear
retirements by 2025. x [14] However, neither the currently announced retirements nor the
EIA projection adequately captures the risk. The EIA projection includes high capacity
factors for remaining coal and nuclear units, even though most units would be over 60
years of age by 2040.
As the age of the coal fleet rises (Exhibit 2-1 and Exhibit 2-2), and the challenges of low
gas prices and subsidized, mandated, and/or reduced cost of intermittent renewables
continue, the coal units will experience repeated cycling. For instance, the policy-
induced 6.6 GW solar growth in California between 2011 and 2017 has led to price
collapses during daylight peak as well as induced cycling for California gas units and
neighboring Desert Southwest coal units (Exhibit 2-3 and Exhibit 2-4).
x No-CPP case.
25RELIABILITY, RESILIENCE AND THE ONCOMING WAVE OF RETIRING BASELOAD UNITS
Exhibit 2-1. Age distribution of baseload units, 2017
25
Average Age Coal: 43
Capacity Weighted Average Age Coal: 39
Average Age Nuclear: 37
Capacity Weighted Average Age Nuclear: 36
20
Nameplate Capacity (GW)
15
10
5
0
0 3 6 9 12 15 18 21 24 27 30 33 36 39 42 45 48 51 54 57 60 63 66 69 72 75 78 81 84 87 90 93 96 99
Unit Age
Coal: Age 2017 Nuclear: Age 2017
Exhibit 2-2. Unit age in 2040, per AEO 2017
25
Average Age Coal: 66
Capacity Weighted Average Age Coal: 62
Average Age Nuclear: 60
20 Capacity Weighted Average Age Nuclear: 59
Nameplate Capacity (GW)
15
10
5
0
0 3 6 9 12 15 18 21 24 27 30 33 36 39 42 45 48 51 54 57 60 63 66 69 72 75 78 81 84 87 90 93 96 99
Unit Age
Coal: Age 2040 Nuclear: Age 2040
26RELIABILITY, RESILIENCE AND THE ONCOMING WAVE OF RETIRING BASELOAD UNITS
Exhibit 2-3. California solar additions and Palo Verde Prices y
$60 8
Palo Verde 500kV 5 Minunte Average Hourly
Hourly California Solar Output (GW)
7
$50
Locational Marginal Price ($/MWh)
~6.6 GW increase
6
$40
5
$30 4
~$30/MWh
decrease 3
$20
2
$10
1
$0 0
0 1 2 3 4 5 6 7 8 9 10 11 12 13 14 15 16 17 18 19 20 21 22 23
Year 1 Solar Year 7 Solar Year 1 Price Year 7 Price
Year 1: 4/1/2010 to 3/31/2011
Year 7: 4/1/2016 to 3/31/2017
Exhibit 2-4. Reduced capacity factors in the Western Interconnect z
Coal-Fired Natural Gas Combined Cycle
100 50
90 45
80 40
70 35
Capacity Factor (%)
Capacity Factor (%)
60 30
50 25
40 20
30 15
20 10
10 5
0 0
2010 2011 2012 2013 2014 2015 2016 2017 2010 2011 2012 2013 2014 2015 2016 2017
As Is No VRE Post-2009 As Is No VRE Post-2009
y Data from ABB Velocity Suite; Query period 4/1/2010 to 3/31/2017. [14]
z Data from NETL simulations using ABB PROMOD IV with and without Variable Renewable Energy (VRE) additions.
27RELIABILITY, RESILIENCE AND THE ONCOMING WAVE OF RETIRING BASELOAD UNITS
Early work on cycling damage minimized the cost, but innovative work by Hanson et al.,
which internalizes a damage function, shows that as cycling increases, economic
damage escalates, leading to premature retirement. [15] This result follows from
analyzing the fleet from the perspective of performance versus age. General Electric,
ARUP, and others have identified that conventional unit efficiencies decrease by an
unrecoverable 0.15-0.55 percent per year, meaning higher operating costs, and
reductions in dispatch. [16, 17]
NETL has found declining average capacity factors after units reach thirty years of age,
with utilization falling more precipitously after age 50 (Exhibit 2-5). Data show that, at
advancing age, capacity factors fall (Exhibit 2-6). EIA held a Coal Fleet Aging Meeting on
this topic in June 2016 (an adjunct meeting to its Annual Energy Outlook (AEO) 2017
Coal Working Group). aa The combined effects of aging, cycling, and lack of investment is
an active area of investigation.
Exhibit 2-5. Average capacity factor for coal units by age of each units in year of operation 1998-2017
90
80
70
Capacity factor (%)
60
50
40
30
20
10
0
0 5 10 15 20 25 30 35 40 45 50 55 60 65 70 75 80 85
Unit age in year of operation
aa A summary of the meeting can be found here:
https://www.eia.gov/outlooks/aeo/workinggroup/coal/pdf/Final_Coal_Fleet_Aging_Meeting_Notes_081716.pdf
28You can also read