POWERING AMERICA'S CLEAN ECONOMY - ELECTRICITY - Energy ...
←
→
Page content transcription
If your browser does not render page correctly, please read the page content below

POWERING
               AMERICA’S
               CLEAN ECONOMY

               A SUPPLEMENTAL
               ANALYSIS TO THE
               2035 REPORT

  APRIL 2021

ELECTRICITY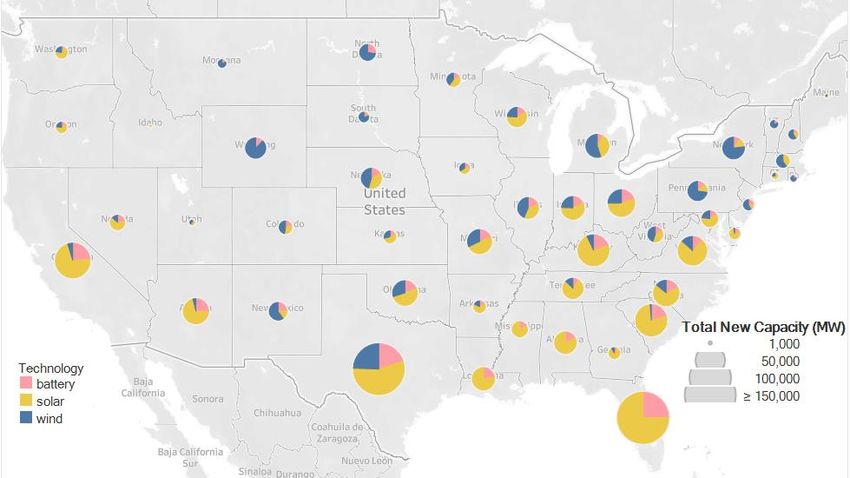
2030 REPORT:
        POWERING AMERICA’S CLEAN
               ECONOMY
                A SUPPLEMENTAL ANALYSIS TO THE 2035 REPORT

NIKIT ABHYANKAR#1*
nabhyankar@berkeley.edu
UMED PALIWAL#1
umed@berkeley.edu
TAYLOR MCNAIR2
taylor@gridlab.org
DAVID WOOLEY
davidwooley@berkeley.edu
MICHAEL O’BOYLE*
michael@energyinnovation.org
AMOL PHADKE1*
aaphadke@berkeley.edu

#   Co-lead authors
*   Corresponding authors

1 Goldman School of Public Policy, University of California, Berkeley
2 GridLab
3 Energy Innovation LLC

                                                                        1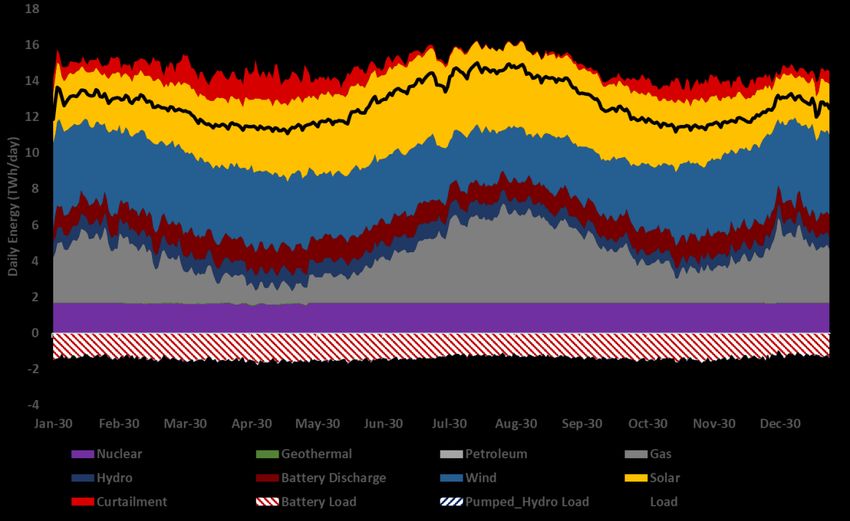
EXECUTIVE SUMMARY
Global carbon emissions must be halved by 2030 to limit warming to 1.5°C and avoid catastrophic
climate impacts. As the nation coalesces around 2035 as the target year for power sector
decarbonization, rapid progress must be made in the next decade in order for this target to remain
in reach. The United States has already committed to reducing its economy-wide greenhouse gas
emissions in 2030 by 50-52 percent from 2005 levels. Ambitious power sector decarbonization
enables economy-wide decarbonization of the building, industrial, and transportation sectors,
setting the United States on a 1.5°C pathway commensurate with international climate goals.

Since the release of the 2035 Report: Plummeting Solar, Wind, and Battery Costs Can Accelerate
Our Clean Electricity Future (“2035 Report”), federal legislation, as well as President Joe Biden’s
American Jobs Plan and the U.S. Nationally Determined Contribution to the Paris Agreement, have
catapulted ambitious clean electricity standards (CES) into the national policy discourse. These
policies range in their ambition, but modeling of the U.S. NDC to reduce economy-wide emissions
50 percent from 2005 levels by 2030 converges with the need to reach at least 80 percent clean
electricity by 2030.

Several recent studies have analyzed aggressive penetration of renewable energy in the medium-
to long-term, including our 2020 release of the 2035 Report. However, very few have assessed the
technical and operational feasibility and economic viability of aggressive power sector
decarbonization (80 percent or more) in the medium-term (2030 timeframe). Plummeting costs
for wind and solar energy have dramatically changed the prospects for rapid, cost-effective
expansion of renewable energy. At the same time, battery energy storage has become a viable
option to cost-effectively integrate high levels of wind and solar generation into electricity grids.

This report uses the latest renewable energy and battery cost data to demonstrate the technical
and economic feasibility of achieving 80 percent clean (carbon-free) electricity in the United States
by 2030. Two central cases are simulated using state-of-the-art capacity-expansion and
production-cost models: The No New Policy case assumes continuation of current state and
federal policies; and the 80% Clean case1 requires that a national 80 percent clean electricity share
is reached by 2030, along with aggressive transportation electrification where electric vehicles
(EVs) constitute 100 percent of new U.S. light-duty vehicle sales and 80 percent of medium- and

1By 80% Clean, we mean that 80% of total annual US electric power supply comes from zero emission power generators (wind,
solar, hydro, nuclear, battery storage (2-10 hour), biomass, and fossil fuel plants with carbon capture and storage).

                                                                                                                            2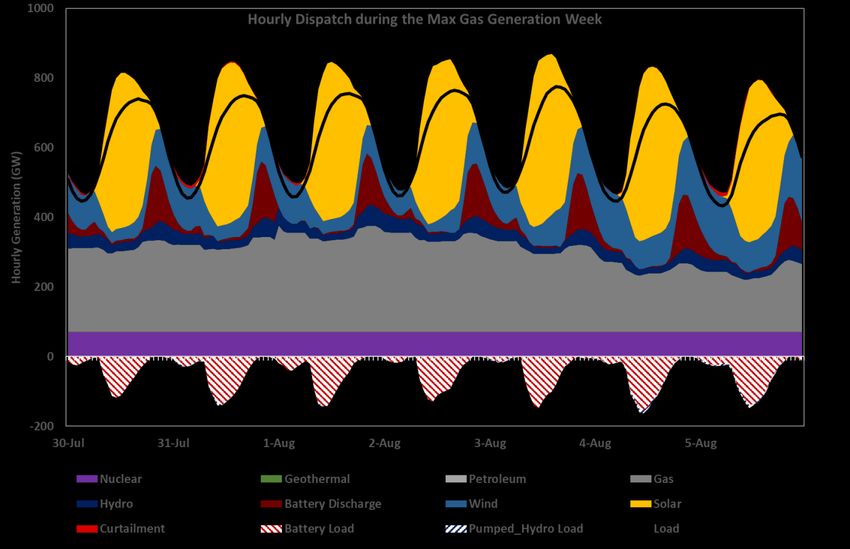
heavy-duty vehicle sales by 2030 as outlined in the 2035 Report 2.0: Plummeting Costs and
Dramatic Improvements in Batteries can Accelerate our Clean Energy Future.

This report uses nearly identical methodology to the original 2035 Report and 2035 Report 2.0,
and can be viewed as a supplemental analysis that focuses on the implications of an accelerated
interim target, coupled with aggressive end-use electrification.

STRONG POLICIES ARE REQUIRED TO CREATE AN 80% CLEAN GRID BY 2030
The 80% Clean case assumes strong policies drive 80 percent clean electricity by 2030. The No
New Policy case achieves only 45 percent clean electricity in 2030 (Figure ES-1). Our modeling
shows that without the implementation of a binding national Clean Electricity Standard (CES),
rapid near-term power sector decarbonization is not achieved. This outcome would have negative
effects on related sectors of the economy (e.g. transportation, industry, and buildings) which must
electrify in parallel to support economy-wide decarbonization.

Figure ES-1. Generation mixes for the 80% Clean Case (left) and No New Policy Case (right), 2020–2030.

THE 80 PERCENT CLEAN GRID IS DEPENDABLE WITHOUT COAL PLANTS OR NEW
NATURAL GAS PLANTS DESPITE SIGNIFICANT ELECTRICITY DEMAND FROM
TRANSPORTATION ELECTRIFICATION
Commensurate with economy-wide decarbonization goals, our modeling assumes rapid
transportation electrification targets as outlined in the 2035 Report 2.0 DRIVE Clean case (100
percent electric light-duty vehicle sales and 80 percent electric medium-duty vehicle/heavy-duty
truck sales by 2030, which grows to 100 percent electric vehicle sales by 2035). We also assume

                                                                                                         3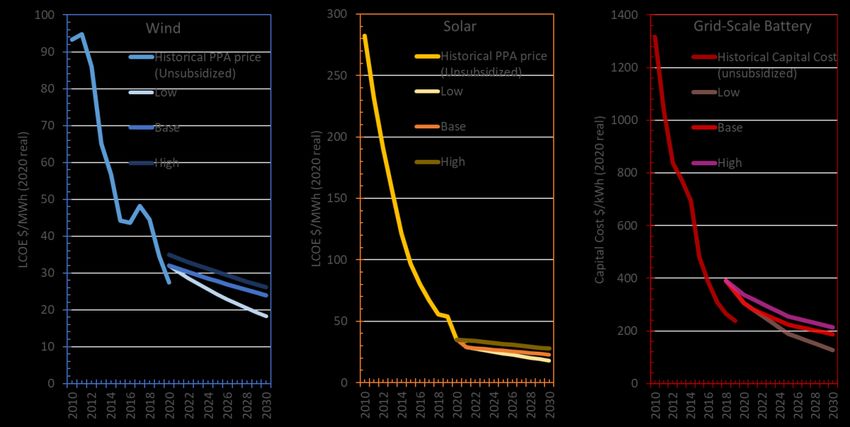
significant electrification of buildings and industrial end uses as envisioned in NREL’s Electrification
Futures Study (EFS) High Electrification Scenario. As a result, electricity demand increases at an
average annual growth rate of 2 percent from 2020-2030 (Figure ES-2).

Figure ES-2. Total electricity consumption – historical and with additional electrification

Even accounting for rapid transportation, building, and industrial electrification, the 80 percent
clean grid is dependable, providing adequate energy in every hour of the year to meet demand.
Wind, solar, and batteries provide about 60 percent of daily generation, while hydropower and
nuclear provide 20 percent. Under the 80% Clean case, existing hydropower and nuclear capacity
are retained (except for planned retirements), while all existing coal plants are retired by 2030,
and no new fossil fuel plants are built. During periods of very high demand or very low renewable
generation, existing natural gas, hydropower, and nuclear plants combined with battery storage,
cost-effectively compensate for mismatches between demand and wind or solar generation.
Generation from natural gas plants would constitute about 20 percent of total annual electricity
generation. This is about 30 percent lower than gas generation today.

ELECTRICITY COSTS FROM THE 80 PERCENT CLEAN GRID DO NOT INCREASE FROM
TODAY’S COSTS
The cost to generate and deliver electricity in 2030 would be the same as it is today, largely due
to low renewable energy and battery storage costs (Figure ES-3). As the electric grid decarbonizes,
a large amount of low-cost wind, solar, and battery storage is built to meet the rising clean
electricity standard. Relying on natural gas for only 20 percent of generation avoids large
investments for infrequently used capacity, helping to avoid major new stranded-asset costs.

                                                                                                      4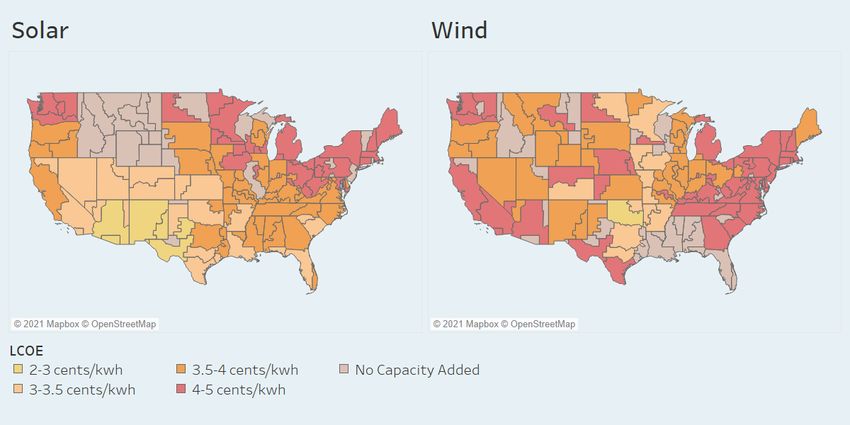
Retaining some natural gas generation reduces the total amount of renewable energy and long-
duration storage capacity needed—helping to achieve 80 percent clean electricity and keep costs
down. While still the same as today’s costs, wholesale electricity costs are 6 percent higher under
the 80% Clean case than under the No New Policy case in 2030. However, this comparison does
not account for large household and business savings from vehicle electrification, nor the value of
emissions reductions or avoided health costs under the 80%            Clean case. When health and
environmental externalities are included, 2030 wholesale electricity prices in the 80% Clean case
are 31 percent lower than the No New Policy case.

Figure ES-3. Wholesale electricity costs with- and without environmental costs, for the 80% Clean and No New Policy Cases

THE 80 PERCENT CLEAN GRID AVOIDS $1.7 TRILLION IN HEALTH AND
ENVIRONMENTAL DAMAGES, INCLUDING 93,000 PREMATURE DEATHS, THROUGH
2050
The 80% Clean case, coupled with accelerated transportation electrification, results in large
environmental and health benefits largely driven by reduced mortality related to electricity
generation and vehicular pollution (Figure ES-4). Relative to the 2005 levels, the 80% Clean plus
DRIVE Clean case reduces carbon dioxide (CO2) emissions 84 percent and 33 percent by 2030 from
the power sector and transportation sectors, respectively. The combination of these two policies
alone results in a 42 percent reduction in economy-wide emissions from 2005 levels by 2030.
Coupled with rapid buildings and industrial electrification, economy-wide CO2 emissions are
reduced 50 percent by 2030 from 2005 levels (Figure ES-5). Accelerated power sector
decarbonization reduces exposure to fine particulate (PM2.5) matter by reducing nitrogen oxide
(NOx) and sulfur dioxide (SO2) emissions from the power sector by 90 percent and 98 percent,

                                                                                                                            5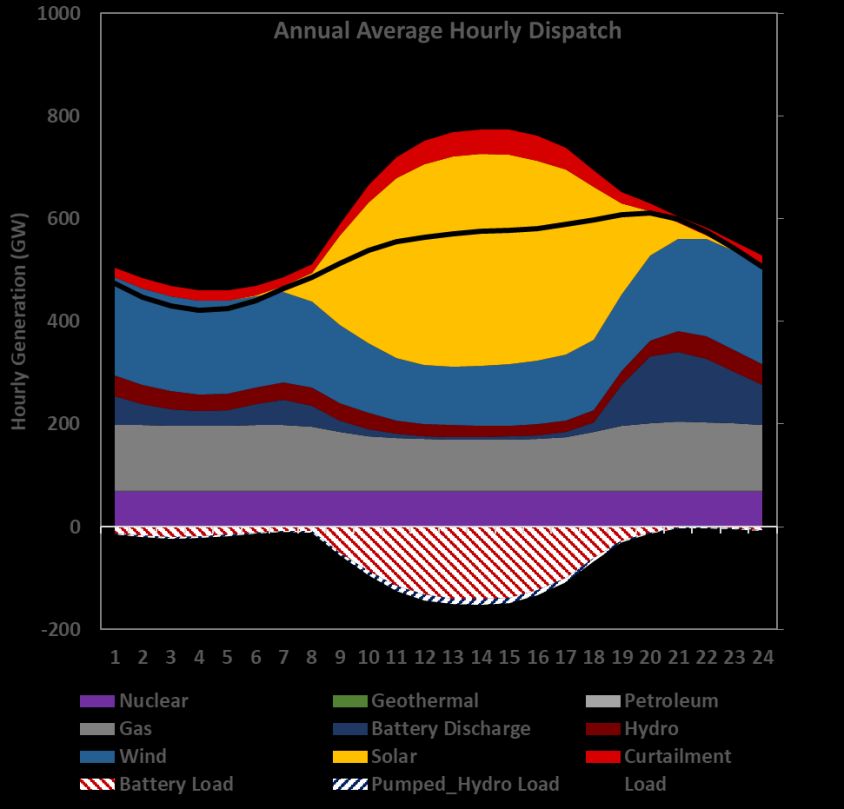
respectively relative to 2019 levels and 95 percent and 99 percent, respectively, relative to the
2005 levels (Figure ES-5).2 As a result, the 80% Clean case avoids over $1.7 trillion in health and
environmental costs, including 93,000 avoided premature deaths, through 2050 (Figure ES-6).
These savings equate to roughly $25/MWh (or 2.5 cents/kWh) of wholesale electricity costs, which
makes the 80% Clean case much lower cost than No New Policy. The environmental benefits of
transport electrification are equally significant. Between 2020 and 2050, vehicle electrification
avoids over 150,000 additional premature deaths and over $1.3 trillion in environmental costs.
Power sector decarbonization and transportation electrification together avoids over 240,000
premature deaths and $3 trillion in environmental costs by 2050.

Figure ES-4. Emissions of CO2, SO2, and NOx from power sector in the 80% Clean and No New Policy Cases, 2020–2030

Figure ES-5. Power sector (left), transportation sector (center), and economy-wide (right) CO2 emissions in the 80% Clean and No
New Policy Cases, 2020-2030.

2Primary PM2.5 emissions reductions are not estimated by the model, resulting in a conservative estimate of reduced PM 2.5
exposure.

                                                                                                                              6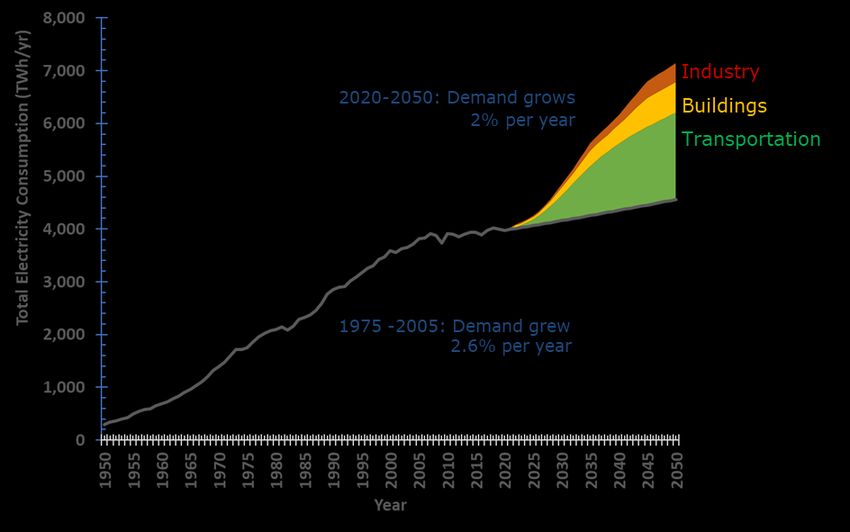
Figure ES-6. Annual premature deaths in the power (left), transportation (center), and combined power and transportation sectors
(right) in the 80% Clean and No New Policy Cases, 2020–2050.

SCALING-UP RENEWABLES TO ACHIEVE 80 PERCENT CLEAN ENERGY BY 2030 IS
FEASIBLE DESPITE SIGNIFICANT ADDITIONAL ELECTRICITY DEMAND
To achieve a national 80 percent clean electricity share by 2030, 950 GW of new wind and solar
generation and over 225 GW of battery storage capacity must be built, averaging about 120 GW
of new capacity per year (Figure ES-7). While challenging, domestic and international precedent
suggests that strong supporting federal and state policy can help the U.S. achieve this goal. For
example, China added 120 GW of new wind and solar capacity in 2020. While once unattainable,
new renewable resources can be built cost-effectively in nearly every region of the country,
suggesting that such a rapid expansion of new deployments is possible.

                                                                                                                              7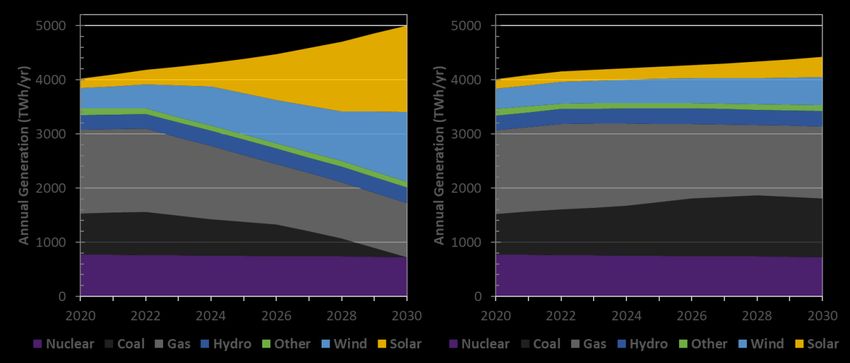
Figure ES-7. Cumulative new capacity additions in the 80% Clean Case, 2020–2030

THE 80 PERCENT CLEAN GRID DRIVES SIGNIFICANT INVESTMENT IN ALL U.S. REGIONS
Achieving 80 percent clean electricity by 2030 requires $1.5 trillion in clean energy capital
investments and $100 billion in transmission capital investments. Because of the steep decline in
renewable energy costs, these new investments are widely spread across the country, including in
states traditionally dominated by coal and gas generation (Figure ES-8). The availability of low-cost
renewables suggests that the vast majority of the nation can take advantage of new job creation,

                                                                                                   8
local investment, infrastructure spending, and lower electricity costs, all while supporting an
ambitious, national clean electricity standard.
Figure ES-7. New Capacity Additions in the 80% Clean Case by 2030
ACCELERATING THE CLEAN ENERGY FUTURE
The federal government should establish an interim power sector decarbonization target year of
2030 to help align expectations for 100 percent clean electricity and inform the policy dialogue
needed to achieve such an ambitious goal. Aiming for 80 percent clean electricity by 2030 is also
critical for achieving rapid, cost-effective electrification of other sectors such as transportation,
buildings, and industry. By 2030, emerging technologies such as long-duration storage, stationary
fuel cells, CCUS, and others should be mature enough to begin to replace the remaining natural
gas generation as the nation accelerates toward 100 percent clean electricity. Reaching 80 percent
zero-carbon electricity in the U.S. by 2030, coupled with aggressive transportation, buildings, and
industrial electrification, would achieve a nearly 50 percent reduction in economy-wide CO2
emissions from 2005 levels and put the U.S. on a 1.5°C consistent pathway.
9TABLE OF CONTENTS
Executive Summary 2
Table of Contents 10
Acknowledgements 10
1. Introduction 11
2. Methods and Data Summary 13
3. Key Findings 16
3.1 Strong Policies Are Required to Create a 80% Clean Grid by 2030 16
3.2 The 80% Clean Grid Is Dependable without Coal Plants or New Gas Plants 18
3.3 Electricity Costs from the 80% Clean Grid Are the Same as Today’s Costs 23
3.4 Scaling-Up Renewables to Achieve 80% Clean Energy by 2030 Is Feasible 28
3.5 The 80% Clean Grid Drives Significant Investment Across All U.S. Regions 29
3.6 The 80% Clean Grid Avoids $1.7 Trillion in Health and Environmental Damages from the
Power Sector, Including 93,000 Premature Deaths, Through 2050 32
3.7 Towards 100% Grid Decarbonization 34
Caveats and Future Work 35
Conclusion 35
References 36
ACKNOWLEDGEMENTS
We thank Sarah Spengeman of Energy Innovation, Ric O’Connell of GridLab, and Chelsea Eakin of
Climate Nexus for their reviews, contributions, and support. We are thankful to the National
Renewable Energy Laboratory for making its ReEDS model publicly available, as well as all their
scenarios and the Annual Technology Baseline.
101. INTRODUCTION
Global carbon emissions must be halved by 2030 to limit warming to 1.5°C and avoid catastrophic
climate impacts. As the nation coalesces around 2035 as the target year for power sector
decarbonization, rapid progress must be made in the next decade in order for this target to remain
in reach. The United States has already committed to reducing its economy-wide greenhouse gas
emissions in 2030 by 50-52 percent below 2005 levels. Ambitious power sector decarbonization
enables economy-wide decarbonization of the building, industrial, and transportation sectors,
setting the U.S. on a 1.5°C pathway commensurate with international climate goals.
Since the release of the 2035 Report: Plummeting Solar, Wind, and Battery Costs Can Accelerate
Our Clean Electricity Future (“2035 Report”), federal legislation, as well as President Joe Biden’s
American Jobs Plan and the U.S. Nationally Determined Contribution to the Paris Agreement, have
catapulted ambitious clean electricity standards (CES) into the national policy discourse. These
policies range in their ambition, but modeling of the U.S. NDC to reduce economy-wide emissions
50 percent from 2005 levels by 2030 converges with the need to reach at least 80 percent clean
electricity by 2030.
Several recent studies have analyzed the impacts of high renewable energy power systems in the
medium- to long-term, including our 2020 release of the 2035 Report. However, very few have
utilized comprehensive grid modeling to assess the technical and operational feasibility and
economic viability of aggressive grid decarbonization (80 percent or more) in the medium-term
(2030 timeframe). This report uses nearly identical methodology to the original 2035 Report to
investigate the impact of 80 percent CES by 2030, and can be viewed as a supplemental analysis
that focuses on the implications of an accelerated interim target.
As the 2035 Report explored, plummeting costs for wind and solar energy have dramatically
changed the prospects for rapid, cost-effective expansion of renewable energy. At the same time,
battery energy storage has become a viable option to cost-effectively integrate high levels of wind
and solar generation into electricity grids and rapidly transition to electric vehicles.
This report uses the latest renewable energy and battery cost data to demonstrate the technical
and economic feasibility of achieving 80 percent clean (carbon-free) electricity in the United States
by 2030—much more quickly than projected by most recent studies. Two central cases are
simulated using state-of-the-art capacity-expansion and production-cost models:
• The No New Policy case assumes continuation of current state and federal policies.
• The 80% Clean case requires that a national 80 percent clean electricity share is reached
by 2030, along with aggressive transportation electrification as outlined in the 2035
11Report 2.0 (Phadke et al, 2021). Generation from any resource that does not produce
direct carbon dioxide (CO2) emissions is considered clean in this analysis, including
generation from nuclear, hydropower, wind, solar, biomass, geothermal, and fossil fuel
plants with carbon capture and storage.
Consideration of the accelerated 2030 timeframe helps align expectations for power-sector
decarbonization with climate realities while informing the policy dialogue needed to achieve such
an ambitious goal. This report’s target of 80 percent clean electricity (rather than 100 percent) by
2030 is also important for envisioning decarbonization at a pace more rapid than considered in
previous studies. Achieving deep power sector decarbonization in 2030 will likely increase the
speed and cost-effectiveness of pervasive, cross-sector decarbonization.
After a brief description of methods and data, the key findings of the 2030 Report are summarized.
A companion report from Energy Innovation surveys other credible analyses of rapid electricity
sector decarbonization in the U.S., and argues in support of a federal 80 percent by 2030 CES
(Energy Innovation 2021).
122. METHODS AND DATA SUMMARY
We performed power sector modeling using nearly identical methods to the original 2035 Report,
which benefitted from consultation with a technical review committee consisting of experts from
utilities, universities, and think tanks. We employed state-of-the-art models, including NREL’s
Regional Energy Deployment System (ReEDS) capacity-expansion model and Energy Exemplar’s
PLEXOS electricity production-cost model, in conjunction with publicly available generation and
transmission datasets. Forecasts of renewable energy and battery cost reductions were based on
NREL’s ATB 2019 (NREL 2019).3 We used these data and methods to analyze two central cases:
● No New Policy: Assumes current state and federal policies and forecasted trends in
technology costs and electrification.4 In regard to transportation electrification, this
scenario assumes the continuation of existing (2020) state and federal policies and
assumes the extant barriers to EV adoption persist. In this scenario, EVs constitute about
22 percent of new light-duty vehicle (LDV) sales, 10 percent of new medium-duty vehicle
(MDV) sales, and 5 percent of new heavy-duty truck (HDT) sales in 2030 The scenario is
based on projections from Bloomberg New Energy Finance (BNEF), which suggest that—
absent policy intervention—internal combustion engine (ICE) vehicles will constitute 46
percent of the total on-road vehicle population by 2050 (McKerracher 2021).
● 80% Clean: Requires a national 80 percent clean electricity share by 2030. All coal-fired
power plants are assumed to retire by 2030. On the vehicle electrification side, we project
that electric vehicles constitute 100 percent of new LDV sales and 80 percent of new MDV
and HDT sales in the U.S. by 2030, as modeled in the DRIVE Clean scenario in the 2035
Report 2.0 (Phadke et al, 2021). The DRIVE Clean scenario assumes new policies are
adopted and market forces quickly shift to overcome EV-related barriers. By 2050, EVs
constitute 97% of all on-road vehicles. We also include electrification of buildings and
industries, per NREL’s Electrification Futures Study High Electrification Scenario.
We analyzed how the 80% Clean case would respond to periods of extraordinarily low renewable
energy generation and/or high demand in order to ensure that a system with 80 percent non-fossil
supply meets demand in every hour. To assess system dependability, defined as the ability to meet
power demand in every hour of the year, we simulated hourly operation of the U.S. power system
over 60,000 hours (each hour in 7 weather years). For each of these hours, we confirmed that
electricity demand is met in each of the 134 regional zones (subparts of the U.S. power system
represented in the model) while abiding by several technical constraints (such as ramp rates and
3 The cost reductions detailed in this report refer primarily to utility-scale PV, wind, and battery storage. Distributed PV is considered
in this analysis, serving as an input to the ReEDS model based on NREL modeling assumptions. In 2030, under the 80% Clean case,
there are approximately 48 GW of distributed PV, representing approximately 1.5% of total energy generation.
4 ReEDS considers relevant state and federal policies, such as state Renewable Portfolio Standards, as of early 2020.
13minimum generation) for more than 15,000 individual generators and 310 transmission lines.
Further work is needed to assess issues such as the effect of the 80% Clean case on loss of load
probability, system inertia, and alternating-current transmission flows.
We also considered three primary sets of future renewable energy and battery storage cost
assumptions (Figure 2):
● Low-Cost: NREL ATB low-case assumptions, assuming 40 percent to 50 percent cost
reductions for PV, wind, and storage by 2030 (compared with 2020).
● Base-Cost: modified NREL ATB mid-case assumptions, assuming 2021 costs begin at the
ATB low-case assumptions, but post-2021 cost reductions are in line with the ATB mid-
case.
● High-Cost: NREL ATB mid-case assumptions, including assumed 2020 costs that are higher
than actual 2020 costs.
Figure 2. Historical and projected technology cost declines on which our analyses were based. For solar and wind, the historical
LCOE was estimated by adjusting historical power-purchase agreement (PPA) prices for subsidies (investment tax credit and
production tax credit). PPA price data were obtained from Lawrence Berkeley National Laboratory’s utility-scale solar (Bolinger et
al. 2019a, 2019b) and wind (Wiser and Bolinger 2019) reports. For four-hour batteries, historical pack costs were based on
Bloomberg New Energy Finance data (Goldie-Scot 2019), and balance-of-system cost data were from NREL (2019). Future cost
projections for all three technologies were based on NREL (2019).
We tested the robustness of our findings through sensitivity analyses of the key input assumptions
used in this report, including sensitivities around technology costs and fossil gas prices. We
considered three primary sets of future renewable energy and battery storage technology costs
14(described above) and two sets of fossil gas prices. The base case fossil gas prices are the same as
in the reference case in the U.S. Energy Information Administration (EIA) Annual Energy Outlook
(EIA 2020a). The low gas prices use New York Mercantile Exchange (NYMEX) future prices until
2022, and beyond 2022 the price of gas is kept constant at $2.75/MMbtu (2020 real). We
evaluate all permutations of these assumptions for the No New Policy and 80% Clean cases (24
cases in total).
We rely on the peer-reviewed literature to estimate the value of environmental and public health
impacts. For the transportation sector health impacts, we use national average mortality factors
of vehicle-miles traveled from Thakrar et al. (2020) to estimate total premature deaths due to
vehicular criteria air pollutant emissions, specifically from primary and secondary particulate
matter (PM2.5), in each year. For the power sector health impacts, we use the same methodology
used in the 2035 Report. We estimate the change in yearly sulfur dioxide (SO 2) and nitrogen oxide
(NOx) emissions (which contribute to secondary PM 2.5 formation in the atmosphere) in each of the
134 grid regions based on the ReEDS output. We then apply state-level mortality factors from
Thind et al. (2019) to estimate total premature deaths due to SO 2 and NOx emissions in each state.
We estimate the economic benefits of avoided CO2 and PM2.5 emissions using a methodology and
values consistent with the 2035 Report. We multiply the value of a statistical life from Holland et
al. (2020), $9.6 million (2020 real), with the avoided premature deaths due to primary and
secondary PM2.5 emissions reductions. The economic benefit of avoided CO2 emissions is
estimated using a social cost of carbon derived from Baker et al. (2019), Ricke et al. (2018), and
Caldeira et al. (2016), which is $49.6/MT in 2020, increasing at 3 percent per year ($66.1/MT by
2030). We multiply the social cost of carbon by net carbon dioxide (CO2) emissions reductions
from the transportation and power sectors.
153. KEY FINDINGS
The key findings from our analysis are as follows:
3.1 STRONG POLICIES ARE REQUIRED TO CREATE AN 80 PERCENT CLEAN GRID BY
2030
In the 80% Clean case, we require the model to reach an 80 percent clean electricity system by
2030. In this analysis, clean generation refers to resources that produce no direct CO2 emissions,
including hydropower, nuclear, wind, PV, biomass, fossil generation with 100 percent carbon
capture5. In the No New Policy case, however, the grid mix is determined by least-cost capacity-
expansion modeling based on the current paradigm for electricity-market costs, which does not
fully internalize the costs of environmental and health damages from fossil fuel use. As a result,
clean resources only supply 45 percent of the electricity in the No New Policy case in 2030. Figure
3 compares the grid mixes in the two cases. The 2030 mix in the No New Policy case is similar to
the 2030 grid mix from EIA’s Annual Energy Outlook Reference Case (47 percent clean generation)
(EIA 2020a).
Figure 3. Generation Mixes for the 80% Clean Case (left) and No New Policy Case (right), 2020–2030
The 80% Clean case assumes implementation of policies that promote large-scale renewable
energy adoption and yield net societal benefits compared with the business-as-usual approach
assumed under the No New Policy case. As detailed in Sections 3.3 and 3.6, the wholesale
electricity cost in the 80% Clean case does not increase from today’s level. The nominal cost
increase (6 percent) relative to the No New Policy future are more than offset by the societal
benefits provided by an 80 percent clean electricity system.
5 There is no partial credit for partial carbon capture.
163.2 THE 80 PERCENT CLEAN GRID IS DEPENDABLE WITHOUT COAL PLANTS OR NEW
GAS PLANTS
Given the dramatic decline in battery storage prices, we find that significant battery storage is
cost-effective and plays a critical role in balancing the grid. We estimate that in 2030 about 1,450
GWh (227 GW of batteries with average duration of about 6 hours6) of storage cost-effectively
supports grid operations in the 80% Clean case, representing about 11 percent of daily electricity
demand. When renewable energy generation exceeds demand, storage can charge using this
otherwise-curtailed electricity and then dispatch electricity during periods when renewable
generation falls short of demand. Despite the addition of storage, our modeling results show about
8 percent of available renewable energy would be curtailed annually by 2030. Beyond 2030, and
perhaps sooner, new long-duration storage technologies might become available to reduce
curtailment and gas generation further, but we did not address this potential here.
To estimate the generation capacity required to meet system demand in every hour, even during
periods of low renewable energy generation and/or high demand, we simulate hourly operation
of the U.S. power system for more than 60,000 hours (each hour in 7 weather years). For each of
these hours, we evaluate and confirm how electricity demand is met in each of the 134 regional
zones (subparts of the U.S. power system represented in the model) while abiding by several
technical constraints (such as ramp rates and minimum generation) for more than 15,000
individual generators and 310 transmission lines.
Over the 7 weather years, we find significant variation in wind and solar generation. During the
hour of lowest wind and solar generation, total wind and solar generation is 95 percent below
rated capacity (about 46 GW of generation from 1,150 GW of total installed capacity) and 85
percent below the yearly average of wind and solar generation. Solar generation drops to zero in
night hours, whereas the lowest hourly period of wind generation is about 88 percent below
average. Wind and solar generation perform significantly better compared to average output over
days and weeks (Figure 4).
6The model builds 7GW of 2-hour batteries, 32GW of 4-hour batteries, 99GW of 6-hour batteries, 89GW of 8-hour batteries, and
1GW of 10-hr batteries.
17Figure 4. Maximum drop in wind and solar output relative to average wind and solar generation
To highlight the dependability of an 80 percent clean electricity grid and estimate natural gas
capacity requirements, we identify the period during the 7 weather years when maximum natural
gas generation capacity is dispatched to compensate for the largest gap between clean electricity
generation (including battery generation) and load. The maximum natural gas capacity dispatched
is 303 GW on August 1 in one of the weather years (2007) (Figure 5). At 8:00 pm Eastern Time on
that day, national solar generation declines to 51 GW (70 percent below its annual average), while
wind generation (83 GW) is about 50 percent below its annual average, resulting in only about 134
GW of wind and solar production (about 60 percent below the annual average, as indicated in
Figures 6 and 7). The total system demand of about 716 GW is met by a combination of other
clean resources, such as hydropower and nuclear (totaling 126 GW), approximately 150 GW of
battery discharge and 303 GW of gas (Figure 8).
18Figure 5. Hourly U.S. power system dispatch for extreme weather days in the 80% Clean case in 2030. Figure 5 details the dispatch
for the period of maximum natural gas generation, one week in late July and early August. Approximately 303 GW of natural gas is
dispatched to meet demand on August 1, while renewables contribute significantly less generation than normal. Even when wind
and solar generation drops to low levels, existing hydropower, nuclear power, and natural gas capacity, as well as new battery
storage, are sufficient to maintain dependable system operations.
19Figure 6. Hourly U.S. Power-System Dispatch for an Average Weather Day in the 80% Clean Case in 2030. Figure 6 details the annual
average generation stack for each hour of an average weather day. Wind and solar provide a large share of nighttime and daytime
generation, respectively, and broadly complement each other. Battery storage is primarily dispatched during evening hours when
solar generation drops, and load remains relatively high.
For all weather years, the natural gas capacity requirements are highest in August, when wind
generation falls significantly (Figures 7 and 8). Natural gas generation above 270 GW is required
for fewer than 38 hours per year over the 7-weather-year simulation. Of the 303 GW of natural
gas capacity that gets dispatched in 2030 under the 80% Clean case, 50 GW has a capacity factor
below 1 percent. Other technology alternatives not considered in this analysis, such as demand
response or flexible load, may be more cost-effective than gas for system balancing in those hours,
and lay the groundwork for further electricity system decarbonization.
We also find that increased electrification of the U.S. economy has little impact on the maximum
natural gas capacity required, but it reduces curtailment.
20Figure 7. Daily U.S. Power System Dispatch Averaged Over 7 Weather Years in the 80% Clean Case in 2030
Figure 8. Hourly U.S. Gas Dispatch over 7 Weather Years in the 80% Clean Case in 2030. Figure 8 details the hourly gas generation
in 2030 for 7 weather years. The maximum natural gas generation required is 303 GW on August 1 in weather year 2007.
Using 7 years of weather and load data provides a robust picture of grid dependability, however it
is not the full universe of possible weather and load combinations. Our analysis does not consider
21additional weather years beyond this owing to lack of data. For example, it does not consider
increasing extreme weather events, including extreme heat expected as the planet continues to
warm from anthropogenic greenhouse gas emissions. Nor does it explore in detail the interaction
between drought, heat, and hydropower availability. But renewable energy variation we observe
over the 7-year period is similar to the variation observed over a 35-year period by Shaner et al.
(2018). Shaner et al. may underestimate the variation in wind generation compared to that seen
in our data, as they consider significantly lower spatial resolution than our study. However, our
simulation includes adequate gas and battery storage capacity to meet residual load (load minus
clean energy generation) up to 100 percent of average load and 80 percent of peak load. Hence,
even if a longer period of weather data reveals larger gaps between load and wind/solar
generation, additional firm capacity requirements are unlikely to be significant. However, further
work is needed to assess this possibility.
In summary, existing hydropower and nuclear power capacity (after accounting for planned
retirements combined with about half of existing fossil gas capacity, and 227 GW of new 2- to 10-
hour battery storage, is sufficient to meet U.S. electricity demand with an 80 percent clean grid in
2030, even during periods of low renewable energy generation and/or high demand. Under the
80 percent Clean case, all existing coal plants are retired by 2030, and no new fossil fuel plants are
built beyond those already under construction. During normal periods of generation and demand,
wind, solar, and batteries provide 60 percent of total annual generation, while hydropower and
nuclear provide 20 percent. During periods of high demand and/or low renewable generation,
existing gas plants (primarily combined-cycle plants) cost-effectively compensate for remaining
mismatches between demand and renewables-plus-battery generation—accounting for about 20
percent of total annual electricity generation, which is about 30 percent lower than gas generation
in 2019.
Although the capacity-expansion modeling (ReEDS) required that clean resources contribute 80
percent of annual generation in 2030, the hourly operational model (PLEXOS) simulated roughly
79.3 percent clean generation, primarily due to somewhat higher curtailment of wind and solar.
PLEXOS model dispatch decisions were based on the variable cost of generation and did not
consider the carbon free or non-carbon free nature of the generation source.
In an electricity market with an 80 percent clean energy constraint, as modeled in our 80% Clean
Case, clean energy may bid negative prices in certain hours in order to get dispatched and meet
the 80 percent constraint. We utilize ReEDS to effectively model this 80 percent clean electricity
share, while the main purpose of our simulation in PLEXOS is to evaluate operational feasibility.
22For this reason, we did not simulate the same 80 percent clean energy constraint in PLEXOS, which
might have required clean energy to bid negative prices in order to get dispatched.7
Our modeling approach represents a conservative strategy for achieving 80 percent clean energy.
Various complementary approaches could help achieve this deep decarbonization, with potential
for even lower system costs and accelerated emissions reductions. In this analysis, we do not
consider “managed” or flexible charging of EVs, (see the methodology detailed in 2035 Report
2.0.). However, demand-side approaches, such as “managed” charging, demand response, and
other flexible loads could play a large role in grid operations. With proper rate design, flexible load
could similarly take advantage of zero or negatively priced electricity that is likely to occur during
the hours of curtailment, which will likely increase the overall clean energy share. New supply-side
resources, such as firm low-carbon generation or longer-duration storage, could also provide
system flexibility. Such alternative approaches to balancing generation and demand could cost less
than retaining significant natural gas capacity that is rarely used, if an 80 percent by 2030 CES is
pursued.
3.3 ELECTRICITY COSTS FROM THE 80 PERCENT CLEAN GRID ARE THE
SAME AS TODAY’S COSTS
Wholesale electricity (generation plus incremental transmission) costs are the same in 2030 under
the 80% Clean case as they are today (Figure 9).8 The base wholesale electricity cost under the
80% Clean case is 5.1 cents/kWh, which is the same as that in 2020. Wholesale costs in the 80%
Clean case in 2030 are 4.7–5.3 cents/kWh across all cost sensitivities. The only sensitivity case in
which those costs are marginally (4 percent) higher than costs in 2020 assumes high technology
costs. Unchanged wholesale costs between 2020 and 2030 imply no impact on retail electricity
prices, assuming electricity distribution costs do not change significantly in the 80% Clean case.9
7 The fact that PLEXOS curtails more clean energy generation than ReEDS is primarily due to two factors: 1) ReEDS does not have
the full set of real system constraints; and 2) we are not modelling a clean energy constraint or negative bid prices in PLEXOS.
8 Costs include recovery of capital costs from new and existing generation capacity, fixed operations and maintenance costs, fuel
and variable operations and maintenance costs, and new transmission (bulk and spurline) investments. The cost figures referenced
throughout this report refer to the total wholesale generation costs plus the cost of additional transmission investments beyond
2020.
9 We assume distribution costs do not rise faster than inflation in the next 10 years. Because the 80% Clean case does not rely
heavily on distributed energy resources, this is a reasonable assumption. Distributed PV serves as an input to the ReEDS mode l
based on NREL’s distributed generation model. In 2030, under the 80% Clean case, there are approximately 48 GW of distributed
PV, representing approximately 1.5 percent of total energy generation. Also, as shown in The 2035 Report 2.0, transport
electrification does increase overall distribution investments but does not result in an increase in the average distribution costs
since the electricity sales also increase in the same proportion.
23These findings are similar to the findings of power system studies conducted in the past one-two
years, but the clean power system target date for most of those studies is 15 years later than 2030
(Jayadev et al. 2020, Bogdanov et al. 2019). Our findings contrast sharply with the findings of
studies completed more than five years ago, which show future electricity bills rising compared to
today’s bills. For example, NREL’s Renewable Electricity Futures Study, published in 2012,
projected retail electricity price increases of about 40 percent–70 percent above 2010 prices, for
a system with 80 percent renewable electricity penetration in 2050 (NREL 2012). Renewable
energy and battery costs have declined much faster than these older studies assumed, which is
the main reason their cost results differ so much from ours.
Figure 9. Wholesale Electricity Costs (Costs of Generation and Incremental Transmission) with (left) and without (right) Including
Environmental (Air Pollution and Carbon Emissions) Costs, for the 80% Clean and No New Policy Cases. If environmental costs are
included, wholesale electricity costs are about 25 percent lower in 2030 under the 80% Clean case than they are in 2020, and they
are 31 percent lower in 2030 under the 80% Clean case than they are in 2030 under the No New Policy case. Without considering
environmental costs, wholesale electricity costs remain the same in 2030 under the 80% Clean case as they are in 2020. Relative
to the no policy case wholesale electricity costs are 6 percent higher in 2030 under the 80% Clean case than they are under the No
New Policy case.
Low renewable energy and storage costs are the primary reasons that electricity costs stay the
same between 2020 and 2030 under the 80% Clean case. Section 2 shows the dramatic renewable
energy and storage cost trends. Figure 10 illustrates that these competitive costs become available
throughout the country, even in regions previously considered resource-poor for renewable
energy generation. Our estimates align with some of the recent renewable energy bids seen in
relatively resource-poor regions.
24Figure 10. Average Solar (left) and Wind (right) LCOE by Region in the 80% Clean Case in 2030. The maps show capacity-weighted
average LCOE for the least-cost portfolio to meet the 80% clean energy target for the 134 balancing areas represented in ReEDS.
LCOE includes the current phase-out of the federal renewable energy investment and production tax credits. The LCOE in most
zones is lower than 4 cents/kWh. We use NREL’s 2019 ATB Mid-Case (NREL 2019) for cost projections with some modifications,
which account for the cost reductions already benchmarked to recent PPA pricing.
Under the 80% Clean case, most transmission investments are in new spurline transmission rather
than bulk transmission (Figure 11).10 Although the 80% Clean case requires about four times more
spurline investment than the No New Policy case does, the total new transmission requirements
in the 80% Clean case add only 0.15 cents/kWh to total system costs.11 Recent studies that account
for low renewable energy and storage costs have similar findings (Jayadev et al. 2020). Studies
that assume much higher renewable energy costs or do not consider storage find higher levels of
additional bulk transmission required (Clack et al. 2017, NREL 2012).12 Recent work from Larson
et al. (2020) and Clack et al. (2020) find that a least-cost electricity system achieving similar rates
of clean energy deployment to our 80% Clean case has far greater levels of interregional
transmission. Further work is needed to understand transmission needs more precisely.
10 Spurline transmission refers to lines needed to connect remote renewable energy generation to the bulk transmission system or
load centers. Bulk transmission refers to larger, higher-capacity transmission lines designed to carry electricity across long distances
at high voltages, typically above 115 kV.
11 Construction of spurline transmission is likely less complex than construction of bulk transmission, because spurline transmission
typically does not cross multiple jurisdictions.
12 We assessed a scenario with higher renewable energy and storage costs based on NREL ATB 2015 (NREL 2015) and found that
significant additional bulk transmission is cost-effective, suggesting that—when renewable energy and battery costs are high—
significant new bulk transmission is useful. However, when those costs are low, as modeled in the 80% Clean case, limited new
bulk transmission investments are necessary.
25Figure 11. Additional Spurline and Bulk Transmission Investments by Interconnect under the 80% Clean and No New Policy Cases,
2020–2030. The vast majority of transmission investments are spurline investments as opposed to bulk transmission system
investments. Total transmission investments add only 0.15 cents/kWh to system costs in the 80% Clean case. ERCOT = Electric
Reliability Council of Texas, WECC = Western Electricity Coordinating Council.
Low electricity costs in the 80% Clean case are also facilitated by the limited use of fossil fuel
generators; all coal plants are retired by 2030, and no new gas plants are built (see Section 3.2).
Thus, the 80% Clean case avoids large amounts of fuel and large investments in generating
capacity that is used infrequently. In addition, using a 2030 target year provides sufficient time for
existing fossil assets to recover most of their fixed costs and thus avoids significant stranded-asset
costs. Of the approximately 800 GW of U.S. fossil fuel generation capacity operating today, 480
GW will be at least 30 years old in 2030 (Figure 12) (Jell 2017). At this time, a high percentage of
the coal and older natural gas units will be largely depreciated (given the usual depreciation life of
30 years or less) and can be retired at little or no cost to consumers and minimal stranded costs. 13
For coal plants with significant undepreciated balances, securitization of these balances through
government- or ratepayer-backed bonds can yield significant savings and reduce financial hardship
for asset owners (Aggarwal & O’Boyle 2020).
13 We define stranded cost as the cost of fossil assets that are not used but have not been fully depreciated, assuming a depreciation
life of 30 years. From a market standpoint, this applies only to assets that are built and operated by utilities. Assets that operate
under a PPA or are merchant power plants cannot be considered stranded from a market perspective. See the policy report from
Energy Innovation accompanying the original 2035 Report for further discussion of stranded assets (Energy Innovation, 2020).
26Figure 12. Undepreciated Value of Existing U.S. Fossil Fuel Capacity, 2018–2030. By 2030, the remaining
undepreciated value of generating plants is small, suggesting a transition to 80 percent clean energy can
be accomplished with minimal stranded assets.14
Conversely, using existing gas capacity to meet about 20 percent of electricity demand reduces
the need amount of new renewable energy and storage capacity needed—helping accelerate the
timeline for 80 percent clean electricity while keeping costs down. Further decarbonization could
then build on this mostly clean electricity system; several pathways to 100 percent clean electricity
have been identified. See, for example our previous work (Phadke et al, 2020b).
Although electricity costs are the same in 2030 under the 80% Clean case as they are today, they
are 0.28 cents/kWh (6 percent) higher under the 80% Clean case than they are under the No New
Policy case in 2030 (Figure 9). However, this comparison does not account for the value of carbon
emissions and air pollutant reductions, which make the societal costs of electricity substantially
lower under the 80% Clean case than they are under the No New Policy case (see Section 2.6).
Finally, significant natural gas capacity is built under the No New Policy case, which will likely result
in future stranded costs, whereas no new fossil fuel capacity is needed under the 80% Clean case.15
14 The undepreciated asset numbers are illustrative as they may not include all life-extension or pollution control related capital
expenditure.
15 If there are still a few coal units owned by regulated utilities that, in 2030 (or at time of retirement) have undepreciated life-
extension or pollution-control capital costs, those can be retired at low cost using a securitization mechanism. This approach has
been used in recent years by large investor-owned and public utilities to create a positive return for shareholders and downward
pressure on wholesale and retail electricity prices (Lehr and O’Boyle 2018).
273.4 SCALING-UP RENEWABLES TO ACHIEVE 80 PERCENT CLEAN ENERGY
BY 2030 IS FEASIBLE
To achieve the 80% Clean case by 2030, a substantial increase is needed in U.S. renewable energy
installations due to the accelerated electrification of the transportation, industry, and buildings
sectors. The combined demand growth requires electricity generation to increase approximately
2 percent per year, consistent with the 2.6 percent average historical growth in the electric sector
during 1975–2005, when emissions in industry peaked (Figure 13).
Figure 13. Total electricity consumption – historical and with additional electrification
We find that between 2021 and 2030, 950 GW of new wind and solar generation capacity must
be built, averaging about 95 GW per year (Figure 14). In addition, 227 GW of battery storage
capacity needs to be built, averaging about 23 GW per year. For comparison, the size of today’s
U.S. power sector is approximately 1,000 GW. Although challenging, a renewable energy buildout
of this magnitude is feasible with the right supporting policies in place.
28Figure 14. Cumulative New Capacity Additions in the 80% Clean Case, 2020–2030
Historical and planned U.S. generation deployments also suggest that annual deployments of 120
GW (95 GW RE and 25GW of storage) are possible. The US 65 GW of gas generation in 2002 (Ray
2017). In 2020, the U.S. deployed 31 GW of wind and solar capacity (SEIA 2021; ACP 2021). In
2020, China built 120GW of solar and wind capacity in a year. Interconnection queues in the U.S.
as of 2019 included 650 GW of wind, solar, hybrid, and standalone battery storage, more than half
of the 1,000 GW required (Bolinger et al. 2019a, 2019b) in the 80% Clean case. Storage, onshore
wind, and solar generation generally have shorter construction times compared with natural gas
plants, and they do not require a gas pipeline connection. Significant policy support is needed to
achieve this level of renewable energy deployment (Aggarwal & O’Boyle 2020).
New renewable resources can be built cost-effectively in all regions of the country, as indicated by
the proliferation of utility-scale renewables nationwide. The top 10 states for installed utility-scale
solar represent at least four distinct regions: New England, the Southeast, the West, and the
Southwest. More than 75 percent of U.S. states have one or more utility-scale solar projects
(Bolinger et al. 2019a, 2019b). The Midwest, once considered a laggard for utility-scale renewable
projects, accounted for the largest percentage of solar added to interconnection queues in 2018
(26 percent).
3.5 THE 80 PERCENT CLEAN GRID DRIVES SIGNIFICANT INVESTMENT
ACROSS ALL U.S. REGIONS
Because of the deep reduction in the wind and solar prices, renewable energy investments are
found to be cost effective throughout the country, including states with significant existing coal
29and gas capacity. This implies significant job gains and opportunities for a just transition from fossil
fuels.
Figure 15: Cumulative New Renewable Energy and Storage Investment (2021-2030) by State
Table 1: Top-15 States by New Clean Energy Investments in the 80% Clean Case (2021-2030 total)
State New Investments in Wind, New Investments in Wind,
Solar, and Storage Solar, and Storage
(GW) ($ Billion, 2020 real)
Texas 153 190
Florida 153 171
California 70 92
Kentucky 56 65
South Carolina 56 59
Virginia 47 59
Ohio 46 55
New York 27 53
Arizona 37 46
Missouri 34 45
Michigan 34 44
30Oklahoma 35 44
North Carolina 38 42
Indiana 32 40
Wyoming 24 38
All regions of the country could experience significant economic activity from local renewable
energy generation and storage deployment. However, in some communities, the shift away from
fossil fuel generation may disrupt workers and communities that rely on jobs and tax revenue
related to fossil fuel production and power generation. Policies implemented to decarbonize the
power sector should include explicit measures to support transitions to a lower-carbon economy.
Existing research suggests that wind and PV plants can be built close to many retiring coal plants,
helping to provide new economic opportunities in the impacted communities (Gimon et al. 2019).
Support for economic redevelopment and diversification beyond the clean energy industry can
help more generally with an effective transition from fossil fuels. Energy Innovation’s 2035 Report
companion policy analysis highlights key policy drivers to support coal community services, health,
and employment during the energy transition (Aggarwal & O’Boyle 2020).
3.6 THE 80 PERCENT CLEAN GRID AVOIDS $1.7 TRILLION IN HEALTH AND
ENVIRONMENTAL DAMAGES FROM THE POWER SECTOR, INCLUDING
93,000 PREMATURE DEATHS, THROUGH 2050
The 80% Clean case nearly eliminates emissions from the U.S. power sector by 2030 (Figure 16),
resulting in environmental cost savings as well as reduced mortality related to electricity
generation. Further, achieving 80 percent clean electricity by 2030 accelerates benefits in ensuing
years, because the No New Policy power system continues to be fossil fuel dependent. We
estimate climate-related impacts using a social cost of carbon value, and we estimate human
health damages due to NOx, SO2, and fine particulate matter (PM2.5) emissions using an established
method from the literature.16 Compared to the No New Policy case, in the 80% Clean case, power
sector CO2 emissions are reduced by 1,203 million metric tons (76 percent) through 2030, while
NOx and SO2 emissions are reduced by 90 percent and 98 percent, respectively relative to the 2019
levels (Figure 16). When compared with 2005 levels, power sector CO2 emissions are reduced by
2,015 million tons or 84 percent.
16 Benefits of reduced greenhouse gas emissions are valued at a social cost of carbon of approximately $50/metric ton (derived
from Baker et al. 2019 and Ricke et al. 2018). Avoided air pollution damage estimates for SO 2, NOx, and PM2.5 are based on state-
by-state damage factors provided by Maninder Thind based on Thind et al. (2019).
31Figure 16. Emissions Reductions of CO2, SO2, and NOx in the 80% Clean and No New Policy Cases, 2020–2030
Transport electrification also results in significant emissions reduction. By 2030, transportation
sector CO2 emissions fall by 522 million tons (30 percent) from 2019 levels and by 612 million tons
(33 percent) from 2005 levels. The combined power and transportation sector emissions
reductions reduce overall economy-wide energy related CO2 emissions (excluding land use and
agricultural sectors) by 1,723 million tons, or 31 percent relative to the 2019 levels (Figure 17).
When compared with 2005 levels, the economy-wide energy related CO2 emissions are reduced
by 42 percent. When combined with electrification of buildings and industries, total economy-
wide CO2 emissions reductions are nearly 50 percent lower relative to the 2005 levels, a target
that is critical for limiting the global warming to 1.5°C.
Figure 17. Power sector (left), transportation sector (center), and economy-wide (right) CO2 emissions in the 80% Clean and No
New Policy Cases, 2020-2030.
32As a result, the 80% Clean case avoids about $1.7 trillion (in 2020 dollars) in environmental and
health costs through 2050, including approximately 93,000 premature deaths, due to avoided SO2,
NOx, and CO2 emissions from power sector (Figure 18).17 The environmental cost savings in 2030
from power sector alone roughly equate to $25/MWh (or 2.5 cents/kWh) of wholesale electricity
costs. Avoided premature deaths are primarily because of reduced exposure to PM 2.5, driven by
reductions in SO2 emissions, a precursor to PM 2.5, from coal plants.18 About 68 percent of the
avoided environmental costs are from avoided CO2 emissions, with the remainder associated with
reduced exposure to PM2.5.
The environmental benefits of transport electrification are equally significant. Between 2020 and
2050, vehicle electrification avoids over 150,000 additional premature deaths and over $1.3
trillion in environmental costs. Power sector decarbonization and transportation electrification
together avoid over 240,000 premature deaths and $3 trillion in environmental costs.
Figure 18. Annual premature deaths due to local air pollution in the power (center), transportation (right), and combined power
and transportation (left) sector 2020–2050. The 80% Clean case coupled with transport electrification avoids about 240,000
premature deaths by 2050 relative to the No New Policy case.
These estimates are meant to illustrate the magnitude of some of the societal benefits that may
be realized through rapid power-sector decarbonization. However, the environmental and health
impacts of electricity use are subject to substantial uncertainties, and differences in input
parameters provided by various sources can have large effects on impact calculations (Thind et al.
17 Coal power generation accounts for about 80% of air pollution related premature deaths and about 70 percent of CO 2 emissions
associated with the U.S. power sector in 2019. The marginal environmental damage of coal (which our modeling does not include
in our main scenarios) is highly significant (about two times the variable cost of coal).
18 Primary PM
2.5 emissions factors are not modeled in ReEDS, and hence our estimate of reduced emissions contributing to reduced
PM2.5 exposure may be conservative. Based on Thind et al. (2019) and Goodkind et al. (2019), primary PM 2.5 emissions contribute
to roughly 10–15 percent of premature deaths due to PM2.5 exposure.
33You can also read