Energy Clusters as a New Urban Symbiosis Concept for Increasing Renewable Energy Production-A Case Study of Zakopane City - MDPI
←
→
Page content transcription
If your browser does not render page correctly, please read the page content below
sustainability

Article
Energy Clusters as a New Urban Symbiosis Concept
for Increasing Renewable Energy Production—A Case
Study of Zakopane City
Agnieszka Czaplicka-Kotas 1, *, Joanna Kulczycka 2, *        and Natalia Iwaszczuk 1
 1    Faculty of Management, AGH University of Science and Technology, 30-067 Cracow, Poland;
      niwaszcz@zarz.agh.edu.pl
 2    Mineral and Energy Economy Research Institute, Polish Academy of Sciences, 31-261 Cracow, Poland
 *    Correspondence: agnieszka.czaplicka@iati.pl (A.C.-K.); kulczycka@meeri.pl (J.K.)

 Received: 27 May 2020; Accepted: 8 July 2020; Published: 13 July 2020

 Abstract: One of the priority lines of action in Poland is to increase energy production from renewable
 energy sources (RESs). Based on the “Poland’s national energy and climate plan for the years
 2021–2030”, Poland aims to achieve 21%–23% of RES share in gross final energy consumption by 2030.
 While coal is still the most important source of energy, new technological and organisational solutions
 for increasing RESs are being tested and implemented. Therefore, the creation of energy clusters
 based on the idea of urban and industrial symbiosis was first proposed by the Ministry of Energy in
 2016. To date, there are 66 clusters in different regions in Poland, but only a few of them are active
 and innovative. One of them is located in the city of Zakopane, a mountain resort, which attracts
 about 3 million tourists annually and has developed the wide-ranging use of geothermal sources for
 energy supply and recreation. The paper aims to analyse the impact of the creation of energy clusters
 on the city’s development, including economic, social, and environmental aspects. The “willingness
 to pay” (WTP) method was used to calculate the impact of air pollution on Zakopane and to compare
 it with the Polish average to estimate the significance of the transformation to RESs in this tourist
 city. The results from the studies are as follows: health cost per capita in Zakopane is between 252.07
 and 921.30 euro. The investigations presented can be the basis for recommendations in strategic
 documents in the field of regional development and environmental protection, especially on the use
 and promotion of urban symbiosis for increasing use of RESs.

 Keywords: energy cluster; urban symbiosis; willingness to pay; air pollution

1. Introduction
     It has been observed that the rate of urbanisation has been increasing in recent years—in the
1950s, 30% of the population lived in urban areas; in the 2010s, the rate reached 55%, and according
to forecasts it may be as high as 68% in the 2050s [1]. Due to ongoing change, cities are focusing
their strategies on their environmental and social performance, including, e.g., climate change and
energy scarcity [2,3]. Different projects designed to achieve environmental goals are underway, for
example the assessment and accounting of the urban ecological footprint, effective treatment and
management of municipal wastes, ecologically sustainable urban areas, planning and development of
an eco-city [4]. However, there is still evidence of positive interdependence between the development
of fragmented urban areas and the concentration of air pollutants [5,6]. The most common health
impact of air pollutions is heart disease and stroke, which causes premature death [7]. On a global
scale, air pollution is responsible for 20% of the deaths caused by cardiopulmonary disease in the
world [8]. One of the leading global risks is particulate matter (PM2.5 ), which leads to 6%–7% of annual

Sustainability 2020, 12, 5634; doi:10.3390/su12145634                     www.mdpi.com/journal/sustainability
Sustainability 2020, 12, 5634 2 of 15
deaths around the world [9]—in Europe alone, the concentration of this particulate matter (PM) is
responsible for 428,000 premature deaths [10]. Lelieveld et al. (2015) have estimated that pollution
such as PM2.5 and O3 contributed to a global mortality of 3.3 million in 2010 [11].
According to the World Health Organization (WHO), 36 of the 50 most polluted cities in the
European Union are located in Poland [12]. This issue is connected with particulate matter (PM),
which not only cause environmental damage but also is a key factor leading to cardiovascular diseases
and lung cancer [13]. At the local level, different types of strategies are being implemented, such as
low carbon planning, the eco-city, or the rules of clean production. However, this is still not enough.
One of the solutions for decreasing air pollution in economic, social, and environmental areas is the
development of renewable energy sources (RESs). In the long-term perspective, this is a global priority
on a local and national level. On the local level, the development of RESs is supported by different
programmes such as tax incentives, legal restrictions, and national support funds [14,15]. A unique
idea of developing energy clusters based on idea of urban symbiosis to increase RESs was introduced
in Poland in 2016 by the Act of 22 June 2016 on Renewable Energy Sources (RES Act, 2016). An energy
cluster is defined as “a civil law agreement, which may include natural persons, legal persons, scientific
units, research institutes or local government units, and which pertains to the generation and balancing
of demand, distribution or turnover of energy from renewable sources, or other sources or fuels, within
a distribution network with a rated voltage of less than 110 kV” [16]. The main goal of the activity
of these entities is energy security based on local resources, which influences the achievement of the
sustainable goals of a global economy at the national level. There are also other objectives that are
perceived as key factors in the energy clusters’ activities, such as environmental protection, effective
use of local resources, (including wasted or underutilised ones) supporting well-balanced urbanisation,
and balancing the use of distributed energy generation with conventional energy.
The development of the clusters usually has a common point with urban and industrial symbiosis,
which aims to use the potential synergy effects on the geographical localisation of the companies [17,18].
Moreover, urban symbiosis focuses on the possibility of cooperation in urban areas or between
industry and urban functions [19]. One of the primary goals of the development of urban symbiosis
is to close the loop of material and energy flows within a given urban area [20]. The research
shows that implementation of the urban symbiosis has a positive impact on among others: carbon
emission reduction [21,22], improvement in waste management [23], and the development of eco-town
programmes [24]. Often the countries that are developing, develop or have already developed the
national agenda for industrial symbiosis (i.e., Green Industrial Symbiosis in Denmark)-supported
clustering such as Kalundborg and Kwinana [25,26]. The EU plans to foster circular industrial
collaboration among SMEs on cluster collaboration [27]. In practice, urban symbiosis is often referring
to the use of waste from urban areas as a raw material or source of energy [28].
In Poland, one of the ideas of urban symbiosis focus is the concept of energy clusters. Such a solution
has been supported by three institutions, the Ministry of Energy, the National Fund for Environmental
Protection and Water Management, and the Ministry of Investment and Development [29]. So far,
66 clusters have been selected to provide the transition from conventional centralised energy generation
and fossil fuel usage towards a renewables-based decentralised energy system and to contribute to
business competitiveness, reduced resource demand and environmental impact, and to sustainable
societal developments. Such an idea should be assessed in three dimensions (environmental, economic,
and social) using a life cycle perspective [30], taking into account not only technological but also
economic and social acceptance using, i.e., multi-objective model to optimise the mix of renewable
energy [31]. The development of an energy cluster can bring additional social and environmental
benefits, which can be estimated using the willingness to pay (WTP) method. WTP method was used,
e.g., for smart home energy products and information services [32]; to calculate green electricity in
Japan [33], wind energy in Canada [34], expenditure for research and development of solar energy in
China [35]; to reduce CO2 emission [36], and as a determinant of tourists’ intention to pay a premium
for accommodation in a hotel with renewable energy sources [37]; nevertheless, the research on WTPSustainability 2020, 12,
Sustainability 2020, 12, 5634
x FOR PEER REVIEW 33 of
of 15
15
[37]; nevertheless, the research on WTP that supports clean air transition by using urban symbiosis
that supports clean air transition by using urban symbiosis for promoting RESs in tourist resorts has
for promoting RESs in tourist resorts has not been identified.
not been identified.
The aim of this paper is to estimate WTP for the most attractive mountain resort in Poland, i.e.,
The aim of this paper is to estimate WTP for the most attractive mountain resort in Poland, i.e.,
Zakopane, where an energy cluster has been developed, and to compare it with the WTP for Poland
Zakopane, where an energy cluster has been developed, and to compare it with the WTP for Poland
which was investigated on the publication of the “External health costs of air pollution emission from
which was investigated on the publication of the “External health costs of air pollution emission from
the municipal and housing sector”. Based on the results of an analysis, the advantages of developing
the municipal and housing sector”. Based on the results of an analysis, the advantages of developing
the idea of local industrial symbiosis based on energy clusters can be estimated, and those should be
the idea of local industrial symbiosis based on energy clusters can be estimated, and those should be a
a critical factor in RES increase in Zakopane.
critical factor in RES increase in Zakopane.
2. Materials and Methods
2. Materials and Methods
In 2010, in countries that are part of the WHO European Region alone, the overall annual
In 2010, in countries that are part of the WHO European Region alone, the overall annual economic
economic cost of health impacts and mortality from air pollution was estimated to be US$ 1.575
cost of health impacts and mortality from air pollution was estimated to be US$ 1.575 trillion [38].
trillion [38]. In the case of air pollution, the WTP method can be used for example: as a tool for
In the case of air pollution, the WTP method can be used for example: as a tool for assessing how much
assessing how much an entity could pay to improve air quality [39], as a source of information on the
an entity could pay to improve air quality [39], as a source of information on the costs of air quality
costs of air quality improvement that shows a positive influence on our health [40], to eliminate the
improvement that shows a positive influence on our health [40], to eliminate the risk of death [38].
risk of death [38].
To estimate the cost of air quality improvement in Zakopane and to compare it to the rest of Poland,
To estimate the cost of air quality improvement in Zakopane and to compare it to the rest of
the methodology based on the publication of the “External health costs of air pollution emission from
Poland, the methodology based on the publication of the “External health costs of air pollution
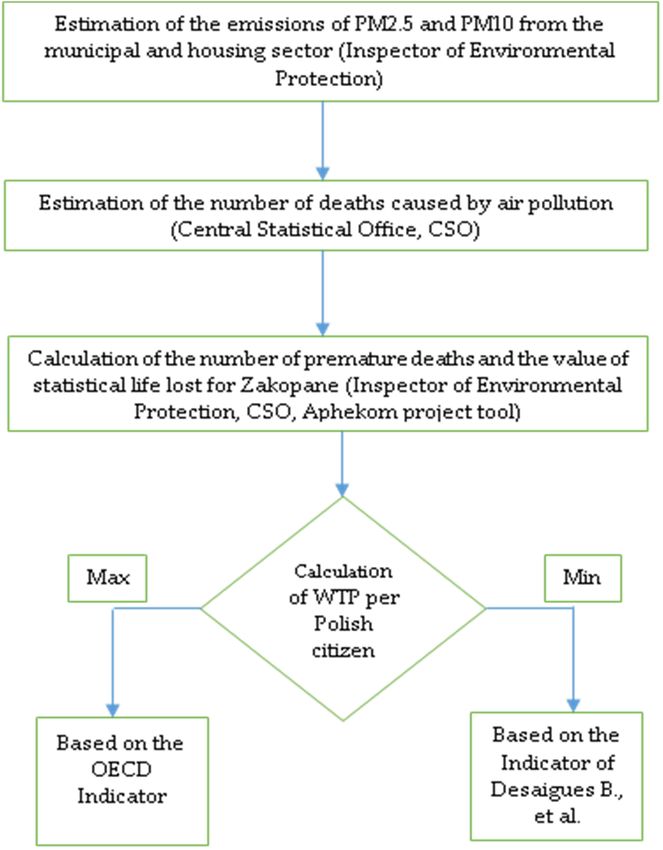
the municipal and housing sector” [41] was applied. The algorithm for the calculation of the external
emission from the municipal and housing sector” [41] was applied. The algorithm for the calculation
cost for the city of Zakopane is presented in Figure 1.
of the external cost for the city of Zakopane is presented in Figure 1.
Figure 1.1. The
Thealgorithm
algorithmforfor
thethe
calculation of willingness
calculation to pay
of willingness to (WTP) for thefor
pay (WTP) citythe
of Zakopane. Source:
city of Zakopane.
based onbased
Source: the Report
on the[41].
Report [41].
The
The first
first step
step in
in the
the analysis
analysis was
was to
to estimate
estimate the
the level
level of
of air
air pollution
pollution based
based on
on the
the data
data from
from the
the
Inspector of Environmental Protection in order to demonstrate the scale of the problem.
Inspector of Environmental Protection in order to demonstrate the scale of the problem. The numberThe number
of
of deaths
deaths caused
caused by by air
air pollution
pollution was
was taken
taken from
from Central
Central Statistical
Statistical Office
Office data
data (based
(based on
on the
the
recommendation introduced by the WHO, the analysis only includes deaths among
recommendation introduced by the WHO, the analysis only includes deaths among people over the people over
age of 30) [38,41]. Then the number of premature deaths caused by PM2.5 and PM10 emitted by theSustainability 2020, 12, 5634 4 of 15
the age of 30) [38,41]. Then the number of premature deaths caused by PM2.5 and PM10 emitted
by the municipal-utility sector was analysed. For these calculations, the tool based on Health
Impact Assessment (HIA) practices proposed in the Aphekom project (Improving knowledge and
communication for decision-making on air pollution and health in Europe) [42] was used. The following
data relating to the levels in Zakopane were analysed: emissions of PM2.5 and PM10 , deaths caused by
pollution, population numbers.
The tool enables the calculation of the number of premature deaths in Zakopane and the preparation
of an estimate of the gain in life expectancy. The calculation used the concentration–response function,
which estimates the “percentage change in health outcome per unit change in pollutant levels” [43].
Then, maximum and minimum WTPs per Polish citizen, according to [41] were calculated based
on the following publications:
• “Economic valuation of air pollution mortality”, “A 9-country contingent valuation survey of the
value of a life year (VOLY)” [44],
• “Organisation for Economic Co-operation and Development (OECD)” [45].
The minimum WTP for the average Polish citizen is €25,000, i.e., the value of lost statistical life,
and for the maximum WTP, the indicator of lost statistical life is €1.57 million [41]. These values were
applied for the calculation of the total WTP value in Zakopane city (multiplying by the number of
premature deaths). It also allows one to calculate the potential benefit associated with decreasing
pollution through the use of RESs after implementing an energy cluster policy.
3. Case Study—Zakopane
The tourism sector significantly influences the development of the Polish economy; it accounted
for 5%–6% of Gross Domestic Product (GDP) in Poland [46]. Moreover, in 2016 Poland recorded
its largest-ever number of foreign tourists: i.e., 18.3 million persons [47], primarily in Kraków and
Zakopane [48].
Zakopane is a mountain resort with high-quality tourist attractions, in which there are
269 accommodation facilities [49] in an area of 84 km2 and with 27,305 inhabitants. Particularly
popular and well-known tourist features include Tatra National Park–3 million tourists, The Shrine of Our
Lady of Fatima in Krzeptowki—2 million travellers, the Tatra Museum in Zakopane—147,728 tourists [50].
Although Zakopane is one of the most popular tourist destinations in Poland, due to its location
and the emission of dust and gas pollution, it is also one of the most polluted cities in the country.
Zakopane is located in a valley, where there is often an air inversion layer that holds all dirt close to
the ground causing smog. In the EU, it is ranked in 19th place in terms of PM10 pollution and 11th
place in terms of PM2.5 [51]. A high concentration of PM in the air results from, among other sources,
emissions from municipal sources, transport, the combustion of fuels in district heating and ineffective
coal combustion systems in heating stoves and coal-fired boilers [52].
So far, Zakopane city has been implementing different actions and projects for environmental
protection, including:
• A low-interest rate loan programme “JAWOR” for installing heating systems for individuals,
• financial support from National Fund of Environmental Protection and Water Management
for thermo-modernization of the building and replacement or purchase and installation of
low-emission heat sources.
Zakopane city implemented a programme for a low-carbon economy (also covering The Low
Emissions Reduction Programme [53] and the Urban Mobility Plan for the Zakopane area [54]), in which
the main goals for 2020 are as follows:
• reduction of carbon dioxide emissions by 14,022.84 Mg/year, i.e., 3.87%,
• reduction of energy consumption by 2020 by 18,982.65 MWh/year,Sustainability 2020, 12, 5634 5 of 15
• an increase in the share of renewable energy in total consumption of 0.16% per annum (excluding
the heating network) and by 0.5% (including the heating network).
The aim is to reduce pollution by increasing the energy production from RESs with the support
of the government. In Zakopane, the total share of RESs is much higher than the Polish average.
It amounts to 16.45% due to the use of geothermal energy, which accounts for about 80% of renewable
energy in the RES consumption [53]. The distributor and producer of heat from this resource is
Geotermia Podhalańska S.A., which provides approx. 35% of the heat demand in Zakopane (in 2015,
the sale of heat from geothermal energy was 356.15 TJ and that from natural gas was 37.34 TJ) [55].
Geotermia Podhalańska S.A. is the first installation in Poland since 2005 to start using geothermal
resources, contributing directly to the reduction in the SO2 concentration by about 68% after the project
was put into operation, lowering the suspended particulate matter concentration (PM10 ), and reducing
CO2 emissions [56]. The company’s activity covers not only heating but also air conditioning, tourism,
recreation, and balneology. The Regional Operational Programme for the Małopolska Region project
on “Construction of heating networks and connections in the commune of the city of Zakopane and
the communes of Poronin, Biały Dunajec and Szaflary in order to increase the use of RESs and reduce
the emission of pollutants into the air” includes work planned in Zakopane on the construction of a
heating network, a new pumping station, and connections to existing and new facilities [57].
Based on the small share of other RESs, some initiatives are being taken at the local level to
promote projects on solar energy, hydropower, and energy from biomass, among others. Data analysis
shows high solar radiation (1467 h/year), understood as time, given in hours per year, during
which sunlight is directly reaching the Earth’s surface, [58] indicating the possible development of
photovoltaic energy in the area of five hydroelectric power stations in Kuźnice, Olcza, Zakopane-Ustup,
Zakopane-Jaszczurówka [53]. This is in line with the idea of an energy cluster, therefore, there are two
certificated clusters, that have been created in Zakopane and provided organisational changes and
new investment, which are in line with urban symbiosis, i.e.,:
• Klaster Zielone Podhale comprises 32 units which aim to improve peoples’ quality of life and
promote the sustainable development of a tourist region through increasing the production
of energy from RESs, mainly geothermal and solar. Members of the cluster are local
administrations, heat and energy producers, large energy consumers, and a scientific organisation,
i.e., AGH University of Science and Technology. The geothermal water is used not only for heating
(about 90% of hotels in Zakopane are already connected to the heating network), but there are
few aqua parks, which are providing additional touristic attractiveness in the region. Cluster
partners applied for different environmental programmes for research, new drillings, and setting
of new infrastructure [59]. Moreover, the cluster partners plan to a build Tatra solar power plant,
which aims to obtain an energy surplus of 2962 MWh/year [60].
• Klaster Serce Podhala aims to increase the use of geothermal resources by initialling a joint
initiative of the Szaflary commune and the existing Geotermia Podhalańska S.A.
The cluster influences not only on Zakopane but the whole Tatra Poviat, which includes Zakopane
and rural communes: Biały Dunajec, Bukowina Tatrzańska, Kościelisko, Poronin. The main aim of the
creation of an energy cluster is to reduce air pollution, develop local energy sources, increase efficiency,
and ensure safe energy sources. As the cluster is managed by the local community, the price of heat
and energy could be lower for cluster members, which can be a stimulus for regional development.
Moreover, the energy cluster policy in Poland proposes more benefits for members of energy clusters
and local communities by:
• Decreasing the investment risk due to balancing the supply and demand side,
• Creation of a synergy effect for all stakeholders to ensure a stable source of energy with a
reasonable price,
• Decreasing the impact on the environment due to the limiting of emissions, management of
waste, etc.Sustainability 2020, 12, 5634 6 of 15
• Development and effective use of a dispersed source of energy,
• Promoting innovative solutions and closer cooperation between science and business,
• Raising local awareness of the environmental aspects due to better education and the promotion
of environmentally friendly investment.
4. Results
To estimate the advantages of developing the idea of energy clusters and the increase in the use
of RESs in Zakopane, a calculation of external costs using WTP was conducted and compared to the
calculation of WTP in each step for Poland, which was investigated by Adamkiewicz [41]. According
to the methodology presented, first, the sources of pollution and the number of deaths caused by air
pollution were analysed. In Poland, the municipal and housing sector has a significant role in the
levels of concentration of air pollution [61–63]. Based on data from the Report [41], the municipal and
housing sector is responsible for 41% of PM2.5 emissions in urban areas. An analysis of PM in Poland
(urban areas), which was investigated in the Report [41] and in Zakopane, was taken into account in
the estimation of premature deaths and the statistical value of a life (Table 1).
Table 1. Concentration of PM2.5 in the air.
2011 2013 2015 2016
Poland 27.1 28.4 26.0 24.5
PM2.5 [µg/m3 ]
Zakopane 28.0 25.3 21.4 23.7
Source: Inspector of Environmental Protection, [41].
Based on the data presented in Table 1, it can be concluded that, in the analysis period,
the concentration of PM2.5 in the air in Zakopane is decreasing, whereas, in Poland, the PM2.5
in the air in 2013 was higher than that in 2011 [41]. The indirect reasons for the decrease of concentration
of air pollutions in Zakopane are among others: subsidies for replacement of coal boilers from
European Funds [64] and investments related to geothermal sources of energy [65]. In addition to
that, the national programmes such as “Clean Air” or “Stop Smog” (also in Zakopane), which mainly
focused on the reduction of air pollutions, were introduced. Low-efficiency heating devices for solid
fuels are mostly causing the concentration of PM in the municipal and housing sector in Zakopane as
well as in other polluted cities in Poland.
Due to lower PM2.5 concentrations, the number of deaths caused by air pollution in Zakopane
calculated by the Central Statistical Office (CSO) was one death for every eighty-nine people (1/89),
whereas in Poland it was 1/70. The main causes of death in Zakopane were cardiovascular diseases
(44.7%), cancer (22%), and respiratory diseases (7%) [66].
The next step was to calculate the number of deaths for Zakopane and compare it with that
in the rest of Poland (summarise urban and extra-urban areas), which were investigated in the
Report [41]. According to the WHO recommendations, this should take into account the adult
population (age 30+ years) to estimate the long-term health impact caused by PM2.5 (Table 2).
The research carried out by the United Nations Economic Commission for Europe (UNECE)
shows that the negative impact on life expectancy due to the density of PM2.5 for the average citizen of
Poland accounts for 6–12 months, and for an inhabitant of Zakopane for more than 12 months [67].
In Zakopane, one of the factors related to premature deaths is air pollution generated by municipal and
housing sector through the use of the low-quality coal and obsolete coal furnaces. Therefore, due to the
Air Protection Program adopted by the Malopolska in 2013, Zakopane by the end of 2015 was obliged
to eliminate 496 coal-fired furnaces and by 2023, the remaining 2230 furnaces [68].Sustainability 2020, 12, 5634 7 of 15
Table 2. Population and deaths in Poland and Zakopane covered by the analysis of the impact on mortality.
Poland
2011 2013 2015 2016
Population Death Population Death Population Death Population Death
30–34 3,141,270 2968 3,235,198 2768 3,245,474 2758 3,217,351 2863
35–39 2,864,320 4249 3,004,273 3987 3,102,846 4000 3,113,212 4004
40–44 2,410,696 5924 2,546,248 5629 2,730,562 5522 2,831,770 5595
45–49 2,411,463 9761 2,333,568 8642 2,334,025 8196 2,370,674 8159
50–54 2,848,818 19,296 2,599,288 16,491 2,408,302 14,228 2,351,408 13,420
55–59 2,916,642 28,768 2,936,830 28,306 2,837,050 26,411 2,737,882 24,994
60–64 2,471,547 34,263 2,620,151 36,965 2,726,536 37,359 2,751,811 36,760
65–69 1,459,742 28,257 1,789,658 33,861 2,161,758 40,485 2,272,891 42,721
70–74 1,328,316 38,447 1,252,454 36,068 1,208,233 33,970 1,299,760 33,870
75–79 1,146,666 51,386 1,147,354 50,372 1,139,332 48,511 1,118,914 45,852
80–84 834,494 61,785 859,378 63,589 862,711 62,104 869,321 58,783
85+ 555,797 82,497 623,764 93,508 704,384 105,083 742,519 105,018
Total 24,389,771 375,501 24,948,164 387,312 25,461,213 394,921 25,677,513 388,009
% death 1.54 1.55 1.55 1.51
Zakopane
2011 2013 2015 2016
Population Death Population Death Population Death Population Death
30–34 2091 2 2164 2 2162 - 2175 3
35–39 1865 2 1963 1 2036 1 2040 3
40–44 1686 3 1729 1 1821 7 1844 2
45–49 1860 9 1702 7 1683 3 1673 3
50–54 2054 15 1983 16 1837 13 1809 15
55–59 2245 25 2192 23 2058 20 1979 15
60–64 1834 29 1996 20 2117 25 2111 23
65–69 1193 15 1361 17 1584 22 1696 27
70–74 1119 28 1097 29 1047 31 1062 26
75–79 1049 38 1021 34 999 36 968 37
80–84 760 48 794 58 792 46 798 55
85+ 541 68 610 79 697 102 733 93
Total 18,297 287 18,612 292 18,833 308 18,888 304
% death 1.57 1. 57 1.63 1.61
Source: Central Statistical Office, [41].
According to the algorithm presented, it is estimated that there were 15–16 premature deaths
caused by PM from the municipal and housing sector in Zakopane in the period analysed (Table 3)
and compared to 19,000–22,000 in Poland based on the Report [41]. For Poland, Adamkiewicz [41]
used methodology based on the health risks of air pollution—HRAPIE project and for Zakopane,
the Aphekom project—both approaches are based on concentration–response functions [43].
Table 3. Premature deaths in Poland and Zakopane caused by emissions from the municipal and
housing sector.
2011 2013 2015 2016
The number of premature deaths in Poland 22,398 19,460 19,741 18,990
Value of lost statistical life in Poland 495,235 423,386 421,749 439,980
The number of premature deaths in Zakopane 15 15 16 16
Value of lost statistical life in Zakopane 284.5 279.5 289.8 329.4
Source: own studies, [41].
The number of premature deaths and value of lost statistical life in Zakopane was calculated using
an Excel tool. In the light of the recommendations of the Aphekom project, the long-term impacts of
PM2.5 were taken into account based on two scenarios [43]:Sustainability 2020, 12, 5634 8 of 15
• Scenario 1, where the PM2.5 yearly mean is decreased to 5 µg/m3 . In that case, ∆x = 5 µg/m3 ,
RR per 10 µg/m3 = 1.06 [1.02–1.11], β = 0.0058269) [13],
• Scenario 2, where the PM2.5 yearly mean is decreased to 10 µg/m3 . In that case, ∆x = ([PM2.5 ] mean
10 µg/m3 ). ∆x = 0 if [PM2.5 ] mean < 10, RR per 10 µg/m3 = 1.12 [1.08–1.15] β = 0.0056664) [69],
(∆x is the decrease in the concentration defined by the scenario, β is the concentration–response
functions, relative risk ratio (RR) per 10 µg/m3 = exp (10* β)).
Premature deaths in Zakopane consist of 0.07%–0.08% of the total premature deaths in Poland
(Table 3) and years of life lost (YLL) consists of from 13% to 17% of the total YLL in Poland. Due to the
analysis of data in Table 3, comparing 2011 and 2016, it can be deduced that in Poland the total number
of premature deaths and YLL decreased [41], while the increase in Zakopane has been noted. In EU-28,
the number of premature deaths has decreased by 10%. The same trend was observed in the case of
YLL, where a decrease of 8% was noticed throughout the same period [70,71].
In the next step of the analysis, results were calculated according to the algorithm presented
(VOLY, [35]) and the maximum values (OECD, [36]) of WTP (Table 4) for Zakopane and compared
with the results from Poland, which were provide in the Report [41]. The calculation of WTP took into
account the whole population of Poland and Zakopane.
Table 4. External health cost per inhabitant by the WTP approach for Poland and for Zakopane [euro].
2011 2013 2015 2016
Desaigues and Potential Years of Life Lost 321.26 275.37 274.34 286.20
Poland
OECD premature death 912.46 793.65 806.34 775.75
Desaigues and Potential Years of Life Lost 255.12 252.07 264.01 301.59
Zakopane
OECD premature death 844.72 849.54 919.98 921.30
OECD: Organisation for Economic Co-operation and Development; Source: own studies, Central Statistical Office of
Poland, [41].
The amount of health cost per capita in Zakopane was between 252.07 and 921.30 euro, whereas in
Poland it was between 274.34 and 912.46 euro in 2011–2016 [41] (Table 4). During the analysed period,
the average citizen of Zakopane was willing to pay more for fresh air than the average citizen of Poland
(Table 4). This proves that the inhabitants of Zakopane suffer because of the high concentration of
PM in the air, which is related to, among other factors, the municipal and housing sector. Based on
the geographical location of the city, during the winter, the London type of smog occurs in Zakopane.
The maximum concentration of benzopyrene in the air was 900% of the norm, what among others has a
negative impact on the health of the habitats of Zakopane [72]. Each year the number of days surpassing
the limit of dust concentration in the air has passed 67. This is the equivalent of 2139 cigarettes smoked
by each inhabitant of Zakopane annually [73]. The situation has majorly raised the awareness of the
citizens of Zakopane throughout the last years. The process of replacing 700 old boilers with ecological
heat sources is currently ongoing in Zakopane [74].
However, the health cost of pollution is relatively high in comparison to that in some other studies
where the use of the WTP method was applied for examining issues related to polluted air. In China,
for example, the mean value of WTP for mitigating smog is 206.15 euro per year, which is 1% of
income [75], in the United States, the air improvement is worth about $40 [76]. In Mexico, it costs
2000 dollars for a one-unit reduction in particulate matter emissions per year [77]. Compared to the
results of WTP for Zakopane and the research in the Report [41], it may be concluded that citizens of
Poland and Zakopane are willing to pay more for the reduction of air pollution. The difference between
the WTP results in different countries are caused by, among others: awareness of the local community,
effective implementation of clean air policy, and various shares of sources of pollution emissions.Sustainability 2020, 12, 5634 9 of 15
Therefore, the topic will be extended in the discussion on the level of pollution, the health cost,
and the role of the cluster, which may have a positive impact on the health and quality of people’s lives
in Zakopane.
5. Discussion
Our study undertook a comparison of the WTP approach for estimating the health cost for
the municipal utility sector for results from Zakopane and compare it to the results presented by
Adamkiewicz [41]. In 2016, there is a difference between the health cost per capita in Zakopane,
which was 921.3 euro, and in Poland where the “maximum” cost was 775.75 euro [41] (Table 4). It can
also be observed in the number of premature deaths between 2011 and 2016, which in Zakopane
accounted for between 15 and 16 people, compared to the whole of Poland where the range was between
19,000 and 22,000 people [41]. Ligus (2018) [78], using a contingent valuation survey, demonstrated
that the WTP for clean air for a Polish citizen was 59.48 EUR. On the basis of the above-mentioned
research, it may be observed that Polish citizens can pay six times less in the best option for clean air.
Statistics show that almost 60% of premature deaths in Europe between 1990 and 2015 were
caused by PM2.5 emissions European Environment Agency (EEA). Based on the EEA data, particulate
matter in Europe continues to cause the premature death of more than 400,000 Europeans annually
(in 2014, 1700 premature deaths were caused by PM10 and 46,020 by PM2.5 ) [79]. In 2015, Poland was
ranked in third place in the EU-28 in numbers of premature deaths (there were 38,006 premature deaths
annually) as well as third place in years of life lost (YLL) (1403 YLL per 100,000 inhabitants) (EEA) [80].
Similar results are confirmed in the literature on the subject, for example, Tainio et al. (2013) estimated
that 39,800 premature deaths were caused by PM2.5 pollution in the year 2000 in Poland [81].
There are a few reasons, among others, which result in these outcomes:
• The data obtained for the analyses of PM10 and PM2.5 were taken from one monitoring station in
Zakopane operated by the Chief Inspectorate of Environmental Protection. The analysis would be
more comprehensive if it were possible to receive data from different monitoring stations.
• Following the results of the WHO [82] and the Report [41], the analysis took the number of deaths
of people over the age of thirty into account, excluding all other deaths. In 2016, newborns,
children, and teenagers represented more than 32% of the total population of Zakopane [66].
• The data only took the inhabitants of Zakopane into account although the city is one of the
most heavily visited tourist destinations in Poland. The Tatra National Park alone, for example,
was visited by 3 million tourists in 2016. Therefore, the study should be extended to cover the
tourists visiting Zakopane.
On the other hand, at the local level, one should also take into consideration the fact that the WTP
for health cost might be lower due to, among other reasons, creation of urban and industrial symbiosis
for increasing RES production. In the long-term perspective, we are able to observe that the clusters
are an effective method of collaboration between representatives from different sectors.
Zakopane already has a broad scope of application of geothermal energy in place. The current
state-of-play is related to the direct and indirect actions of the energy cluster in Tatra Poviat. Geothermal
energy consumption is estimated at around 35% of total heat consumption [65]. Nevertheless,
the potential of possible development seems to be yet unreached. The projects from European funds
are stimulating the further development of solutions connected with geothermal resources, R&D,
and infrastructure for the local energy sector. The examples of such projects are the following:
- construction of heating networks and connections with a full length of approx. 4.5 km for
150 individual customers [83]; approx. 6.21 km for 123 individual customers [57];
- increase of the efficiency of primary energy use and reducing the energy consumption of Geotermia
Podhalańska S. A. by increasing the production of energy from renewable sources [84];
- modernisation of the infrastructure and systems related to geothermal resources [85].Sustainability 2020, 12, 5634 10 of 15
Actions taken in the field of effective use of geothermal raw materials are associated with urban
symbiosis. Although there is still a struggle with gathering the pieces of information that could be
easily interpreted to promote solutions related to urban symbiosis. Support for the concept of urban
symbiosis can influence the founding of a tourism–energy nexus. To summarise the possibilities
of implementing urban symbiosis by energy clusters, a SWOT stands for Strengths, Weaknesses,
Opportunities, and Threats SWOT analysis was carried out (Table 5).
Table 5. Assessment of possibilities of introduction urban symbiosis by energy clusters to increase the
use of renewable energy.
Strength Opportunities
S1: Zakopane region is rich in geothermal resources O1: Raise the awareness of the local communities
S2: Zakopane is a mountain resort most frequently visited O2: Development of eco-tourism in the resort of Zakopane
S3: Above-average WTP results for Zakopane O3: Create jobs through energy cluster and urban symbiosis
S4: Transparent data available online (PM2.5 and O4: Improve air quality due to elimination of pollutions
PM10 concentration)
Weakness Threat
W1: Lack of comprehensive understanding of the T1: Lack of policy and national plan which will support the
environmental problem i.e., waste management sector clustering and urban symbiosis
W2: High investment cost in the infrastructure and T2: Lack of policy dedicated to the energy cluster activities
research and development in case of geothermal resources T3: There is only one monitoring station located in Zakopane
W3: Lack of effective mechanism management of
knowledge in the cluster
Moreover, the role of the regional networks is highlighted in the sustainable transition of energy
systems. Access to resources and the level of consumption and production are some of the most
important factors that influence security in the region [86]. Therefore, the energy cluster initiative has a
really important role in balancing demand for energy from renewable sources, which influences the
sustainable development of the region [87].
From the global perspective, the concept of the clean air is in line with sustainable development
goals such as: SDG 3 (good health and well-being), SDG target 7.2 on access to clean energy in the
housing, SDG target 11.6 on air quality in cities [88]. In order to reach the goals, tools such as life cycle
thinking are needed to support the decision-making process that will be in line with the environmental,
social, and economic aspects [89].
6. Conclusions
Poland has not implemented any national plans for industrial or urban symbiosis. With the
development of the circular economy and obligation towards the EU to increase RESs, new local
solutions promoting urban symbiosis have been introduced. Closed-loop initiatives such as energy
clusters aim to share infrastructure and resources to enhance their collective efficiency. This increases
their chances of success when applying for financial support from national and EU funds and enables
them to collaborate on developing new RESs. It was particularly crucial that for the touristic area as in
Poland more transparent data were available due to on-line air monitoring of PM2.5 and PM10 in Polish
cities, for example from the Zakopane Main Inspector of Environmental Protection [90]. Zakopane is
one of the most well-known mountain resorts in Poland.
The WTP method confirmed that for inhabitants of Zakopane, clean air regulation could be more
important compared to the rest of Poland. The research indicates that the funding for the energy
cluster was well allocated. Various publications indicate that WTP for RESs depends on many factors
such as social status, income, age, environmental awareness, and types of RES. In this study, the WTP
method was used to assess the acceptance of RES policy and to identify the priorities for energy
clusters in Poland. The scope of this study is limited; therefore, it is necessary to develop a more
comprehensive analysis of the effectiveness of implementing the WTP approach for all 66 clusters
in Poland. The introduction of assessment of urban symbiosis based on WTP method could have a
positive impact on the reduction of air pollution.Sustainability 2020, 12, 5634 11 of 15
Most countries face huge challenges in terms of developing RESs by 2020 and 2030. One of the
goals is to decrease the level of air pollution. The role of local cooperation and networks is highlighted
in the sustainable transition of the energy system. In Zakopane, energy production from RES is higher
than the average for Poland. The city has access to geothermal resources, but it also uses solar panels
and hydroelectric power stations, thanks to the initiatives of other clusters such as the Zielone Podhale
Energy Cluster.
Author Contributions: All authors contributed in the development of the current paper. The concept were
prepared by A.C.-K., N.I. and J.K., while the detailed literature review, discussion, and development of reaserch
were done by A.C.-K., N.I. and J.K.; Data curation, A.C.-K.; Investigation, N.I.; Methodology, J.K.; Writing—original
draft, A.C.-K. and J.K.; Supervision was done by A.C.-K. and J.K. All authors have read and agreed to the published
version of the manuscript.
Funding: This work was funded by the Polish National Agency for Academic Exchange (NAWA) as the part of the
project “International Cooperation for Rational Use of Raw Materials and Circular Economy” (COOPMLN), which is
conducted in the Division of Strategic Research in the MEERI PAS (2019–2020), project no. PPI/APM/2018/1/00003.
This research was also supported by AGH University of Science and Technology in Cracow.
Conflicts of Interest: The authors declare no conflict of interest.
References
1. United Nation. World Urbanization Prospects: The 2018 Revision. 2018. Available online: https://esa.un.org/
unpd/wup/Publications/Files/WUP2018-KeyFacts.pdf (accessed on 10 January 2020).
2. Halder, P.K.; Paul, N.; Joardder, M.U.H.; Sarker, M. Energy scarcity and potential of renewable energy in
Bangladesh. Renew. Sustain. Energy Rev. 2015, 51, 1636–1649. [CrossRef]
3. Rosenzweig, C.; Solecki, W.; Hammer, S.A.; Mehrotra, S. Cities lead the way in climate–change action. Nature
2010, 467, 909. [CrossRef] [PubMed]
4. Dou, X.; Shasha, L.; Jing, W. Ecological strategy of city sustainable development. APCBEE Procedia 2013, 5,
429–434. [CrossRef]
5. Rodríguez, M.C.; Dupont-Courtade, L.; Oueslati, W. Air pollution and urban structure linkages: Evidence
from European cities. Renew. Sustain. Energy Rev. 2016, 53, 1–9. [CrossRef]
6. Martins, H. Urban compaction or dispersion? An air quality modelling study. Atmos. Environ. 2012, 54,
60–72. [CrossRef]
7. EEA. Air Pollution Health Impacts of Air Pollution. Available online: https://www.eea.europa.eu/downloads/
e4ae0fe5a80b45b5a9c5126f15e2a8b3/1580212454/health-impacts-of-air-pollution.pdf (accessed on 20 June 2020).
8. Cohen, A.J.; Ross Anderson, H.; Ostro, B.; Pandey, K.D.; Krzyzanowski, M.; Künzli, N.; Smith, K. The global
burden of disease due to outdoor air pollution. J. Toxicol. Environ. Health 2005, 68, 1301–1307. [CrossRef]
9. Cohen, A.J.; Brauer, M.; Burnett, R.; Anderson, H.R.; Frostad, J.; Estep, K.; Balakrishnan, K.; Brunekreef, B.;
Dandona, L.; Dandona, R.; et al. Estimates and 25-year trends of the global burden of disease attributable
to ambient air pollution. An analysis of data from the Global Burden of Diseases study. Lancet 2015, 389,
1907–1918. [CrossRef]
10. European Environmental Agency. EEA Report No 13/2017. 2017. Available online: https://www.eea.europa.
eu//publications/air-quality-in-europe-2017 (accessed on 20 August 2018).
11. Lelieveld, J.; Evans, J.S.; Fnais, M.; Giannadaki, D.; Pozzer, A. The contribution of outdoor air pollution
sources to premature mortality on a global scale. Nature 2015, 525, 367–371. [CrossRef] [PubMed]
12. Available online: https://www.who.int/airpollution/data/cities/en/ (accessed on 10 June 2020).
13. Pope, C.A.; Burnett, R.T.; Thun, M.J.; Calle, E.E.; Krewski, D.; Ito, K. Lung cancer, cardiopulmonary mortality,
and long-term exposure to fine particulate air pollution. JAMA 2002, 287, 1132–1141. [CrossRef]
14. Del, R.P.; Burguillo, M. Assessing the impact of renewable energy deployment on local sustainability:
Towards a theoretical framework. Renew. Sustain. Energy Rev. 2008, 12, 1325–1344.
15. Dincer, I. Renewable energy and sustainable development: A crucial review. Renew. Sustain. Energy Rev.
2000, 4, 157–175. [CrossRef]
16. Gronkowska, J. Model energy cluster—special energy zone delivering integrated territorial energy.
Geomat. Landmanagement Landsc. 2017, 3, 47–57. [CrossRef]Sustainability 2020, 12, 5634 12 of 15
17. Taddeo, R.; Simboli, A.; Ioppolo, G.; Morgante, A. Industrial Symbiosis, Networking and Innovation:
The Potential Role of Innovation Poles. Sustainability 2017, 9, 169. [CrossRef]
18. Yoon, S.; Nadvi, K. Industrial clusters and industrial ecology: Building ‘eco-collective efficiency’ in a South
Korean cluster. Geoforum 2018, 90, 159–173. [CrossRef]
19. Harris, S.; Mirata, M.; Broberg, S.; Carlsson, P.; Martin, M. A Roadmap for Increased Uptake of Industrial
Symbiosis in Sweden. 2018. Available online: https://www.ivl.se/download/18.14bae12b164a305ba1118a2a/
1540309079798/A%20Roadmap%20for%20Industrial%20Symbiosis%20in%20Sweden%20-%20final.pdf
(accessed on 20 June 2020).
20. Vernay, A.L.; Mulder, K.F. Organising urban symbiosis projects. In Proceedings of the Institution of Civil
Engineers-Engineering Sustainability; Thomas Telford Ltd.: London, UK, 2015; Volume 169, pp. 181–188.
21. Dong, H.; Ohnishi, S.; Fujita, T.; Geng, Y.; Fujii, M.; Dong, L. Achieving carbon emission reduction through
industrial & urban symbiosis: A case of Kawasaki. Energy 2014, 64, 277–286.
22. Fujii, M.; Fujita, T.; Dong, L.; Lu, C.; Geng, Y.; Behera, S.K.; Chiu, A.S.F. Possibility of developing low-carbon
industries through urban symbiosis in Asian cities. J. Clean. Prod. 2016, 114, 376–386. [CrossRef]
23. Geng, Y.; Tsuyoshi, F.; Chen, X. Evaluation of innovative municipal solid waste management through urban
symbiosis: A case study of Kawasaki. J. Clean. Prod. 2010, 18, 993–1000. [CrossRef]
24. Van Berkel, R.; Fujita, T.; Hashimoto, S.; Geng, Y. Industrial and urban symbiosis in Japan: Analysis of the
Eco-Town program 1997–2006. J. Environ. Manag. 2009, 90, 1544–1556. [CrossRef]
25. Chertow, M.; Jooyoung, P. Scholarship and practice in industrial symbiosis: 1989–2014. In Taking Stock of
Industrial Ecology; Springer: Cham, Switzerland, 2016; pp. 87–116.
26. MacLachlan, I. Kwinana Industrial Area: Agglomeration economies and industrial symbiosis on Western
Australia’s Cockburn Sound. Aust. Geogr. 2013, 44, 383–400. [CrossRef]
27. EU. Communication from the Commission to the European Parliament, the Council, the European Economic
and Social Committee and the Committee of the Regions, A New Circular Economy Action Plan For a Cleaner
and More Competitive Europe. Available online: https://op.europa.eu/en/publication-detail/-/publication/
9903b325-6388-11ea-b735-01aa75ed71a1/language-en (accessed on 10 January 2020).
28. Neves, A.; Godina, R.; G Azevedo, S.; Pimentel, C.; CO Matias, J. The potential of industrial symbiosis:
Case analysis and main drivers and barriers to its implementation. Sustainability 2019, 11, 7095. [CrossRef]
29. Nowakowski, P. Energy Clusters as an Example of Energy Communities in Poland—Policy and Results.
Available online: http://www.lvif.gov.lv/uploaded_files/sadarbiba/WinWind/ (accessed on 10 January 2020).
30. Kalbar, P.; Das, D. Advancing life cycle sustainability assessment using multiple criteria decision making.
In Life Cycle Sustainability Assessment for Decision-Making; Elsevier: Amsterdam, The Netherlands, 2020;
pp. 205–224.
31. Karunathilake, H.; Hewage, K.; Brinkerhoff, J.; Sadiq, R. Optimal renewable energy supply choices for
net-zero ready buildings: A life cycle thinking approach under uncertainty. Energy Build. 2019, 201, 70–89.
[CrossRef]
32. Daziarno, R.A. Flexible Customer Willingness to Pay for Bundled Smart Home Energy Products and Services.
Available online: https://www.sciencedirect.com/science/article/abs/pii/S0928765519303227?dgcid=rss_sd_all
(accessed on 10 January 2020).
33. Nomura, N.; Akai, M. Willingness to pay for green electricity in Japan as estimated through contingent
valuation method. Appl. Energy 2004, 78, 453–463. [CrossRef]
34. Koto, P.S.; Yiridoe, E.K. Expected Willingness to pay for wind energy in Atlantic Canada. Energy Policy 2019,
129, 80–88. [CrossRef]
35. Jin, J.; Wan, X.; Lin, Y.; Kuang, F.; Ning, J. Public willingness to pay for the research and development of solar
energy in Beijing, China. Energy Policy 2019, 134, 110962. [CrossRef]
36. Alberini, A.; Bigano, A.; Šcasný, M.; Zverinoá, I. Preferences for energy efficiency vs. renewables: What is
the Willingness to pay to reduce CO2 emissions? Ecol. Econ. 2016, 144, 171–185. [CrossRef]
37. Kostakis, I.; Sardianou, E. Which factors affect the Willingness of tourists to pay for renewable energy?
Renew. Energy 2012, 38, 169–172. [CrossRef]
38. World Health Organization. Economic Cost of the Health Impact of Air Pollution in Europe: Clean Air, Health and
Wealth; WHO: Geneva, Switzerland, 2015.
39. Carlsson, F.; Johansson-Stenman, O. Willingness to pay for improved air quality in Sweden. Appl. Econ.
2000, 32, 661–669. [CrossRef]Sustainability 2020, 12, 5634 13 of 15
40. Wang, H.; Mullahy, J. Willingness to pay for reducing fatal risk by improving air quality: A contingent
valuation study in Chongqing China. Sci. Total Environ. 2015, 367, 50–57. [CrossRef]
41. Adamkiewicz, Ł. External Health Costs of Air Pollution Emission from the Municipal and
Housing Sector” (“Zewn˛etrzne Koszty Zdrowotne Emisji Zanieczyszczeń Powietrza z Sektora
Bytowo-Komunalnego”). Ministry of Entrepreneurship and Technology, 2017. Available online:
http://www.mpit.gov.pl/media/61515/Raport__zewnetrzne_koszty_zdrowotne_emisji_zanieczyszczen_
powietrza_z_sektora_bytowo_komunalnego.pdf (accessed on 10 August 2018).
42. Available online: http://aphekom.org/web/aphekom.org/home (accessed on 20 June 2018).
43. Aphekon, Guidelines for Assessing the Health Impacts of Air Pollution in European Cities. Available
online: http://aphekom.org/c/document_library/get_file?uuid=4f388abf-61e5-415d-ae22-e437a4e25937&
groupId=10347 (accessed on 15 June 2020).
44. Desaigues, B.; Ami, B.; Bartczak, A.; Braun-Kohlová, M.; Chilton, S.; Czajkowski, M.; Farreras, V.; Hunt, A.;
Hutchison, M.; Jeanrenaud, C.; et al. Economic valuation of air pollution mortality: A 9-country contingent
valuation survey of value of a life year (VOLY). Ecol. Indic. 2011, 11, 902–910. [CrossRef]
45. OECD. The Cost of Air Pollution: Health Impacts of Road Transport, OECD Publishing. Table 2.13. 2014.
Available online: http://dx.doi.org/10.1787/9789264210448-en (accessed on 21 August 2018).
46. Resolution no. 143/2015 of the Council of Ministers of 18 August 2015 on the adoption of the Tourism
Development Programme until 2020. 18 August 2015. Available online: https://www.msit.gov.pl/download/
3/12550/TourismDevelopmentProgrammeuntil20201f3c.pdf (accessed on 15 June 2020).
47. Ministry of Sport and Tourism of the Republic of Poland. 2017. Available online:
https://www.msit.gov.pl/pl/turystyka/badania-rynku-turystycz/statystyka-komunikaty-i/7834,Wiecej-
turystow-zagranicznych-w-Polsce-w-2017-roku.html (accessed on 10 August 2018).
48. Borkowski, K.; Grabiński, T.; Seweryn, R.; Mazanek, L.; Grabińska, E. Ruch turystyczny w Krakowie
w 2016 roku. Available online: https://www.google.com.hk/url?sa=t&rct=j&q=&esrc=s&source=web&
cd=&ved=2ahUKEwjm1-b_t8TqAhXS-GEKHe98AxAQFjAAegQIBhAB&url=https%3A%2F%2Fwww.
bip.krakow.pl%2Fplik.php%3Fzid%3D185106%26wer%3D0%26new%3Dt%26mode%3Dshw&usg=
AOvVaw2mStStwGdgrEWt_WcEdwaR (accessed on 15 January 2020).
49. Central Statistical Office. Available online: https://krakow.stat.gov.pl/vademecum/vademecum_malopolskie/
portrety_gmin/powiat_tatrzanski/zakopane.pdf (accessed on 15 January 2020).
50. Kruczek, Z. Frekwencja w atrakcjach turystycznych. Polska Organizacja Turystyczna. Kraków-Warszawa
2014, 29, 62.
51. World Health Organization. Global Urban Ambient Air Pollution Database. 2016. Available online:
http://www.who.int/phe/health_topics/outdoorair/databases/cities/en/ (accessed on 10 August 2018).
52. Nowobilska, E.; Nowobilska-Luberda, A.; Ziernicka-Wojtaszek, A.; Zawora, T. Możliwości wykorzystania
zasobów wód termalnych w rejonie Podhala. Inżynieria Ekol. 2011, 27, 139.
53. The Low Emissions Reduction Programme for Zakopane in 2015–2020. Available online: https://www.
zakopane.eu/artykuly/ochrona-rodowiska/plan-gospodarki-niskoemisyjnej (accessed on 10 August 2018).
54. Topór-Huciański, K. Program Life w gminie Zakopane. 2016. Available online: https://powietrze.malopolska.
pl/wp-content/uploads/2017/10/Dzialania-Eko-doradca_Zakopane.pdf (accessed on 20 June 2020).
55. K˛epińska, B. Przeglad
˛ stanu wykorzystania energii geotermalnej w Polsce w latach 2013–2015. Technika
Poszukiwań Geologicznych Geotermia. Zrównoważony Rozw. 2016, 1, 22.
56. Geotermia Podhalańska, S.A. Available online: http://geotermia.pl/ochrona-srodowiska/ (accessed on
10 August 2018).
57. Geotermia Podhalańska, S.A. Available online: http://geotermia.pl/fundusze-unijne-nasze-projekty/budowa-
sieci-i-przylaczy-cieplowniczych-na-terenie-gminy-miasto-zakopane-oraz-gmin-poronin-bialy-dunajec-
i-szaflary-w-celu-zwiekszenia-wykorzystania-odnawialnych-zrodel-energii-i-ograniczenia-emisji//
(accessed on 10 August 2018).
58. Hodana, M.; Holtzer, G.; Kalandyk, K.; Szymańska, A.; Szymański, B.; Żymankowska-Kumon, S. Odnawialne
źródła energii” Poradnik Kraków. 2012. Available online: http://home.agh.edu.pl/~{}szk/files/docs/OZE_
poradnik.pdf (accessed on 14 August 2018).Sustainability 2020, 12, 5634 14 of 15
59. K˛epińska, B. Geothermal Energy Use—Country Update for Poland, 2016–2018. In Proceedings of
the European Geothermal Congress 2019, Den Haag, The Netherlands, 11–14 June 2019; Available
online: http://europeangeothermalcongress.eu/wp-content/uploads/2019/07/CUR-21-Poland.pdf (accessed
on 10 June 2020).
60. Gronkowska, J. Nowe perspektywy wykorzystania odnawialnych źródeł energii na Podhalu Klaster
Energii—Słoneczna Elektrownia Tatry. Available online: https://www.google.com.hk/url?sa=t&rct=j&q=
&esrc=s&source=web&cd=&ved=2ahUKEwj9tOmptcTqAhVICKwKHe4sC4oQFjAAegQIAxAB&url=
http%3A%2F%2Fyadda.icm.edu.pl%2Fyadda%2Felement%2Fbwmeta1.element.baztech-338798ae-
6b07-4d7d-9c81-17aefb83f8bf%2Fc%2Ftpg2017_1_gronkowska_nowe_perspektywy.pdf&usg=
AOvVaw18TJoXSG2dZNyPyKCPdoe7 (accessed on 21 June 2020).
61. Urban Agenda for the EU, for Toolkit Communicating on Air Quality and Health Inspiring Practices,
Challenges and Tips. Available online: https://ec.europa.eu/futurium/en/system/files/ged/181008_final_
toolkit_on_communicating_on_air_quality_and_health_heal.pdf (accessed on 20 December 2019).
62. Czarnecka, M.; Kalbarczyk, R. Warunki meteorologiczne kształtujace ˛ zmienność st˛eżenia pyłu zawieszonego
na Pomorzu. Acta Agrophys. 2018, 11, 357–368.
63. WHO. The top 10 Causes of Death. 2018. Available online: http://www.who.int/news-room/fact-sheets/
detail/the-top-10-causes-of-death (accessed on 14 August 2018).
64. Available online: https://www.zakopane.pl/strefa-miejska/srodowisko/podstawowe-informacje-o-dotacji
(accessed on 14 June 2020).
65. Ślimak, C. PEC Geotermia Podhalańska SA–stan obecny, perspektywy rozwoju. ekologicznie i ekonomicznie
“na plusie”. Tech. Poszuk. Geol. 2013, 52, 25–33.
66. Available online: https://www.polskawliczbach.pl/Zakopane (accessed on 18 June 2018).
67. Maas, R.; Grennfelt, P. (Eds.) Towards Cleaner Air; Scientific Assessment Report 2016; EMEP Steering Body
and Working Group on Effects of the Convention on Long-Range Transboundary Air Pollution: Oslo,
Norway, 2016.
68. Atmoterm, S.A. Program ochrony powietrza dla województwa małopolskiego. Małopolska 2023-w zdrowej
atmosferze. Available online: https://powietrze.malopolska.pl/wp-content/uploads/2017/02/Program_
ochrony_powietrza_dla_wojewodztwa_malopolskiego_2013.pdf (accessed on 21 June 2020).
69. Pope, C.A.; Burnett, R.T., III; Thurston, G.D.; Thun, M.J.; Calle, E.E.; Krewski, D.; Godleski, J.J. Cardiovascular
mortality and long-term exposure to particulate air pollution: Epidemiological evidence of general
pathophysiological pathways of disease. Circulation 2004, 109, 71–77. [CrossRef]
70. European Environment Agency. Air quality in Europe—2019 Report; Report No. 12/2019; European
Environment Agency: Luxembourg, 2019.
71. European Environment Agency. Air quality in Europe—2015 Report; Report No. 12/2015; European
Environment Agency: Luxembourg, 2015.
72. Łukaszczyk, Z. W˛egiel tak, smog nie–świadomość i odpowiedzialność. Syst. Wspomagania Inżynierii Prod
2018, 7, 484–496.
73. Smogowy, K.A. Smog Albo Zdrowie! 2016. Available online: https://depot.ceon.pl/handle/123456789/15435
(accessed on 15 June 2020).
74. Available online: http://www.tatry.pl/aktualnosci/1461.html (accessed on 15 June 2020).
75. Sun, C.; Yuan, X.; Yao, X. Social acceptance towards the air pollution in China: Evidence from public’s
Willingness to pay for smog mitigation. Energy Policy 2016, 92, 313–324. [CrossRef]
76. Levinson, A. Valuing public goods using happiness data: The case of air quality. J. Public Econ. 2012, 96,
869–880. [CrossRef]
77. Rodríguez-Sánchez, J.I. Do Mexicans care about air pollution? Latin Am. Econ. Rev. 2014, 23, 9. [CrossRef]
78. Ligus, M. Measuring the Willingness to Pay for Improved Air Quality: A Contingent Valuation Survey.
Polish J. Environ. Stud. 2018, 27, 763–771. [CrossRef]
79. EEA. Premature Deaths Attributable to PM2.5, NO2 and O3 Exposure in 41 European Countries and the
EU-28. 2014. Available online: https://www.eea.europa.eu/highlights/improving-air-quality-in-european/
premature-deaths-2014 (accessed on 14 August 2018).You can also read


