A Technical Study of Solar and Biogas Energy Usage in Electric Vehicles in Ilhabela, Brazil - Ingenius
←
→
Page content transcription
If your browser does not render page correctly, please read the page content below
Scientific Paper / Artículo Científico
                                                                                      https://doi.org/10.17163/ings.n20.2018.06
                                                                                       pISSN: 1390-650X / eISSN: 1390-860X

      A Technical Study of Solar and Biogas
       Energy Usage in Electric Vehicles in
                 Ilhabela, Brazil
        Estudio técnico del uso de energía
      solar y biogás en vehículos eléctricos
                en Ilhabela-Brasil
                              Raul Pereira Micena1,∗ , Omar R. Llerena P.1 ,
                             Wendell de Queiróz Lamas2 , José Luz Silveira1

 Abstract                                                      Resumen
 Currently, Hybrid Power Systems (HPS) provide an Actualmente, los sistemas híbridos de generación de
 excellent opportunity for generation of electricity. energía se han mostrado como una excelente opor-
 This paper presents the study of a hybrid system tunidad para la generación de electricidad. En este
 considering two energy sources (solar - biogas) avail- trabajo se presenta el estudio de uno de estos sis-
 able in the Ilhabela island in the state of São Paulo – temas considerando dos fuentes de energía disponibles
 Brazil. This system will supply electricity to electric (solar – biogás) en la isla Ilhabela en el estado de San
 vehicles. The study is based on the calculation of the Pablo – Brasil, con miras a dotar de energía a vehícu-
 energy demand of the electric vehicles on the island. los eléctricos. Este estudio se basa primeramente en el
 Then the capacity of biogas production in Ilhabela cálculo de la demanda de energía de los vehículos eléc-
 is determined. Subsequently, in order to know the tricos en esta isla. Luego se determina la capacidad de
 energy produced and the amount of biogas needed by producción de biogás en Ilhabela. Posteriormente se
 the microturbine, an energy analysis of this plant is efectúa un análisis energético de la planta con una mi-
 carried out. Lastly, the energy needed to be generated croturbina a biogás para conocer la energía producida
 with the photovoltaic plant is calculated. The results y la demanda de biogás. Como último paso, se calcula
 show that, considering a market insertion index of la cantidad de energía necesaria a ser generada con
 4% of electric vehicles, the average energy demand is la planta fotovoltaica. Los resultados muestran que,
 46.327 kWh/month. On the other hand, the amount considerando un índice de inserción de mercado del 4
 of biogas produced on the island is twice what is % de los vehículos eléctricos, la demanda energética
 needed to generate 16.200 kWh/month. Finally, the media es de 46 327 kWh/mes. Por otro lado, la capaci-
 solar plant will produce 30.127 kWh/month.              dad de producción de biogás en la isla es dos veces
                                                         mayor a la necesaria para generar 16 200 kWh/mes.
                                                         Finalmente, la planta fotovoltaica producirá 30 127
                                                         kWh/mes.
 Keywords: Biogas, Electric Vehicles, Solar Energy,            Palabras clave: biogás, vehículos eléctricos, energía
 Ilhabela.                                                     solar, Ilhabela.

1,∗
   Energy Systems Optimization Laboratory (LOSE) / Research Institute in Bioenergy (IPBEN) – UNESP.
   Brazil. Author for correspondence ): raul.micena@unesp.br,    https://orcid.org/0000-0003-0486-4108
     https://orcid.org/0000-0003-2115-4036,    https://orcid.org/0000-0002-7588-0335
2
  Department of Basic Sciences and Environments. Escola de Engenharia de Lorena. Universidade de São Paulo (USP).
  Brasil.   http://orcid.org/0000-0003-2764-5725
Received: 14-05-2018, accepted after review: 25-06-2018
Suggested citation: Micena, R. P.; Llerena, O. R.; de Queiróz Lamas, W. and Silveira, J. L. (2018). «A Technical Study
of Solar and Biogas Energy Usage in Electric Vehicles in Ilhabela, Brazil». Ingenius. N.◦ 20, (july-december). pp. 58-69.
doi: https://doi.org/10.17163/ings.n20.2018.06.

                                                          58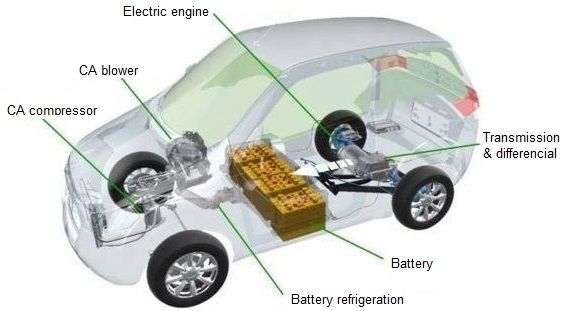
Micena et al. / A Technical Study of Solar and Biogas Energy Usage in Electric Vehicles in Ilhabela,
Brazil                                                                                                               59

1. Introduction                                                 nally, the results are analyzed and discussed and the
                                                                conclusions about the analysis developed are obtained.
Energy is considered a fundamental input in produc-
tive activities, having an important role in the devel-         1.1. Electric vehicles with battery
opment process of humanity. Access to modern forms
of energy, particularly to electricity, brings a series of      Briefly, a battery electric vehicle (BEV) can be de-
social benefits that improve the quality of life of the         scribed as a vehicle whose wheels are driven by an
population [1].                                                 electric motor, which in turn is powered by electric
    One of the sectors with the highest energy consump-         current stored in a battery bank. Its main components
tion is transportation. In 2014, this sector worldwide          can be seen in Figure 1.
was responsible for 28% of global energy demand and
23% of global CO2 emissions, which come from the con-
sumption of fossil fuels. In relation to the use of oil, this
sector consumed 65% of the final global demand [2].
    On the other hand, in a scenario of growing con-
cern about climate change, less polluting alternatives
are sought for the transport of people and cargo. In
this sense, electric vehicles (EV) are being widely dis-
seminated. According to the projections of Bloomberg
New Energy Finance [3], in 2040 more than half of
the new cars sold in the world will be electric. Unlike
combustion vehicles, EVs do not emit greenhouse gases
                                                                 Figure 1. Basic components of an electric vehicle [7].
during operation.
    However, the energy that feeds their electric motors
                                                                    The charge of a BEV’s batteries is largely obtained
can originate from different sources of energy, some of
                                                                through the use of a conventional residential electrical
them highly polluting, such as coal and oil, making the
                                                                outlet. However, the high recharge periods and the
adoption of EVs less effective as a measure to reduce
                                                                need to perform loads faster and more frequently, re-
greenhouse gas emissions. From the perspective of a
                                                                sulted in the advent of public charging stations [8].
full cycle analysis, the electricity available to charge the
                                                                These stations can be independent or connected to a
batteries must be generated from renewable or clean
                                                                network of stations with state-of-the-art devices [9].
sources so that these vehicles have zero emissions [4].
    In this sense, hybrid power generation systems or
HPGSs are a good alternative. According to Thibaud              1.2. Use of renewable energy sources in the
et al. [5], these types of systems use more than one                 BEV
energy source to supply a variety of different loads.           The literature is quite diverse in terms of integration
Typically, these systems work in isolation taking advan-        between EVs and renewable energy sources [10–12].
tage of the renewable resources available on site, but          The models that study this integration tend mainly
they can also be used in conjunction with conventional          to measure the capacity of relationship between them,
sources of power generation.                                    as well as the impacts on the performance of the elec-
    According to Justo Roberts, when sized correctly,           tric network [13]. Up next are some applications using
HPGSs present technical, economic and environmen-               biogas and photovoltaic solar energy.
tal advantages in relation to systems using a single
renewable source or traditional systems [6].
                                                                1.2.1. Use of biogas in BEV
    This article proposes the technical analysis and
sizing of a HPGS (solar-biogas) for application on the          Biomass energy differs from other renewable sources,
Ilhabela-SP-Brazil island, considering energy poten-            such as solar and wind, by the fact that it can be
tials currently available on the island and that are            easily stored and consumed when necessary. Biofuels,
not being exploited. The goal of the proposed system            such as ethanol produced from sugarcane, are the most
is to generate charging stations for a specific fleet of        common form of biomass used in vehicles.
electric vehicles. For this study, different degrees of EV          This fuel is burned directly in internal combustion
penetration are considered in relation to the current           engines (ICE). However, electricity from biofuels tends
fleet of automobiles.                                           to provide a higher return on investment compared
    For a structured analysis of this proposal, a bib-          to use in final processes such as the one mentioned
liographic review of battery EVs (BEVs) and their               above [14].
relation to renewable energy sources is carried out.                Several recent studies indicate that the use of bio-
Afterwards, the methodology describes the technical             electricity in a vehicle is more effective than the con-
analysis and sizing of the system step by step. Fi-             version of biomass into biofuels. Schmidt et al. [8]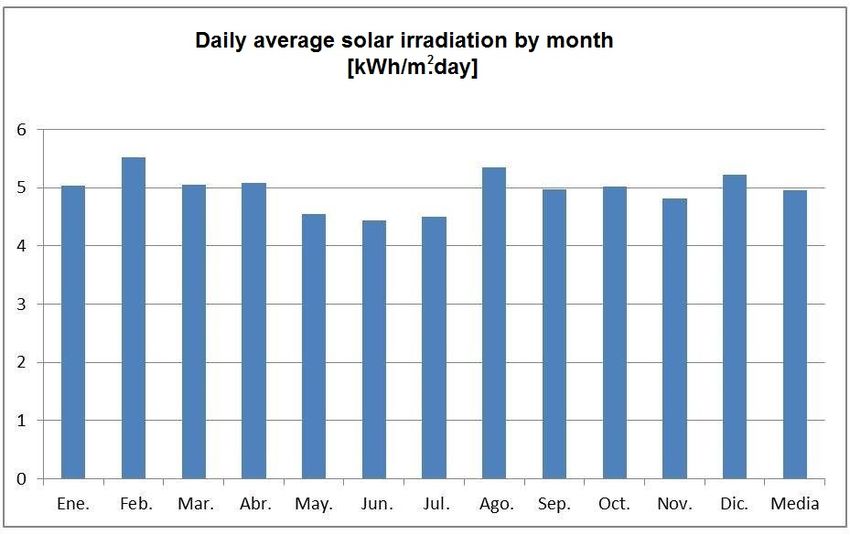
60 INGENIUS N.◦ 20, july-december of 2018
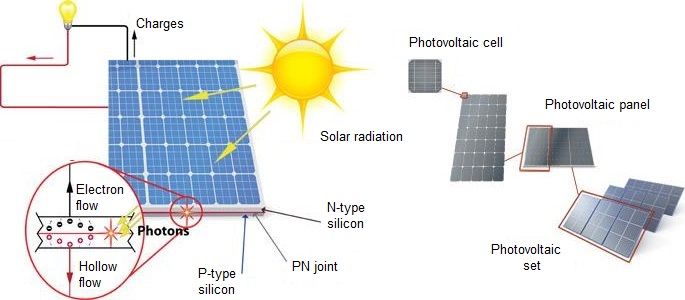
evaluated the production and use of various types of there is the incidence of photons coming from sunlight,
biofuels in Austria, compared to bioelectricity. The the electrons acquire energy, and then, with the pres-
results indicate that emissions of greenhouse gases, the ence of an external conductor, the migration of the
effects of land use and the required amount of biomass electrons generates an electric current. If the cell does
stocks are reduced compared to using EV biofuels. not suffer from solar incidence, electrons and gaps re-
On the other hand, Campbell et al. [15] conclude main trapped behind that barrier [20]. Figure 2 shows
that the gross average production, in kilometers trav- the operation of the PV panel.
eled per hectare of biomass production, is 112% higher
for bioelectricity than for biofuels. In addition, the
net average compensation of greenhouse gases for the
switchgrass production (grass of the genus Panicum
L.) is 108% greater in bioelectricity than that of biofu-
els [13].
1.2.2. Use of photovoltaic energy in BEV
Over the years, several methods of charging BEV using
photovoltaic panels (PVs) have been proposed. The Figure 2. Operation of the PV panel [18].
most prominent is the combination between PV and
the electricity grid. In this way, they use photovoltaic In the industrialization process, the photovoltaic
energy whenever possible, but switch to the grid when cells are interconnected in series-parallel arrays form-
photovoltaic energy is insufficient or not available [16]. ing the PV modules (Figure 2). The most used PV
The connection to the network of BEV charging modules are based on poly or monocrystalline technol-
stations, together with photovoltaic solar energy, allow ogy [21]. But recently, fine films are becoming popular,
a greater interaction between the EV and the net- especially for large installations [22].
work, enabling the flow of energy from the vehicle to Generally, in photovoltaic installations the modules
the network, with a technology called vehicle-to -grid are organized in series circuits, in order to reach the
(V2G) [17]. Thanks to being connected to the network, necessary DC voltage. To obtain a higher power, sev-
the photovoltaic generation does not necessarily have eral chains are connected in parallel. The behavior of
to occur in the same physical space of the charging a PV system under different intensities of solar irradia-
station, since the energy can be transported through tion and temperature can be understood by examining
the distribution systems. its characteristic currents of current-voltage (IV) and
Another approach is to use the PV system out- voltage-power (PV).
side the power grid. This system is known as PV- There will always be a single point of operation in
standalone [18]. This approach requires the use of bat- which the power will be maximum, that is, the point
teries for the storage of the energy generated during of maximum power (PMP) at a certain temperature
periods with high solar radiation. The use of batteries and irradiation. The PMP is not fixed; it varies contin-
in this type of systems raises the costs of both initial uously according to temperature and solar irradiation.
investment and maintenance. Because of this dynamic, a tracker to find the point
of maximum power is necessary to ensure that the
maximum power of the array of PV panels is always
1.3. Photovoltaic solar energy (PV) extracted (Figure 3) [16].
Solar energy is the largest source of renewable energy
available in nature, originating in the radiation coming
from the fusion reactions of the hydrogen and helium
nuclei inside the Sun.
On the other hand, photovoltaic systems are char-
acterized by high reliability and low maintenance, as
their high initial cost is often compensated by the low
operational cost. Through the PV effect, the solar cells Figure 3. Block diagram of a PV system showing its main
contained in the panels convert solar energy directly components, including the PPM [23].
into renewable, safe and non-polluting electricity [19].
The basic component of solar energy is the pho-
tovoltaic cell. This is composed of two layers of semi-
1.4. Solar energy in Brazil
conductor material. The layers, one of type N, with
excess of electrons and another of type P, with deficit According to Pereira et al. [24], the annual average of
of electrons, are joined, forming a PN junction. When global irradiation presents a good uniformity in Brazil.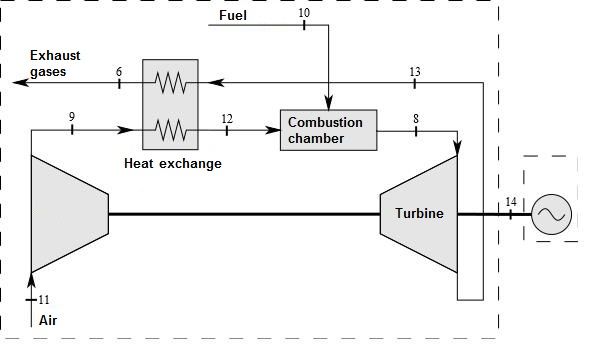
Micena et al. / A Technical Study of Solar and Biogas Energy Usage in Electric Vehicles in Ilhabela,
Brazil                                                                                                           61

The averages are relatively high throughout the ter-
ritory. The values of incident global solar radiation
in any region of the Brazilian territory vary between
1500 and 2500 kWh/m2 /year, and are higher than in
most European countries, such as Germany (900-1250
kWh/m2 /year), France (900-1650 kWh/m2 /year) and
Spain (1200-1850 kWh/m2 /year), places where solar
energy projects are widely used.
    Despite the favorable conditions for the develop-      Figure 4. Location of Ilhabela, on the coast of the state
ment of this type of technology, in Brazil it is still     of San Pablo [31].
incipient [25]. According to the Ministry of Mines and
Energy (MME) [26], at the end of 2016, Brazil had              Because it does not have its own large-scale elec-
24 MW of installed power in centralized photovoltaic       tric power generation, electricity in the municipality
power plants. However, such power is not yet enough        of Ilhabela is supplied by means of submarine cables,
to place Brazil among the twenty world leaders in the      which transmit the energy from the continent to the
production of this type of energy, all of them with an     island. In this way, if the demand for electricity on
installed capacity exceeding 1 GW [27].                    the island grows considerably, the supply will have
                                                           to be reinforced, either through the expansion of the
    Despite the low installed power in large photo-
                                                           submarine cable network, or through the introduction
voltaic power plants, Brazil has managed to emerge
                                                           of power generation plants. The latter is one of the
in the use of solar energy thanks to distributed gener-
                                                           proposals of this work, since it proposes the use of
ation, these being the main promoters for the use of
                                                           photovoltaic solar energy in conjunction with a biogas
this technology.
                                                           thermoelectric plant, which would be installed on the
    The regulation, elaborated in 2012 by the ANEEL        island.
(National Electric Energy Agency) through Norma-               According to the Municipal Plan of Ilhabela, cur-
tive Resolution N.◦ 482 and perfected in 2016, brings      rently, 6.5% of the urban population of the municipality
important incentives to the installation of small-sized    has its sewage collected, being thrown directly into
power plants based on renewable sources, such as so-       the sea without an effective treatment, with a sim-
lar and wind energy. As part of this regulation, the       ple removal of coarse waste. A system of wastewater
Electric Power Compensation System was instituted,         treatment stations is in the implementation phase, and
which allows the accumulation of generation surpluses      projections are that, by 2025, 3,795,000 m3 of waste
in relation to consumption, thus generating credits        will be produced and, by 2030, 4 345,000 m3 [32].
that can be used within a period of five years [28].           According to Lamas, methane (CH4 ) present in bio-
    The number of distributed power generation con-        gas produced from the anaerobic treatment of sewage
nections at micro scale (up to 75 kW of installed power)   waste, is approximately 21 times more damaging to the
and mini (greater than 75 kW and less than 5 MW)           atmosphere than carbon dioxide (CO2 ) [33]. Therefore,
is on the rise in Brazil, reaching 10 561 connections      the energy use of biogas becomes interesting, since
registered in 2017, against just four in 2012, with an     it reconciles the generation of renewable energy and
installed capacity of 114.7 MW, with solar energy re-      environmental sanitation.
sponsible for 70% of this total [29].

2. Materials and methods

2.1. Profile of Ilhabela Island

Located on the coast of the state of São Paulo (see
Figure 4), Ilhabela is an island populated by 32 197
inhabitants. With a total area of 347.5 km2 ; 85% of the
territory of the island corresponds to units of environ-
mental conservation. The remaining 15% corresponds
to areas suitable for urbanization. Its road structure is Figure 5. Monthly average daily solar irradiation
                                                                 2
installed along the entire coast, connecting the central (kWh/m /day) on Ilhabela Island
part of the city with the most remote neighborhoods.
This island has a fleet of 17,449 vehicles, of which 7041    On the other hand, according to the data obtained
are automobiles [30].                                     from the Sérgio S. de Brito Solar and Wind Energy
62 INGENIUS N.◦ 20, july-december of 2018
Reference Center (CRESESB, in Portuguese) [34], Il- groups (Otto cycle), these have an emission of 3000
habela has a solar irradiation pattern with intensity ppm, [39].
variation depending on the season. February is the For this study, the Capstone 30 microturbine is
month with the highest average solar radiation (5.56 selected, a model already used in other works with
kWh/m3 /day) and June the month with the lowest biogas from wastewater from San Pablo – Brazil [40]
average, with only 3.92 kWh/m3 /day. Figure 5 shows and in cogeneration processes [41]. The characteristics
the daily-monthly solar radiation. of this turbine are presented in Table 1.
2.2. Energy consumption of a BEV Table 1. Characteristics of the CAPSTONE C30 micro-
turbine [39]
In this study, BEV performance is analyzed in terms
of the fuel consumption rate (TCE). That is, the TCE Model C30
is calculated as the ratio between the power consumed Power (kW) 30
and the distance traveled [35]. Equation 1 is used for Efficiency (%) 26
this calculation. Exhaust gas flow (kg/s) 0,31
Exhaust temperature (◦ C) 275
Energy consumed (kW h) Heat Rate (MJ/kWh) 13,8
T CE = (1)
Distance travelled (km)
The lower the TCE, the better the energy efficiency.
2.3.1. Biogas composition
The autonomy of the BEV is calculated with Equation
2. The biogas generated from the anaerobic digestion
of biomass from wastewater has the composition pre-
sented in Table 2 [40].
Energy f ully charged BEV (kW h)
Auto = (2)
T CE (kW h/km) Table 2. Composition of biogas
The average distance traveled by a vehicle in Brazil
PCI
is similar to the one verified in the state of Louisiana Component Volume (%)
(kJ/kg)
(USA), estimated at 35 km/day [36].
CH4 66,5 50
According to the projection of the Energy Research CO2 30,5 -
Company (EPE, acronym in Portuguese) [37], EVs will O2 + N 2 0,5 -
represent 1.7% of the national fleet by 2025, and 4.5% H2 O 2,5 -
by 2030. Total 100 22,2
The calculation of electrical consumption per km
in a BEV fleet can be calculated with Equation 3 [38].
2.3.2. Biogas production
CelEV B = PM × n × D × T CE (3)
According to França Junior [42], the average rate of
Where: biogas generation is 170.9 m3 per 1000 m3 of treated
P M – market penetration of the BEV; waste. Therefore, it is possible to calculate the bio-
n – total number of cars in the fleet considered; gas values that can be obtained for the wastewater
D – average distance traveled by a BEV in the treatment station (ETE) of Ilhabela with Equation 4.
period of one day;
T CE – electric consumption rate per km. mbiogas = txbiogas × mresidue (4)
Where:
2.3. Energy analysis of the biogas plant
mbiogas – volume of biogas generated [m3 /year];
The environmental peculiarities of the place where txbiogas – average rate of biogas generation
this project is intended to start require that the use (0,1079 m3 biogas/m3 residue);
of biomass produces the least possible impact. Thus, mresidue – volume of treated waste [m3 /year].
gas microturbine technology offers solutions with low
NOx emission rates, which represents a great impact With the result of equation 4, the flow values in
for the greenhouse effect. The manufacturer of the [kg/s] can be obtained with Equation 5.
Capstone 30 microturbine guarantees an NOx emis-
mbiogas × γbiogas
sion rate of less than 9 ppm in exhaust gases. Thus, mbio = (5)
the environmental advantage obtained with the use of 31 104 000(s/año)
this technology is evident, since compared to the tech- Where:
nology of conventional internal combustion generating mbio – biogas flow [kg/s];Micena et al. / A Technical Study of Solar and Biogas Energy Usage in Electric Vehicles in Ilhabela,
Brazil 63
mbiogas – volume of biogas generated [m3 year]; 2.3.5. Compressor control volume
γbiogas – specific mass of biogas with
composition 65 % CH4 y 35 % CO2 According to Çengel and Boles [46] the compressors
(1,1518 kg/Nm3 ) [43]. have an isentropic efficiency that varies between 80
and 90%. In this study, the highest efficiency was used.
2.3.3. Energy analysis Point 9
The methodology adopted for the energy analysis of
the biogas plant is that used by Llerena [44]. This The air flow at the compressor outlet is equal to the
analysis is detailed below step by step. air flow at the compressor inlet, so we have Equation
9:
2.3.4. Control volume of the Brayton cycle
ṁ9 = ṁ11 (9)
In Figure 6, the gas cycle is observed. This cycle has
a compressor, a combustion chamber, the turbine and According to the GTW Handbook [45], the pres-
the heat exchanger. sure ratio is 4:1. With this data, the pressure in point
9 is calculated. For this, Equations 10 and 11 were used:
Pressure in point 9:
P9 = P11 · Rp (10)
Relative pressure in point 9:
P9
P r9 = P11 (11)
P11
With Equation 12, the enthalpy is obtained at point
Figure 6. Control volume of the Brayton cycle [41].
9 [44].
In this study the ISO conditions of the microturbine h9s − h11
of the GTW Handbook are maintained [45]. Consider- h9 = + h11 (12)
ηcpmp
ing that the efficiency of the electric generator is 95%,
the power is obtained in point 14 with Equation 6:
Point 12
Pgenerator
Ẇ14 = (6) According to Carvalho [47], there is a 3% loss in
ηgenerator
the outlet pressure in the heat exchanger. According
Where: to the same author, in the case of temperature, there
P – electric power in the generator [kW]. is a difference of 324 ◦ C. Thus, the pressure and tem-
perature at point 12 are calculated with Equations 13
Now, the biogas flow is calculated with and 14, respectively.
Equation 7:
Pressure in point 9:
HR · P = P CIbiogas · mbiogas (7)
P12 = P9 − (P9 · 0, 03) (13)
Where:
HR – Heat Rate [MJ/kWh];
Temperature at point 9:
P – power at the turbine output [kW];
P CI – lower calorific value of biogas [kJ/kg];
M – biogas flow [kg/s]. T12 = T9 + ∆T (14)
With the flows of the biogas and the exhaust gases, To calculate the air flow at point 12, Equation 15
the air flow is calculated with Equation 8: was used.
ṁ11 = ṁ6 − ṁbiogas (8) ṁ12 = ṁ9 (15)64 INGENIUS N.◦ 20, july-december of 2018
2.3.6. Control volume of the combustion cham- This calculation shows, approximately, the capac-
ber ity of the system dimensioned to meet the demand,
supplying energy in equal quantity to that requested
Point 8
by the loads (EV Fleet).
Through the application of Equation 22, the nom-
The flow of the exhaust gases at point 6 is equal
inal installed power required to meet the demand is
to the flow of gases at the outlet in the combustion
determined [49]:
chamber. Thus, Equation 16 was used to calculate the
gas flow at point 8. E
PF V = Sf (22)
nV nR HSP
ṁ8 = ṁ6 (16)
Where:
According to Carvalho [47] there is a pressure loss E – energy demand requested by the load;
of 3% in the combustion chamber. Thus, Equation 17 Sf – safety factor for resistive and thermal losses
was used to calculate the output pressure of the CC. in photovoltaic cells, with an adopted value
of 1.15;
P8 = P12 − (P12 · 0, 03) (17) nv and nR – efficiencies of system components;
HSP – Peak-Sun-Hours.
According to Saravanamuttoo et al. [48], the CC
can have an efficiency of 99%. Now, with the law of
The average daily solar irradiation can be referred
conservation of energy we have Equation 18
to in terms of “peak sun hours” (HSP). This value
refers to the equivalent number of daily hours that
2
ṁ8 · ḣ8 = ṁ12 · ḣ12 + (P CIbiogas · ṁbiogas ) · ηCC (18) a given region should undergo (1 kW/m ) to receive
the same amount of solar energy. Thus, the number of
HSP is numerically equal to that of the average solar
2.3.7. Turbine control volume irradiation (kWh/m2 .dia). With this value it is possi-
Point 13 ble to estimate the total area to be occupied by the
photovoltaic modules. In this way, through the division
For calculating pressures in the turbine, the same of installed power by the efficiency of the modules, the
air ratio as the compressor was considered. Thus, the resulting area is found [46]. Equation 23.
relative pressure at point 13 is calculated with Equa-
PF V
tion 19: Atotal = (23)
Ef f
P13
P r13 = P r8 (19) Where:
P8 A – area of the modules (m2 );
total
The energy balance is calculated with Equation 20: P F V – average power required (kW);
Ef f – efficiency of the modules(%).
(h9 − h11 ) · ṁ11
(h8 − h13a ) · ṁ8 = Ẇ14 + (20) 2.4.2. Costs of photovoltaic solar energy
ηcomp
In Brazil, the total installation cost is composed of
The efficiency of the turbine is calculated with
the following elements: PV modules (43%), inverters
Equation 21.
(24%), physical structure and protections (16%) and
installation (17%) [50].
Ẇgenerator
ηturbine = (21) According to data from the Greener report [51],
P CIbiogas · ṁbiogas the average price of installed kW of photovoltaic solar
energy in Brazil in 2017 was between 8 R$/kW, for
2.4. Sizing of the PV system smaller systems, and 4.62 R$/kW for major systems.
Other values are in accordance with Table 3.
2.4.1. Calculation of the necessary photo-
voltaic power Table 3. Prices [45]
Through the calculation of the nominal power (gen-
erated from solar radiation) necessary to meet the Power
2 4 8 12 30 50 75 150
(kW)
average daily consumption of the loads, and with the
Price
data of the energy supplied by the biogas plant, the 8 6,84 5,95 5,65 5,26 5,1 5,01 4,62
(R$/W)
area of the solar panels to be installed can be esti-
mated.Micena et al. / A Technical Study of Solar and Biogas Energy Usage in Electric Vehicles in Ilhabela,
Brazil 65
3. Results and discussion solar irradiation, there is an average generation of 16
200 kWh/month. With this monthly energy value, and
3.1. Analysis of energy consumption with the energy consumption of the BEV fleet, accord-
ing to Table 6, the need for additional generation of
Taking into account the fleet of 7041 automobiles, and
energy by the photovoltaic system was calculated (it
based on the projection of the EPE. By means of
is considered that this system will work the remaining
the calculation of the TCE and with Equation 3, the
6 hours).
monthly energy consumption of the EV fleet can be
calculated, according to their degree of market pene-
tration. The results are presented in Table 4. Table 6. Energy to be served by the PV system, given the
operation regime of the biogas plant
Table 4. Consumption of electric power of the BEV in
relation to market penetration BEV Energy Energy of the
market biogas PV solar system
penetration (kWh/month) (kWh/month)
BEV N. of Average
market electric energy 4% 16 200,00 30 127,21
penetration vehicles consumption 2% 16 200,00 6963,6
(kWh/month)
4% 282 46 327,21
2% 141 With the information presented in the previous
23 163,60
table, the PV systems suitable for the energy supply
From Table 4 it can be seen that a higher EV in the two scenarios were sized.
penetration means a higher energy demand. This in-
crease also represents a more powerful photovoltaic 3.3. Analysis of the sizing of the photovoltaic
solar plant and consequently a larger installation area plant
will be necessary.
By means of Equation 22, the photovoltaic power
needed to supply the additional energy demand was
3.2. Energy analysis of the biogas plant
calculated to supplement the energy already provided
The results of the energy analysis of the microturbine by the biogas system. Because it is an island, with
using biogas are shown in Table 5. a tourist and ecological vocation, the area occupied
by photovoltaic generation is a very important factor
Table 5. Summary of the energy analysis for the implementation of this technology. With Equa-
tion 23, and adopting an efficiency of 15% in the PV
Flow [kg/s]
modules, typical in models of polycrystalline silicon
h [kJ/kg]
technology available in the market, the total area of
P[kPa]
T [°C]
installation of the modules was calculated. The results
Point
are presented in Table 7.
6 275 101,32 0,31 490 Table 7. Power and area occupied by dimensioned PV
8 831,9 393 0,31 1167,15 systems
9 184,3 405,3 0,3041 459,67
10 25 101,32 0,0059 -
11 25 101,32 0,3041 298,6 BEV Power Installed
12 508 393,24 0,304 801,9 market (kW) area
13 594,6 96,25 0,31 825,77 penetration (m2 )
4% 305,20 2 034,69
2% 70,54 470,30
According to Table 5, the microturbine needs a
flow rate of 0.0059 kg/s of biogas to provide its nom-
inal power of 30 kW. With Equations 4 and 5, and For the same generation capacity in the biogas sys-
with the flow projections of 3 795 000 m3 /year in tem (30 kW), the area occupied by the PV system
2025 and 4 345 000 m3 /year in 2030 in the Ilhabela grew by more than four times. Taking into account
sewerage system, a production capacity of 0,0152 kg/s the environmental impact caused by the occupation of
in 2025 and 0.0174 kg/s of biogas in 2030 is reached, relevant portions of the area by the PV system, and
with both values above the consumption need of the the possibility of distributed generation, the applica-
microturbine, making this type of energy feasible from tion of this technology leads to a choice between the
the technical point of view. construction of a larger photovoltaic plant or a larger
Thus, with the biogas plant operating 18 hours a number of small plants, suitable for residential-sized
day, at full capacity (30 kW) at times when there is no facilities.66 INGENIUS N.◦ 20, july-december of 2018
3.4. Analysis of installation costs small businesses, in addition to the benefit of the com-
pensation of energy generated by users of residential
The cost of the biogas generator system with the Cap- distributed generation, with significant reduction in
stone 30 microturbine, was already used in similar electricity expenses.
works by Coelho [40], where a value of R$ 8568.62 per
installed kW was reached. Thus, the investment in a
complete 30 kW system with this type of technology References
would cost R$ 257,058.60.
In relation to the photovoltaic plant, considering [1] K. Reiche, A. Covarrubias, and E. Martinot,
the two options (centralized and distributed), and with “Expanding electricity access to remote areas:
the current costs of the market, the investment for the Off-grid rural electrification in developing coun-
installation of this PV system were also calculated. tries,” WorldPower2000, pp. 52–60, 2000. [Online].
Adding these two costs, the total costs of the HPGS Available: https://goo.gl/4d6m7k
was obtained, which are presented in Table 8.
[2] T. Hirota, “Task 17 pv for transport draft
Table 8. Total investment for the HPGS task workplan for 2018-2020,” Waseda Uni-
versity, Tech. Rep., 2017. [Online]. Available:
Distributed PV Centralized PV https://goo.gl/jDegU4
% VEB
R$ Config. R$ Config.
4% 2 344 647 77 x 4 kW 1 667 096 2 x 150 kW [3] Bloomberg New Energy Finance, “Electric
2% 739 583 18 x 4 kW 610 487 1 x 70 kW vehicle outlook 2017,” Bloomberg Finance
L.P, Tech. Rep., 2017. [Online]. Available:
https://goo.gl/BNtKZe
4. Conclusions [4] A. Poullikkas, “Sustainable options for electric
vehicle technologies,” Renewable and Sustainable
Due to the peculiarities of being an island, its tourist
Energy Reviews, vol. 41, pp. 1277–1287, 2015. doi:
and ecological potential, renewable sources of energy
https://doi.org/10.1016/j.rser.2014.09.016.
are the ideal solution for current and future energy
demands of Ilhabela, which will have to occur at some [5] J. J. Roberts, S. Thibaud, and P. O. Prado,
point due to the challenges imposed by the advent of “Proyecto de un sistema híbrido de generación con
BEV. energías renovables para un establecimiento rural
It is concluded that the installation of the biogas aislado,” in XI Latin-American Congress on Elec-
plant is technically feasible, since the capacity of bio- tricity Generation and Transmission “Bioenergy
gas production on the island will be 0.0152 kg/s in for Electricity Generation” and “Ecological Issues
2025 and 0.0174 kg/s in 2030, that is, twice as much as in Power Plants”, At São José dos Campos, Brazil,
what is necessary for the plant to work at its maximum 2015. [Online]. Available: https://goo.gl/omxcph
capacity (0.0059 kg/s). The biogas plant will have a
production of 16 200 kWh/month. [6] A. Cassula, P. O. Prado, J. L. Silveira, and J. J.
From the photovoltaic plant it is concluded that, if Roberts, Energía: Investigaciones en América del
the fleet of electric vehicles is doubled, and the gener- Sur,, 1st ed. Editorial de la Universidad del Sur,
ation capacity of the biogas system is maintained (16 2017, ch. Dimensionamiento de Sistemas Híbridos
200 kWh/month), the installed power of the supple- de Generación de Energía, pp. 109–136. [Online].
mentary PV system will increase by more than four Available: https://goo.gl/yBQo3y
times its capacity, as well as its installation area. It
is also concluded that the adoption of centralized PV [7] T. Wilberforce, Z. El-Hassan, F. Khatib, A. A.
systems led to a 28.9% reduction in total investment Makky, A. Baroutaji, J. G. Carton, and A. G.
in a more long-term scenario. In the scenario for 2025, Olabi, “Developments of electric cars and fuel
with 2% market penetration of the BEV, the option for cell hydrogen electric cars,” International Jour-
the centralized PV system led to a 17.5% reduction in nal of Hydrogen Energy, vol. 42, no. 40, pp.
the total cost of installing the HPGS. These differences 25 695–25 734, 2017. doi: https://doi.org/10.1016/
in capital cost per watt installed between the larger j.ijhydene.2017.07.054.
and smaller systems are due to the scale gains in the
PV equipment market. [8] V. Gass, J. Schmidt, and E. Schmid, “Analysis of
Finally, if on the one hand, centralized photovoltaic alternative policy instruments to promote electric
generation has a lower cost of installation, on the vehicles in austria,” Renewable Energy, vol. 61,
other, distributed generation is a better promoter of pp. 96–101, 2014. doi: https://doi.org/10.1016/j.
social development, by moving local labor and favoring renene.2012.08.012.Micena et al. / A Technical Study of Solar and Biogas Energy Usage in Electric Vehicles in Ilhabela,
Brazil 67
[9] E. Talebizadeh, M. Rashidinejad, and A. Abdol- [18] S. J. Chiang, H. J. Shieh, and M. C. Chen, “Mod-
lahi, “Evaluation of plug-in electric vehicles im- eling and control of pv charger system with sepic
pact on cost-based unit commitment,” Journal of converter,” IEEE Transactions on Industrial Elec-
Power Sources, vol. 248, pp. 545–552, 2014. doi: tronics, vol. 56, no. 11, pp. 4344–4353, Nov 2009.
https://doi.org/10.1016/j.jpowsour.2013.09.009. doi: https://doi.org/10.1109/TIE.2008.2005144.
[10] K. Seddig, P. Jochem, and W. Fichtner, “Integrat- [19] J. L. Silveira, C. E. Tuna, and
ing renewable energy sources by electric vehicle W. de Queiroz Lamas, “The need of subsidy for
fleets under uncertainty,” Energy, vol. 141, pp. the implementation of photovoltaic solar energy
2145–2153, 2017. doi: https://doi.org/10.1016/j. as supporting of decentralized electrical power
energy.2017.11.140. generation in brazil,” Renewable and Sustainable
Energy Reviews, vol. 20, pp. 133–141, 2013. doi:
[11] M. Honarmand, A. Zakariazadeh, and S. Jadid, https://doi.org/10.1016/j.rser.2012.11.054.
“Integrated scheduling of renewable generation
and electric vehicles parking lot in a smart mi- [20] M. G. Villalva and J. R. Gazoli, Energía solar
crogrid,” Energy Conversion and Management, fotovoltaica: conceitos e aplicações, ERICA, Ed.,
vol. 86, pp. 745–755, 2014. doi: https://doi.org/ 2012. [Online]. Available: https://goo.gl/CJKrDF
10.1016/j.enconman.2014.06.044.
[21] M. Benaouadj, A. Aboubou, M. Becherif, M. Y.
[12] W. Liu, W. Hu, H. Lund, and Z. Chen, “Elec- Ayad, and M. Bahri, “Recharging of batteries/-
tric vehicles and large-scale integration of wind supercapacitors hybrid source for electric vehi-
power – the case of inner mongolia in china,” Ap- cles application using photovoltaic energy in a
plied Energy, vol. 104, pp. 445–456, 2013. doi: stand-alone point,” in 2012 First International
https://doi.org/10.1016/j.apenergy.2012.11.003. Conference on Renewable Energies and Vehicular
Technology, March 2012. doi: https://doi.org/10.
[13] D. B. Richardson, “Electric vehicles and 1109/REVET.2012.6195264, pp. 161–166.
the electric grid: A review of modeling
approaches, impacts, and renewable energy [22] J.-H. Song, Y.-S. An, S.-G. Kim, S.-J. Lee, J.-H.
integration,” Renewable and Sustainable En- Yoon, and Y.-K. Choung, “Power output analy-
ergy Reviews, vol. 19, pp. 247–254, 2013. doi: sis of transparent thin-film module in building
https://doi.org/10.1016/j.rser.2012.11.042. [On- integrated photovoltaic system (bipv),” Energy
line]. Available: http://www.sciencedirect.com/ and Buildings, vol. 40, no. 11, pp. 2067–2075,
science/article/pii/S1364032112006557 2008. doi: https://doi.org/10.1016/j.enbuild.2008.
05.013.
[14] L. D. D. Harvey, Energy and the New Reality 2:
[23] N. Altin and T. Yildirimoglu, “Labview/mat-
Carbon-free Energy Supply, Earthscan, Ed., 2010.
lab based simulator for grid connected pv sys-
[Online]. Available: https://goo.gl/RzPzu4
tem,” in 4th International Conference on Power
[15] J. E. Campbell, D. B. Lobell, and C. B. Field, Engineering, Energy and Electrical Drives, May
“Greater transportation energy and ghg offsets 2013. doi: https://doi.org/10.1109/PowerEng.
from bioelectricity than ethanol,” Science, vol. 2013.6635804, pp. 1316–1321.
324, no. 5930, pp. 1055–1057, 2009. doi: http: [24] E. B. Pereira, F. R. Martins, S. L. de Abreu,
//doi.org/10.1126/science.1168885. and R. Rüther, Atlas Brasileiro de Ener-
gia Solar. SWERA, 2017. [Online]. Available:
[16] A. R. Bhatti, Z. Salam, M. J. B. A. Aziz, K. P.
https://goo.gl/8Sr1tG
Yee, and R. H. Ashique, “Electric vehicles charg-
ing using photovoltaic: Status and technologi- [25] CCEE. (2015) 3◦ leilão de fontes alter-
cal review,” Renewable and Sustainable Energy nativas (3◦ lfa). Camara de Comercializa-
Reviews, vol. 54, pp. 34–47, 2016. doi: https: ção de Energia Elétrica. [Online]. Available:
//doi.org/10.1016/j.rser.2015.09.091. https://goo.gl/Sy8iWg
[17] F. Mwasilu, J. J. Justo, E.-K. Kim, T. D. Do, [26] MME, Boletim mensal de monitoramento do setor
and J.-W. Jung, “Electric vehicles and smart grid elétrico, Ministério de Minas e Energia, 2017.
interaction: A review on vehicle to grid and renew-
able energy sources integration,” Renewable and [27] R. L. Nascimento, “Energia solar no brasil:
Sustainable Energy Reviews, vol. 34, pp. 501–516, situação e perspectivas,” Camara dos Deputados.
2014. doi: https://doi.org/10.1016/j.rser.2014.03. Brasil., Tech. Rep., 2017. [Online]. Available:
031. https://goo.gl/gmSddm68 INGENIUS N.◦ 20, july-december of 2018
[28] ANEEL, Resolução normativa n. 687, Altera Production, vol. 152, pp. 497–507, 2017. doi:
a Resolução Normativa n 482, Módulos 1 e 3 https://doi.org/10.1016/j.jclepro.2015.07.091.
dos Procedimentos de Distribuição - PRODIST,
Agencia Nacional de Energia Elétrica. Brasil Std., [39] V. Pecora, “Implantação de uma unidade demon-
2017. [Online]. Available: https://goo.gl/T6PiFn strativa de geração de energia elétrica a partir
do biogás de tratamento do esgoto residencial da
[29] ——, Nota Técnica n. 0056/2017-SRD/ANEEL, usp,” Master’s thesis, Universide de São Paulo
Atualização das projeções de consumidores res- (Instituto de Eletrotécnica e Energia). Brasil,
idenciais e comerciais com microgeração solar 2006. [Online]. Available: https://goo.gl/n35Ysr
fotovoltaicos no horizonte 2017-2024, Agencia
Nacional de Energia Elétrica. Brasil Std., 2017. [40] S. T. Coelho, S. M. S. G. Velazquez, O. S.
[Online]. Available: https://goo.gl/uq4L3i Martins, and F. C. de Abreu, “Sewage bio-
gas convertion into eletricity,” in Anais do
[30] IBGE, Conheça cidades e estados do brasil, 6. Encontro de Energia no Meio Rural, 2006,
Instituto Brasileiro de Geografia e Estatística, Campinas (SP, Brasil), 2006. [Online]. Available:
2017. [Online]. Available: https://goo.gl/nCPqGJ https://goo.gl/X6LWYt
[31] Itapemar Hotel. (2017) Mapa de bolso - ilhabela. [41] J. C. Galarza, O. Llerena, and J. L. Silveira,
[Online]. Available: https://goo.gl/zW4mFS “Thermodynamic and economic analysis of cogen-
[32] P. M. de Ilhabela, Plano Municipal Inte- eration system applied in biodiesel production,”
grado de Saneamiento Básico, Governo do in XI Latin-American congress electricity genera-
Estado de São Paulo, 2015. [Online]. Available: tion and transmission - CLAGTEE 2015, 2015.
https://goo.gl/4WVGst [Online]. Available: https://goo.gl/9KuUc6
[33] W. Q. Lamas, “Análise termoeconômica de [42] A. T. França Junior, “Análise do aproveitamento
uma mini-estação de tratamento de esgoto com energético do biogás producido numa estação
auto-suficiência energética,” Ph.D. dissertation, de tratamento de esgoto. 2008,” Master’s thesis,
Universidade Estadual Paulista, Faculdade de Universidade Estadual Paulista (UNESP). Brasil,
Engenharia de Guaratinguetá, 2007. [Online]. 2008. [Online]. Available: https://goo.gl/yAA3zq
Available: https://goo.gl/8jqqJu
[43] D. F. da Costa, “Geração de energia elétrica a
[34] CRESESB. (2018) Potencial solar - sundata partir do biogás do tratamento de esgoto. 2006,”
v 3.0. Centro de referência para energia so- Master’s thesis, Escola Politécnica, Universidade
lar e eólica Sérgio Brito. [Online]. Available: de São Paulo. Brasil, 2006. [Online]. Available:
https://goo.gl/Ae2cUG https://goo.gl/U8u5qM
[35] G. M. Fetene, S. Kaplan, S. L. Mabit, A. F. Jensen, [44] O. Llerena, “Análisis energético, exergético
and C. G. Prato, “Harnessing big data for esti- y económico de un sistema de cogeneración:
mating the energy consumption and driving range Caso para una planta azucarera de san pablo,”
of electric vehicles,” Transportation Research Part INGENIUS, no. 19, pp. 29–39, 2018.
D: Transport and Environment, vol. 54, pp. 1–11, textscdoi: https://doi.org/10.17163/ings.n19.
2017. doi: https://doi.org/10.1016/j.trd.2017.04. 2018.03. 2018.
013.
[45] GTW. (2012) 2012 gtw handbook. Gas Turbine
[36] R. Baran and L. F. L. Legey, “The introduction World. PequotPublishing Inc. [Online]. Available:
of electric vehicles in brazil: Impacts on oil and https://goo.gl/qmjxen
electricity consumption,” Technological Forecast-
ing and Social Change, vol. 80, no. 5, pp. 907– [46] Y. Cengel and M. Boles, Termodinámica,
917, 2013. doi: https://doi.org/10.1016/j.techfore. M. G. Hill., Ed., 2015. [Online]. Available:
2012.10.024. https://goo.gl/XCTYQU
[37] J. B. Soares, “Matriz elétrica brasileira e [47] H. M. de Carvalho, “Desenvolvimento matemático
matriz elétrica brasileira e as rei’s,” in Em- para avaliação de desempenho de turbinas a gás
presa de Pesquisa Energética, Ministério de de um eixo,” Master’s thesis, Universidade Fed-
Minas e Energia, 2016. [Online]. Available: eral de Itajubá. Brasil, 2006. [Online]. Available:
https://goo.gl/q5GnBS https://goo.gl/cSeUzQ
[38] E. F. Choma and C. M. L. Ugaya, “Environmen- [48] H. I. H. Saravanamuttoo, G. F. Crichton Rogers,
tal impact assessment of increasing electric vehi- and H. Cohen, Gas Turbine Theory, P. Hall, Ed.,
cles in the brazilian fleet,” Journal of Cleaner 2001. [Online]. Available: https://goo.gl/smXkp6Micena et al. / A Technical Study of Solar and Biogas Energy Usage in Electric Vehicles in Ilhabela,
Brazil 69
[49] M. M. Mahmoud and I. H. Ibrik, “Techno- crea-sc,” in I Conferêcia Latino-Americana
economic feasibility of energy supply of remote De Construção Sustentável X Encontro Na-
villages in palestine by pv-systems, diesel genera- cional de Tecnologia do Ambiente Construído.
tors and electric grid,” Renewable and Sustainable São Paulo. ANTAC, 2004. [Online]. Available:
Energy Reviews, vol. 10, no. 2, pp. 128–138, 2006. https://goo.gl/QxnFCa
doi: https://doi.org/10.1016/j.rser.2004.09.001.
[51] Greener. (2017) Em 12 meses, preço dos
[50] D. I. Marinoski, I. T. Salamoni, and R. Ruther, sistemas fotovoltaicos cai 24%. Greener.
“Pré-dimensionamento de sistema solar foto- Pesquisa, Estrategia, Inovação. [Online]. Available:
voltaico:estudo de caso do edifício sede do https://goo.gl/iLbso8You can also read