Quarterly Energy Dynamics - Q1 2019 - Australian Energy Market ...

Page created by Rafael Hawkins
 
CONTINUE READING
Quarterly Energy Dynamics - Q1 2019 - Australian Energy Market ...
Quarterly
Energy
Dynamics

Q1 2019

Author: Market Insights & WA Market Operations
Quarterly Energy Dynamics - Q1 2019 - Australian Energy Market ...
Important notice

PURPOSE

AEMO has prepared this report to provide energy market participants and governments with information on the
market dynamics, trends and outcomes during Q1 2019 (1 January to 31 March 2019). This quarterly report compares
results for the quarter against other recent quarters, focussing on Q4 2018 and Q1 2018. Geographically, the report
covers:

•   The National Electricity Market – which includes Queensland, New South Wales, the Australian Capital Territory,
    Victoria, South Australia and Tasmania.

•   The Wholesale Electricity Market operating in Western Australia.

•   The gas markets operating in Queensland, New South Wales, Victoria and South Australia.

DISCLAIMER
This document or the information in it may be subsequently updated or amended. This document does not constitute
legal or business advice, and should not be relied on as a substitute for obtaining detailed advice about the National
Electricity Law, the National Electricity Rules, the Wholesale Electricity Market Rules, the National Gas Law, the National
Gas Rules, the Gas Services Information Regulations or any other applicable laws, procedures or policies. AEMO has
made every reasonable effort to ensure the quality of the information in this document but cannot guarantee its
accuracy or completeness.

Accordingly, to the maximum extent permitted by law, AEMO and its officers, employees and consultants involved in
the preparation of this document:

•   make no representation or warranty, express or implied, as to the currency, accuracy, reliability or completeness of
    the information in this document; and

•   are not liable (whether by reason of negligence or otherwise) for any statements or representations in this
    document, or any omissions from it, or for any use or reliance on the information in it.

VERSION CONTROL

Version         Release date                Changes

1               07/05/2019                  Initial release

© 2019 Australian Energy Market Operator Limited. The material in this publication may be used in accordance with
the copyright permissions on AEMO’s website.
Quarterly Energy Dynamics – Q1 2019

National Electricity Market (NEM) Q1 highlights
Hot summer increased electricity demand
• Q1 2019 across Australia was the warmest quarter on record, marked by persistent widespread heat, with extreme temperatures
  across many parts of South Australia on 24 January 2019, including Adelaide (47.7°C) and Port Augusta (49.5°C).
• Hot summer conditions increased the cooling load, leading to increased NEM average underlying demand1 (+515 MW) and
  operational demand2 (+243 MW) compared to Q1 2018.
     −   Queensland set a new all-time maximum demand record of 10,044 MW on 13 February 2019 at 1730 hrs, 246 MW higher
         than the previous record.

Record high spot wholesale electricity prices in Victoria and South Australia
• Victoria and South Australia’s quarterly average spot wholesale electricity prices of $166/MWh and $163/MWh were their highest
  on record. These results were not only driven by the electricity price volatility but underlying energy prices (that is, prices below
  $300/MWh) were also high.
     −   Q1 2019 quarterly cap returns were $51.28/MWh in Victoria – its highest quarter on record – and $49.41/MWh for South
         Australia. This volatility largely occurred on 24 and 25 January due to high coincident temperatures across both states
         increasing demand, a series of unplanned thermal unit outages, and comparatively low wind output.
     −   Extreme conditions on these days also led to AEMO activating Reliability and Emergency Reserve Trader (RERT) contracts
         and, when these were insufficient, instructing load shedding on both 24 and 25 January to balance demand with available
         supply.
• Victoria and New South Wales recorded their highest underlying energy price on record, while Queensland, South Australia and
  Tasmania recorded their seconded highest energy prices on record. Drivers of high underling energy prices included:
     −   Dry conditions which resulted in a reduced output from hydro generators.
     −   A continuation of comparatively high wholesale gas prices.
     −   An increase in the price of offers from black coal-fired generation, with some generators citing coal conservation and/or
         quality issues.
     −   Increased demand resulting from hot summer conditions.
• Forward wholesale prices also continued their upward climb: the price of calendar year (Cal) 2020 electricity swap contracts
  traded on the ASX rose between 12-23% over Q1 2019 and have risen by 49% in Victoria since July 2018.

Increased solar generation due to new capacity; hydro output reduced due to dry conditions
• Key changes in the NEM supply mix compared to Q1 2018 included:
     −   An increase in average solar generation (both rooftop photovoltaic [PV] and grid solar) of approximately 700 MW, due to
         increased installed capacity.
     −   Continued dry conditions in the south led to average hydro output decreasing by around 200 MW.
     −   Gas-powered generation (GPG) rebounded from the record low quarterly output in Q4 2018, increasing by 143 MW on
         average compared to Q1 2018. This increase in GPG occurred predominantly in the evening peak period, corresponding with
         higher demand, higher spot electricity prices and declining solar output.

Wholesale gas prices remained high as gas-powered generation and oil prices rebounded
• Wholesale gas prices remained comparatively high at around $9-10/GJ, increasing across all markets by an average of 15%
  compared to Q1 2018.
• The driver of the price increases was increased demand (largely from GPG and increased LNG exports), as well as higher priced
  gas injection offers.
• International Brent (oil) prices reversed the price fall that occurred over Q4 2018, increasing by 27% in Q1 2019 to finish at
  $US68/bbl.

1
    Underlying demand is consumers’ total demand for electricity from all sources, including the grid and distributed resources such as rooftop PV.
2
    Operational demand refers to the electricity used by residential, commercial, and large industrial consumers, as supplied by scheduled, semi-scheduled, and
     significant non-scheduled generating units.

© AEMO 2019 | Quarterly Energy Dynamics - Q1 2019                                                                                                                 3
Quarterly Energy Dynamics – Q1 2019

Western Australia Wholesale Electricity Market (WEM) Q1 highlights
• The WEM has traditionally been summer peaking, however, during Q1 2019 summer peak demand fell to winter peak demand
  levels. This was due to mild summer conditions and increased penetration of rooftop PV.
• Average Load Following Ancillary Service (LFAS) Up and LFAS Down prices converged for the first time since LFAS market start.
• Non-scheduled generation in the WEM reached its highest ever proportion of underlying system demand at 47.8%.

© AEMO 2019 | Quarterly Energy Dynamics - Q1 2019                                                                             4
Quarterly Energy Dynamics – Q1 2019

Executive summary                                                      3

1.        NEM market dynamics                                          6
1.1       Weather                                                      6
1.2       Electricity demand                                           6
1.3       Wholesale electricity prices                                 8
1.4       Electricity generation                                      11
1.5       Other NEM-related markets                                   17
1.6       Inter-regional transfers                                    21
1.7       Power system management                                     23

2.        Gas market dynamics                                         24
2.1       Gas demand                                                  24
2.2       Wholesale gas prices                                        25
2.3       Gas supply                                                  26
2.4       Pipeline flows                                              28
2.5       Gas Supply Hub                                              29
2.6       Gas – Western Australia                                     30

3.        WEM market dynamics                                         31
3.1       Electricity demand and weather                              31
3.2       Wholesale electricity pricing                               32
3.3       Non-scheduled generation                                    33

Abbreviations                                                         34

© AEMO 2019 | Quarterly Energy Dynamics - Q1 2019                          5
Quarterly Energy Dynamics – Q1 2019

1.1               Weather
Q1 2019 across Australia was the warmest quarter on record. Compared to both Q1 2018 and the 10-year average, average
maximum temperatures were around 1°C higher across all capital cities (Figure 1). There were also multiple periods of prolonged
heatwaves during the quarter, particularly in January3. For example, record-breaking temperatures were recorded across many
parts of South Australia on 24 January 2019, including Adelaide (47.7°C) and Port Augusta (49.5°C).
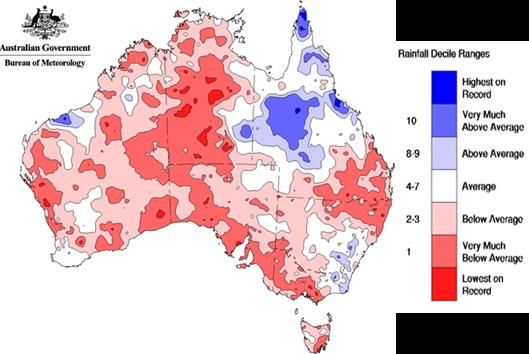
The start of 2019 was also notable for dry conditions, with below average rainfall across most of the country except northern
Queensland. The dry conditions have been most persistent in the Murray-Darling basin, which has recorded below average rainfall
for almost two years4. Tasmanian rainfall for the quarter was again below average, making it six months of dry conditions.

Figure 1          Average max temperature variance by capital city                       Figure 2              Rainfall deciles – Q1 2019
                  – Q1 2019 vs Q1 2018 and 10-year Q1 average

             2

            1.5

              1
       °C

            0.5

             0
                      BRI         SYD          MEL         ADL          HOB

                    Q1 19 vs Q1 18          Q1 19 vs 10yr average

Source: Bureau of Meteorology

1.2               Electricity demand
Warmer summer conditions increased the cooling load, leading to                                 Figure 3                   Change in NEM demand by time of day
increased electricity demand across all parts of the day compared to                                                       – Q1 2019 vs Q1 2018
Q1 2018. Average NEM operational demand5 in Q1 2019 was up 243
MW (+1%) compared to Q1 2018, while underlying demand6 was up                                                       1000
515 MW on average. This difference between underlying and
                                                                                                                    800
operational demand (Figure 3) highlights the impact of rooftop PV
generation on the demand curve.
                                                                                                    MW difference

                                                                                                                    600
Compared to Q1 2018:
                                                                                                                    400
• The largest increase in average operational demand was in New
                                                                                                                    200
  South Wales (+216 MW), while Queensland also increased (+111
  MW, Figure 4). The driver in these regions was the hot weather                                                      0
  which increased cooling load in the major population centres.
                                                                                                                    -200
• Operational demand reduced in Victoria (-50 MW) and South
                                                                                                                           10:00
                                                                                                                           12:00

                                                                                                                           16:00
                                                                                                                           18:00
                                                                                                                           04:00
                                                                                                                           00:00
                                                                                                                           02:00

                                                                                                                           06:00
                                                                                                                           08:00

                                                                                                                           20:00
                                                                                                                           22:00
                                                                                                                           00:00
                                                                                                                           14:00

  Australia (-1 MW) due to increased generation from rooftop PV
  more than offsetting increases in the underlying demand.
                                                                                                                    Operational demand        Underlying demand
• Operational demand in Tasmania (-33 MW) slightly decreased,
  partly driven by small changes in industrial consumption.

3
    For further information see BOM Special Climate Statement 68 - widespread heatwaves during December 2018 and January 2019
4
    For further information see BOM Special Climate Statement 70—drought conditions in eastern Australia and impact on water resources in the Murray–Darling Basin
5
    Operational demand refers to the electricity used by residential, commercial, and large industrial consumers, as supplied by scheduled, semi-scheduled, and
     significant non-scheduled generating units.
6
    Underlying demand is consumers’ total demand for electricity from all sources, including the grid and distributed resources such as rooftop PV.

© AEMO 2019 | Quarterly Energy Dynamics - Q1 2019                                                                                                                 6
Quarterly Energy Dynamics – Q1 2019

Figure 4                            Average operational demand for Q1 (2014 to 2019)

                                   1.15

                                    1.1
      Average operational demand

                                                                        6,800                                                                     1,096
                                   1.05                                                                       5091            1,484               (-33)
                                                     22,903             (+111)           8,432
            (Q1 2019 base)

                                                                                                              (-50)            (-1)
                                                     (+243)                             (+216)                                                                    Q1 2019
                                      1                                                                                                                           higher than
                                                                                                                                                                  Q1 2018

                                   0.95                                                                                                                           Q1 2019
                                                                                                                                                                  lower than
                                                                                                                                                                  Q1 2018
                                    0.9

                                   0.85

                                                                                                                                      2014
                                               -
                                               -
                                               -
                                               -

                                                                    -
                                                                    -
                                                                    -
                                                                    -

                                                                                    -
                                                                                    -
                                                                                    -
                                                                                    -

                                                                                                    -
                                                                                                    -
                                                                                                    -
                                                                                                    -

                                                                                                                         -
                                                                                                                         -
                                                                                                                         -
                                                                                                                         -

                                                                                                                                         -
                                                                                                                                         -
                                                                                                                                         -
                                                                                                                                         -
                                                                                                                                      2019
                                            2014

                                            2019

                                                                 2014

                                                                 2019

                                                                                 2014

                                                                                 2019

                                                                                                 2014

                                                                                                 2019

                                                                                                                      2014

                                                                                                                      2019
                                                   NEM            QLD             NSW                   VIC              SA              TAS
Note: Demand by region has been normalised with Q1 2019 as the base. Values greater than 1 indicate that demand was higher than in Q1 2019
while values less than one represent the opposite. Units within the columns are in MW.

Maximum and minimum demand
The seasonal profile of demand tends to manifest in Q1 being the quarter where maximum demand records occur, with the
exception of Tasmania which is winter peaking. Table 1 outlines the maximum and minimum demands which occurred in Q1 2019
and the respective regional records7. During the quarter, two demand records were broken:
• Queensland continued a trend of increasing maximum demands, setting a new all-time maximum demand record of 10,044 MW
  on 13 February 2019 at 1730 hrs, 246 MW higher than the previous record8. The new record occurred during a period of high
  temperatures
     −           Despite hot weather, maximum demands in other regions did not reach record levels due, in part, to increased output from
                 rooftop PV.
• South Australia set a new Q1 minimum demand record of 695 MW on 6 January 2019 at 1300 hrs, 25 MW lower than the
  previous record. The drivers of this are the same as previous records, with increased rooftop PV capacity lowering midday
  operational demand – a trend that has occurred for the past two years and is expected to continue.
Table 1                             Maximum and minimum operational demand (MW) by region – Q1 2019 vs records

                                             Queensland            New South Wales                      Victoria              South Australia *              Tasmania

                                           Max           Min        Max           Min             Max              Min        Max         Min             Max           Min

         Q1 2019                          10,044         4,847     13,821         5,773          9,328           3,601        3,240       695             1,363         756
                All Q1                    9,798          3,260     14,744         4,642          10,576          3,311        3,399       720             1,499         552

         All-time                         9,798          3,102     14,744         4,642          10,576          3,217        3,399       599             1,790         552
* Excluding system black event in South Australia and subsequent market suspension in the region (28 September 2016 - 11 October 2016).

7
    Table records refer to those prior to the commencement of Q1 2019. Instances where the previous record has been broken are shown with red text. The records go
     back to when the NEM began operation as a wholesale spot market in December 1998. Tasmania joined in May 2005.
8
    http://energylive.aemo.com.au/Energy-Explained/Queensland-breaks-demand-record

© AEMO 2019 | Quarterly Energy Dynamics - Q1 2019                                                                                                                               7
Quarterly Energy Dynamics – Q1 2019

1.3                Wholesale electricity prices
Q1 2019 was notable for the high spot wholesale electricity prices recorded in all NEM regions (Figure 5).

Figure 5           Average wholesale electricity price by region

             200
                                                             Energy price                               Cap price
             175

             150

             125
     $/MWh

             100

              75

             50

             25

               -
                                                             Q1 15
                     Q1 15
                             Q1 16
                                     Q1 17
                                             Q1 18
                                                     Q1 19

                                                                     Q1 16
                                                                             Q1 17
                                                                                     Q1 18
                                                                                             Q1 19

                                                                                                     Q1 15
                                                                                                             Q1 16
                                                                                                                     Q1 17
                                                                                                                             Q1 18
                                                                                                                                     Q1 19

                                                                                                                                             Q1 15
                                                                                                                                                     Q1 16
                                                                                                                                                             Q1 17
                                                                                                                                                                     Q1 18
                                                                                                                                                                             Q1 19

                                                                                                                                                                                     Q1 15
                                                                                                                                                                                             Q1 16
                                                                                                                                                                                                     Q1 17
                                                                                                                                                                                                             Q1 18
                                                                                                                                                                                                                     Q1 19
                                     QLD                                 NSW                                         VIC                                     SA                                      TAS

This was a result of spot price volatility in Victoria and South Australia, as well as high underlying energy prices 9 (that is, prices
below $300/MWh) in all NEM regions.

• Victoria and South Australia’s quarterly average spot electricity prices of $166/MWh and $163/MWh were their highest on record.
• Victoria and New South Wales recorded their highest underlying energy price on record, while Queensland, South Australia and
  Tasmania recorded their seconded highest energy prices on record. Spot prices were consistently above $100/MWh for much
  of the quarter. For example, Victoria’s price was above $100/MWh for 58% of the quarter, compared to 19% of the quarter in
  Q1 2018.
Drivers of high energy prices are discussed in the table below, while price volatility results are discussed in Section 1.3.1.

Wholesale electricity price drivers in Q1 2019

                                                     Compared to Q1 2018, hydro generators shifted approximately 800 MW of capacity to prices above
    Dry conditions                                   $100/MWh, resulting in reduced dispatch at lower prices. This reflects recent dry conditions and the
                                                     need to conserve dam storage levels (see Section 1.4.3).

                                                     Wholesale gas prices remained at comparatively high levels during Q1 2019 (see Section 2.2), which
                                                     was reflected in comparatively higher GPG offers. Compared to the previous three Q1s,
    High gas prices
                                                     approximately 250 MW of GPG offers on average was shifted to prices above $100/MWh (from prices
                                                     below $100/MWh).

                                                     In Q1 2019, there was a further shift in offers from black coal-fired generators. Approximately
    Shifts in black-coal                             800 MW offered below $100/MWh in Q1 2018, was moved to prices above $100/MWh in Q1 2019.
    fired generator offers                           Some generators highlighted coal conservation and/or quality issues as reasons for their changed
                                                     offers over the quarter. See Section 1.4.2 for further details.

                                                     Hot summer conditions increased NEM average operational demand by 243 MW compared to Q1
    Increased demand                                 2018. The largest increase in operational demand occurred in the late afternoon and evening peak
                                                     demand periods (1600-2200 hrs), resulting in higher prices during these periods.

9
    ‘Energy price’ is used in electricity pricing to remove the impact of price volatility (that is, prices above $300/MWh).

© AEMO 2019 | Quarterly Energy Dynamics - Q1 2019                                                                                                                                                                            8
Quarterly Energy Dynamics – Q1 2019

1.3.1                    Price volatility
During Q1 2019, there was high spot price volatility in Victoria and South Australia, but low volatility in New South Wales and
Queensland, consistent with outcomes in Q1 2018.

Victoria and South Australia
Q1 2019 quarterly cap returns10 were $51.28/MWh in Victoria – its highest quarter on record – and $49.41/MWh for South Australia.
This volatility largely occurred on two days due to a confluence of events in the two regions. Victoria and South Australia’s daily
average prices of $3,378/MWh and $3,360/MWh on 24 January 2019 were their highest on since NEM-start (Figure 6). The
continuation of price volatility into 25 January resulted in the Cumulative Price Threshold (CPT)11 being triggered, limiting the
maximum price to $300/MWh once it came into effect.
Contributors to these pricing outcomes included:

• Temperatures in South Australia broke new records on 24 January 2019, while parts of country Victoria experienced extreme
  heat (close to record levels). Simultaneous high temperatures in South Australia and Victoria resulted in high electricity demand
  across both regions, with coincident maximum operational demand of 12,463 MW on 24 January 2019 (representing the highest
  result since Q1 2014).
• A series of brown coal outages on these days reduced thermal capacity in Victoria by up to 1,600 MW.
• Wind capacity factors were comparatively low during the high-priced periods (average of 15% during the high prices, compared
  to average capacity factors of 30% during high demand periods in Victoria).
Extreme conditions on these days also led to AEMO activating Reliability and Emergency Reserve Trader (RERT) contracts and (as
a last resort) AEMO instructing load shedding on both 24 and 25 January to balance demand with available supply. AEMO’s report
on Load Shedding in Victoria on 24 and 25 January 201912 provides more details on the events of these two days.

Figure 6                   Victorian spot electricity price and operational demand on 24 and 25 January 2019

                       20,000                                           Price                             Price if CPT not breached                                                       Demand                                12,000

                                                                                                                                                                                                                                         Demand (MW)
       Price ($/MWh)

                       15,000                                                                                                                                                                                                   10,000

                       10,000                                                                                                                                                                                                   8,000

                        5,000                                                                                                                                                                                                   6,000

                           0                                                                                                                                                                                                    4,000
                                                                                                                                                                                12:30
                                                                        10:30
                                                                                12:30

                                                                                                16:30
                                                                                                        18:30

                                                                                                                                                                        10:30

                                                                                                                                                                                                16:30
                                                                                                                                                                                                        18:30
                                                04:30

                                                                                                                                                04:30

                                                                                                                                                                                                                20:30
                                00:30
                                        02:30

                                                        06:30
                                                                08:30

                                                                                                                20:30
                                                                                                                        22:30
                                                                                                                                00:30
                                                                                                                                        02:30

                                                                                                                                                        06:30
                                                                                                                                                                08:30

                                                                                                                                                                                                                        22:30
                                                                                        14:30

                                                                                                                                                                                        14:30

                                                                        24-Jan-19                                                                                       25-Jan-19

Queensland and New South Wales
Despite hot weather and record demand in Queensland, Q1 2019 quarterly cap returns were comparatively low in Queensland
and New South Wales (less than $0.01/MWh and $2.33/MWh, respectively). This represents a continuation of the lack of price
volatility in these two regions which has occurred since Q1 2017. Even record high Queensland operational demand on 13 February
2019 only resulted in maximum spot prices of $143.68/MWh. Contributors to this trend include:
• Comparatively high availability of the black coal fleet at prices below $300/MWh over the last two summers. For example, there
  was an additional 814 MW on average offered below $300/MWh in Q1 2019 compared to Q1 2017.
• The Queensland Government’s instruction to its state-owned generators to “undertake strategies to place downward pressure
  on wholesale prices”.13
• The return at the end of 2017 of Swanbank E (380 MW), which has run over the peak summer periods since then.

10
     A measure of volatility in electricity prices is the presence of high price events – prices above $300/MWh. Often represented as ‘quarterly cap returns’ which is the
     sum of the NEM half hourly price minus the $300 Cap Price for every half hour in the contract quarter where the pool price exceeds $300/MWh, divided by the
     number of half hours in the quarter.
11
     The cumulative price threshold imposes a limit on sustained high prices in the wholesale market. For further details on the CPT, see
     Reliability Panel 2018, Reliability standard and setting review 2018. Available at: www.aemc.gov.au/sites/default/files/2018-
     04/Reliability%20Panel%20Final%20Report.pdf
12
     AEMO 2019. Load Shedding in Victoria on 24 and 25 January 2019 – An operating incident report for the National Electricity Market, at www.aemo.com.au/-
     /media/Files/Electricity/NEM/Market_Notices_and_Events/Power_System_Incident_Reports/2019/Load-Shedding-in-VIC-on-24-and-25-January-2019.pdf
13
     https://dnrme.qld.gov.au/energy/initiatives/powering-queensland

© AEMO 2019 | Quarterly Energy Dynamics - Q1 2019                                                                                                                                                                                                      9
Quarterly Energy Dynamics – Q1 2019

1.3.2                                Price-setting trends
Despite the significant increase in NEM spot wholesale electricity prices (Section 1.3), price setting outcomes during Q1 2019 were
relatively similar to Q1 2018 with minor changes amongst the fuel types. By region:
• Queensland and New South Wales – black coal continued to be the primary price setter in Queensland and New South Wales,
  setting the price approximately 70% of the time (predominantly in the off-peak periods). Compared to Q1 2018, there was a
  small reduction in black coal price setting, which was offset by increases in gas as the marginal unit.
• Victoria and South Australia – the marginal fuel source in Victoria and South Australia remained balanced between black coal
  (around 40%), gas (around 30%) and hydro (around 30%). These proportions tend to fluctuate subtly depending on changes in
  generation and availability across periods. Black coal’s price setting role decreased when compared to both Q1 2018 and
  Q4 2018, with small increases in the price setting role for gas and hydro. The reduction in black coal as the marginal unit was
  coincident with constraints on flows south over the VIC-NSW interconnector (see Section 1.6).
• Tasmania – Tasmania’s price was set by local units 61% of the time, in line with Q1 2018 results, with the marginal fuel sources
  remaining relatively similar to this quarter. The main price setting units were Gordon and Poatina.

Figure 7                              Price-setting by fuel type – Q1 2019 versus prior quarters

                               100%
      Percentage of time (%)

                                80%
                                                                                                                                                                                                                                                 Other
                                60%
                                40%                                                                                                                                                                                                              Hydro

                                20%                                                                                                                                                                                                              Gas
                                 0%                                                                                                                                                                                                              Brown Coal
                                                                 Q4 18

                                                                                                         Q4 18

                                                                                                                                                 Q4 18

                                                                                                                                                                                         Q4 18

                                                                                                                                                                                                                                 Q4 18
                                         Q1 18
                                                 Q2 18
                                                         Q3 18

                                                                         Q1 19

                                                                                 Q1 18
                                                                                         Q2 18
                                                                                                 Q3 18

                                                                                                                 Q1 19

                                                                                                                         Q1 18
                                                                                                                                 Q2 18
                                                                                                                                         Q3 18

                                                                                                                                                         Q1 19

                                                                                                                                                                 Q1 18
                                                                                                                                                                         Q2 18
                                                                                                                                                                                 Q3 18

                                                                                                                                                                                                 Q1 19

                                                                                                                                                                                                         Q1 18
                                                                                                                                                                                                                 Q2 18
                                                                                                                                                                                                                         Q3 18

                                                                                                                                                                                                                                         Q1 19
                                                                                                                                                                                                                                                 Black Coal

                                                     QLD                                     NSW                                         VIC                                     SA                                      TAS
Note: Price setting can occur inter-regionally: for example, Victoria’s price can be set by generators in other NEM regions.

Case study: New South Wales – Q1 2019 versus Q1 2018
While the price setting share by fuel types remained similar between Q1 2019 and Q1 2018, the point at which the marginal units
(and respective fuels) set the price increased across almost all percentiles this quarter. Figure 8 shows the price setting curves for
the major price setting fuel types in New South Wales, which had a significant increase in the underlying price of energy this
quarter compared to Q1 2018 (see Section 1.3).
In Q1 2018, gas and hydro were interchangeable in their role as the marginal unit, setting the price at comparable prices. This
dynamic shifted in Q1 2019, with hydro setting price at comparatively higher prices than gas units.

• When hydro was marginal, it set the price above $100/MWh 74% of the time compared to just 17% of the time in Q1 2018. This
  reflects the shift in offers from hydro units to higher priced bands due to low water storage levels (Section 1.4.3).
• For gas units, the increase was reflective of higher wholesale gas prices flowing through into increased electricity price offers
  (Section 1.3). Gas also played a more frequent price setting role than hydro, typically setting price lower than hydro units.
• Black coal-fired generators also set the price at higher levels than in Q1 2018: setting the price above $100/MWh 19% of the
  time during the quarter versus 2% of the time in Q1 2018. This reflects higher priced offers from black-coal fired generators
  (Section 1.4.2), which also coincides with higher-priced offers from the other key price setting fuel types.

Figure 8                              Price-setting duration curve by fuel type – New South Wales – Q1 2019 versus Q1 2018
                          300
                                                                                                                                                                                                                                                  Black Coal
                          250
                                                                                                                                                                                                                                                  Gas
  Price ($/MWh)

                          200
                                                                                                                                                                                                                                                  Hydro
                               150
                               100
                                                                                                                                                                                                                                                  Q1 2019
                               50
                                                                                                                                                                                                                                                  Q1 2018
                                0
                                            25%                  50%             75%                              25%       50%     75%                                            25%               50%            75%
                                                                                                                           Duration

© AEMO 2019 | Quarterly Energy Dynamics - Q1 2019                                                                                                                                                                                                              10
Quarterly Energy Dynamics – Q1 2019

1.4                             Electricity generation
During the quarter the changing demand profile,                             Figure 9                         Change in supply – Q1 2019 versus Q1 2018
capacity additions, and the pricing of dispatchable
generation induced shifts in the supply mix. Figure 9                                                500
shows the average change in generation by fuel type
compared to Q1 2018 and Figure 10 illustrates the                                                    400

                                                                               Average change (MW)
changes by time of day. Key shifts included:
                                                                                                     300
• An increase in rooftop and grid solar generation of
  approximately 700 MW on average, with 2,173 MW of                                                  200
  new grid scale capacity commencing generation since
                                                                                                      100
  Q1 2018.
• Black coal-fired generation reduced by 133 MW on                                                     0
  average, reflecting: displacement by solar during the
                                                                                                     -100
  daytime; shifts into higher priced bands; and a 217 MW
  reduction in average availability.                                                                 -200
• Hydro output decreased by 200 MW on average, due                                                   -300
  to dry conditions over the quarter and low storage

                                                                                                                                                                                        Hydro
                                                                                                                                                                        Black coal
                                                                                                                                            Wind
                                                                                                                            Rooftop PV

                                                                                                                                                    Gas

                                                                                                                                                           Brown coal
                                                                                                               Grid solar
  levels.
• GPG rebounded from record low quarterly output in
  Q4 2018, increasing by 143 MW on average compared
  to Q1 2019. This increase occurred predominantly in
  the evening peak period, coinciding with higher spot
  electricity prices and declining solar output.

Figure 10 Change in supply – Q1 2019 versus Q1 2018 by time of day

                       2,500
                                              Black           Brown                                                                                  Rooftop
                                                                         Gas                            Hydro                    Solar                                  Wind
                                              Coal            Coal                                                                                   PV

                       2,000

                       1,500

                       1,000
 Average change (MW)

                         500

                           0

                        -500

                       -1,000

                       -1,500
                             00:00   02:00   04:00    06:00      08:00   10:00                       12:00        14:00                  16:00     18:00     20:00                   22:00      00:00
                                                                                                     Time

© AEMO 2019 | Quarterly Energy Dynamics - Q1 2019                                                                                                                                                       11
Quarterly Energy Dynamics – Q1 2019

1.4.1                                      Wind and solar generation
Compared to Q1 2018, average large-scale wind and solar generation increased from 1,521 MW to 2,116 MW (+39%) (Figure 11).
Average wind generation increased by 201 MW and large-scale solar generation increased by 394 MW, as additional capacity was
brought online.
The rapid deployment of large-scale solar generation has continued with five new solar farms totalling 326 MW capacity
commencing generation in Q1 2019 (Table 2). Of this new large-scale solar capacity, four solar farms commenced generation in
Queensland (231 MW), and one in South Australia (95 MW).

Figure 11 NEM wind and solar generation by region                                                       Table 2      New entrants in the NEM in Q4 2018
       2,000
                 QLD    NSW     VIC    SA    TAS                                                         Technology            New entrant      Capacity (MW)        Region

                                      1,500                                                                               Childers Solar Farm             56
            Average generation (MW)

                                      1,000                                                                               Hayman Solar Farm               50
                                                                                                                                                                       QLD
                                                                                                                          Lilyvale Solar Farm         100
                                       500                                                                   Solar
                                                                                                                          Oakey 1 Solar Farm              25
                                            0
                                                                                                                          Tailem Bend Solar
                                                 Q1 18    Q1 19   Q1 18     Q1 19     Q1 18    Q1 19                                                      95            SA
                                                                                                                          Project 1
                                                  Large-scale      Small-scale           Wind           Note: Table includes new entrants that began generating during the
                                                     solar           solar                              quarter. Several of these projects are still undergoing testing and
                                                                                                        have yet to commence generating at full capacity.

In Q1 2019, large-scale solar met 5% of total midday operational demand, contrasting its contribution of 1% in Q1 2018 (Figure
12). The growing contribution is due to more than 2 GW of large-scale solar capacity commencing generation since the beginning
of 2018 and was particularly marked in South Australia and Queensland, with around 8% of demand met by large-scale solar,
compared to almost no contribution in Q1 2018.

Of note, the shape of Victoria’s large-scale solar generation profile illustrates the impact of solar tracking technology14: During
summer tracking systems capture more direct solar radiation for longer periods of the day. This combined with the sizing of the
inverter results in a flatter generation profile and higher capacity factors. In 2018, more than two-thirds of new grid solar capacity
came from systems utilising single-axis tracking.

Figure 12 Percentage of Q1 2018 and Q1 2019 operational demand met by large-scale solar generation by time of day

                                      8%
% of operational demand

                                      6%

                                      4%

                                      2%

                                      0%
                                            00

                                                                  23
                                                                       00

                                                                                              23
                                                                                                   00

                                                                                                                     23
                                                                                                                          00

                                                                                                                                                23
                                                                                                                                                     00

                                                                                                                                                                             23
                                                                                                                                                                12
                                                         12

                                                                                 12

                                                                                                         12

                                                                                                                                     12

                                                    NSW                       QLD                       SA                          VIC                        NEM

                                                                                              Q1 2018         Q1 2019

Between Q1 2018 and Q1 2019 average rooftop PV generation increased from 995 MW to 1,268 MW (+27%). The largest increase
was in New South Wales (30%), with substantial increases also occurring in Victoria (28%) and South Australia (28%). Increases in
generation correspond with a record amount of installed rooftop PV capacity over 2018, and 2019 so far.

14
          Unlike conventional, fixed axis systems, tracking solar has panels that tilt around a north-south axis to follow the sun – they face east in the morning, are horizontal
          at solar noon and face west in the evening.

© AEMO 2019 | Quarterly Energy Dynamics - Q1 2019                                                                                                                               12
Quarterly Energy Dynamics – Q1 2019

1.4.2                                        Coal-fired generation
Total coal-fired generation reduced output by 209 MW on average compared to Q1 2018, despite higher NEM spot prices (Figure
13). By region, Queensland black coal-fired generation decreased by 132 MW on average, while New South Wales black coal-fired
generation remained unchanged. The largest changes in average output between quarters were at Liddell (+232 MW), Mt Piper
(-279 MW), Gladstone (-125 MW) and Stanwell (-74 MW) power stations. Drivers of these changes are outlined in the table below.

Brown coal-fired generation reduced by 76 MW on average when compared to Q1 2018, largely due to reduced availability and
output at Loy Yang A and Yallourn power stations.
     Figure 13 Coal availability and generation                                            Figure 14 Coal fleet – unplanned outages

                                            9,000                           Generation
                                                                                                                             60

                                                                                               Number fo unplanned outages
                                            8,000                           Q1 18 avail                                      50
         Average availability or gen (MW)

                                                                            Q4 18 avail
                                            7,000                                                                            40
                                                                            Q1 19 avail
                                            6,000                                                                            30
                                            5,000
                                                                                                                             20
                                            4,000
                                                                                                                             10
                                            3,000
                                                                                                                              0
                                            2,000
                                                                                                                                     Q1       Q2          Q3   Q4       Q1
                                            1,000
                                                                                                                                                   2018                2019
                                               0
                                                                                                                             QLD black coal   NSW black coal   VIC brown coal
                                                     QLD     NSW            VIC

Drivers of reduced black-coal fired generation despite higher spot prices

                                                            Compared to Q1 2018, an additional 800 MW of capacity was shifted to prices above
                                                            $100/MWh (Figure 15). This resulted in reduced dispatch of the black coal fleet at prices below
                                                            $100/MWh.
     Capacity shifted into
     higher priced bands                                    Some coal supply constraints may have contributed to the shift in offers. For example, during
                                                            the quarter EnergyAustralia regularly rebid capacity at Mt Piper Power Station due to coal
                                                            conservation and/or quality issues.

                                                            Despite a 32% reduction in the number of unplanned outages compared to Q1 2018 (Figure
                                                            1415), average black coal availability reduced by 217 MW. This was due to an increase in the
     Reduced availability                                   amount of time returning from these outages, taking an average of 3.6 days to return to service
                                                            following an unplanned outage.

                                                            The largest reduction in black-coal fired generation by time of day occurred in the middle of
     Displacement by solar                                  the day, coinciding with an average increase in solar generation of 1,500-2,000 MW (Figure 10).

15
     This report uses a different metric to previous reports. While previous reports focussed on ‘sudden unit trips’ (when a generator falls from above minimum
     generation to 0 MW in under 10 minutes), this report includes all unplanned outages.

© AEMO 2019 | Quarterly Energy Dynamics - Q1 2019                                                                                                                               13
Quarterly Energy Dynamics – Q1 2019

Figure 15 Bid supply curve – NEM black coal-fired generation

                         300
                                                            Q1 2018                     Q1 2019
                         250
         Price ($/MWh)

                         200
                                                                                   On average, 800 MW shifted
                         150                                                       to prices above $100/MWh

                         100

                          50

                           0
                           12,000                         12,500                    13,000            13,500                        14,000                    14,500                  15,000
                                                                                                    Offers (MW)

1.4.3                    Hydro generation
Hydro generation across the NEM in Q1 2019 was lower                                                 Figure 16 Quarterly hydro output
than both Q1 2018 and Q4 2018 (-201 MW and -306
MW respectively – see Figure 16). By region:                                                                  3,000
                                                                                                              2,500
• Tasmania’s quarterly average hydro output was
  consistent with historical Q1 results, but 56 MW lower                                                      2,000
                                                                                                       MW

  than Q1 2018. There was also further contraction in                                                         1,500
  output however when compared to Q4 2018. Average                                                            1,000
  output decreased by 392 MW, with the largest reductions                                                         500
  in generation from Gordon and Poatina. This reduction                                                            -
  coincided with below average rainfall across most of
                                                                                                                              Q1      Q2        Q3     Q4         Q1     Q2      Q3   Q4   Q1
  Tasmania which meant their total energy in storage
  reduced from around 40% at the start of the quarter to                                                                                  2017                                2018         2019
  31% at quarter end (Figure 17).
                                                                                    QLD    NSW    VIC    TAS
• New South Wales hydro generation also reduced in both
  comparison periods, particularly when compared to Q1 2018. On average, output from New South Wales hydro units was 244
  MW lower predominantly due to reduced output from Upper Tumut – a product of around 350 MW shifted to higher price
  bands above $100/MWh compared to Q1 2018 which coincided with dry conditions.
• Victoria was higher than both Q1 2018 and Q4 2018 (26 and 41 MW, respectively) however the unit drivers varied slightly. The
  increase in Q1 was due to increased Dartmouth output while the shift from Q4 2018 was due to more output from Murray.
  These changes were primarily a function of record high spot electricity prices in Victoria (Section 1.3).
• Queensland hydro output was at its highest level since Q2 2007, although it remained a comparatively small portion of
  Queensland generation (2%). The key increases were from Barron Gorge and Kareeya, which were also operating at record levels.

Figure 17 Hydro storage levels

     60%                                                                                                                                                                                     2015
     50%
                                                                                                                                                                                             2016
     40%
     30%                                                                                                                                                                                     2017
     20%                                                                                                                                                                                     2018
     10%
                                                                                                                                                                                             2019
      0%
                                              Apr

                                                                                                                        Apr
                                                          Jun
                                                                Jul

                                                                                  Oct
                                                                                        Nov

                                                                                                                                          Jul

                                                                                                                                                            Oct
                                                                                                                                                                  Nov
                                                                      Aug

                                                                                                                                    Jun

                                                                                                                                                Aug
                           Jan

                                                                            Sep

                                                                                              Dec

                                                                                                      Jan

                                                                                                                                                      Sep

                                                                                                                                                                        Dec
                                 Feb
                                       Mar

                                                                                                            Feb
                                                                                                                  Mar
                                                    May

                                                                                                                              May

                               Hydro Tasmania (Total Energy in Storage)                                       Snowy Hydro (Lake Eucumbene)
Source: Hydro Tasmania & Snowy Hydro     16                           17

16
     https://www.hydro.com.au/water
17
     https://www.snowyhydro.com.au/our-energy/water/storages/lake-levels-calculator/

© AEMO 2019 | Quarterly Energy Dynamics - Q1 2019                                                                                                                                                   14
Quarterly Energy Dynamics – Q1 2019

1.4.4                          Gas-powered generation
In Q1 2019, GPG was dispatched at comparatively high                                                                                                            Figure 18 Quarterly gas-powered generation
levels, reversing the downward trend in 2018 (Figure 18).
By region, average GPG increased in Victoria, South                                                                                                                                           3,000
Australia and New South Wales (+126, 96 and 68 MW,
respectively), and decreased in Tasmania and Queensland
                                                                                                                                                                                              2,500
(-92 MW and -56 MW, respectively). Tasmania’s reduced
requirement was facilitated by increased electricity

                                                                                                                                                                        Average output (MW)
imports from Victoria (Section 1.6).                                                                                                                                                          2,000
Contributors to GPG’s rebound included:
                                                                                                                                                                                              1,500
• High NEM spot prices resulting from periods of high
  demand coinciding with coal generator outages.
                                                                                                                                                                                              1,000
  −                    Participants with both coal and gas-powered
                       generators in their portfolio increased output at
                       their gas-powered generators during coal outages.                                                                                                                            500
                       For example, EnergyAustralia ran Newport during
                       Yallourn outages and AGL ran Somerton more
                                                                                                                                                                                                      0
                       during Loy Yang A outages.
                                                                                                                                                                                                                            Q1                         Q2                         Q3                          Q4                   Q1
• Comparatively low hydro output due to dry conditions.
  GPG and hydro generation typically play a peaking-                                                                                                                                                                                                              2018                                                             2019
  generation role in the NEM, providing flexible capacity
  and generating at comparatively higher levels during                                                                                                                                                                                 QLD                   NSW                         VIC             SA                TAS
  peak periods.
These factors also necessitated an increased peaking role for GPG, which was particularly evident during January 2019:
• Six of the NEM’s top 20 NEM GPG days occurred in January 2019 (Figure 19).
• 25 January 2019 was:
  −                    The third highest NEM GPG day on record.
  −                    The highest Victorian GPG day on record (23% higher than the next highest day).
  −                    The sixth highest South Australian GPG day on record.
• 24 January 2019 was:
  −                    The twelfth highest NEM GPG day on record.
  −                    The second highest Victorian GPG day on record.
  −                    Third highest South Australian GPG day on record.
Figure 19 Top 20 NEM GPG days (by average output)

                             6000

                             5000
   Average generation (MW)

                             4000
                                                                                                                                                                                                                                                                                                                                        TAS
                             3000
                                                                                                                                                                                                                                                                                                                                        SA
                             2000                                                                                                                                                                                                                                                                                                       VIC
                                                                                                                                                                                                                                                                                                                                        NSW
                             1000
                                                                                                                                                                                                                                                                                                                                        QLD
                                0
                                                                                                                      17 Jan 2014

                                                                                                                                                                                       4 Feb 2011
                                                                25 Jan 2019

                                                                                            1 Feb 2011

                                                                                                                                                                                                                                 29 Jan 2019

                                                                                                                                                                                                                                               30 Jan 2019

                                                                                                                                                                                                                                                                                                        4 Jan 2013
                                                                                                         2 Feb 2011

                                                                                                                                    3 Feb 2011

                                                                                                                                                 10 Feb 2017

                                                                                                                                                               9 Feb 2017

                                                                                                                                                                                                                   14 Jan 2014
                                    16 Jan 2014

                                                                              15 Jan 2014
                                                  31 Jan 2011

                                                                                                                                                                                                                                                             16 Jan 2019

                                                                                                                                                                                                                                                                                          15 Jan 2019
                                                                                                                                                                                                     24 Jan 2019

                                                                                                                                                                                                                                                                           29 Jan 2009

                                                                                                                                                                                                                                                                                                                     20 Mar 2017

© AEMO 2019 | Quarterly Energy Dynamics - Q1 2019                                                                                                                                                                                                                                                                                             15
Quarterly Energy Dynamics – Q1 2019

1.4.5                       Storage
The amount of charging or pumping by energy storage facilities in the NEM during Q1 2019 was 245 GWh, approximately 204 GWh
higher than in Q1 2018 (Figure 2018). The increase was driven by increased pumping from Tumut 3, Wivenhoe, and Shoalhaven,
coinciding with dry conditions, low dam storage levels, and relatively high spot electricity prices during peak periods. The
contribution from batteries remained relatively stable relative to the prior quarter.

Batteries recorded park spreads 19 of approximately $21/MWh, a slight increase over the prior quarter (Figure 21 20 ).
The composition of spot revenues for batteries changed over the quarter with:

• A greater contribution from energy revenues driven by high and volatile prices in South Australia and Victoria.
• Offset by reduced FCAS revenues, driven by lower FCAS prices with the commencement of participation in FCAS markets from
  newer battery installations.
Park spreads for the pumped hydro facilities were at $1/MWh, increasing slightly over the quarter21.

     Figure 20 Quarterly charging/pumping in the NEM                                    Figure 21 Revenue sources by storage technology

                           300                                                                                            50

                                                                                             Arbitrage Value ($ / MWh)
                                                                                                                          40
          Charging (GWh)

                                                                                                                          30
                           200                                                                                            20
                                                                                                                          10
                           100                                                                                             0
                                                                                                                         -10
                                                                                                                                 Q4-17
                                                                                                                                         Q1-18
                                                                                                                                                 Q2-18
                                                                                                                                                         Q3-18
                                                                                                                                                                 Q4-18
                                                                                                                                                                         Q1-19
                                                                                                                                                                                 Q4-17
                                                                                                                                                                                         Q1-18
                                                                                                                                                                                                 Q2-18
                                                                                                                                                                                                         Q3-18
                                                                                                                                                                                                                 Q4-18
                                                                                                                                                                                                                         Q1-19
                             0
                                     Q1 Q2 Q3 Q4 Q1 Q2 Q3 Q4 Q1
                                                                                                                                         Pumped Hydro                                            Batteries
                                         2017                   2018         2019
                    Wivenhoe                    Shoalhaven             Tumut 3                                                   Energy                                              Regulation FCAS
                    HPR                         EA batteries           Dalrymple                                                 Contingency FCAS                                    Energy Cost

Dispatch patterns for storage in Q1 2019 have also changed relative to Q1 2018. In addition to a higher amount of charging and
discharging, both pumped hydro and batteries increased charging/pumping during the middle of the day, especially during the
solar noon (Figure 22 and Figure 23). Batteries also discharged more on average during the morning (around 0600-0700 hrs), with
pumped hydro increasing generation during the evening peak.

     Figure 22 Pumped Hydro - Intraday dispatch20                                       Figure 23 Batteries - Intraday dispatch

                            200                                                                                             15                                     Q1 18                          Q1 19
                                                  Q1 18           Q1 19
                            150                                                                                             10
       or Discharge (MW)

                                                                                         or Discharge (MW)
        Average Charge

                                                                                                                             5
                                                                                          Average Charge

                            100
                                                                                                                             0
                             50
                                                                                                                            -5
                                 0
                                                                                                                           -10
                            -50
                                                                                                                           -15
                           -100                                                                                            -20
                           -150                                                                                            -25
                           -200                                                                                            -30

                                                       Time                                                                                                              Time

18
     The EA batteries refer to the Gannawarra and Ballarat Battery Energy Storage Systems that are contracted to Energy Australia, who holds the rights to charge and
     dispatch energy from the battery storage systems into the National Electricity Market until 2030 and 2033 respectively. Further information available [here]
19
     Storage arbitrage value is calculated as the estimated average spot value of energy and ancillary services (spot price x energy charged/discharged) over the period
     relative to the amount of charging capacity in the NEM. The ‘park spread’ is calculated as the difference between (i) estimated spot revenues of energy discharge
     and ancillary services enabled (i.e. the price of energy or FCAS x the MWh dispatched or enabled for the period) and (ii) the estimated energy costs of charging (i.e.
     the price of energy multipled by the MWh purchased for the period). The ‘park spread’ is measured as a proportion of the charging capacity (in MW) of storage
     facilities in service in the NEM.
20
     The calculation of storage arbitrage value for pumped hydro excludes Tumut 3 facility as its sources of water include both pumped water from Jounama Pondage
     and inflows from Tumut 1 and Tumut 2 underground power stations and into Talbingo Reservoir. Further information available [here].
21
     Storage operating within a portfolio and/or with forward contracts face different incentives for capturing spot electricity revenue than storage operating purely
     under an energy arbitrage model.

© AEMO 2019 | Quarterly Energy Dynamics - Q1 2019                                                                                                                                                                                16
Quarterly Energy Dynamics – Q1 2019

1.4.6                            NEM emissions
The large increase in renewable output compared to Q1 2018, coupled with reduced coal-fired generation led to Q1 2019 being
the lowest Q1 for NEM emissions on record (Figure 24). Total emissions were 2.77 MtCO2-e lower than in Q1 2018 and the grid
average emissions intensity of 0.77 tCO2-e/MWh represents the lowest quarterly average emissions intensity on record.
Figure 24 Quarterly NEM emissions and emissions intensity (Q1s)

                            50                                                                                                1.0
      Emissions (MtCO2-e)

                            40                                                                                                0.8

                                                                                                                                    Emissions Intensity
                                                                                                                                     (tCO2-e/MWh)
                            30                                                                                                0.6

                            20                                                                                                0.4

                            10                                                                                                0.2

                             0                                                                                                0.0
                                    2011   2012   2013    2014        2015     2016       2017          2018      2019

                                                          Emissions          Emission intensity

1.5                               Other NEM-related markets
1.5.1                            Electricity futures markets
The price of calendar year (Cal) 2020 electricity swap contracts traded on Table 3                        Change over Q1 2019 for
the ASX rose in all regions over Q1 2019 (Figure 25). This included                                       Cal 2020 and Cal 2021 swap prices
increases of between 12-23% for calendar year Cal 2020 swap products
and 13-21% for Cal 2021 swap products over the quarter (Table 3).            Region                                Cal 20                                   Cal 21
Approximately 90% of this increase has occurred in the underlying
energy pricing component (prices
Quarterly Energy Dynamics – Q1 2019

     Figure 25 ASX energy – Calendar year 2020 swap prices by region

                                     100
                                                      QLD              NSW            VIC        SA
                                     90
                  Price ($/MWh)

                                     80

                                     70

                                     60

                                     50
                                                           Oct-18

                                                                             Nov-18

                                                                                                                                           Mar-19
                                           Sep-18

                                                                                              Dec-18

                                                                                                                            Feb-19
                                                                                                            Jan-19
1.5.2                                International coal prices
The average Q1 2019 spot price for high quality Australian Newcastle thermal coal (6000 kcal) was 7% lower than in Q4 2018,
averaging $134/tonne (AUD). The decreasing price of premium coal was matched by the price of lower quality coal (5500 kcal),
which reduced by 4% over the quarter. These changes were driven by a reduction in Chinese demand, resulting from recovering
domestic production and changes to import policies23. While weakening somewhat, ongoing underlying demand continued to be
reflected in the forward market, where coal futures prices remained above $120/tonne for 2019 and 202024.
As illustrated in Figure 26, despite the reduction in international coal prices, there was a small increase in the price of offers from
black coal-fired generators in New South Wales compared to recent quarters. This suggests that increasing black coal offers were
not a direct result of higher input costs due to the procurement of incremental coal but more likely due to coal conservation
and/or quality issues (see Section 1.4.2).
While much of Australia’s coal fleet remain on legacy fuel contracts, any requirement for incremental coal (for example, due to
contract expiration or to support increased production) could expose a coal-fired generator to prices linked to the Newcastle spot
price.

Figure 26 Quarterly average international black coal spot, futures and contract prices

                                                                                                                                                                  80

                                                                                                                                                                       NSW black coal VWAP bids
      Newcastle thermal coal price

                                                                                                                                                                  70
                                     140
                                                                                                                                                                  60
         (AUD/metric tonne)

                                                                                                                                                                  50          ($/MWh)
                                     100                                                                                                                          40
                                                                                                                                        Growing separation
                                                                                                                                        between price of NSW      30
                                      60                                                                                                black coal bids and low   20
                                                                                                                                        quality coal              10
                                      20                                                                                                                          0
                                                Q1 Q2 Q3 Q4 Q1 Q2 Q3 Q4 Q1 Q2 Q3 Q4 Q1 Q2 Q3 Q4 Q1 Q2 Q3 Q4 Q1 Q2 Q3 Q4

                                                    2015                   2016                  2017                2018              2019              2020

                                                                    5500               6000             6000 futures                 NSW black coal offers*

Source for Newcastle thermal spot and futures prices: Bloomberg
*Black coal offers are the volume weighted average price of NSW black coal generators priced between $20-$120/MWh.

23
     Department of Industry. 2019. Resources and Energy Quarterly. ONLINE. Available at:
     https://publications.industry.gov.au/publications/resourcesandenergyquarterlymarch2019/documents/Resources-and-Energy-Quarterly-March-2019-Thermal-
     Coal.pdf. Accessed 11 April 2019.
24
     Assuming the exchange rate at the end of Q1 2019 remains constant – AUD/USD: 0.7087

© AEMO 2019 | Quarterly Energy Dynamics - Q1 2019                                                                                                                                                 18
Quarterly Energy Dynamics – Q1 2019

1.5.3             Environmental Markets
The Large-scale Generation Certificate (LGC) spot price decreased by 30% to just over $33/certificate in Q1 2019 (Figure 27, Table
4). The LGC spot price has now fallen $53/certificate (-61%) since the beginning of 2018. Prices in the forward market were also
lower, with Calendar Year 20 prices reducing to just over $20/certificate.
As with the price reductions in Q4 2018, changes likely reflect:

• A growing supply of LGCs as new renewable generation commences (Section 1.4.1).
• The use of shortfall provisions provided under the Large-scale Renewable Energy Target (LRET) impacting demand for LGCs. 25
  In February the CER published the results of the 2018 LRET certificate surrender, announcing that there was a total shortfall of
  3.9 million LGCs (approximately 14% of total liability).26
• Repeated communication from the Clean Energy Regulator (CER) that the 2020 LRET will be met.27
Small-scale Technology Certificate (STC) prices finished the quarter at $36.68/certificate, with prices steady despite the setting of
the small-scale technology percentage at a record high of 21.73%.28 The lack of downward pressure on price associated with the
high STP reflects a large existing supply of STCs and high expected rooftop PV installations over 2019.29
     Figure 27 LGC spot and forward prices over Q1 2019                                                                 Table 4       LGC prices

                                                                                                                          Product       Change over Q1 19
                  50
                                                Spot             Cal 19              Cal 20             Cal 21
                                                                                                                            Spot             $14.5 (30%)

                                                                                                                           Cal 19            $7.45 (18%)
                  40

                                                                                                                           Cal 20            $1.65 (7%)
        $ / LGC

                                                                                                                           Cal 21            $2.25 (14%)
                  30

                  20

                  10
                       Jan-19                    Feb-19                        Mar-19

     Source: Mercari

25
     CER. 2019. Surrender of large-scale renewable energy certificates and payment of shortfall charges. ONLINE. Available:
     http://www.cleanenergyregulator.gov.au/RET/Scheme-participants-and-industry/Renewable-Energy-Target-liable-entities/Refunds-of-large-scale-generation-
     shortfall-charges#Surrender-of-largescale-renewable-energy-certificates-and-payment-of-shortfall-charges. Accessed 10 April 2019.
26
     CER 2019. Certificate shortfall register. ONLINE. Available:
     http://www.cleanenergyregulator.gov.au/RET/Pages/Scheme%20participants%20and%20industry/Renewable%20Energy%20Target%20liable%20entities/Scheme%
     20compliance/Certificate-shortfall-register.aspx. Accessed 10 April 2019.
27
     CER 2019. The 2018 Renewable Energy Target Annual Statement – Progress towards the 2020 target. ONLINE. Available:
     http://www.cleanenergyregulator.gov.au/About/Pages/Accountability%20and%20reporting/Administrative%20Reports/The-2018-Renewable-Energy-Target-
     Annual-Statement-%E2%80%93-Progress-towards-the-2020-target.aspx. Accessed 10 April 2019.
28
     CER 2019. 2019 RPP and STP set. ONLINE. Available:
     http://www.cleanenergyregulator.gov.au/RET/Pages/News%20and%20updates/NewsItem.aspx?ListId=19b4efbb-6f5d-4637-94c4-121c1f96fcfe&ItemId=622.
     Accessed 10 April 2019.
29
     CER 2019. Small-scale technology percentage modelling report. ONLINE. Available: http://www.cleanenergyregulator.gov.au/RET/Scheme-participants-and-
     industry/the-small-scale-technology-percentage/small-scale-technology-percentage-modelling-reports. Accessed 11 April 2019.

© AEMO 2019 | Quarterly Energy Dynamics - Q1 2019                                                                                                             19
Quarterly Energy Dynamics – Q1 2019

1.5.4          Frequency control ancillary services
In Q1 2019, frequency control ancillary services (FCAS) costs were $36.5 million30, representing an $18 million (-33%) reduction on
Q4 2018 levels (Figure 28). By market:

• Contingency Raise – most of the cost reductions occurred in these markets, down $15.4 million (-46%) compared to Q4 2018.
• Regulation FCAS costs reduced by $2.3 million.
• Contingency Lower costs remained at comparatively low levels.
Drivers of reduced costs included:
• Increased supply from:
     −    Batteries – over the quarter, batteries increased their share of the Raise FCAS markets from 10% in Q4 2018 to 17% in Q1
          2019 (Figure 29). Hornsdale Power Reserve’s share of the market has remained relatively stable, with increased FCAS
          provision coming from: Dalrymple North BESS (5% of Raise FCAS) and Ballarat BESS (3% of Raise FCAS). This additional
          supply displaced higher-priced supply from other technologies, largely coal.
     −    Hydro – in addition to new supply from the two batteries, there was also a reduction in the price of offers (or return to the
          market) from some existing hydro providers, resulting in increased dispatch. For example, Wivenhoe Power Station returned
          to the Raise 5min FCAS market, offering approximately 150 MW more at prices below $10/MWh than in Q4 2018.
• Reduced demand – compared to Q4 2018 there were reductions in demand across the Contingency Raise and Regulation FCAS
  markets:
     −    Contingency Raise FCAS demand reduced by 7%, which was largely a function of increased average electricity demand.
     −    Regulation FCAS demand decreased by approximately 10% following a trial period31 of increased Regulation FCAS in Q4
          2018. However, on 22 March, to ensure ongoing compliance with the requirements of the Frequency Operating Standards,
          AEMO increased the Regulation FCAS across the mainland regions by 50 MW. This took the minimum quantities procured
          to 180 MW of Raise Regulation and 170 MW of Lower Regulation32.

     Figure 28 Quarterly FCAS costs by service                                       Figure 29 FCAS supply mix

              80                                                                                                50%

              70                                                                                                45%
                                                                                                                40%
              60
                                                                                         Percentage of supply

                                                                                                                35%
              50
                                                                                                                30%
              40
         $M

                                                                                                                25%
              30
                                                                                                                20%
              20                                                                                                15%
              10                                                                                                10%

               0                                                                                                5%
                        Q1          Q2          Q3           Q4         Q1                                      0%
                                         2018                         2019                                            Batteries   Coal       DR       Gas   Hydro

                        R6SEC            R60SEC         R5MIN         RREG                                                  Q1 18        Q4 18    Q1 19

                        L6SEC            L60SEC         L5MIN         LREG

30
     Represents preliminary data and subject to minor revisions.
31
     The trial was intended to: 1. Determine the impact of revised regulation FCAS market volumes for managing frequency performance and arresting the current
     degrading trend; 2. Inform recommendations for optimal management of regulation FCAS and time error. See: http://aemo.com.au/Market-
     Notices?searchString=64715
32
     At the time of publication, AEMO will review power system frequency performance every four weeks, and decide whether to further increase or hold the amount of
     regulation FCAS procured. AEMO's decision will take into account whether frequency has remained in the NOFB for at least 99.5% of the time over the previous
     four weeks, together with any other relevant factors.

© AEMO 2019 | Quarterly Energy Dynamics - Q1 2019                                                                                                                   20
Quarterly Energy Dynamics – Q1 2019

1.6                            Inter-regional transfers
Total inter-regional transfers during the quarter increased by 5% compared to Q4 2018, but were 7% lower than in Q1 2018 (Figure
30).

Victoria to New South Wales Interconnector
During the quarter, the prevailing flow on the interconnector was 52 MW north on average, representing a 203 MW swing
compared to Q1 2018. Notably, this change in transfers occurred despite record spot electricity prices in Victoria. Higher prices in
Victoria would typically result in net flows south on the interconnector. However, despite a nominal southerly transfer limit of
1,350 MW, the average limit for flows south during the quarter was less than 300 MW (Figure 31). This contributed to:

• The VIC-NSW interconnector binding at its limits for 32% of the quarter.
• Around $16/MWh to the price spread between Victoria and New South Wales (the remaining $51/MWh of price spread was
  during pricing volatility).
The primary driver of restricted transfers south on the VIC-NSW interconnector was changes in Snowy Hydro’s generation patterns
resulting from dry conditions. Flows south on the interconnector were limited by the N^^V_NIL_1 constraint33, which bound more
for 25% of the time in Q1 2019 (compared to 14% of the time in 2018). The constraint is largely a function of Snowy Hydro’s
dispatch decisions. It is mainly eased by generation from Upper Tumut (and then Lower Tumut and Uranquinty), and is exacerbated
by generation at Murray in Victoria. A 78% drop in generation from Tumut and comparatively higher Murray output compared to
Q1 2018 contributed to limited flows south on the interconnector.

Other interconnectors34
• Tasmania to Victoria (Basslink) – reduced hydro output due to dry conditions resulted in a prevailing flow south on Basslink
  (202 MW south on average), representing an 92% increase on Q1 2018 levels. This contributed to higher Victorian electricity
  spot prices over the quarter when compared to Q1 2018.
• Victoria to South Australia – total quarterly inter-regional transfers were comparable to previous quarters, and remained evenly
  balanced on a directional basis, with net average flows of 13 MW into Victoria. This contributed price convergence between the
  two regions: Victoria and South Australia’s prices were set by a common marginal unit for more than 90% of the quarter.
• New South Wales to Queensland – inter-regional transfer was almost exclusively south at net 468 MW on average, consistent
  with Q1 2018 results.
     Figure 30 Quarterly inter-regional transfers                                   Figure 31 Limits on the VIC-NSW interconnector – Q1 2019

                            300                                                             1,600
                                                                                                                           Nominal capacity
                            200                                                             1,400

                             100                                                            1,200
       Average flows (MW)

                                                                                            1,000
                              0
                                                                                       MW

                                                                                             800
                            -100
                                                                                             600
                            -200
                                                       Net Flows                             400
                            -300
                                                       Q1 18                                 200
                            -400
                                                       Q4 18                                    0
                            -500
                                                       Q1 19                                              South            North              South   North
                            -600
                                                                                                      Transfers when binding at Average interconnectors
                                                         SA

                                                                        TAS
                                             -

                                                          -

                                                                          -
                                          NSW
                                           VIC

                                                        VIC

                                                                        VIC
                                      -
                                   NSW
                                   QLD

                                                                                                                 limit                   limits

     Positive transfers are denoted for: New South Wales transfers into
     Queensland; Victorian transfers into New South Wales and South
     Australia; Tasmanian transfers into Victoria.

33
     To avoid collapse for loss of the largest Victorian generating unit.
34
     For simplicity, where there are multiple interconnectors between two regions results for these interconnectors are taken in aggregate.

© AEMO 2019 | Quarterly Energy Dynamics - Q1 2019                                                                                                             21
Quarterly Energy Dynamics – Q1 2019

1.6.1                            Inter-regional settlement residue
With an increase in inter-regional price separation and
                                                                                                                              Figure 32 Quarterly positive IRSR value
inter-regional transfers, there was a resulting 129% increase in
inter-regional settlement residue 35 (IRSR) for the quarter
                                                                                                                                             140
compared to Q4 2018 (Figure 32). IRSR value totalled $54 million
– the highest since Q1 2017 36 , where combined IRSR was                                                                                     120                     IRSR value for just VIC-SA in
$131.4 million (Figure 32). Key outcomes for IRSR in Q1 2019                                                                                                         Q1 2017 almost more than
compared to recent quarters included:                                                                                                        100                     collective Q1 2019 values

• NSW-VIC – the return of price volatility in Victoria led to                                                                                     80

                                                                                                                                     $M
  comparatively high IRSR value for flows from New South Wales
  into Victoria. The IRSR value for these flows was $19.7 million                                                                                 60
  or 36% of total IRSR value for the quarter. However, restricted
                                                                                                                                                  40
  flows south on the interconnector – particularly during high
  Victorian spot prices – somewhat diminished the value of these                                                                                  20
  units (relative to a situation with higher flows).
                                                                                                                                                   0
• QLD-NSW – with Queensland the lowest priced NEM region,
  flows remained predominantly into New South Wales, resulting                                                                                             Q1 Q2 Q3 Q4 Q1 Q2 Q3 Q4 Q1
  in IRSR value of $21.9 million. There were low transfers from
                                                                                                                                                                     2017                                   2018               2019
  New South Wales (and low price spread during these flows),
  resulting in minimal value for IRSR associated with these                                                                                            NSW-QLD                     QLD-NSW                  NSW-VIC
  transfers.
                                                                                                                                                       VIC-NSW                     SA-VIC                   VIC-SA
• VIC-SA – Price separation between Victoria and South Australia
  has been relatively small in recent quarters, leading to
  comparatively low value for accumulated residues between the two regions.
There were mixed results on returns for units purchased at settlement residue auctions. By directional interconnector, there were
positive returns for flows from Queensland to New South Wales, New South Wales to Victoria, and South Australia to Victoria.
Large negative returns were recorded for SRA units for flows from Victoria to South Australia, and New South Wales to Queensland,
particularly for units purchased prior to closure of Hazelwood Power Station in March 201737. In general, the price paid for SRA
units and their actual value converged the closer they were purchased to Q1 2019 (that is, units purchased at the March 2019
auction were closer to the actual value than units purchased in 2016 and 2017 auctions).

Figure 33 SRA tranche analysis – price paid for units versus actual value (Q1 2019)

                                50,000

                                                                                                                                                                                        Large losses
                                40,000
      Unit price or value ($)

                                30,000
                                                                           Large losses

                                20,000

                                10,000                                                                           Large returns

                                    -
                                                 Q1 17

                                                                 Q4 18

                                                                                                 Q4 18

                                                                                                                  Q1 17

                                                                                                                                  Q4 18

                                                                                                                                                                   Q4 18

                                                                                                                                                                                    Q1 17

                                                                                                                                                                                                    Q4 18

                                                                                                                                                                                                                                    Q4 18
                                         Q1 16

                                                         Q1 18

                                                                         Q1 16

                                                                                 Q1 17

                                                                                         Q1 18

                                                                                                         Q1 16

                                                                                                                          Q1 18

                                                                                                                                          Q1 16

                                                                                                                                                   Q1 17

                                                                                                                                                           Q1 18

                                                                                                                                                                           Q1 16

                                                                                                                                                                                            Q1 18

                                                                                                                                                                                                            Q1 16

                                                                                                                                                                                                                    Q1 17

                                                                                                                                                                                                                            Q1 18

                                                 QLDNSW                          NSWQLD                           NSWVIC                           VICNSW                           VICSA                           SAVIC

                                                                                 Tranche unit clearing price                                       Residue per unit

35
     For further details on IRSR see: AEMO. 2018, Guide to the Settlements Residue Auction. ONLINE. Available at:
     www.aemo.com.au/-/media/Files/Electricity/NEM/Settlements_and_Payments/Settlements/2018/Guide-to-the-Settlements-Residue-Auction.pdf. Accessed 15
     January 2019.
36
     The major difference between the two periods is the status of Hazelwood power station. While Hazelwood was in service, Victoria operated as a net exporter of
     energy (and predominantly at cheaper prices than neighbouring regions).
37
     Noting that SRA units may be used in a broad portfolio of risk management products, so SRA unit losses may be made up by gains from other futures products

© AEMO 2019 | Quarterly Energy Dynamics - Q1 2019                                                                                                                                                                                           22
You can also read