Magnesium-Free Immobilization of DNA Origami Nanostructures at Mica Surfaces for Atomic Force Microscopy - MDPI
←
→
Page content transcription
If your browser does not render page correctly, please read the page content below
molecules
Article
Magnesium-Free Immobilization of DNA Origami
Nanostructures at Mica Surfaces for Atomic Force Microscopy
Yang Xin, Amir Ardalan Zargariantabrizi, Guido Grundmeier and Adrian Keller *

                                          Technical and Macromolecular Chemistry, Paderborn University, Warburger Str. 100, 33098 Paderborn, Germany;
                                          yangxin@mail.uni-paderborn.de (Y.X.); ardalan@mail.uni-paderborn.de (A.A.Z.);
                                          g.grundmeier@tc.uni-paderborn.de (G.G.)
                                          * Correspondence: adrian.keller@uni-paderborn.de

                                          Abstract: DNA origami nanostructures (DONs) are promising substrates for the single-molecule
                                          investigation of biomolecular reactions and dynamics by in situ atomic force microscopy (AFM).
                                          For this, they are typically immobilized on mica substrates by adding millimolar concentrations of
                                          Mg2+ ions to the sample solution, which enable the adsorption of the negatively charged DONs at
                                          the like-charged mica surface. These non-physiological Mg2+ concentrations, however, present a
                                          serious limitation in such experiments as they may interfere with the reactions and processes under
                                          investigation. Therefore, we here evaluate three approaches to efficiently immobilize DONs at mica
                                          surfaces under essentially Mg2+ -free conditions. These approaches rely on the pre-adsorption of
                                          different multivalent cations, i.e., Ni2+ , poly-L-lysine (PLL), and spermidine (Spdn). DON adsorption
                                          is studied in phosphate-buffered saline (PBS) and pure water. In general, Ni2+ shows the worst
                                          performance with heavily deformed DONs. For 2D DON triangles, adsorption at PLL- and in

                                   particular Spdn-modified mica may outperform even Mg2+ -mediated adsorption in terms of surface
Citation: Xin, Y.; Zargariantabrizi,      coverage, depending on the employed solution. For 3D six-helix bundles, less pronounced differences
A.A.; Grundmeier, G.; Keller, A.          between the individual strategies are observed. Our results provide some general guidance for the
Magnesium-Free Immobilization of          immobilization of DONs at mica surfaces under Mg2+ -free conditions and may aid future in situ
DNA Origami Nanostructures at             AFM studies.
Mica Surfaces for Atomic Force
Microscopy. Molecules 2021, 26, 4798.     Keywords: DNA origami; DNA nanotechnology; adsorption; mica; atomic force microscopy
https://doi.org/10.3390/
molecules26164798

Academic Editor: Alexander Kotlyar        1. Introduction
                                               Introduced 15 years ago, DNA origami technology [1,2] has evolved into a popular
Received: 13 July 2021
Accepted: 4 August 2021
                                          nanofabrication method that nowadays is almost routinely employed in numerous areas
Published: 7 August 2021
                                          of biomedical research [3,4], single-molecule biochemistry [5–7] and biophysics [8,9], bio-
                                          analytics and biosensing [10,11], and synthetic biology [12,13], among others. It relies on
Publisher’s Note: MDPI stays neutral
                                          the controlled folding of a long single-stranded DNA scaffold into a user-defined 2D or
with regard to jurisdictional claims in
                                          3D nanoscale shape upon hybridization with a large set of short oligonucleotides called
published maps and institutional affil-   staple strands. The shape of the resulting DNA origami nanostructures (DONs) is fully
iations.                                  determined by the sequences of the staple strands and can thus be tailored with molecular
                                          accuracy to meet the criteria of the desired application. By conjugating chemical moieties
                                          to selected staple strands, this technique furthermore enables the controlled arrangement
                                          of functional molecules with sub-nanometer precision [14–16]. Preserving the designed
Copyright: © 2021 by the authors.
                                          shape of the DONs and thereby the displayed molecular arrangements under relevant
Licensee MDPI, Basel, Switzerland.
                                          environmental conditions is thus an essential issue for many applications [17].
This article is an open access article
                                               An important parameter in this regard is the concentration of divalent cations and
distributed under the terms and           particularly Mg2+ . During DON assembly, millimolar concentrations of Mg2+ are required
conditions of the Creative Commons        in order to screen the electrostatic repulsion of the negatively charged DNA strands and
Attribution (CC BY) license (https://     thereby facilitate their compaction into the small volume of the DON. However, such
creativecommons.org/licenses/by/          comparatively high Mg2+ concentrations are incompatible with numerous applications. For
4.0/).                                    instance, Mg2+ ions have been shown to affect drug loading [18,19], mineralization [20,21],

Molecules 2021, 26, 4798. https://doi.org/10.3390/molecules26164798                                      https://www.mdpi.com/journal/molecules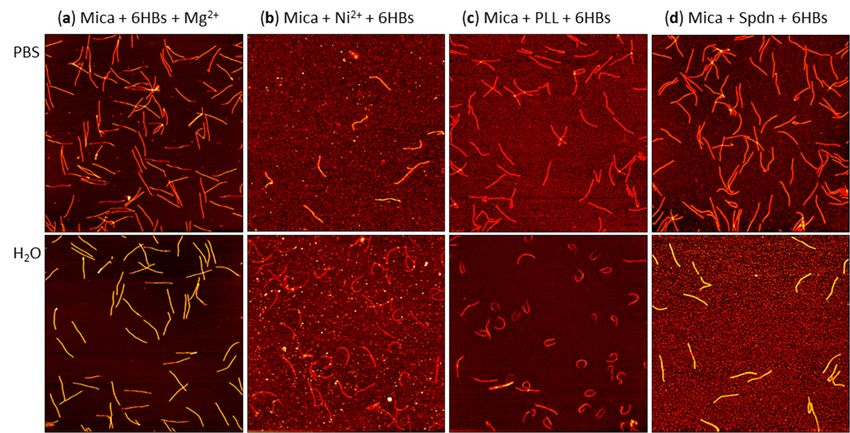
Molecules 2021, 26, 4798                                                                                            2 of 16

                           and conformational switching and actuation [22,23] of DONs. Fortunately, the synthesized
                           DONs can be transferred post-assembly into appropriate Mg2+ -free solutions such as
                           phosphate-buffered saline (PBS), Tris buffer, or pure water simply by spin filtering [24].
                           DON stability in such solutions is maintained by residual Mg2+ ions from the folding buffer
                           that remain bound to the DNA’s backbone phosphates upon buffer exchange. This enables
                           the application of DONs in solutions with Mg2+ concentrations down to the low-µM
                           range [24].
                                However, Mg2+ ions serve also another purpose; they facilitate the adsorption of
                           the highly negatively charged DONs at like-charged surfaces such as mica and silicon
                           oxide (see Figure 1a). This is of particular importance in atomic force microscopy (AFM)
                           investigations [5,7], which require ultra-flat substrate surfaces. In such settings, an insuffi-
                           cient Mg2+ concentration will result in either high mobility of the adsorbed DONs, which
                           makes them susceptible to post-adsorption manipulation [25,26], or the retardation [27]
                           or even complete suppression [28] of DON adsorption. To avoid these issues, previous
                           studies have mixed the Mg2+ -free samples with Mg2+ -containing solutions right before
                           immobilization on mica [24,29,30]. While this approach has proven useful for evaluating
                           the structural integrity of the DONs after exposure to denaturing environments [24,29]
                           or ionizing radiation [30], it is incompatible with the in situ investigation of biomolecular
                           processes such as protein binding [31,32], enzymatic reactions [33,34], or conformational
                           dynamics [35,36] under essentially Mg2+ -free conditions. In this work, we thus explore
                           alternative means for immobilizing DONs at mica surfaces that do not rely on the addi-
                           tion of Mg2+ ions to the DON-containing solution (see Figure 1b–d). For this, 2D DNA
                           origami triangles (DOTs) are synthesized in Mg2+ -containing TAE buffer and subsequently
                           transferred into either PBS or H2 O [24]. PBS is as a well-established buffer mimicking
                           physiological pH and ionic strength, while H2 O was chosen as an ion-free solution, which
                           does not screen any electrostatic interactions. The DOTs are then immobilized from these
                           solutions at mica surfaces with pre-adsorbed Ni2+ ions (Figure 1b), poly-L-lysine (PLL,
                           Figure 1c), and spermidine (Spdn, Figure 1d), respectively. The efficiency of DOT adsorp-
                           tion under these conditions and possible effects on the structural integrity of the DOTs are
                           quantified by AFM in the dry state after sample washing and compared to the standard
                           method of Mg2+ -mediated adsorption (Figure 1a). In PBS, we find that DOT adsorption at
                           PLL- and in particular Spdn-modified mica is superior to Ni2+ - and even Mg2+ -mediated
                           adsorption in terms of surface coverage. In pure H2 O, on the other hand, the situation is
                           markedly different with all three pre-adsorption-based strategies proving inferior to Mg2+
                           addition. Here, PLL performs slightly better than Spdn, with the latter resulting in severe
                           AFM imaging artefacts. For both Mg2+ -free solutions, however, the Ni2+ -modified mica
                           surface shows the worst performance, resulting in heavily deformed DOTs. Interestingly,
                           the behavior of tube-like six-helix bundles (6HBs) differed in some regards from that of
                           the DOTs and showed less dramatic differences between the evaluated techniques. This
                           is probably related to the smaller contact area between DON and surface. Our results
                           thus clearly demonstrate the great potential of polyelectrolyte-coated mica to serve as a
                           substrate in DON-based AFM studies under essentially Mg2+ -free conditions.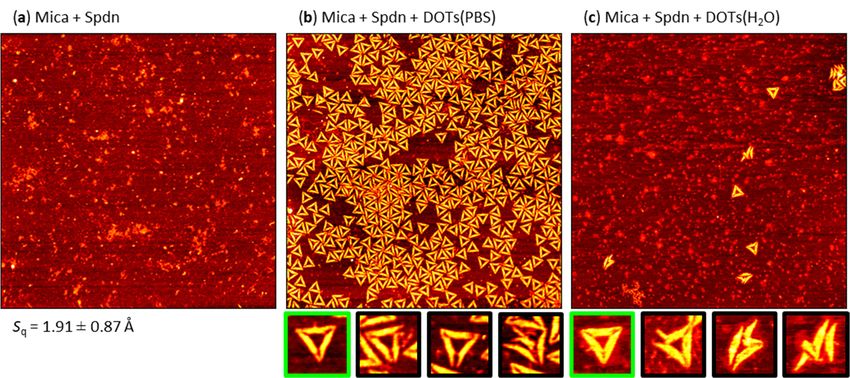
Molecules 2021, 26, 4798 3 of 16
Molecules 2021, 26, x FOR PEER REVIEW 3 of 15
Figure1.1.Schematic
Figure Schematicrepresentations
representations(not
(nottotoscale)
scale)of
ofthe
thedifferent
differentDON
DONadsorption
adsorptionstrategies
strategiesevalu-
evalu-
2+ ions to the DON sample. (b) Pre-adsorption of Ni2+ ions. (c)
ated in this work. (a) Addition of Mg2+
ated in this work. (a) Addition of Mg ions to the DON sample. (b) Pre-adsorption of Ni2+ ions.
Pre-adsorption of poly-L-lysine (PLL). (d) Pre-adsorption of spermidine (Spdn). The backbone of
(c) Pre-adsorption of poly-L-lysine (PLL). (d) Pre-adsorption of spermidine (Spdn). The backbone of
double-stranded (ds) DNA is represented by cyan and magenta spheres.
double-stranded (ds) DNA is represented by cyan and magenta spheres.
2.2.Results
Resultsand
andDiscussion
Discussion
2.1.Mg
2.1. Mg2+
2+-Mediated Adsorption
-Mediated Adsorption
Inorder
In ordertotoestablish
establishaabenchmark,
benchmark,we wefirst
firstevaluated
evaluatedthe theefficiency
efficiencyofofMg Mg2+2+ -mediated
-mediated
DOT adsorption at freshly cleaved mica surfaces. A representative AFM image of aafreshly
DOT adsorption at freshly cleaved mica surfaces. A representative AFM image of freshly
cleavedmica
cleaved micasurface
surfaceis is shown
shown in in Figure
Figure 2a.2a.
TheThe root-mean-square
root-mean-square (RMS) (RMS) surface
surface rough-
roughness
Sness
q of S
theq of the
freshly freshly
cleaved cleaved
mica mica
surface surface
was was
only only
about about
0.45 Å. 0.45
Note Å. Note
that that
this this
very lowvery low
value
is mostly determined by scanning noise. Adsorption of the DOTs in PBS (pH 7.4) and H27.4)
value is mostly determined by scanning noise. Adsorption of the DOTs in PBS (pH O
and7.0)
(pH H2O at (pH 7.0) at this
this surface was surface
enabledwas enabled
by mixing thebyMg mixing
2+ -freethe Mg2+solutions
sample -free sample solutions
immediately
immediately
before before immobilization
immobilization with folding buffer, withi.e.,
folding
10 mM buffer,
MgCli.e.,
2 in 10
1 ×mM TAE. MgCl in 1×TAE.
For 2both solutions,For
both
this solutions,
resulted this resulted
in similarly sizeablein similarly sizeable(see
DOT adsorption DOT adsorption
Figure 2b,c) with (see
anFigure
average 2b,c) with
surface
an average
coverage surface
of about 15coverage
adsorbedofDOTs aboutper 15 µm 2.
adsorbed DOTs per µm².
Toidentify
To identifypossible
possible effects
effects of of
thethe surface
surface pretreatment
pretreatment on structural
on the the structural integrity
integrity of theof
the DOTs,
DOTs, we also wequantified
also quantified the fractions
the fractions of intact ofand
intact and damaged
damaged DOTs based DOTs onbased on an es-
an established
tablished classification
classification scheme [30,37,38].
scheme [30,37,38]. In this scheme,In thisthescheme, the classification
classification “damaged”“damaged”
applies to all ap-
plies to
DOTs all DOTs
whose shapewhoseclearlyshape clearly
deviates fromdeviates from DOT
the original the original
design DOT design
(see Ref. [37](see Ref. [37]
for details).
for details).
This in particularThis in particular
includes DOTs includes
coming DOTs
apartcoming apart atbut
at the vertices the also
vertices
brokenbut trapezoids,
also broken
DOT fragments,
trapezoids, DOTseverely
fragments, deformed
severely DOTs, and partially
deformed DOTs, and and completely
partially and denatured
completely DOTs. de-
The dissociation
natured DOTs. The of the trapezoids
dissociation of composing
the trapezoids thecomposing
Rothemund theDOT [1] at theDOT
Rothemund vertices
[1] at
results from the
the vertices lowfrom
results melting temperatures
the low of the bridging
melting temperatures staples
of the and is
bridging thus frequently
staples and is thus
observed in denaturing environments [38,39]. It also represents
frequently observed in denaturing environments [38,39]. It also represents the predomi- the predominant type of
damage under the current conditions. In contrast to previous classifications,
nant type of damage under the current conditions. In contrast to previous classifications, however, we
here deliberately
however, we here excluded
deliberatelyslight deformations
excluded of the adsorbed
slight deformations of DOTs from theDOTs
the adsorbed category
from
“damaged”.
the categoryWhile slight shape
“damaged”. While deformations
slight shape represent
deformationsanotherrepresent
very common another type of DOT
very com-
damage
mon type under
of DOTnon-denaturing
damage under conditions [37,40], they
non-denaturing may also
conditions be caused
[37,40], they bymay different
also be
surface topographies that result from the different pretreatments (see below). For Mg(see2+ -
caused by different surface topographies that result from the different pretreatments
mediated
below). For adsorption,
Mg2+-mediated aboutadsorption,
90% of the aboutadsorbed 90%DOTs of theremained
adsorbed structurally
DOTs remained intact, in
struc-
turally intact, in both PBS and H2O. This value is comparable to that observed previously
under equivalent conditions [24] as well as in standard folding buffer [37,40].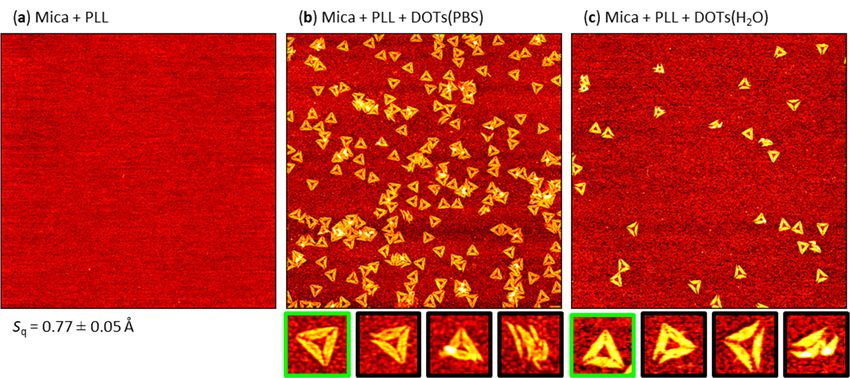
Molecules 2021, 26, 4798 4 of 16
both PBS and H2 O. This value is comparable to that observed previously under equivalent
conditions [24] as well as in standard folding buffer [37,40].
Molecules 2021, 26, x FOR PEER REVIEW 4 of 15
Figure 2.
Figure 2. Representative
RepresentativeAFM
AFMimages
imagesofof(a)
(a)aafreshly
freshlycleaved
cleavedmica
micasurface
surface and
and DOTs
DOTs adsorbed
adsorbed from
from (b)(b)
PBSPBS
andand
(c) (c)
H2 OH2at
O
at the mica surface after addition of 10 mM MgCl2 (in 1 × TAE). The AFM images have a size of 3 × 23 µm² and a height
the mica surface after addition of 10 mM MgCl2 (in 1 × TAE). The AFM images have a size of 3 × 3 µm and a height scale
scale of (a) 1.5 and (b,c) 2.5 nm, respectively. The RMS roughness Sq of the freshly cleaved mica surface (average of three
of (a) 1.5 and (b,c) 2.5 nm, respectively. The RMS roughness Sq of the freshly cleaved mica surface (average of three AFM
AFM images ± standard deviation) is given below the AFM image in (a). Below (b) and (c), example magnifications of
images ± standard
intact (green) deviation)
and damaged is given
(black) below
DOTs the AFM image in (a). Below (b) and (c), example magnifications of intact
are shown.
(green) and damaged (black) DOTs are shown.
2.2. Pre-Adsorption of Ni2+
2.2. Pre-Adsorption of Ni2+
Next, we evaluated DOT adsorption in the absence of additional Mg2+2+ ions at Ni2+ 2+-
Next, we evaluated DOT adsorption in the absence of additional Mg ions at Ni 2+-
modified mica surfaces. Ni ions undergo stronger binding to the mica surface than Mg .
2+
modified mica surfaces. Ni2+ ions undergo stronger binding to the mica surface than
Therefore, mica surfaces pretreated with Ni2+ have previously been used for immobilizing
Mg2+ . Therefore, mica surfaces pretreated with Ni2+ have previously been used for im-
genomic DNA molecules [41–44], while the displacement of Mg2+ ions at the mica–DNA
mobilizing genomic DNA molecules [41–44], while the displacement of Mg2+ ions at the
interface by interface
mica–DNA Ni2+ ions by hasNibeen
2+ ionsemployed
has been foremployed
the fixation forofthe
self-assembled DON lattices
fixation of self-assembled
[45,46]. Figure 3a shows an AFM image of a mica surface
DON lattices [45,46]. Figure 3a shows an AFM image of a mica surface after after incubation in 10incubation
mM NiCl2
solution.
in 10 mMCompared to theCompared
NiCl2 solution. freshly cleaved mica surface
to the freshly cleaved (see Figure
mica 2a),(see
surface a much rougher
Figure 2a), a
surface with many particle-like features was obtained, possibly as
much rougher surface with many particle-like features was obtained, possibly as a result of a result of the crystalli-
zation
the of residual of
crystallization NiCl 2. Consequently, the surface roughness was increased by almost a
residual NiCl2 . Consequently, the surface roughness was increased by
factor of two to S q ~ 0.85 Å.
almost a factor of two to Sq ~ 0.85 Å.
As can
As can be
beseen
seenininFigures
Figure3b,c,
3b,c,DOT DOTadsorption
adsorption at atthetheNi2+-modified
Ni 2+ -modified micamica
surface was
surface
strongly
was reduced
strongly compared
reduced compared to Mgto -mediated
2+ 2+
Mg -mediated adsorption. In PBS,Inthe
adsorption. PBS,DOT thesurface cover-
DOT surface
age was reduced
coverage from about
was reduced from15 DOTs
about 15per
DOTsµm2perfor Mg
µm2 -mediated
2+ adsorptionadsorption
for Mg2+ -mediated to only aboutto
4 DOTs per µm 2 (see Figure 2 4). An even lower surface coverage
only about 4 DOTs per µm (see Figure 4). An even lower surface coverage of less than of less than 2 DOTs per
2µm 2 was obtained
DOTs per µm2 was in obtained
H2O. Furthermore, also the fraction
in H2 O. Furthermore, also theof intact
fraction DOTs was DOTs
of intact drastically
was
decreased at the Ni 2+-modified2+ mica surface. While about
drastically decreased at the Ni -modified mica surface. While about 90% of adsorbed90% of adsorbed DOTs were
intact were
DOTs in theintact
presence
in theofpresence of Mg2+ , adsorption
Mg2+, adsorption from PBSfrom at thePBS the Ni2+ -modified
Niat2+-modified mica surface
mica
yielded yielded
surface only aboutonly12%aboutof intact
12% ofDOTs intact(see
DOTsTable
(see1).Table
In H21).
O, Ina higher
H2 O, afraction
higher of intact
fraction
DOTs
of of about
intact DOTs 37% was obtained.
of about 37% was Furthermore, because of the
obtained. Furthermore, comparatively
because large rough-
of the comparatively
ness of
large roughness of the Ni2+
the Ni2+-modified mica surface,mica
-modified the intact DOTs
surface, had aDOTs
the intact ratherhad blurred appearance
a rather blurred
and irregular height (see the magnifications in Figure 3b,c).
appearance and irregular height (see the magnifications in Figure 3b,c). This will notThis will not only hamper
only
their detailed
hamper structural
their detailed characterization
structural but also
characterization butrender the AFM
also render the AFMidentification of any
identification of
DON-bound
any DON-bound proteins closeclose
proteins to impossible.
to impossible.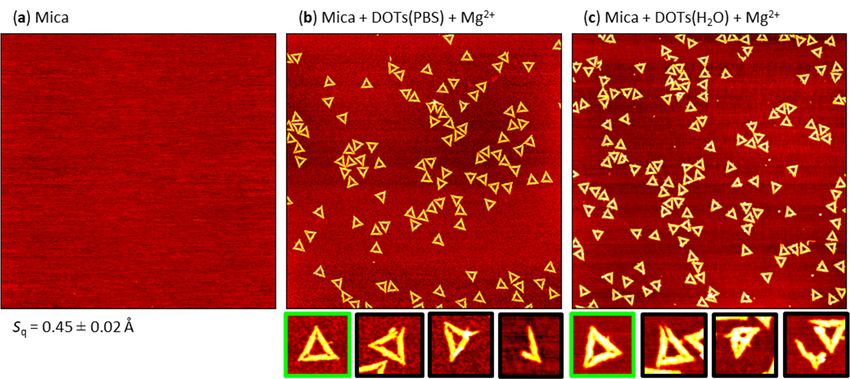
Molecules 2021, 26, 4798 5 of 16
Molecules 2021, 26, x FOR PEER REVIEW 5 of 15
Figure 3. Representative AFM images of (a) a mica surface after incubation with NiCl2 and DOTs adsorbed from (b) PBS
Figure 3. Representative AFM images of (a) a mica surface after incubation with NiCl2 and DOTs adsorbed from (b) PBS and
and (c) H2O at the Ni2+-modified mica surface. The AFM images have a size of 3 × 32 µm² and a height scale of (a) 1.5 and
(c) H2 O at the Ni2+ -modified mica surface. The AFM images have a size of 3 × 3 µm and a height scale of (a) 1.5 and (b,c)
(b,c) 2.5 nm, respectively. The RMS roughness Sq of the Ni2+-modified mica surface (average of three AFM images ± stand-
2+ -modified mica surface (average of three AFM images ± standard
2.5 nm, respectively. The RMS roughness Sq of the Ni
ard deviation) is given below the AFM image in (a). Below (b) and (c), example magnifications of intact (green) and dam-
deviation)
aged (black)is given
DOTs below the AFM image in (a). Below (b) and (c), example magnifications of intact (green) and damaged
are shown.
(black) DOTs are shown.
At first sight, the observation that Ni 2+ pre-adsorption is not an efficient DON ad-
At first sight, the observation that Ni2+ pre-adsorption is not an efficient DON adsorp-
sorption strategy under Mg 2+-free conditions may appear surprising because Ni2+ is
tion strategy under Mg2+ -free conditions may appear surprising because Ni2+ is known to
known to have a stronger binding affinity to both DNA [47] and mica [43] than does Mg2+.
have a stronger binding affinity to both DNA [47] and mica [43] than does Mg2+ . However,
However, Piétrement et al. have shown already in 2003 that efficient immobilization of
Piétrement et al. have 2+shown already in 2003 that efficient immobilization2+of genomic
genomic dsDNA at Ni -treated mica surfaces requires the presence of Mg ions in the
dsDNA at Ni2+ -treated mica surfaces requires the presence of Mg2+ 2+ ions in the sample
sample solution at concentrations of 10 mM or more [42]. At lower Mg concentrations of
solution at concentrations of 10 mM or more [42]. At lower Mg2+ concentrations of only
only 2 mM, the authors observed significant mobility of the adsorbed dsDNA molecules.
2 mM, the authors observed significant mobility of the adsorbed dsDNA molecules. In
In contrast to the experiments of Piétrement et al., we imaged the adsorbed DOTs in the
contrast to the experiments of Piétrement et al., we imaged the adsorbed DOTs in the dry
dry state, which required the washing of the mica surface with ultrapure water to remove
state, which required the washing of the mica surface with ultrapure water to remove
non-adsorbed DOTs as well as residual salt (in the case of PBS). It thus appears likely that
non-adsorbed DOTs as well as residual salt (in the case of PBS). It thus appears likely that a
a largeamount
large amountofofthe theweakly
weaklyadsorbed
adsorbedDOTsDOTsdesorbed
desorbedfrom fromthe theNi -treated mica
Ni2+2+-treated mica surface
surface
during this washing step, resulting in the observed strongly reduced
during this washing step, resulting in the observed strongly reduced surface coverage (see surface coverage (see
Figure 4).
Figure 4). This
This may
may also
also provide
provide an an explanation
explanation for for the
the large
large number
number of of damaged
damaged DOTsDOTs
found at these surfaces. Piétrement et al. observed that dsDNA molecules,
found at these surfaces. Piétrement et al. observed that dsDNA molecules, despite their despite their
weak adsorption at the Ni 2+-treated mica surface, resisted complete desorption in the pres-
2+
weak adsorption at the Ni -treated mica surface, resisted complete desorption in the pres-
ence of
ence of high
high Na
Na++ concentration
concentration but but instead
instead dangled
dangled from
from thethe surface
surface [42].
[42]. Assuming
Assuming thatthat
the same is true also for the DOTs remaining at the surface during washing,
the same is true also for the DOTs remaining at the surface during washing, the currents of the currents
of water
water flowing
flowing along
along the the surface
surface maymay induce
induce significant
significant distortions
distortions of theofpartially
the partially at-
attached
tached DOTs. The resulting stress buildup may then lead to DOT
DOTs. The resulting stress buildup may then lead to DOT rupture, fragmentation, and rupture, fragmentation,
and structural
structural collapse,
collapse, as observed
as observed in theinAFM
the AFM
images images
shownshown in Figures
in Figure 3b,c and 3b,c and S6.
Figure S6. It
It
should be noted at this point that the vast majority of in situ AFM studies
should be noted at this point that the vast majority of in situ AFM studies that employed that employed
Ni2+
Ni 2+-mediated dsDNA or DON adsorption at mica surfaces used DNA-containing buffer
-mediated dsDNA or DON adsorption at mica surfaces used DNA-containing buffer
solutions supplemented with divalent cations such such asas Ni
Ni2+2+ and Mg2+
and Mg2+[48–53].
[48–53].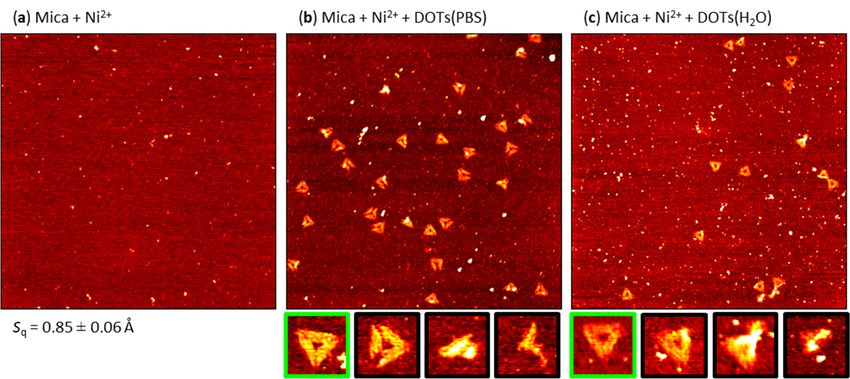
Molecules 2021, 26, 4798 6 of 16
Molecules 2021, 26, x FOR PEER REVIEW 6 of 15
Figure4.4.Surface
Figure Surfacecoverage
coverageofofadsorbed
adsorbedDOTs
DOTsobtained
obtainedforforthe
thedifferent
differentsurface
surfacepretreatments
pretreatmentsand
and
solution conditions. Values represent averages of five to twelve AFM images with the standard
solution conditions. Values represent averages of five to twelve AFM images with the standard de-
viations as error bars.
deviations as error bars.
Table 1. Absolute numbers of total, intact, and damaged DOTs evaluated for each immobilization
Table 1. Absolute
strategy numbers percentage
with the resulting of total, intact, and damaged
of intact DOTs. DOTs evaluated for each immobilization
strategy with the resulting percentage of intact DOTs.
Strategy Solution Total Intact Damaged Percentage Intact
Strategy
Mg 2+ Solution
PBS Total
654 Intact614 Damaged
40 Percentage Intact
93.9
Mg 2+ H 2O
PBS 808
654 614 717 40 91 88.7
93.9
Ni2+ PBS
H2 O 315
808 717 38 91 277 12.1
88.7
Ni2+ H 2O
PBS 92
315 38 34 277 58 37.0
12.1
PLL H2 O
PBS 92
1557 34 932 58 625 37.0
59.9
PLL PBS
H 2O 1557
179 932 49 625 130 59.9
27.4
Spdn H
PBS
2 O 179
3635 49 2657 130 978 27.4
73.1
Spdn PBS
H 2O
3635
161 2657110 978 51 73.1
68.3
H2 O 161 110 51 68.3
2.3. Pre-Adsorption of Poly-L-Lysine (PLL)
2.3. Pre-Adsorption of Poly-L-Lysine (PLL)
We then turned to polyelectrolyte adsorption for modifying the mica surface. The
mostWe then turned
prominent to polyelectrolyte
polyelectrolyte in the adsorption for modifying
present context is probablythe mica
PLL, surface.
which The
has been
most prominent polyelectrolyte in the present context is probably PLL,
used to immobilize dsDNA molecules [54], DNA-coated nanoparticles [55], and DNA ori-which has been
used
gamito immobilize
[56,57]. dsDNA
The latter, molecules
however, was [54], DNA-coated
always performednanoparticles
in the presence [55],
of and DNA
millimolar
origami [56,57]. The latter, however, was always performed in the presence
concentrations of Mg ions [56,57]. As can be seen in Figure 5a, PLL adsorption at mica
2+ of millimolar
concentrations of Mg2+ ions [56,57]. As can be seen in Figure 5a, PLL adsorption at mica
resulted in a rather smooth surface topography with an average RMS roughness Sq below
resulted in a rather smooth surface topography2+with an average RMS roughness Sq below
0.8 Å, which is slightly lower than for the2+ Ni -treated surface shown in Figure 3a. Fur-
0.8 Å, which is slightly lower than for the Ni -treated surface
thermore, the surface did not exhibit any particle-like features,shown in Figure
in contrast to Ni 3a. Further-
2+-modified
more, theFigure
surface3a). 2+
did not exhibit any particle-like features, in contrast to Ni -modified
mica (cf.
mica (cf. Figure 3a).
Exposure of the PLL-modified mica surface to DOTs in PBS resulted in sizeable ad-
Exposure of the PLL-modified mica surface to DOTs in PBS resulted in sizeable
sorption (see Figure 5b) with a surface coverage of about 22 DOTs per µm2, which is even
adsorption (see Figure 5b) with a 2+surface coverage of about 22 DOTs per µm2 , which is
higher than that obtained for Mg -mediated adsorption (see Figure 4). The DOTs them-
even higher than that obtained for Mg2+ -mediated adsorption (see Figure 4). The DOTs
selves could be resolved very well and with great structural detail. Closer inspection of
themselves could be resolved very well and with great structural detail. Closer inspection
the AFM images in Figures 5b and S7a, however, reveals a surprisingly large fraction of
of the AFM images in Figure 5b and Figure S7a, however, reveals a surprisingly large
damaged DOTs (~40%, see Table 1). In particular, several DOTs can be seen that have
fraction of damaged DOTs (~40%, see Table 1). In particular, several DOTs can be seen that
disintegrated at their vertices and now consist only of loosely connected trapezoids (see,
have disintegrated at their vertices and now consist only of loosely connected trapezoids
e.g., Figure 5b, right magnification). This type of damage is only rarely observed for Mg2+-
(see, e.g., Figure 5b, right magnification). This type of damage is only rarely observed
mediated adsorption (see Figures 2b and S5a), which indicates either that this damage
for Mg2+ -mediated adsorption (see Figure 2b and Figure S5a), which indicates either that
occurs during adsorption or that such damaged DOTs have a higher affinity for the PLL-
this damage occurs during 2+adsorption or that such damaged DOTs have a higher affinity
modified than for the Mg -modified surface, so that only the former surface results in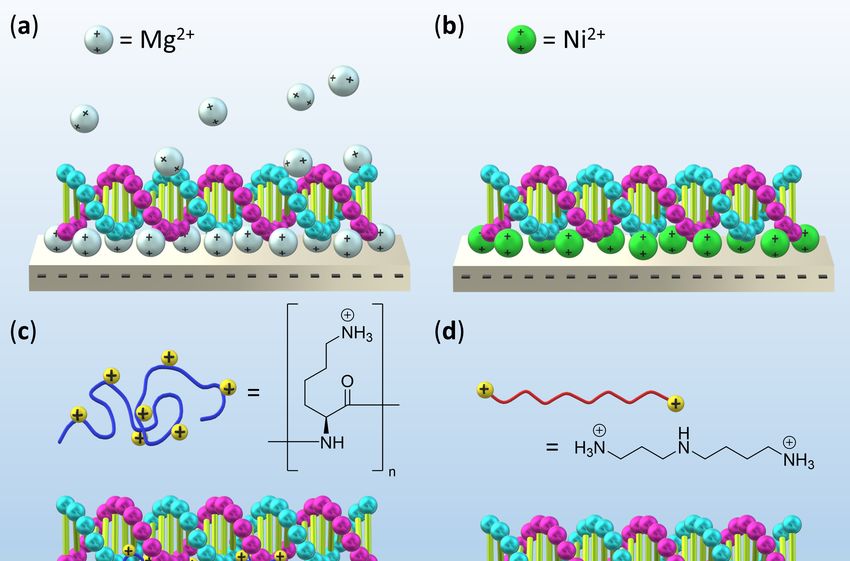
Figure 1c). Such dangling polyelectrolyte chains may screen the electrostatic repulsion
between adsorbed DOTs and thereby facilitate cluster formation.
For DOT adsorption from H2O, the situation at the PLL-modified surface was mark-
edly different. As can be seen in Figure 5c, the DOT surface coverage was drastically re-
duced compared to adsorption from PBS and comparable in magnitude to the surface
Molecules 2021, 26, 4798 7 of 16
coverage obtained at Ni2+-modified mica (see Figure 4). The appearance of the adsorbed
DOTs is very similar to those adsorbed from PBS. However, the fraction of intact DOTs
was decreased considerably from about 68% in PBS to only about 28% in H2O (see Table
1).
forThis indeed suggests
the PLL-modified than that the Mg2+ and
fordamaged intact surface,
-modified DOTs have different
so that surface
only the formeraffinities,
surface
whose
results relative
in their magnitude depends on not
efficient immobilization. only the type
Furthermore, weofobserved
surface but also the
a strong composi-
tendency of
tion
DOTofclustering
the surrounding medium. Thissurface.
at the PLL-modified might again
Since be related
such to the
clusters aresoft, cushion-like
mostly absent at na-
the
Mg2+of-modified
ture the entangled PLL layer
mica surface (cf.(see Figure
Figure 1c), Figure
2b and which S5a),
may partially enclose
we attribute theirthe adsorbed
formation to
DOTs and thereby
the entangled better accommodate
polyelectrolyte the moreloops
layer that probably three-dimensional shapes
and dangles from the of damaged
surface into
DOTs. This
solution (seewould
Figurenot
1c).only
Suchresult in better
dangling adhesion but
polyelectrolyte also protect
chains the adsorbed
may screen DOTs
the electrostatic
during sample
repulsion washing.
between adsorbed DOTs and thereby facilitate cluster formation.
Figure 5. Representative AFM images of (a) a mica surface after incubation with PLL and DOTs adsorbed from (b) PBS
Figure 5. Representative AFM images of (a) a mica surface after incubation with PLL and DOTs adsorbed from (b) PBS and
and (c) H2O at the PLL-modified mica surface. The AFM images have a size of 3 × 32 µm² and a height scale of (a) 1.5 and
(c) H2 O at the PLL-modified mica surface. The AFM images have a size of 3 × 3 µm and a height scale of (a) 1.5 and (b,c)
(b,c) 2.5 nm, respectively. The RMS roughness Sq of the PLL-modified mica surface (average of three AFM images ± stand-
2.5 nm,
ard respectively.
deviation) The
is given RMSthe
below roughness Sq ofinthe
AFM image (a).PLL-modified
Below (b) andmica surface (average
(c), example of threeofAFM
magnifications (green)±and
intactimages standard
dam-
deviation) is given below
aged (black) DOTs are shown. the AFM image in (a). Below (b) and (c), example magnifications of intact (green) and damaged
(black) DOTs are shown.
2.4. Pre-Adsorption of Spermidine (Spdn)
For DOT adsorption from H2 O, the situation at the PLL-modified surface was markedly
Because
different. As of
canthe
be observed clustering
seen in Figure 5c, theofDOT
the adsorbed DOTs and
surface coverage wasthe larger fraction
drastically reduced of
damaged DOTs at the PLL-modified mica surface, we next tested
compared to adsorption from PBS and comparable in magnitude to the surface coverageSpdn as a shorter poly-
electrolyte
obtained atthat Ni2+can also be used
-modified micato adsorb
(see DNA
Figure 4). [58]
The but should not
appearance of form such an entan-
the adsorbed DOTs
gled polyelectrolyte layer (see Figure 1d). However, as can be seen
is very similar to those adsorbed from PBS. However, the fraction of intact DOTs was in Figure 6a, the re-
sulting surface had a very pronounced topography dominated by small
decreased considerably from about 68% in PBS to only about 28% in H2 O (see Table 1). particles and large
islands,
This indeed which suggests
suggests that the buildup
damaged andofintact
multilayers.
DOTs have Consequently, the affinities,
different surface Spdn-modified
whose
mica surface by far had the largest RMS roughness of all the surfaces
relative magnitude depends on not only the type of surface but also the composition studied in this work, of
i.e.,
the Ssurrounding
q ~ 1.9 Å. Despite
medium.this rough surfaceagain
This might topography, surprisingly
be related to the soft,strong DOT adsorption
cushion-like nature of
from PBS solution
the entangled PLL canlayerbes observed
(see in the
Figure 1c), AFMmay
which images in Figure
partially 6b and
enclose S8a. At a DOTs
the adsorbed value
of
and 45thereby
DOTs per µmaccommodate
better 2, the achieved DOT surface coverage was about thrice as high as for
the more three-dimensional shapes of damaged DOTs.
Mg
This 2+-mediated adsorption (see Figure 4). While the fraction of intact DOTs of about 73%
would not only result in better adhesion but also protect the adsorbed DOTs during
was smaller
sample washing. than for Mg2+-mediated adsorption (see Table 1), the appearance of the DOTs
2.4. Pre-Adsorption of Spermidine (Spdn)
Because of the observed clustering of the adsorbed DOTs and the larger fraction
of damaged DOTs at the PLL-modified mica surface, we next tested Spdn as a shorter
polyelectrolyte that can also be used to adsorb DNA [58] but should not form such an
entangled polyelectrolyte layer (see Figure 1d). However, as can be seen in Figure 6a, the
resulting surface had a very pronounced topography dominated by small particles and
large islands, which suggests the buildup of multilayers. Consequently, the Spdn-modified
mica surface by far had the largest RMS roughness of all the surfaces studied in this work,
i.e., Sq ~ 1.9 Å. Despite this rough surface topography, surprisingly strong DOT adsorption
Molecules 2021, 26, 4798 8 of 16
from PBS solution can bes observed in the AFM images in Figure 6b and Figure S8a. At a
value of 45 DOTs per µm2 , the achieved DOT surface coverage was about thrice as high as
for Mg2+ -mediated adsorption (see Figure 4). While the fraction of intact DOTs of 8about
Molecules 2021, 26, x FOR PEER REVIEW of 15
73% was smaller than for Mg2+ -mediated adsorption (see Table 1), the appearance of the
was
DOTs comparable. Spdn pre-adsorption
was comparable. Spdn pre-adsorptionis thusisvastly superior
thus vastly to the to
superior other
the Mg
other2+-free2+
Mg meth-
-free
ods evaluated in this study for immobilizing DOTs from PBS. For
methods evaluated in this study for immobilizing DOTs from PBS. For DOTs suspended DOTs suspended in
H O, however, a similar behavior was observed as for PLL-modified mica,
in H2 O, however, a similar behavior was observed as for PLL-modified mica, i.e., vastly
2 i.e., vastly re-
duced
reduced adsorption
adsorptionwithwitha asurface
surfacecoverage
coverageofofonly
onlyabout
about1.5
1.5DOTs
DOTsper
perµmµm22(see
(seeFigures
Figure 6c
and S8b). Even
Figure though
S8b). Eventhe fraction
though theof intact DOTs
fraction wasDOTs
of intact morewasthanmore
twicethan
as high as for
twice PLL,
as high
i.e.,
as forabout
PLL,68% (see Table
i.e., about 68% 1),
(seethe Spdn-modified
Table surface proved
1), the Spdn-modified very
surface difficult
proved veryto image
difficult
after
to imageDOTafter
adsorption from H2O,
DOT adsorption fromwith
H2the recorded
O, with AFM images
the recorded often showing
AFM images severe
often showing
imaging artefactsartefacts
severe imaging (see Figure(seeS8b). Therefore,
Figure immobilizing
S8b). Therefore, DOTs fromDOTs
immobilizing H2O at Spdn-mod-
from H2 O at
ified mica surfaces
Spdn-modified micais surfaces
not particularly compatiblecompatible
is not particularly with AFM with
investigations.
AFM investigations.
Figure 6. Representative AFM images of (a) a mica surface after incubation with Spdn and DOTs adsorbed from (b) PBS
Figure 6. Representative AFM images of (a) a mica surface after incubation with Spdn and DOTs adsorbed from (b) PBS and
and (c) H2O at the Spdn-modified mica surface. The AFM images have a size of 3 x 32 µm² and a height scale of (a) 1.5 and
(c) H2 O at the Spdn-modified mica surface. The AFM images have a size of 3 × 3 µm and a height scale of (a) 1.5 and (b,c)
(b,c) 2.5 nm, respectively. The RMS roughness Sq of the Spdn-modified mica surface (average of three AFM images ±
2.5 nm, respectively.
standard The
deviation) is RMSbelow
given roughness Sq of
the AFM the Spdn-modified
image in (a). Below (b)mica
andsurface (average
(c), example of three AFMofimages
magnifications ± standard
intact (green) and
deviation) is given below the
damaged (black) DOTs are shown. AFM image in (a). Below (b) and (c), example magnifications of intact (green) and damaged
(black) DOTs are shown.
2.5. Effect of PBS and H2O Exposure on the Pre-Adsorbed Polyelectrolyte Films
2.5. Effect of PBS and H2 O Exposure on the Pre-Adsorbed Polyelectrolyte Films
The observation that DOT adsorption at both polyelectrolyte-modified surfaces is
The observation that DOT adsorption at both polyelectrolyte-modified surfaces is
much weaker in H2O than in PBS is rather surprising. Because of its comparatively high
much weaker in H2 O than in PBS is rather surprising. Because of its comparatively
ionic strength, PBS has a Debye length of only about 0.7 nm [59], so that any long-range
high ionic strength, PBS has a Debye length of only about 0.7 nm [59], so that any long-
electrostatic interactions between the negatively charged DOTs and the positively charged
range electrostatic interactions between the negatively charged DOTs and the positively
polyelectrolyte films will be efficiently screened. In the absence of any ions, one would
charged polyelectrolyte films will be efficiently screened. In the absence of any ions, one
thus expect a stronger interaction. Obviously, this was not the case in the present experi-
would thus expect a stronger interaction. Obviously, this was not the case in the present
ments. On the other hand, the same ions will also screen the electrostatic repulsion be-
experiments. On the other hand, the same ions will also screen the electrostatic repulsion
tween neighboring (protonated) amino groups in the polyelectrolyte layer. Exposure to
between neighboring (protonated) amino groups in the polyelectrolyte layer. Exposure
PBS may thus lead to structural reorganizations inside the adsorbed polyelectrolyte film
to PBS may thus lead to structural reorganizations inside the adsorbed polyelectrolyte
and
film thereby a more
and thereby a compact and homogeneous
more compact and homogeneous surfacesurface
layer. Furthermore, PBS contains
layer. Furthermore, PBS
acontains
comparatively large concentration of Na + ions, which can specifically interact with the
+
a comparatively large concentration of Na ions, which can specifically interact
exposed
with mica surface
the exposed mica and thereby
surface neutralize
and thereby its negative
neutralize chargecharge
its negative [60,61],[60,61],
resulting in re-
resulting
duced electrostatic repulsion between DOTs and exposed areas of the mica
in reduced electrostatic repulsion between DOTs and exposed areas of the mica surface surface show-
ing through.
showing In H2O,
through. In this
H2 O,repulsion will remain
this repulsion unscreened.
will remain unscreened.
In
In order to obtain more insights into this effect, we
order to obtain more insights into this effect, we exposed
exposed both
both polyelectrolyte-
polyelectrolyte-
modified surfaces to PBS and H 2O without DOTs and evaluated the effect on the surface
modified surfaces to PBS and H2 O without DOTs and evaluated the effect on the surface
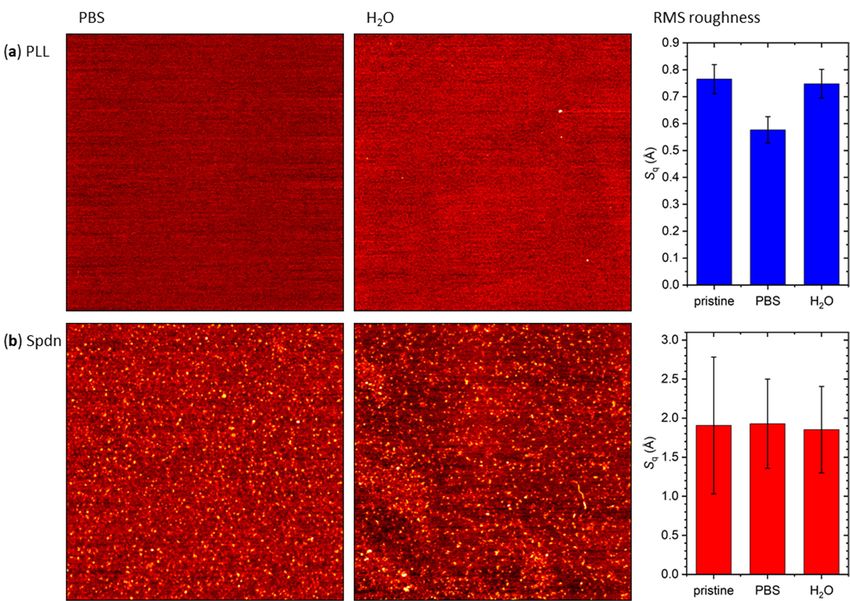
topography. As can be seen in Figure 7a, exposure of the PLL-modified mica surface to
PBS indeed resulted in a reduction of the RMS surface roughness, even though no mor-
phological differences were visible in the corresponding AFM images. This reduction in
Sq is indicative of a compaction of the adsorbed PLL film. Exposure to H2O, on the other
hand, did not have any detectable effect on the morphology of the PLL film. This was toMolecules 2021, 26, x FOR PEER REVIEW 9 of 15
In the case of Spdn, no effect of exposure to PBS or H2O on the RMS surface roughness
Molecules 2021, 26, 4798 9 of 16
was observed (see Figure 7b). This can be attributed to the fact that the Spdn surface was
very rough and inhomogeneous to begin with (see Figures 6a and S4a). Nevertheless, vis-
ual inspection of the AFM images in Figures 6a, 7b, and S4 suggests some minor morpho-
logical transition
topography. As upon
can beexposure to PBS.7a,
seen in Figure In particular,
exposure ofthethe
Spdn film appeared
PLL-modified micamore ho-
surface
mogeneous
to PBS indeedoverresulted
micrometer
in a length scales
reduction of after exposure
the RMS to PBS
surface and did not
roughness, evenshow suchno
though a
pronounced
morphological island topography
differences were anymore.
visible in In
thesum, these observations
corresponding indeed
AFM images. suggest
This that
reduction
efficient DNA origami
in Sq is indicative immobilization
of a compaction of theatadsorbed
polyelectrolyte-modified
PLL film. Exposure mica surfaces
to H requires
2 O, on the other
ahand,
certain
didionic strength
not have in order to
any detectable create
effect a compact
on the and homogeneous
morphology of the PLL film.polyelectrolyte
This was to be
expected since the mica pretreatment utilized PLL dissolved in H2 O (see Section 3.2).
film.
Figure 7. Representative AFM images of (a) PLL- and (b) Spdn-modified mica surfaces after incubation in PBS (left) and
Figure 7. Representative AFM images of (a) PLL- and (b) Spdn-modified mica surfaces after incubation in PBS (left) and
H2O (center). The right panels provide the RMS surface roughness values before and after incubation. The AFM images
H2 O (center). The right panels provide the RMS surface roughness values before and after incubation. The AFM images
have a size of 3 × 3 µm²2and a height scale of 1.5 nm. The RMS roughness values represent averages of three AFM images
have the
with a size of 3 × 3deviations
standard µm and aasheight scale of 1.5 nm. The RMS roughness values represent averages of three AFM images
error bars.
with the standard deviations as error bars.
2.6. Effect of DON Shape
In the case of Spdn, no effect of exposure to PBS or H2 O on the RMS surface roughness
was In order to(see
observed assess
Figurethe 7b).
generality
This can of be
theattributed
above observations, we repeated
to the fact that the Spdnthese exper-
surface was
iments with a rather different DON shape, i.e., a tube-like 6HB [62],
very rough and inhomogeneous to begin with (see Figure 6a and Figure S4a). Nevertheless, even though this
shape has only very limited relevance as a substrate for single-molecule
visual inspection of the AFM images in Figure 6a, Figure 7b and Figure S4 suggests AFM investiga-
tions.
some As canmorphological
minor be seen in Figure 8, muchupon
transition smaller differences
exposure to PBS.inIn
surface coverage
particular, were film
the Spdn ob-
served compared to the 2D DOTs. Since the shape of the 6HBs is
appeared more homogeneous over micrometer length scales after exposure to PBS and less distinct than that of
the
did DOTs,
not showidentification of structural
such a pronounced islanddamage is rather
topography challenging.
anymore. In sum,Therefore, we only
these observations
determined
indeed suggestthe that
totalefficient
numberDNA of 6HBs per µm²,
origami without any
immobilization at distinction between damaged
polyelectrolyte-modified mica
and intactrequires
surfaces DONs. The results
a certain of the
ionic statistical
strength analyses
in order are shown
to create in Figure
a compact 9 and support
and homogeneous
the qualitative observations
polyelectrolyte film. based on the AFM images in Figure 8.
2.6. Effect of DON Shape
In order to assess the generality of the above observations, we repeated these experi-
ments with a rather different DON shape, i.e., a tube-like 6HB [62], even though this shape
has only very limited relevance as a substrate for single-molecule AFM investigations.Molecules 2021, 26, x FOR PEER REVIEW 10 of 15
Molecules 2021, 26, 4798 10 of 16
As can be seen in Figure 8, much smaller differences in surface coverage were observed
compared to the 2D DOTs. Since the shape of the 6HBs is less distinct than that of the DOTs,
identification of structural damage is rather challenging. Therefore, we only determined the
total number of 6HBs per µm2 , without any distinction between damaged and intact DONs.
The results of the statistical analyses are shown in Figure 9 and support the qualitative
observations based on the AFM images in Figure 8.
Molecules 2021, 26, x FOR PEER REVIEW 10 of 15
Figure 8. Representative AFM images of 6HB DONs adsorbed at mica surfaces from PBS (upper row) and H2O (lower
row) via (a) Mg2+ addition, (b) Ni2+ pretreatment, (c) PLL pretreatment, and (d) Spdn pretreatment. The AFM images have
a size of 3 x 3 µm² and a height scale of 4 nm.
The observation that the 6HBs did not show such drastic differences in surface cov-
erage between the different immobilization methods as the DOTs most likely resulted
from their different surface footprints. Arranging the individual DNA double helices not
in a 2D sheet but rather a 3D tube results in a smaller contact area between the 6HBs and
the mica surface. Therefore, adsorption of the 6HB will be less sensitive to lateral varia-
tions in the pre-adsorbed film. On the other hand, efficient adsorption of the tube-like
Figure 8. Representative AFM 6HBs
imagesdueofto6HB
electrostatic interactions
DONs adsorbed at micaissurfaces
usuallyfrom
accompanied
PBS (upperby their
row) andstructural
H2O (lowercollapse
Figure 8. Representative AFM images
and, of flattening
thus, 6HB DONs at adsorbed at micawhich
surfaces from PBS (upper row) and H2 O (lower row)
row) via (a)2+Mg2+ addition, (b)2+Ni2+ pretreatment, (c) PLLthe surface,
pretreatment, and (d)results in an increased
Spdn pretreatment. contact
The AFM area.
images Whether
have
via (a) Mg addition, (b) Ni this pretreatment,
is possible (c) PLL pretreatment, and (d) Spdn pretreatment. The AFM images have a size
a size of 3 x 3 µm² and a height scale of 4 nm. or not will depend on the strength of the DNA–surface interactions and
of 3 × 3 µm2 and a height scale of 4 nm.
thus on the type of surface modification.
The observation that the 6HBs did not show such drastic differences in surface cov-
erage between the different immobilization methods as the DOTs most likely resulted
from their different surface footprints. Arranging the individual DNA double helices not
in a 2D sheet but rather a 3D tube results in a smaller contact area between the 6HBs and
the mica surface. Therefore, adsorption of the 6HB will be less sensitive to lateral varia-
tions in the pre-adsorbed film. On the other hand, efficient adsorption of the tube-like
6HBs due to electrostatic interactions is usually accompanied by their structural collapse
and, thus, flattening at the surface, which results in an increased contact area. Whether
this is possible or not will depend on the strength of the DNA–surface interactions and
thus on the type of surface modification.
Figure9.9.Surface
Figure Surfacecoverage
coverageofofadsorbed
adsorbed6HBs
6HBsobtained
obtainedfor
forthe
thedifferent
differentsurface
surfacepretreatments
pretreatmentsand
and
solution conditions. Values represent averages of six AFM images with the standard deviations
solution conditions. Values represent averages of six AFM images with the standard deviations as as
error bars. The total number of counted 6HBs used in the statistical analysis is given above each bar.
error bars. The total number of counted 6HBs used in the statistical analysis is given above each bar.Molecules 2021, 26, 4798 11 of 16
The observation that the 6HBs did not show such drastic differences in surface cover-
age between the different immobilization methods as the DOTs most likely resulted from
their different surface footprints. Arranging the individual DNA double helices not in a
2D sheet but rather a 3D tube results in a smaller contact area between the 6HBs and the
mica surface. Therefore, adsorption of the 6HB will be less sensitive to lateral variations in
the pre-adsorbed film. On the other hand, efficient adsorption of the tube-like 6HBs due
to electrostatic interactions is usually accompanied by their structural collapse and, thus,
flattening at the surface, which results in an increased contact area. Whether this is possible
or not will depend on the strength of the DNA–surface interactions and thus on the type of
surface modification.
Furthermore, the data in Figure 9 suggest that for the 6HBs, Mg2+ -mediated adsorp-
tion was less efficient in H2 O than in PBS, whereas the opposite was observed for Ni2+
pretreatment. In contrast, no dependence of Mg2+ - and Ni2+ -mediated adsorption on the
solution conditions was observed for the DOTs (see Figure 4). This may be related to
superstructure-specific differences in the interactions between DONs and the different
ions (both in solution and at the surface), as previously observed for Mg2+ and Eu3+ ions
coordinating to the backbone phosphates of DOTs and 6HBs [63]. Finally, in H2 O, the
6HBs adsorbed at the PLL-modified mica surface in a strongly curved conformation (see
Figure 8c and Figure S11b). To a lesser degree, this was also observed for the Ni2+ -modified
surface in the same solution (see Figure 8b and Figure S10b). This may be related to varia-
tions in the mechanical properties and in particular the flexibility of the 6HBs suspended in
the different solutions. In H2 O, the electrostatic repulsion between neighboring double he-
lices will be more pronounced than in high-ionic strength PBS. This may lead to differences
in the relaxation of residual strain and in turn to different global conformations. However,
since such curved conformations are not observed at the Spdn-modified surface under the
same conditions, the surface properties obviously have a strong influence as well. While
elucidating these superstructure-specific effects on surface coverage and conformation of
the adsorbed DONs will require further study, we can already conclude that applying
polyelectrolyte coatings on mica surfaces is a viable strategy for immobilizing DONs at
mica surfaces under essentially Mg2+ -free conditions.
3. Materials and Methods
3.1. DON Assembly and Buffer Exchange
DOTs [1] and 6HBs [62] were assembled as previously described [24] by using the 7249-
nt long M13mp18 scaffold strand (Tilibit GmbH, München, Germany) and 208 and 170 sta-
ple strands (Eurofins Genomics GmbH, Ebersberg, Germany), respectively, in 1 × TAE
buffer (Carl Roth GmbH + Co. KG, Karlsruhe, Germany) containing 10 mM MgCl2
(Sigma-Aldrich Chemie GmbH, Steinheim, Germany). The mixtures were rapidly heated
to 80 ◦ C, followed by slow cooling to room temperature within 90 min in a Thermocycler
Primus 25 advanced (PEQLAB Biotechnologie GmbH, Erlangen, Germany). The folding
buffer was exchanged during purification by spin filtering (Amicon Ultra, 100K, Merck
KGaA, Darmstadt, Germany) with HPLC-grade water (pH 7.0, VWR International S.A.S.,
Fontenay-sous-Bois, France) and PBS buffer (138 mM sodium chloride, 2.7 mM potassium
chloride, 10 mM sodium phosphate, 2.7 mM potassium phosphate, pH 7.4, Sigma-Aldrich
Chemie GmbH, Steinheim, Germany), respectively. As was shown previously, this buffer
exchange does not induce any additional structural damage to the DONs [24]. The result-
ing DNA origami concentration was determined using a Nanophotometer P 330 (Implen
GmbH, München, Germany).
3.2. Mica Surface Modification
Mica substrates (Ted Pella, Inc., Redding, CA, USA) were pretreated with NiCl2
(Sigma-Aldrich Chemie GmbH, Steinheim, Germany), PLL hydrobromide (molecular
weight 1000–5000, Sigma-Aldrich Chemie GmbH, Steinheim, Germany), and Spdn (Alfa
Aesar, Thermo Fisher (Kandel) GmbH, Kandel, Germany), respectively.Molecules 2021, 26, 4798 12 of 16
(1) NiCl2 pretreatment: 10 mM NiCl2 aqueous solution was deposited onto a freshly
cleaved mica surface and incubated for 1 h. An incubation time of 1 h was chosen
based on our previous work [45]. It should be noted, however, that equivalent results
as reported here were also obtained with shorter incubation times, i.e., 1 min to 30 min.
The mica substrate was then rinsed with HPLC-grade water to remove excess NiCl2 .
(2) PLL pretreatment: PLL was dissolved in HPLC-grade water to yield a 0.1% w/v
PLL solution. The PLL solution was deposited onto a freshly cleaved mica surface
and incubated for 1 h. An incubation time of 1 h was chosen based on literature to
ensure maximum surface coverage [64]. The mica substrate was then rinsed with
HPLC-grade water to remove excess PLL.
(3) Spdn pretreatment: Spdn was dissolved in HPLC-grade water to yield a 5 mg/mL
Spdn solution and then deposited onto a freshly cleaved mica surface. After incuba-
tion for 5 min the mica substrate was rinsed with HPLC-grade water. An incubation
time of 5 min was chosen based on literature [58].
3.3. DON Immobilization and AFM Imaging
For DON immobilization, 2 nM DONs in HPLC-grade water and PBS were incubated
on the pretreated mica surfaces for 1 min, respectively. For the reference experiments
shown in Figure 7, the same protocol was used but without DONs. For Mg2+ -mediated
adsorption, the concentrated DON solutions in H2 O and PBS were diluted to 2 nM with
1 × TAE buffer containing 10 mM MgCl2 , respectively, and incubated on a freshly cleaved
mica surface for 1 min. After incubation, the mica substrates were rinsed with HPLC-grade
water and blow-dried in a stream of ultrapure air. AFM measurements were carried out
by using an Agilent 5500 and a JPK NanoWizard III AFM in intermittent contact mode
in air with silicon cantilevers (MikroMasch HQ:NSC18/Al BS, NanoAndMore GmbH,
Wetzlar, Germany). Images were recorded with scan sizes of 3 × 3 µm2 and a resolution of
1024 px × 1024 px.
The numbers of intact and damaged DOTs visible in the AFM images were counted
manually and averaged over five to twelve AFM images recorded under equivalent condi-
tions. The established AFM-based classification of DOTs into intact, broken, denatured, and
deformed was applied [30,37]. However, because of the different RMS roughness values
obtained after the different pretreatments, only severely deformed DOTs were considered
damaged, while slightly deformed ones were treated as intact. Because structural damage
is more difficult to assess for the 6HBs [37], we only counted the total numbers of adsorbed
6HBs without any distinction between intact and damaged DONs. The few 6HB fragments
sometimes observed were not considered at all. Each experiment was performed twice,
and AFM images from both experiments were included in the statistical analyses.
4. Conclusions
In this work, we investigated the immobilization of 2D DOTs and tube-like 6HBs at
mica surfaces under essentially Mg2+ -free conditions using different surface pretreatments.
For the DOTs, pre-adsorption of Ni2+ ions showed the worst performance in both PBS and
H2 O, with low surface coverage, large fractions of damaged DOTs, and severely distorted
intact DOTs. In contrast, polyelectrolyte coatings showed vastly superior performance in
PBS. DOT adsorption at the Spdn-modified mica surface in particular resulted in greatly
enhanced surface coverage compared to Mg2+ -mediated adsorption, with about 70% of
the adsorbed DONs remaining intact. While PLL-modified mica performed more similarly
to Mg2+ addition in terms of surface coverage, the adsorbed DOTs could be resolved in
much greater detail, rendering this surface particularly promising for structural DON
characterization. For DOTs suspended in H2 O, however, the performance of both poly-
electrolyte coatings was greatly reduced, in terms of both surface coverage and fraction
of intact DONs. Furthermore, AFM imaging of the DOTs adsorbed at the Spdn-modified
surface proved particularly difficult under these conditions and resulted in severe imagingMolecules 2021, 26, 4798 13 of 16
artefacts, which renders PLL-mediated DOT adsorption a better choice for AFM-based
investigations in H2 O.
The counterintuitive behavior of the polyelectrolyte films in the different Mg2+ -free
solutions is attributed to electrostatic repulsion between the adsorbed polyelectrolyte chains
at low ionic strength, leading to a partially exposed mica surface, which is in this case not
screened by the buffer solution. In PBS, the repulsive interactions between the adsorbed
molecules are efficiently screened, which results in more compact and homogeneous
polyelectrolyte films along with a screening of the charge of the partially exposed mica.
Both effects promote enhanced DOT adsorption.
Finally, we investigated also the role of DON shape and found that the differences be-
tween the different strategies observed for the adsorption of 2D DOTs are less pronounced
for 3D 6HBs. Here, all Mg2+ -free strategies produce rather similar surface coverage, while
PLL- and Ni2+ -mediated adsorption both result in strongly curved 6HBs. Despite these
superstructure-specific differences, polyelectrolyte-coated mica surfaces represent suitable
and versatile substrates for DON immobilization under essentially Mg2+ -free conditions.
Our results thus provide some general guidance for the efficient immobilization of DONs
at mica surfaces under Mg2+ -free conditions and may thus aid future in situ AFM studies
of biomolecular reactions and dynamics.
Supplementary Materials: The following are available online. Figure S1: Additional AFM images
of the freshly cleaved mica surface, Figure S2: Additional AFM images of the Ni2+ -modified mica
surface, Figure S3: Additional AFM images of the PLL-modified mica surface before (a) and after
exposure to PBS (b) and H2 O (c), Figure S4: Additional AFM images of the Spdn-modified mica
surface before (a) and after exposure to PBS (b) and H2 O (c), Figure S5: Additional AFM images
of DOTs adsorbed from PBS (a) and H2 O (b) via Mg2+ addition at the mica surface, Figure S6:
Additional AFM images of DOTs adsorbed from PBS (a) and H2 O (b) at the Ni2+ -modified mica
surface, Figure S7: Additional AFM images of DOTs adsorbed from PBS (a) and H2 O (b) at the
PLL-modified mica surface, Figure S8: Additional AFM images of DOTs adsorbed from PBS (a) and
H2 O (b) at the Spdn-modified mica surface, Figure S9: Additional AFM images of 6HBs adsorbed
from PBS (a) and H2 O (b) via Mg2+ addition at the mica surface. Figure S10: Additional AFM
images of 6HBs adsorbed from PBS (a) and H2 O (b) at the Ni2+ -modified mica surface, Figure S11:
Additional AFM images of 6HBs adsorbed from PBS (a) and H2 O (b) at the PLL-modified mica
surface, Figure S12: Additional AFM images of 6HBs adsorbed from PBS (a) and H2 O (b) at the
Spdn-modified mica surface.
Author Contributions: Conceptualization, A.K.; Formal analysis, A.K.; Investigation, Y.X. and
A.A.Z.; Methodology, Y.X. and A.K.; Resources, G.G.; Supervision, G.G. and A.K.; Validation, Y.X.;
Visualization, Y.X. and A.K.; Writing—original draft, A.K.; Writing—review and editing, Y.X., A.A.Z.,
G.G. and A.K. All authors have read and agreed to the published version of the manuscript.
Funding: This research received no external funding.
Data Availability Statement: The data presented in this study are available on request from the
corresponding author.
Conflicts of Interest: The authors declare no conflict of interest.
Sample Availability: Samples of the compounds are not available from the authors.
References
1. Rothemund, P.W.K. Folding DNA to create nanoscale shapes and patterns. Nature 2006, 440, 297–302. [CrossRef] [PubMed]
2. Douglas, S.M.; Dietz, H.; Liedl, T.; Högberg, B.; Graf, F.; Shih, W.M. Self-assembly of DNA into nanoscale three-dimensional
shapes. Nature 2009, 459, 414–418. [CrossRef]
3. Keller, A.; Linko, V. Challenges and Perspectives of DNA Nanostructures in Biomedicine. Angew. Chem. Int. Ed. Engl. 2020, 59,
15818–15833. [CrossRef] [PubMed]
4. Smith, D.M.; Keller, A. DNA Nanostructures in the Fight Against Infectious Diseases. Adv. NanoBiomed Res. 2021, 1, 2000049.
[CrossRef] [PubMed]
5. Bald, I.; Keller, A. Molecular processes studied at a single-molecule level using DNA origami nanostructures and atomic force
microscopy. Molecules 2014, 19, 13803–13823. [CrossRef]You can also read


