Cerebellar climbing fibers encode expected reward size - eLife
←
→
Page content transcription
If your browser does not render page correctly, please read the page content below
RESEARCH ARTICLE

                                    Cerebellar climbing fibers encode
                                    expected reward size
                                    Noga Larry†*, Merav Yarkoni†, Adi Lixenberg, Mati Joshua

                                    Edmond and Lily Safra Center for Brain Sciences, The Hebrew University of
                                    Jerusalem, Jerusalem, Israel

                                    Abstract Climbing fiber inputs to the cerebellum encode error signals that instruct learning.
                                    Recently, evidence has accumulated to suggest that the cerebellum is also involved in the
                                    processing of reward. To study how rewarding events are encoded, we recorded the activity of
                                    climbing fibers when monkeys were engaged in an eye movement task. At the beginning of each
                                    trial, the monkeys were cued to the size of the reward that would be delivered upon successful
                                    completion of the trial. Climbing fiber activity increased when the monkeys were presented with a
                                    cue indicating a large reward, but not a small reward. Reward size did not modulate activity at
                                    reward delivery or during eye movements. Comparison between climbing fiber and simple spike
                                    activity indicated different interactions for coding of movement and reward. These results indicate
                                    that climbing fibers encode the expected reward size and suggest a general role of the cerebellum
                                    in associative learning beyond error correction.
                                    DOI: https://doi.org/10.7554/eLife.46870.001

                                    Introduction
                                    Computational, anatomical, and functional evidence support the theory that the cerebellar cortex
*For correspondence:
noga.larry@mail.huji.ac.il          performs error correcting supervised motor learning (Albus, 1971; Gilbert and Thach, 1977;
†
                                    Marr, 1969; Nguyen-Vu et al., 2013; Stone and Lisberger, 1990; Suvrathan et al., 2016). In this
 These authors contributed
                                    framework, motor learning occurs through changes in the computation of Purkinje cells, the sole out-
equally to this work
                                    put cells of the cerebellar cortex. Purkinje cells receive two distinct types of inputs: parallel fiber
Competing interests: The            inputs and climbing fiber inputs. Each type of input leads to a different type of action potential. Par-
authors declare that no             allel fiber inputs modulate the rate of Simple spikes (Sspks), events similar to action potentials in
competing interests exist.          other cell types. Climbing fiber inputs result in complex spikes (Cspks), which are unique prolonged
Funding: See page 14                events. Cspks are thought to represent instructive error signals triggered by movement errors. These
Received: 14 March 2019
                                    error signals adjust the Sspk response of the Purkinje cell to parallel fiber input, resulting in improve-
Accepted: 24 October 2019           ment in subsequent movements. This hypothesized role of the Cspks in learning was broadened
Published: 29 October 2019          when it was shown that the Cspk rate increases in response to cues that are predictive of undesired
                                    successive stimuli (Ohmae and Medina, 2015). Thus, the Cspk signal is well-suited for driving asso-
Reviewing editor: Jennifer L
                                    ciative learning based on motor errors that drive avoidance of aversive stimuli.
Raymond, Stanford University
                                        Recent research has shown that Cspk rate increases when behavior leads to a desired rewarded
School of Medicine, United
States
                                    outcome or when reward related stimuli are presented (Heffley et al., 2018; Kostadinov et al.,
                                    2019; Heffley and Hull, 2019), a marked departure from their established role in error signaling.
   Copyright Larry et al. This
                                    We aimed to further investigate what is coded by the reward related Cspk increase and whether the
article is distributed under the
                                    reward driven Cspk modulations are linked to simple spike modulations.
terms of the Creative Commons
                                        We considered three possibilities for the coding of reward by Cspks. The first was that the Cspk
Attribution License, which
permits unrestricted use and        reward signal could be directly linked to the physical delivery of reward. For example to reward con-
redistribution provided that the    sumption behavior (such as licking; Welsh et al., 1995) or to the signal at reward delivery that
original author and source are      behavior was successful (Heffley et al., 2018). If so, we would expect reward related modulations of
credited.                           the Cspk rate to be locked to the time of reward delivery. The second possibility was that the Cspks

Larry et al. eLife 2019;8:e46870. DOI: https://doi.org/10.7554/eLife.46870                                                             1 of 16
Research article Neuroscience
could encode the predicted reward consequences of arbitrary stimuli, similar to the way in which
Cspks encode the prediction of an undesired air-puff (Ohmae and Medina, 2015). If this were the
case, we would expect a Cspk increase when reward predictive stimuli are presented. Finally, reward
could modulate Cspks through the coding of motor errors. In the eye movement system, for
instance, Cspks are modulated when the eye velocity does not match the target velocity (i.e. retinal
slip; Stone and Lisberger, 1990). Reward could influence the representation of the error signal such
that similar retinal slips would result in a higher Cspk rate when a greater reward is expected. Thus,
if reward acts on error signaling directly, we would expect reward to modulate the Cspk rate at the
time of the retinal slip.
To dissociate these alternatives we designed a task that temporally separated reward informa-
tion, motor behavior and reward delivery (Joshua and Lisberger, 2012). We found that climbing
fiber activity encoded the expected reward size seconds before the reward delivery. Reward size did
not modulate activity at reward delivery. Furthermore, reward expectation did not modulate the
Cspk tuning of eye movement parameters. These results suggest the Cspk reward signal encodes
changes in the prediction of future reward. During the cue, the modulation in the Cspk and Sspk
rates of cells were uncorrelated, in contrast to the negative correlation reported in the context of
error correction learning (Gilbert and Thach, 1977) or the coding of movement parameters
(Ojakangas and Ebner, 1994; Stone and Lisberger, 1990). This suggests that Cspk modulation of
the Sspk rate could be restricted to certain network states. Overall our findings imply that the cere-
bellum receives signals that could allow it to perform both error and reward-based associative learn-
ing, thus going beyond the accepted role of the cerebellum in error correction to suggest a general
role in associative learning.
Results
Complex spikes encode the size of the expected reward
Monkeys performed a smooth pursuit eye movement task in which we manipulated the expected
reward size (Joshua and Lisberger, 2012; Figure 1A). At the start of each trial, the monkey fixated
on a white spot. The spot then changed to one of two colors, indicating whether a large or small
reward would be given upon successful completion of the trial. After a variable delay, the colored
Figure 1. Smooth pursuit eye-movement task. (A) Eye movement task temporally separates reward expectation,
pursuit behavior and reward delivery. (B) Traces of average eye speed, in the first 300 ms after target motion
onset. Target velocity was 20 ˚/s. (C) Each dot represents the average speed for an individual session 250 ms after
target movement onset for the large (horizontal) and small (vertical) reward cue (Signed-rank, p = 8.6*10 24,
n = 208).
DOI: https://doi.org/10.7554/eLife.46870.002
The following figure supplements are available for figure 1:
Figure supplement 1. Monkeys associate reward size with target color.
DOI: https://doi.org/10.7554/eLife.46870.003
Figure supplement 2. MRI and examples of extracellular recordings of Cspks.
DOI: https://doi.org/10.7554/eLife.46870.004
Larry et al. eLife 2019;8:e46870. DOI: https://doi.org/10.7554/eLife.46870 2 of 16Research article Neuroscience
target began to move in one of eight directions and the monkey had to accurately track it. At the
end of a successful trial, the monkey received either a large or a small reward, as indicated by the
color of the cue. To suppress catch-up saccades in the time immediately after the onset of the target
movement, the movement of the target was preceded by an instantaneous step in the opposite
direction (step-ramp). Thus, when the monkey began tracking, the target was close to the eye posi-
tion and there was no need for fast corrective eye movements (Rashbass and Westheimer, 1961).
The average eye velocity during tracking of the large reward target was faster and more similar
to the target velocity than the tracking of the small reward target (Figure 1B). This difference was
clearly apparent even at the single session level. In most sessions, the average eye velocity of 250
ms following motion onset was larger when the expected reward was large (Figure 1C). This behav-
ioral difference and the selection of the larger reward target in an additional choice task (Figure 1—
figure supplement 1) indicate that the monkeys associated the reward size with the color of the tar-
get. During the task, we recorded neural activity from the flocculus complex and neighboring areas
(Figure 1—figure supplement 2). Our recordings included neurons that responded to eye move-
ments and neurons that did not. Our task design allowed us to separately analyze the Cspk rate fol-
lowing cue presentation, during pursuit, and following reward delivery.
Following cue presentation, we found that many Purkinje cells (40 out of 220) had different Cspk
rates in the different reward conditions. Of these, the vast majority (34 cells) transiently increased
their Cspk rate when the expected reward was large but not when the expected reward was small
Figure 2. Cspk rate differentiates reward conditions during cue presentation. (A) Raster plot of an example cell in
the two reward conditions, aligned to cue presentation. (B) PSTH of the cell in A. (C) Histogram of the number of
Cspks that occurred in the 100–300 ms time window following cue presentation, in the same example cell. (D)
Population PSTH. In all figures the error bars represent SEM. (E), Each dot represents the average Cspk rate of an
individual cell 100–300 ms after the display of the large (horizontal) and small (vertical) reward cue (Signed-rank,
Monkey B: p = 0.01, n = 148, Monkey C: p = 3.35*10 4, n = 72). (F) Histogram of the number of Cspks that
occurred in the 100–300 ms time window following cue presentation, in the entire population (fraction of trials with
1 Cspks: Signed-rank, p = 5.1*10 4, n = 40; fraction of trials with two Cspks: Signed-rank, p = 0.03, n = 40).
DOI: https://doi.org/10.7554/eLife.46870.005
The following figure supplement is available for figure 2:
Figure supplement 1. Fraction of trials with Cspks following the cue presentation is higher in the large reward
condition than in the small reward condition.
DOI: https://doi.org/10.7554/eLife.46870.006
Larry et al. eLife 2019;8:e46870. DOI: https://doi.org/10.7554/eLife.46870 3 of 16Research article Neuroscience
(example in Figure 2A–C). This difference was apparent when examining the population average
Cspk peri-stimulus time histogram (PSTH). After the color cue appeared, the population average
Cspk rate was higher when the expected reward was large, as can be seen by the difference in the
PSTHs of the two reward conditions (Figure 2D). At the single cell level, most cells had a higher
Cspk rate on large reward trials than on small reward trials (Figure 2E, most dots lie beneath the
identity line). Thus, the Cspk rate was modulated by changes in reward expectation, at times tempo-
rally distinct from the behavioral effect on pursuit eye movements and reward delivery. This change
of rate reflects mostly an increase in the number of trials with a single Cspk following the cue, and a
minor increase in the number of trials with multiple Cspks (Figure 2C,F and Figure 2—figure sup-
plement 1).
Complex spikes do not encode reward size at reward delivery
The population Cspk rate was only affected by reward size when information regarding future
reward was given, but not during the reward itself. During reward delivery, the PSTHs of the two
conditions overlapped (Figure 3A), indicating a similar population response for the large and small
rewards. When examining the responses of single cells, the Cspk rate was similar in the two reward
conditions (Figure 3B, most cells fell close to the identity line). To compare the temporal pattern of
the reward size encoding at cue and reward delivery, we calculated the difference in PSTHs between
the large and small reward conditions (Figure 3C). The difference between large and small rewards
rose steeply shortly after the color cue appeared. In sharp contrast, following reward delivery, there
was only a small rate fluctuation that resembled the fluctuation prior to reward delivery. At the single
cell level, there was no correlation between cell encoding of reward size during the cue and during
reward delivery. For both the full population and for the subpopulation of neurons significantly cod-
ing the reward size at cue, the correlation between cue and reward delivery epochs was not signifi-
cant (Figure 3D). This indicates that Purkinje cells that differentiated reward conditions during the
cue did not differentiate between them during delivery.
We ruled out the possibility that differences in licking behavior were responsible for the Cspk
rate modulations. The pattern of licking (Figure 3E,F) and Cspk rate was completely different. Lick-
ing but not spiking increased at reward delivery. Further, after cue onset, licking in both reward con-
ditions decreased whereas the temporal pattern of Cspks was different between reward conditions
(Figure 2D). In approximately half of the recording sessions, we recorded licking behavior along
with our electrophysiological recordings. For the cells that discriminated between reward conditions
in these sessions (n = 21), the population PSTH showed a difference between reward conditions
both in trials that included a lick immediately following the cue and trials that did not (Figure 3—fig-
ure supplement 1A,B). We also approximated the contribution of licking to the Cspk rate (Fig-
ure 3—figure supplement 1C,D). This contribution was negligible and was not different for large
and small rewards.
We conducted a similar analysis for saccades and microsaccades. The pattern of saccades and
microsaccades also differed from the Cspk pattern (Figure 3—figure supplement 2A,B). Saccades
but not spiking increased following reward delivery. After cue presentation, fixational saccades were
modulated by reward (Joshua et al., 2015), but this modulation did not affect the Cspk response to
the cue (Figure 3—figure supplement 2C,D). The cells that discriminated between the large and
small rewards after cue presentation responded similarly in trials with and without saccades. Similar
to licking, the approximated contribution of saccades to the Cspk rate was small and did not differ
between reward conditions (Figure 3—figure supplement 2E,F). We also ruled out the possibility
that differences in saccade velocity or direction could explain our results (not shown).
Complex spike coding of target motion does not depend on reward
size
Overall, these results indicate that the Cspk rate differentiates between reward sizes when reward
information is first made available, but not during delivery. However, Cspks are also tuned to the
direction of target motion (Kobayashi et al., 1998; Stone and Lisberger, 1990). According to the
error signal model, this tuning is a result of image motion on the retina that is caused by the mis-
match between target and eye motion (retinal slip). Our sample contained cells that were direction-
ally tuned and not cue responsive (21 cells, example in Figure 4—figure supplement 1A–C), cells
Larry et al. eLife 2019;8:e46870. DOI: https://doi.org/10.7554/eLife.46870 4 of 16Research article Neuroscience
Figure 3. Cspk is not modulated by reward size during reward delivery. (A) Population PSTHs for different reward
conditions aligned to reward delivery. (B) Each dot represents the average Cspk rate of an individual cell 100–300
ms large (horizontal) and small (vertical) reward delivery (Signed-rank, Monkey B: p = 0.339, n = 148; Monkey C:
p = 0.719, n = 72). (C) The differences between the PSTH for large and small rewards aligned to cue or to reward
delivery. (D) Each dot represents the average Cspk rate of an individual cell 100–300 ms after the cue (horizontal)
and reward delivery (vertical; Spearman correlation of all cells: r = 0.069, p = 0.304, n = 220; Spearman
correlation of cells that responded to reward size during cue: r = 0.056, p = 0.727, n = 40). (E) and (F) Fraction of
trials with licks, during cue and reward delivery.
DOI: https://doi.org/10.7554/eLife.46870.007
The following figure supplements are available for figure 3:
Figure supplement 1. Licking behavior does not underpin the Cspk rate difference during the cue.
DOI: https://doi.org/10.7554/eLife.46870.008
Figure supplement 2. Saccades and microsaccades do not underpin the Cspk rate difference during the cue.
DOI: https://doi.org/10.7554/eLife.46870.009
that were cue responsive and not directionally tuned (28 cells, example in Figure 4—figure supple-
ment 1D–F) and cells that were both (12 cells, example in Figure 4—figure supplement 1G–I).
To determine how Cspk coding of target direction is affected by reward expectation, we focused
on directionally tuned cells (33 cells, Figure 4A,B). When we examined the Cspk rate in the pre-
ferred direction (PD) of the cell and the direction 180˚ to it (the null direction), we did not find signifi-
cant differences in the Cspk rate between reward conditions (Figure 4C). We aligned the cells to
their PD and calculated a population tuning curve for each reward condition. The tuning curves over-
lapped and were not significantly different (Figure 4D).
Larry et al. eLife 2019;8:e46870. DOI: https://doi.org/10.7554/eLife.46870 5 of 16Research article Neuroscience
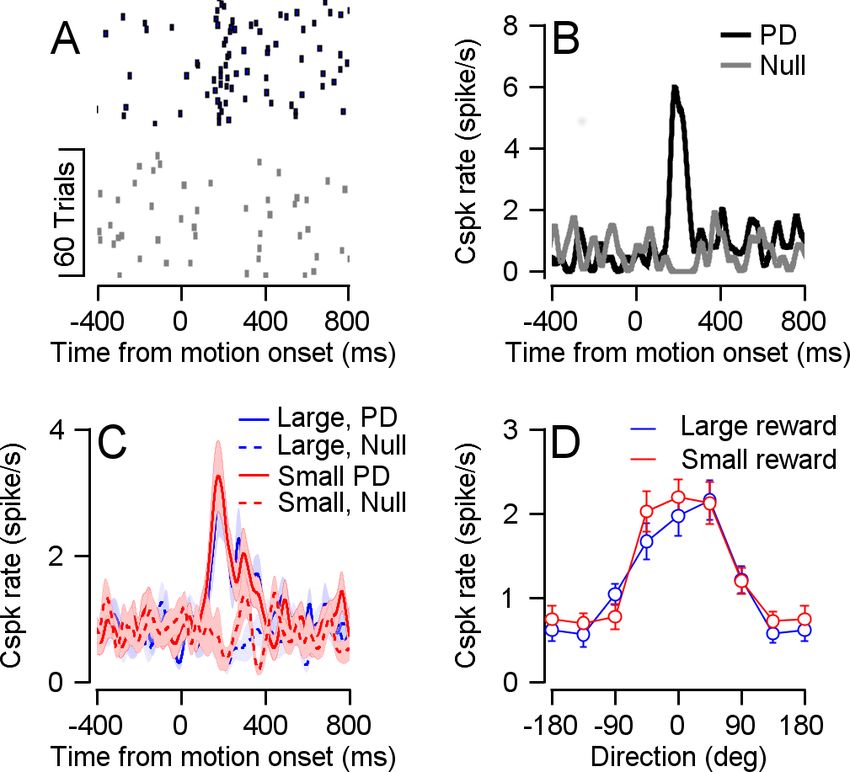
Figure 4. Reward did not modulate Cspk direction tuning. (A) Raster plot of an example cell in its preferred (black)
and null (gray) directions, aligned to target movement onset. (B) PSTH of the cell in A. (C) Population PSTH for
different reward conditions, in the preferred (solid) and null (dashed) directions. (D) Population direction tuning
curve (Permutation test: p = 0.2156, n = 33).
DOI: https://doi.org/10.7554/eLife.46870.010
The following figure supplements are available for figure 4:
Figure supplement 1. Examples of cells Cspk responses to cue and target movement.
DOI: https://doi.org/10.7554/eLife.46870.011
Figure supplement 2. Retinal slip due to drift eye movement does not underpin the Cspk rate difference during
the cue.
DOI: https://doi.org/10.7554/eLife.46870.012
We also examined the modulation of reward on Cspk rate at different eye velocities. We per-
formed an additional speed task in which we manipulated the target speed (5, 10 or 20 ˚/s). Eye
velocity corresponded to the speed of the target (Figure 5A). The effect of expected reward size on
eye velocity was evident for all speeds at the average and the single session level (Figure 5A,B).
Whereas cells responded to the target movement onset (Figure 5C), reward expectation did not
modulate their response (Figure 5D). Together with the directional tuning results, this shows that
encoding of reward is limited to the time point at which the reward size is first signaled and not the
time when reward drives changes in behavior. Note that the rate of the Cspks did not increase
monotonically with target speed (Figure 5C and D); we return to this point in the discussion.
Small drift eye movements during fixation can result in retinal slip (Figure 4—figure supplement
2A,B). Since Cspks respond to slow visual motion (Guo et al., 2014; Hoffmann and Distler, 1989),
it is possible that the reward size modulation during the cue arose from a retinal slip driven by the
appearance of the cue. However, since many of the cells that responded to the cue did not respond
during target motion (24 cells), this does not seem to have been the case. Furthermore, we could
not find a relationship between drift size or direction and the occurrence of Cspks. Specifically, the
drift was similar between trials with and without a Cspk (Figure 4—figure supplement 2C,D). Align-
ing the drift following the cue to the occurrence of a Cspk resulted in a flat line around zero (Fig-
ure 4—figure supplement 2E), indicating that Cspks were not preceded by increased retinal slip.
Finally, when calculating the Cspk responses to the cue separately for trials in which the drift was in
the preferred or the null direction of the cell we observed no differences (Figure 4—figure supple-
ment 2F).
Larry et al. eLife 2019;8:e46870. DOI: https://doi.org/10.7554/eLife.46870 6 of 16Research article Neuroscience
Figure 5. Cspk rate was not modulated by reward size at target motion onset in the speed tuning task. (A)
Average eye velocity traces for experiments in which the color cue signaled a large (blue) or small (red) reward and
the target speed was 5 ˚/s, 10 ˚/s and 20 ˚/s. Slower traces correspond to slower target speeds. Dotted lines
represent target velocity. (B) Individual session average eye velocity 250 ms after target movement onset for large
(horizontal) and small (vertical) reward, in the different target velocity conditions (Signed-rank: p = 6*10 16, n = 56).
(C) population PSTHs of cells in their PD for the different speed conditions. (D) Population speed tuning curve in
the PD (solid) and null (dashed) directions (Permutation test: p = 0.4541, n = 16).
DOI: https://doi.org/10.7554/eLife.46870.013
The relationship between simple and complex spikes is different for
reward and direction tuning
Given that Cspks were modulated by reward size following cue presentation, we went on to examine
the Sspk modulations that occur concurrently. Preparatory activity following cues that predict reward
or movement had been found in the cerebellum both at the level of the inputs that modulate Sspk
rate (Wagner et al., 2017) and at the level of their output (Chabrol et al., 2019; Gao et al., 2018).
Recently it was shown that Sspk rate decreases when behavior leads to a reward (Chabrol et al.,
2019). Within the cells we recorded, Sspk responses to cue presentation were heterogeneous (Fig-
ure 6, examples in A-C). We found some cells that elevated their Sspk rate in the large versus small
reward conditions (Figure 6A), others where activity was lower in the large reward condition
(Figure 6B) and cells in which responses were similar in the large and small reward conditions
(Figure 6C). Overall, we found more cells in which the Sspk rate was larger for the large reward con-
dition (Figure 6D, blue line). However, in a substantial number of cells the Sspk rate was larger for
the small reward (Figure 6D, red line). As a result of the opposite modulation, at the population
level, the difference in Sspk between large and small reward mostly averaged out (Figure 6E,F).
The directionally tuned Cspk signal has been linked to the coding of visual errors that instruct
motor learning (Medina and Lisberger, 2008; Nguyen-Vu et al., 2013) by changing the Sspk
response to parallel fiber inputs. Cspks generate plasticity in parallel fiber synapses leading to a
decrease in the Sspk rate (Ekerot and Kano, 1985). This plasticity is thought to underlie the oppo-
site modulations of simple and complex spike rates on different tasks (Badura et al., 2013;
Gilbert and Thach, 1977; Stone and Lisberger, 1990). The consistently larger response to the
larger reward in the Cspk (Figure 2) versus the heterogeneous Sspk response (Figure 6), suggests
Larry et al. eLife 2019;8:e46870. DOI: https://doi.org/10.7554/eLife.46870 7 of 16Research article Neuroscience
Figure 6. Sspk modulations following cue presentation. (A-C) Examples of cells’ Sspks responses to cue
presentation in each reward condition. (D) Fraction of cells with a higher Sspk rate in the large reward condition
(blue) or small reward condition (red) as a function of time. The dashed line represents the 0.05 false positive
chance level. (E) Population PSTH, the average Sspk rate of each cell was subtracted. (F) Each dot represents the
average Sspk rate of an individual cell 100–300 ms following large (horizontal) and small (vertical) reward delivery
(Signed-rank, Monkey B: p = 0.142, n = 155; Monkey C: p=0.09, n = 75).
DOI: https://doi.org/10.7554/eLife.46870.014
that the expected opposite modulation between Cspk and Sspk found in relation to movement does
not hold for reward related signals.
To test the relationship between Cspks and Sspks directly we compared the rate modulation in
the same cell. In our sample of cells, we found the expected opposite modulations during move-
ment. When we aligned the Cspk tuning curve to the preferred direction of the Sspks of the same
cell, we found that the Cspk rate decreased in directions for which the Sspk rate increased
(Figure 7A). To examine whether this effect existed at the single cell level, we calculated the signal
correlation for the complex and simple spikes which we defined as the correlation between simple
and complex direction tuning curves. We found that most signal correlations were negative; in other
words, the Cspks and Sspks were oppositely modulated during movement in most cells (Figure 7B).
This effect disappeared when we shuffled the phase of the Cspk tuning curve or assigned direction
labels randomly (see Materials and methods).
Unlike movement related modulation, the complex and simple spikes were not oppositely modu-
lated following cue presentation (Figure 7C,D). If reward-related modulations in Cspks drive Sspk
attenuation, we would expect that the higher Cspk rate in the large reward condition would result in
a stronger attenuation of Sspks. This would lead to a negative correlation between the complex and
simple spike reward modulations during the cue. However, we found that simple and complex spike
modulations following cue presentation were uncorrelated (Figure 7C). As we observed cells that
changed their Sspk rate after the cue without differentiating between reward conditions, we also cal-
culated the correlation between Cspk reward condition modulations and the change in Sspk rate fol-
lowing the cue. In this case as well, we did not find any correlation (Figure 7D). Further, the
correlations were not significantly different from zero whether we analyzed the full population or
only those cells whose Cspks were significantly tuned to reward size during the cue. Thus, the way
the difference in Cspk rate during cue affects Sspk encoding and behavior may differ from the one
suggested by the error signal model.
Larry et al. eLife 2019;8:e46870. DOI: https://doi.org/10.7554/eLife.46870 8 of 16Research article Neuroscience
Figure 7. Cspk rate negatively correlated with Sspk rate during movement but not during cue presentation. (A)
Population tuning curve of Cspks (up) and Sspks (bottom), both aligned to the preferred direction of Sspks
(Spearman r = 0.3087, p = 7*10 7, n = 31). (B) Histogram of signal correlations of simple and complex spikes in
the population. Solid and dashed lines show the correlations for phased and direction shuffled data (Signed-rank:
p=0.002, n = 31). (C) Each dot shows individual cell differences in average rate between reward conditions 100–
300 ms after cue, in Cspks (horizontal) and Sspks (vertical; Spearman correlation of all cells r = 0.07, p = 0.32,
n = 172; Spearman correlation of cells that responded to reward size during cue: r = 0.003, p = 0.98, n = 30) (D)
Similar to C the horizontal position of each dot shows individual cell differences in average Cspk rate between
reward conditions 100–300 ms after cue. The vertical axis shows the difference in Sspk firing rate in the time
window 100–300 ms after the cue and 100–300 ms before the cue (vertical; Spearman correlation of all cells
r = 0.03, p = 0.63, n = 172; Spearman correlation of cells that responded to reward size during cue: r = 0.19,
p = 0.31, n = 30).
DOI: https://doi.org/10.7554/eLife.46870.015
Discussion
The difference in Cspk rate during cue presentation and the lack of difference during reward delivery
and pursuit behavior implies that Cspks can act as a reward prediction signal. This finding diverges
from the accepted error signal model. The coding of predictive stimuli has been reported in Cspks
in the context of error-based learning (Ohmae and Medina, 2015). Together with the current
results, this suggests a more general role for the cerebellum in associative learning, when learning is
both error and reward based (Heffley and Hull, 2019; Kostadinov et al., 2019; Thoma et al.,
2008; Wagner et al., 2017). The similar Cspk response to the different reward sizes during reward
delivery implies that the Cspk coding of reward is not related to reward consumption behavior and
does not represent the successful completion of the trial. As we did not observe a reward effect on
Cspk rate during pursuit eye movements, when the retinal slip was the largest, our results do not
support reward modulation of the Cspk error signal.
Plasticity and learning from rewards in the cerebellum
Error-based models of the cerebellum link the cerebellar representation of movement, plasticity
mechanisms and learning. In this framework, the behavioral command of the cerebellar cortex in
response to a stimulus is represented by the Sspk rate of Purkinje cells. Cspks lead to a reduction in
the synaptic weight in recently active parallel fibers and thereby change the Sspk rate in response to
Larry et al. eLife 2019;8:e46870. DOI: https://doi.org/10.7554/eLife.46870 9 of 16Research article Neuroscience
similar parallel fiber input (Ekerot and Kano, 1985). This change in the Sspk rate is hypothesized to
alter the behavioral response to the same stimulus. Thus, when errors occur, the behavior that led to
them is eliminated. The same logic cannot apply to learning from rewards since reward strengthens
rather than eliminates the behavior that led to the reward (Thorndike, 1898).
Consistent with this reasoning, we found that reward-related modulation of Cspks did not exhibit
the classical decrease in Sspk activity associated with Cspk activity (Figure 7). This result suggests
that on our task, other plasticity rules might mask or override the depression. Research on the cere-
bellum has identified many other sites in which plasticity might drive changes in neuronal activity
(Gao et al., 2012; Jörntell and Ekerot, 2002). Furthermore, the Cspk dependent plasticity in the
parallel fibers might also change sign as a result of the network state (Rowan et al., 2018). Thus,
our results suggest that such mechanisms are engaged when Cspks are modulated by reward.
The Cspk reward signal does not seem to affect cerebellar computation through the same rela-
tively well-understood mechanisms of the Cspk error signal. We also did not find an effect of reward
on the Cspk signal during behavior. Thus, the influence of the Cspk reward signal to behavior
remains unclear. Moving beyond the level of representation to a mechanistic understanding of the
effect of the Cspk reward signal on cerebellar computation and behavior is a crucial next step.
Relationship to previous studies of the smooth pursuit system
A further demonstration of the existence of independent mechanisms for learning from reward and
sensory errors emerges when combining the current results with our recent behavioral study
(Joshua and Lisberger, 2012). In that study, monkeys learned to predict a change in the direction
of target motion by generating predictive pursuit movements. The size of the reward did not modu-
late the learning process itself but only the execution of the movement (Joshua and Lisberger,
2012). The critical signal for direction change learning has been shown to be the directionally tuned
Cspk signal (Medina and Lisberger, 2008). Our findings that the target direction signal is not modu-
lated by reward provides a plausible explanation at the implementation level for this behavioral find-
ing. The directionally tuned Cspks that drive learning are not modulated by reward; therefore,
learning itself is reward independent.
In the current study, the Cspk rate did not increase with target speed (Figure 5). At least one
study has reported a monotonic increase between Cspk rate and motion speed (Kobayashi et al.,
1998). The specific experimental protocol we used might have led to the lack of speed coding. The
vast majority of trials in which the monkeys were engaged were at 20 ˚/s, and we only measured
responses at different speeds in a minority of the sessions (see Materials and methods). Therefore, it
is possible that the monkey developed a speed prior (Darlington et al., 2018) and hence was
expecting the target to move at 20 ˚/s. Violation of this prior in the slower motion trials might have
potentiated the response and masked the speed tuning. Behavioral support for such a prior comes
from the eye speed response to low speed targets (5 ˚/s) in which the eye speed overshot the target
speed (Figure 5A,B). Other possibilities such as the recorded population or the properties of the
visual stimuli might also have contributed to the lack of speed tuning.
Future directions
The reward signal we found is similar to reward expectation signals in dopaminergic neurons of the
ventral tegmental area (VTA) and substantia nigra pars compacta (Schultz et al., 1997). The VTA
projects to the inferior olive (Fallon et al., 1984) and recently, direct projections from the cerebel-
lum to dopaminergic neurons in the VTA have been found (Carta et al., 2019). Reward signals have
also been found in cerebellar granular cells that modulate the Sspk rate in Purkinje cells
(Wagner et al., 2017) and in the deep cerebellar nuclei (Chabrol et al., 2019). Researching the dif-
ferences and interactions of reward signals is an important next step in understanding how reward is
processed. In particular, future research will need to investigate the source of the reward information
in the inferior olive.
Another interesting question is whether the Cspk representation of reward depends on the range
of possible rewards. Our results demonstrate that the Cspk rate is informative of future reward size.
Expected reward size might be represented in the cerebellum in an absolute manner, based on its
physical size, or in relative order, based on its motivational value in comparison to other available
rewards (Cromwell et al., 2005; Tremblay and Schultz, 1999). Our results show that when a small
Larry et al. eLife 2019;8:e46870. DOI: https://doi.org/10.7554/eLife.46870 10 of 16Research article Neuroscience
reward cue is presented, there is no increase in the Cspk rate (Figure 2D). Although this cue pre-
dicts a future reward, it does not elicit a Cspk response. This hints that the Cspk representation may
be relative and not absolute. To further verify this, we need to construct a task in which we examine
the same reward size in different contexts.
Conclusion
To sum up, the current study demonstrates that a population of Purkinje cells receive a reward pre-
dictive signal from the climbing fibers. Our results show that the reward signal is not limited to the
direct rewarding consequences of the behavior. These results thus suggest that the cerebellum
receives information about future reward size. Our results go beyond previous findings of cerebellar
involvement in the elimination of undesired behavior, to suggest that the cerebellum receives the
relevant information that could allow it to adjust behavior to maximize reward.
Materials and methods
We collected neural and behavioral data from two male Macaca Fascicularis monkeys (4–5 kg). All
procedures were approved in advance by the Institutional Animal Care and Use Committees of the
Hebrew University of Jerusalem and were in strict compliance with the National Institutes of Health
Guide for the Care and Use of Laboratory Animals. We first implanted head holders to restrain the
monkeys’ heads in the experiments. After the monkeys had recovered from surgery, they were
trained to sit calmly in a primate chair (Crist Instruments) and consume liquid food rewards (baby
food mixed with water and infant formula) from a tube set in front of them. We trained the monkeys
to track spots of light that moved across a video monitor placed in front of them.
Visual stimuli were displayed on a monitor 45 cm from the monkeys’ eyes. The stimuli appeared
on dark background in a dimly lit room. A computer performed all real-time operations and con-
trolled the sequences of target motions. The position of the eye was measured with a high temporal
resolution camera (1 kHz, Eye link - SR research) and collected for further analysis. Monkeys received
a reward when tracking the target successfully.
In subsequent surgery, we placed a recording cylinder stereotaxically over the floccular complex.
The center of the cylinder was placed above the skull targeted at 0 mm anterior and 11 mm lateral
to the stereotaxic zero. We placed the cylinder with a backward angle of 20˚ and 26˚ for monkey B
and C respectively. Quartz-insulated tungsten electrodes (impedance of 1–2 Mohm) were lowered
into the floccular complex and neighboring areas to record simple and complex spikes using a Mini-
Matrix System (Thomas Recording GmbH). When lowering the electrodes, we searched for neurons
that responded during pursuit eye movements (see direction task) but often collected data from
neurons that did not respond to eye movements. Overall, we recorded complex spikes from 148
and 72 neurons from monkeys B and C respectively. Of these, the Sspks of 28 and 19 neurons from
monkeys B and C were directionally tuned during the direction task (Kruskal-Wallis test, a = 0.05).
Signals were digitized at a sampling rate of 40 kHz (OmniPlex, Plexon). For the detailed data anal-
ysis, we sorted spikes offline (Plexon). For sorting, we used principal component analysis and cor-
rected manually for errors. In some of the cells the Cspks had distinct low frequency components
(Warnaar et al., 2015; Zur and Joshua, 2019; for example Figure 1—figure supplement 2B, left
column and Figure 2—figure supplement 1). In these cells, we used low frequency features to iden-
tify and sort the complex spikes. We paid special attention to the isolation of spikes from single neu-
rons. We visually inspected the waveforms in the principal component space and only included
neurons for further analysis when they formed distinct clusters. Sorted spikes were converted into
timestamps with a time resolution of 1 ms and were inspected again visually to check for instability
and obvious sorting errors.
We used eye velocity and acceleration thresholds to detect saccades automatically and then veri-
fied the automatic detection by visual inspection of the traces. The velocity and acceleration signals
were obtained by digitally differentiating the position signal after we smoothed it with a Gaussian fil-
ter with a standard deviation of 5 ms. Saccades were defined as an eye acceleration exceeding 1000
˚/s2, an eye velocity crossing 15 ˚/s during fixation or eye velocity crossing 50 ˚/s while the target
moved. To calculate the average of the smooth pursuit initiation we first removed the saccades and
treated them as missing data. We then averaged the traces with respect to the target movement
direction. Finally, we smoothed the traces using a Gaussian filter with a standard deviation of 5 ms.
Larry et al. eLife 2019;8:e46870. DOI: https://doi.org/10.7554/eLife.46870 11 of 16Research article Neuroscience
We also recorded licking behavior to control for behavioral differences between reward conditions
that might confound our results. Licks were recorded using an infra-red beam. Monkey B tended not
to extend its tongue, therefore we recorded lip movements.
Experimental design
Direction task
Each trial started with a bright white target that appeared in the center of the screen (Figure 1A).
After 500 ms of presentation, in which the monkey was required to acquire fixation, a colored target
replaced the fixation target. The color of the target signaled the size of the reward the monkey
would receive if it tracked the target. For monkey B we used blue to signal a large reward (~0.2 ml)
and red to signal a small reward (~0.05 ml); for monkey C we used yellow to signal a large reward
and green to signal a small reward. After a variable delay of 800–1200 ms, the targets stepped in
one of eight directions (0˚, 45˚, 90˚, 135˚, 180˚, 225˚, 270˚, 315˚) and then moved in the direction 180˚
from it (step-ramp, Rashbass and Westheimer, 1961). For both monkeys, we used a target motion
of 20 ˚/s and a step to a position 4˚ from the center of the screen. The target moved for 750 ms and
then stopped and stayed still for an additional 500–700 ms. When the eye was within a 3 3 degree
window around the target the monkey received a juice reward.
Speed task
During the direction task we online fitted a Sspk tuning curve for each cell and approximated the
cell’s PD. If a cell seemed directionally tuned, we ran an additional speed task. The temporal struc-
ture of the speed task was the same as the direction task. The step size was set to minimize saccades
and was 1˚, 2˚ and 4˚ for a target speed of 5, 10 or 20 ˚/s. The targets could move either in the
approximate PD of the cell or the direction 180˚ from it, which we termed the null direction. The tar-
gets moved at 5, 10 or 20 ˚/s.
Choice task
Monkeys were required to choose one of two targets (large or small reward) presented on the
screen (Figure 1—figure supplement 1A). We used this task to determine whether the monkeys
correctly associated the color of the target and the reward size (Figure 1—figure supplement 1B).
Their choice determined the amount of reward they received. Each trial began with a 500 ms fixation
period, similar to the tasks described previously. Then two additional colored spots appeared at a
location eccentric to the fixation target. One of the colored targets appeared 4˚ below or above the
fixation target (vertical axis) and the other appeared 4˚ to the right or left of the fixation target (hori-
zontal axis). The monkey was required to continue fixating on the fixation target in the middle of the
screen. After a variable delay of 800–1200 ms, the white target disappeared, and the colored targets
started to move towards the center of the screen (vertically or horizontally) at a constant velocity of
20 ˚/s. The monkey typically initiated pursuit eye movement that was often biased towards one of
the targets (Figure 1—figure supplement 1C). After a variable delay, the monkeys typically made
saccades towards one of the targets. We defined these saccades as an eye velocity that exceeded
80 ˚/s. The target that was closer to the endpoint of the saccade remained in motion for up to 750
ms and the more distant target disappeared. The monkey was required to track the target until the
end of the trial and then received a liquid food reward as a function of the color of the target.
Data analysis
All analyses were performed using Matlab (Mathworks). When comparing reward conditions, we
only included cells that were recorded for a minimum of 20 trials (approximately 10 for each condi-
tion). When performing analyses that included additional variables such as target direction or veloc-
ity, we set a minimum of 50 trials (approximately 3–4 for each condition).
To study the time varying properties of the response, we calculated the PSTH at a 1 ms resolu-
tion. We then smoothed the PSTH with a 10 ms standard deviation Gaussian window, removing at
least 100 ms before and after the displayed time interval to avoid edge effects. Note that this proce-
dure is practically the same as measuring the spike count per trial in larger time bins. We defined
cells that responded significantly differently to reward conditions during the cue using the rank-sum
test on the mean number of spikes 100–300 ms after cue onset.
Larry et al. eLife 2019;8:e46870. DOI: https://doi.org/10.7554/eLife.46870 12 of 16Research article Neuroscience
To calculate the tuning curves, we averaged the responses in the first 100–300 ms of the move-
ment. We calculated the preferred direction of the neuron as the direction that was closest to the
vector average of the responses across directions (direction of the center of mass). We used the pre-
ferred direction to calculate the population tuning curve by aligning all the responses to the pre-
ferred direction. We defined a cell as directionally tuned if a one-way Kruskal-Wallis test (the case of
8 directions, directions task), or a rank-sum test (the case of two directions, speed task), revealed a
significant effect for direction. We present reward modulation on movement parameters only for
directionally tuned cells and also confirmed that if we took the full population there was no reward
modulation at motion onset (Signed-rank: Monkey B, p = 0.8904, n = 148; Monkey C, p = 0.4487,
n = 72).
To statistically test the significance of the effect of reward direction tuning we used a permutation
test. We first calculated separate tuning curves for each cell in the two reward conditions. We then
chose a random subset of combinations of cells and directions and reversed the small and large
reward labels of this subset. We then calculated the population PSTHs for the shuffled ‘small’ and
‘large’ reward conditions. Our statistic was the mean square distance of the two tuning curves. We
used the percentile of the statistic of the unshuffled data to calculate the p-value. We used a similar
test for the speed task in which the subset we chose was a random combination of cell, direction
and speed.
We calculated the fraction of cells whose Sspk rate was different between reward conditions as a
function of time (Figure 6D) by using left and right-tailed rank-sum tests on a moving time window.
For each cell, we looked for time points in which there were significantly more Sspks in the large
reward trials in comparison to the small (RL > RS) and time points in which there were significantly
more Sspks in the small reward trials in comparison to the large (RS > RL). We tested each time point
by calculating the number of Sspks in each trial in time bins of 200 ms surrounding it. We then tested
if the number of Sspks in large reward trials was significantly different using both left and right
signed-rank test. We classified that time point as RL > RS, RS > RL or neither according to the result
of the tests. We then calculated the fraction of cells in each category for every time point.
We calculated the signal correlation of each cell’s Cspks and Sspks by calculating a tuning curve
of each spike type and computing the Pearson correlation of the tuning curves (Figure 7B). As a
control, we performed the same analysis on shuffled data. In the phase shuffled control, we shuffled
the Cspk tuning curves by different phases while preserving their relative order. For example, shuf-
fling by a phase of 45˚ meant moving the response at 0˚ to 45˚, 45˚ to 90˚, 315˚ to 0˚ and so on. In
the direction shuffle, we assigned random direction labels to the Cspk responses.
We calculated the cross-correlation of complex and simple spikes (Figure 1—figure supplement
2D) by calculating the PSTH of Sspks aligned to a Cspk event. We removed Cspks that occurred less
than 100 ms after the trial began or less than 100 ms before a trial ended since we did not have suffi-
cient information to calculate the PSTH. We manually removed spikes that were detected 1 ms
before a Cspk or 2 ms after, because occasionally they could not be distinguished from Cspk
spikelets.
To control for the direct responses to licking we approximated the contribution of the Cspk
response to licking (Figure 3—figure supplement 1D) to the Cspk response to cue. We first calcu-
lated the peri-event time histogram (PETH) of each cell aligned to lick onset without separating the
reward conditions (Figure 3—figure supplement 1C). Then, for every trial, we created synthetic
data in which the firing rate around each lick onset was set to the average lick triggered PETH. Firing
rates during times that were outside the range of the PETH (300 ms) were treated as missing data.
We then averaged these single trial estimations of the firing rate to calculate the predicted PSTH for
each reward condition, aligned to cue presentation. We performed a similar analysis for lick offset
(Figure 3—figure supplement 1D, dashed line) and saccades (Figure 3—figure supplement 2F).
To control for the response to retinal slip following cue presentation, we calculated the vertical
and horizontal drift. Drift velocity during fixation is small and thus eye tracker measurements of drift
movements are prone to measurement noise. We noted that a large fraction of the variance in drift
position is explained by changes in pupil size (R2 vertical median = 0.94, R2 horizontal median = 0.17,
n = 208; Kimmel et al., 2012). To examine differences in the drift between reward conditions inde-
pendently of pupil size, we fitted a linear model between pupil size and eye position for the aver-
ages of each recording session. We subtracted the position predicted by pupil size from the
measured position for each trial and performed further analyses on these corrected traces.
Larry et al. eLife 2019;8:e46870. DOI: https://doi.org/10.7554/eLife.46870 13 of 16Research article Neuroscience
We did not correct for multiple comparisons in our analysis. We either used a small number of
tests over the entire population or a large number of tests on individual cells that were only used as
a criterion (for example, whether a cell differentiated between reward conditions during the cue).
When using a test as a criterion we did not infer the existence of responsive cells but rather used it
to classify cells into subpopulations.
Acknowledgements
We thank Y Botschko for technical assistance. This study was supported by a HFSP career develop-
ment award, the Israel Science Foundation and the European Research Council.
Additional information
Funding
Funder Grant reference number Author
H2020 European Research imove 755745 Mati Joshua
Council
Human Frontier Science Pro- CDA 00056 Mati Joshua
gram
Israel Science Foundation 38017 Mati Joshua
The funders had no role in study design, data collection and interpretation, or the
decision to submit the work for publication.
Author contributions
Noga Larry, Conceptualization, Formal analysis, Investigation, Visualization, Methodology, Writing—
original draft, Writing—review and editing; Merav Yarkoni, Conceptualization, Data curation,
Investigation, Methodology, data acquisition; Adi Lixenberg, Data curation, data acquisition; Mati
Joshua, Conceptualization, Resources, Data curation, Formal analysis, Supervision, Funding
acquisition, Validation, Investigation, Visualization, Methodology, Writing—review and editing
Author ORCIDs
Noga Larry https://orcid.org/0000-0001-8750-2182
Mati Joshua https://orcid.org/0000-0003-2602-3334
Ethics
Animal experimentation: All the procedures described in this paper were approved in advance by
the Institutional Animal Care and Use Committees of the Hebrew University of Jerusalem (ethics
approval number MD15145854) and were in strict compliance with the National Institutes of Health
Guide for the Care and Use of Laboratory Animals.
Decision letter and Author response
Decision letter https://doi.org/10.7554/eLife.46870.020
Author response https://doi.org/10.7554/eLife.46870.021
Additional files
Supplementary files
. Transparent reporting form DOI: https://doi.org/10.7554/eLife.46870.016
Data availability
The data used in this paper is available in: https://github.com/MatiJlab.
The following dataset was generated:
Larry et al. eLife 2019;8:e46870. DOI: https://doi.org/10.7554/eLife.46870 14 of 16Research article Neuroscience
Database and
Author(s) Year Dataset title Dataset URL Identifier
Larry N, Yarkoni M, 2019 MatiJlab https://github.com/Ma- GitHub, MatiJlab
Lixenberg A, tiJlab
Joshua M
References
Albus JS. 1971. A theory of cerebellar function. Mathematical Biosciences 10:25–61. DOI: https://doi.org/10.
1016/0025-5564(71)90051-4
Badura A, Schonewille M, Voges K, Galliano E, Renier N, Gao Z, Witter L, Hoebeek FE, Chédotal A, De Zeeuw
CI. 2013. Climbing fiber input shapes reciprocity of purkinje cell firing. Neuron 78:700–713. DOI: https://doi.
org/10.1016/j.neuron.2013.03.018, PMID: 23643935
Carta I, Chen CH, Schott AL, Dorizan S, Khodakhah K. 2019. Cerebellar modulation of the reward circuitry and
social behavior. Science 363:eaav0581. DOI: https://doi.org/10.1126/science.aav0581, PMID: 30655412
Chabrol FP, Blot A, Mrsic-Flogel TD. 2019. Cerebellar contribution to preparatory activity in motor neocortex.
Neuron 103:506–519. DOI: https://doi.org/10.1016/j.neuron.2019.05.022, PMID: 31201123
Cromwell HC, Hassani OK, Schultz W. 2005. Relative reward processing in primate striatum. Experimental Brain
Research 162:520–525. DOI: https://doi.org/10.1007/s00221-005-2223-z, PMID: 15754177
Darlington TR, Beck JM, Lisberger SG. 2018. Neural implementation of bayesian inference in a sensorimotor
behavior. Nature Neuroscience 21:1442–1451. DOI: https://doi.org/10.1038/s41593-018-0233-y, PMID: 30224
803
Ekerot CF, Kano M. 1985. Long-term depression of parallel fibre synapses following stimulation of climbing
fibres. Brain Research 342:357–360. DOI: https://doi.org/10.1016/0006-8993(85)91136-9, PMID: 4041837
Fallon JH, Schmued LC, Wang C, Miller R, Banales G. 1984. Neurons in the ventral tegmentum have separate
populations projecting to telencephalon and inferior olive, are histochemically different, and may receive direct
visual input. Brain Research 321:332–336. DOI: https://doi.org/10.1016/0006-8993(84)90188-4, PMID: 6498523
Gao Z, van Beugen BJ, De Zeeuw CI. 2012. Distributed synergistic plasticity and cerebellar learning. Nature
Reviews Neuroscience 13:619–635. DOI: https://doi.org/10.1038/nrn3312, PMID: 22895474
Gao Z, Davis C, Thomas AM, Economo MN, Abrego AM, Svoboda K, De Zeeuw CI, Li N. 2018. A cortico-
cerebellar loop for motor planning. Nature 563:113–116. DOI: https://doi.org/10.1038/s41586-018-0633-x,
PMID: 30333626
Gilbert PF, Thach WT. 1977. Purkinje cell activity during motor learning. Brain Research 128:309–328.
DOI: https://doi.org/10.1016/0006-8993(77)90997-0, PMID: 194656
Guo CC, Ke MC, Raymond JL. 2014. Cerebellar encoding of multiple candidate error cues in the service of motor
learning. Journal of Neuroscience 34:9880–9890. DOI: https://doi.org/10.1523/JNEUROSCI.5114-13.2014,
PMID: 25057191
Heffley W, Song EY, Xu Z, Taylor BN, Hughes MA, McKinney A, Joshua M, Hull C. 2018. Coordinated cerebellar
climbing fiber activity signals learned sensorimotor predictions. Nature Neuroscience 21:1431–1441.
DOI: https://doi.org/10.1038/s41593-018-0228-8, PMID: 30224805
Heffley W, Hull C. 2019. Classical conditioning drives learned reward prediction signals in climbing fibers across
the lateral cerebellum. eLife 8:e46764. DOI: https://doi.org/10.7554/eLife.46764, PMID: 31509108
Hoffmann KP, Distler C. 1989. Quantitative analysis of visual receptive fields of neurons in nucleus of the optic
tract and dorsal terminal nucleus of the accessory optic tract in macaque monkey. Journal of Neurophysiology
62:416–428. DOI: https://doi.org/10.1152/jn.1989.62.2.416, PMID: 2769338
Jörntell H, Ekerot CF. 2002. Reciprocal bidirectional plasticity of parallel fiber receptive fields in cerebellar
purkinje cells and their afferent interneurons. Neuron 34:797–806. DOI: https://doi.org/10.1016/S0896-6273
(02)00713-4, PMID: 12062025
Joshua M, Tokiyama S, Lisberger SG. 2015. Interactions between target location and reward size modulate the
rate of microsaccades in monkeys. Journal of Neurophysiology 114:2616–2624. DOI: https://doi.org/10.1152/
jn.00401.2015, PMID: 26311180
Joshua M, Lisberger SG. 2012. Reward action in the initiation of smooth pursuit eye movements. Journal of
Neuroscience 32:2856–2867. DOI: https://doi.org/10.1523/JNEUROSCI.4676-11.2012, PMID: 22357868
Kimmel DL, Mammo D, Newsome WT. 2012. Tracking the eye non-invasively: simultaneous comparison of the
scleral search coil and optical tracking techniques in the macaque monkey. Frontiers in Behavioral Neuroscience
6:49. DOI: https://doi.org/10.3389/fnbeh.2012.00049, PMID: 22912608
Kobayashi Y, Kawano K, Takemura A, Inoue Y, Kitama T, Gomi H, Kawato M. 1998. Temporal firing patterns of
purkinje cells in the cerebellar ventral paraflocculus during ocular following responses in monkeys II. complex
spikes. Journal of Neurophysiology 80:832–848. DOI: https://doi.org/10.1152/jn.1998.80.2.832, PMID: 9705472
Kostadinov D, Beau M, Pozo MB, Häusser M. 2019. Predictive and reactive reward signals conveyed by climbing
fiber inputs to cerebellar purkinje cells. Nature Neuroscience 22:950–962. DOI: https://doi.org/10.1038/
s41593-019-0381-8, PMID: 31036947
Marr D. 1969. A theory of cerebellar cortex. The Journal of Physiology 202:437–470. DOI: https://doi.org/10.
1113/jphysiol.1969.sp008820, PMID: 5784296
Larry et al. eLife 2019;8:e46870. DOI: https://doi.org/10.7554/eLife.46870 15 of 16Research article Neuroscience
Medina JF, Lisberger SG. 2008. Links from complex spikes to local plasticity and motor learning in the
cerebellum of awake-behaving monkeys. Nature Neuroscience 11:1185–1192. DOI: https://doi.org/10.1038/nn.
2197, PMID: 18806784
Nguyen-Vu TD, Kimpo RR, Rinaldi JM, Kohli A, Zeng H, Deisseroth K, Raymond JL. 2013. Cerebellar purkinje cell
activity drives motor learning. Nature Neuroscience 16:1734–1736. DOI: https://doi.org/10.1038/nn.3576,
PMID: 24162651
Ohmae S, Medina JF. 2015. Climbing fibers encode a temporal-difference prediction error during cerebellar
learning in mice. Nature Neuroscience 18:1798–1803. DOI: https://doi.org/10.1038/nn.4167, PMID: 26551541
Ojakangas CL, Ebner TJ. 1994. Purkinje cell complex spike activity during voluntary motor learning: relationship
to kinematics. Journal of Neurophysiology 72:2617–2630. DOI: https://doi.org/10.1152/jn.1994.72.6.2617,
PMID: 7897479
Rashbass C, Westheimer G. 1961. Independence of conjugate and disjunctive eye movements. The Journal of
Physiology 159:361–364. DOI: https://doi.org/10.1113/jphysiol.1961.sp006813, PMID: 14490421
Rowan MJM, Bonnan A, Zhang K, Amat SB, Kikuchi C, Taniguchi H, Augustine GJ, Christie JM. 2018. Graded
control of Climbing-Fiber-Mediated plasticity and learning by inhibition in the cerebellum. Neuron 99:999–
1015. DOI: https://doi.org/10.1016/j.neuron.2018.07.024, PMID: 30122378
Schonewille M, Khosrovani S, Winkelman BH, Hoebeek FE, De Jeu MT, Larsen IM, Van der Burg J, Schmolesky
MT, Frens MA, De Zeeuw CI. 2006. Purkinje cells in awake behaving animals operate at the upstate membrane
potential. Nature Neuroscience 9:459–461. DOI: https://doi.org/10.1038/nn0406-459, PMID: 16568098
Schultz W, Dayan P, Montague PR. 1997. A neural substrate of prediction and reward. Science 275:1593–1599.
DOI: https://doi.org/10.1126/science.275.5306.1593, PMID: 9054347
Stone LS, Lisberger SG. 1990. Visual responses of purkinje cells in the cerebellar flocculus during smooth-pursuit
eye movements in monkeys. II. complex spikes. Journal of Neurophysiology 63:1262–1275. DOI: https://doi.
org/10.1152/jn.1990.63.5.1262, PMID: 2358873
Suvrathan A, Payne HL, Raymond JL. 2016. Timing rules for synaptic plasticity matched to behavioral function.
Neuron 92:959–967. DOI: https://doi.org/10.1016/j.neuron.2016.10.022, PMID: 27839999
Thoma P, Bellebaum C, Koch B, Schwarz M, Daum I. 2008. The cerebellum is involved in reward-based reversal
learning. The Cerebellum 7:433–443. DOI: https://doi.org/10.1007/s12311-008-0046-8, PMID: 18592331
Thorndike EL. 1898. Animal intelligence: an experimental study of the associative processes in animals.
Psychological Review 5:551–553. DOI: https://doi.org/10.1037/h0067373
Tremblay L, Schultz W. 1999. Relative reward preference in primate orbitofrontal cortex. Nature 398:704–708.
DOI: https://doi.org/10.1038/19525, PMID: 10227292
Wagner MJ, Kim TH, Savall J, Schnitzer MJ, Luo L. 2017. Cerebellar granule cells encode the expectation of
reward. Nature 544:96–100. DOI: https://doi.org/10.1038/nature21726, PMID: 28321129
Warnaar P, Couto J, Negrello M, Junker M, Smilgin A, Ignashchenkova A, Giugliano M, Thier P, De Schutter E.
2015. Duration of purkinje cell complex spikes increases with their firing frequency. Frontiers in Cellular
Neuroscience 9:122. DOI: https://doi.org/10.3389/fncel.2015.00122, PMID: 25918500
Welsh JP, Lang EJ, Suglhara I, Llinás R. 1995. Dynamic organization of motor control within the olivocerebellar
system. Nature 374:453–457. DOI: https://doi.org/10.1038/374453a0, PMID: 7700354
Yang Y, Lisberger SG. 2014. Purkinje-cell plasticity and cerebellar motor learning are graded by complex-spike
duration. Nature 510:529–532. DOI: https://doi.org/10.1038/nature13282, PMID: 24814344
Zur G, Joshua M. 2019. Using extracellular low frequency signals to improve the spike sorting of cerebellar
complex spikes. Journal of Neuroscience Methods 328:108423. DOI: https://doi.org/10.1016/j.jneumeth.2019.
108423, PMID: 31494185
Larry et al. eLife 2019;8:e46870. DOI: https://doi.org/10.7554/eLife.46870 16 of 16You can also read