International Horizon Scanning and Learning to Inform Wales' COVID-19 Public Health Response and Recovery Report 30, 01/07/2021
←
→
Page content transcription
If your browser does not render page correctly, please read the page content below
International Horizon Scanning and Learning to Inform
Wales’ COVID-19 Public Health Response and Recovery
Report 30, 01/07/2021
Overview
The International Horizon Scanning and Learning work stream was initiated as part of
the COVID-19 public health response, to support response and recovery measures
and planning in Wales.

The learning and intelligence is summarised in regular reports to inform decision-
making. These may vary in focus and scope, depending on the evolving COVID-19
situation and public health/policy needs. The reports focus on COVID-19 international
evidence, experience, measures, transition and recovery approaches. Evidence is
provided to help understand and explore solutions for addressing the on-going and
emerging health, wellbeing, social and economic impacts (potential harms and
benefits) of COVID-19.

This work is aligned with and feeds into the Welsh Government Office for Science and
into Public Health Wales Gold Command. It is part of a wider Public Health Wales’
systematic approach to intelligence gathering to inform comprehensive, coherent,
inclusive and evidence-informed policy action, which supports the Wellbeing of Future
Generations (Wales) Act and the Prosperity for All national strategy towards a
healthier, more equal, resilient, prosperous and globally responsible Wales.

Disclaimer: The reports provide high-level summary of emerging evidence from
country experience and epidemiology; research papers (peer-reviewed/not); and key
organisations’ guidance/reports, including sources of information to allow further
exploration. The reports do not provide detailed or in-depth data/evidence analysis.
Due to the novelty of COVID-19 virus/disease and the dynamic epidemiological
situation, studies, data and evidence can be conflicting, inconclusive or out-of-date
depending on country/other context.

In focus this week

    COVID-19 impact on education and schooling practices
    Environmental impact of COVID-19
    Country insight: South Africa

Contents

At a glance: summary of international learning on COVID-19 ............................. 3
COVID-19 impact on education and schooling practices ..................................... 4
Environmental impact of COVID-19 ...................................................................... 10
Country insight: South Africa ............................................................................... 17

                                                       2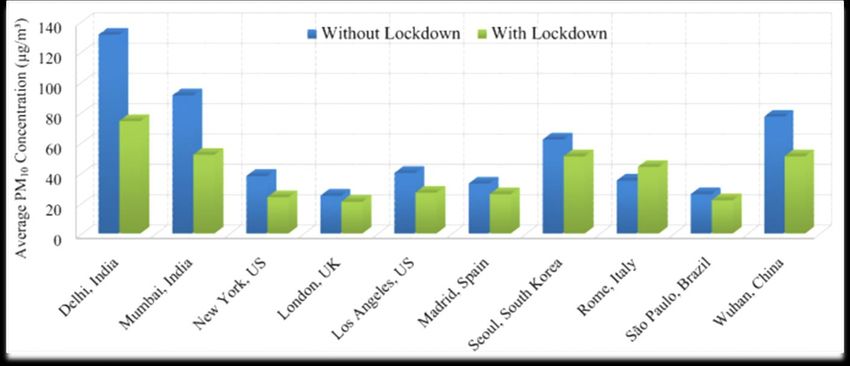
At a glance: summary of international learning on COVID-19

“School closures carry high social and economic costs for people across communities.
 Their impact however is particularly severe for the most vulnerable and marginalized
 boys and girls and their families.” (UNESCO, 2021)

 COVID-19 impact on education and schooling practices
   Immediate positive action is needed to address the inequity of COVID-19 on educational
   attainment, and the future impact this has on health and well-being
   Plans should take account of the needs of vulnerable groups and existing
   disadvantage so as not to widen the educational attainment gap further
   The impact of COVID-19 on children’s physical and mental health should be mitigated
   by applying appropriate interventions which balance the needs of children to play and
   learn
   Initiatives, such as increased public health messages in schools, parental engagement in
   children’s education and increased use of technology, can be utilised to improve future
   educational programmes
 More information is summarised on pp.4-9

 Environmental impact of COVID-19
   Reduced travel during COVID-19 restrictions has been related to lower levels of air
   pollutants and particulate matter across cities worldwide, which may not be sustained
   The use of personal protective equipment (PPE) has increased over the course of the
   pandemic, this creates an environmental issue
   Sustainable solutions are needed to reduce the environmental impact of increased use
   of PPE, including face masks, whilst still meeting the need for infection prevention and
   control measures due to COVID-19
   Strategies suggested to reduce the environmental impact of PPE in the health and care
   setting include: removal of gloves and using hand washing alone; domestic
   manufacture of PPE; and extended use or reuse of face shields and gowns
 More information is summarised on pp.10-16

 Country insight: South Africa
   South Africa has had two major waves of COVID-19 in June/July 2020 and December
   2020/January 2021. The number of positive tests increased from April to June 2021
   The testing strategy will have an impact on test numbers and case finding and should
   be considered when comparing data between countries or over time
   Vaccinations being administered have increased rapidly in South Africa, the total
   numbers vaccinated per million are 28,500. For contrast, UK vaccination rates are
   approximately 662,700 per million (29 June 2021)
 More information is summarised on pp. 17-21

                                             3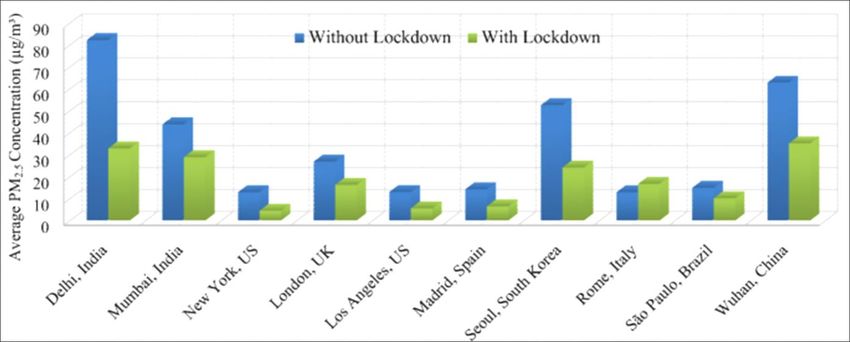
COVID-19 impact on education and schooling practices

Disruption of education around the world
-     At the peak of school disruptions 1,450,430,123 (82.8%) of total enrolled learners and
      167 country-wide closures occurred simultaneously (March 2020)1
-     Over 156 million (8.9%) of enrolled learners still face substantial disruption to their
      education in June 2021 with country-wide closures still ongoing in 21 countries (8 June
      2020) see figure 1
-     Over a 100 million children may fall below the minimum proficiency level in reading
      as a result of the pandemic2
-     School disruptions range from full school closures to reduced or part time academic
      schedules.3 Even as schools begin to re-open, they still face disruption with many
      introducing extra measures to reduce the risk of the spread of the virus4
-     Some countries, such as Norway and France, have kept schools open for most of the
      pandemic (7 and 10 weeks of school closure, respectively), whereas others, such as
      Germany and the United Kingdom (UK), have relied more often on school closures for
      transmission control (19 and 21 weeks closure, respectively)5

Figure 1. Global monitoring of school closures caused by COVID-19 as of 8th June 20216

1
  Education: From disruption to recovery (unesco.org)
2
  https://en.unesco.org/covid19/educationresponse#schoolclosures
3
  https://www.bmj.com/content/bmj/372/bmj.n524.full.pdf
4
  https://unesdoc.unesco.org/ark:/48223/pf0000376984
5
  Covid-19: Keeping schools as safe as possible (bmj.com)
6
  https://en.unesco.org/covid19/educationresponse#schoolclosures

                                                                   4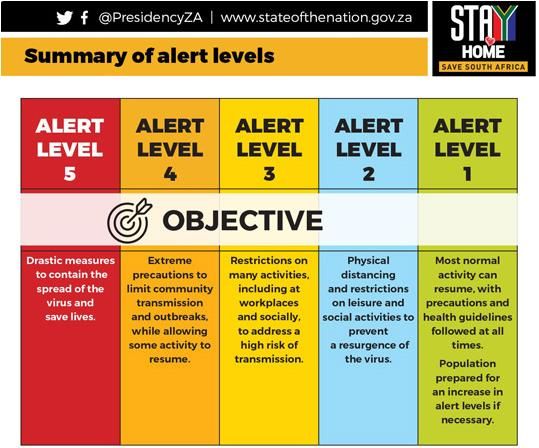
Inequity and school closures
Early analyses and predictions of the impact of school closures highlight that: 7
   - Children from disadvantaged backgrounds are likely to be affected more due to
       fewer family resources and less access to online learning to offset lost instruction time
   - Educational deficit could be compensated with additional teaching hours when
       schools reopen, though schools might need to put back more hours than were lost and
       this might not be feasible within the traditional school year
   - Gaps in educational attainment, physical and emotional health and wellbeing
       could have widened, particularly during school closures8
   - A key challenge for schools is identifying children’s different experiences and
       responding to the volume of safeguarding concerns that are likely to arise as pupils
       begin to open up to their teachers9

Children from families who have experienced, or may face, a loss of employment or
employment issues are at particular risk of negative impacts to their education:
    - Parental job loss has a negative impact on children’s educational attainment1011
    - Reduction in family income is associated with a reduction in children’s
       educational attainment12
    - The more stable labour market attachment for the parent, the greater the impact on
       the child’s education as a result of their job loss13

Soft capital (e.g. parental support) and physical capital (e.g. access to home computer) were
found to play an important role in students learning outcomes and wellbeing:
   - In Ireland, parents’ ability to assist children with schoolwork was correlated with
       improved mental health for child14 but screen time increased for most children during
       lockdown, and they spent significantly more time on schoolwork if they had access
       to a computer or laptop15
   - Challenging home and other circumstances for children and young people could have
       been amplified by the use of non-pharmaceutical interventions (NPIs), including school
       closures16
   - The pandemic has highlighted inequities that should be addressed to improve equity
       in education in the future, including a significant digital divide that enforced distance
       learning has highlighted17

Physical and mental impact of school closures on children
Impacts of school closures during the COVID-19 pandemic include18:
       - loss of access to school-based and critical services
       - loss of resources particularly for children with disabilities
       - loss of resources for those living in poorer families
       - increased stress among children and emotional reactions
       - the longer the school closure, the higher the predicted increase in obesity

Children’s worries and anxieties relate to:19
7
    http://eprints.lse.ac.uk/104675/3/Eyles_covid_19_school_shutdowns_published.pdf
8
    https://www.pnas.org/content/118/17/e2022376118?fbclid=IwAR0B0gKSv_jBS3SdoSJpgPQWkFezms20Z2vkEKcNgPggCVlfMhJTAXrxa7Q
10
   https://cep.lse.ac.uk/pubs/download/dp1364.pdf
11
   https://academic.oup.com/restud/article-abstract/78/4/1462/1592095
12
   https://www.aeaweb.org/articles?id=10.1257/aer.102.5.1927
13
   https://cep.lse.ac.uk/pubs/download/dp1364.pdf
14
   https://www.tandfonline.com/doi/abs/10.1080/03323315.2021.1932555?journalCode=ries20
15
   https://www.tandfonline.com/doi/abs/10.1080/03323315.2021.1932551
16
   The challenge facing schools and pupils | Mental Health Foundation
17
   COVID-19 and the digital divide in the UK (thelancet.com)
18
   https://www.ncbi.nlm.nih.gov/pmc/articles/PMC8159143/
19
   https://phw.nhs.wales/publications/publications1/children-and-young-peoples-mental-well-being-during-the-covid-19-pandemic-research-brief/

                                                                                  5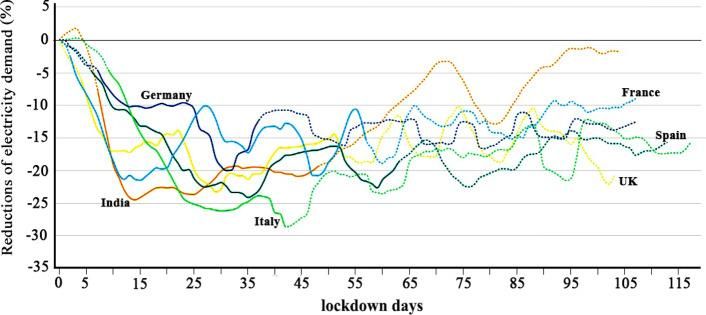
- loss of accessibility of non-academic support from schools
    - the quality of education received
Contributing factors to increased stress among young people include:
   - lack of familiarity of the new teaching and assessment modalities
   - lack of clarity in communication
   - distant supervision from teachers
   - perceived poorer quality of online education
   - concerns about graduating

-     Consideration will need to be given to mental health and well-being of all children,
      but especially those who return to school having experienced feelings of abandonment,
      exclusion and alienation20
-     Child mental well-being could be protected by promoting parental knowledge, skills, and
      resources about how to talk to children21
-     School-based mental health services need to expand and adapt to increased
      demand22
-     Child and adolescent psychiatrists need to ensure continuity of care with a specific
      focus on children and adolescents who are already disadvantaged and
      marginalised23
-     Successful management of stress and trauma can lead to personal growth, which in
      turn reinforces the sense of competence and becomes a protective factor for coping with
      future stressors24

Table 1: Psychological and behavioural impacts of lockdown and school closure on children
and young adults in selected countries25
 Country       Number (Age) Findings
 Belgium,      2871      (51.5% Around half of the young people surveyed were students who reported
 Canada and young adults)       being overwhelmed with uncertainties regarding their future and
 France26                       education.
 China2728     8079 (12-18)     43% had symptoms of depression while 37% had anxiety. Females,
                                rural and students in senior school more likely to experience
                                depression and anxiety.
               3254 (7-18)      54% felt learning had been negatively impacted by pandemic. 13% of
                                females and 10% of males reported symptoms of smartphone
               5286             addiction.
               (university)
 Italy2930     5989 (4-10)      26% excessive clinginess, 5.5% worse vocabulary, 18% developed
                                excessive fears.
               1124 (students) The study did not find significant psychological impact in its
                                participants; stress levels among the participating students were not
                                significantly different than pre- COVID student samples
 Italy     and 1143 (3-18)      85% of parents felt a worsening of children’s emotions and behaviours.
 Spain31

20
   https://www.tandfonline.com/doi/full/10.1080/02643944.2021.1916180
21
   https://www.frontiersin.org/articles/10.3389/fpsyg.2020.01713/full
22
   https://www.ncbi.nlm.nih.gov/pmc/articles/PMC7550083/
23
   https://link.springer.com/content/pdf/10.1186/s13034-020-00329-3.pdf
24
   https://www.mdpi.com/2071-1050/12/17/7039
25
   https://www.ncbi.nlm.nih.gov/pmc/articles/PMC7798512/#fmaa122-B13
26
   https://bmcpsychiatry.biomedcentral.com/articles/10.1186/s12888-021-03109-1
27
   https://pubmed.ncbi.nlm.nih.gov/32363492/
28
   https://pubmed.ncbi.nlm.nih.gov/32658812/
29
   https://psyarxiv.com/stwbn/
30
   https://www.mdpi.com/2071-1050/12/17/7039
31
   https://pubmed.ncbi.nlm.nih.gov/33240167/

                                                                                 6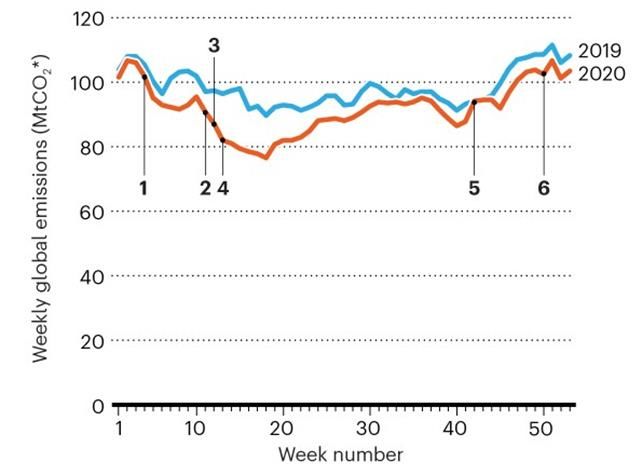
Country Insights
Estimated learning loss in the Netherlands show32:
    - Students from disadvantaged backgrounds suffered the most learning loss during
       lockdown
    - Lower parental education correlated with more significant learning loss
    - Girls worse affected than boys
    - Ages 9 and 10 suffer most significant learning loss

Evidence from during the course of lockdown periods in different countries has found that:
   - In the Czech Republic, students tend not to spend sufficient time studying: pupils were
      studying between 2 and 4 hours a day, while parents tended to help for about half
      the time33
   - In Uruguay, only 26% of participants mentioned educational activities when describing
      a typical day of their children during the pandemic34
   - In Turkey, parents have greater appreciation for teachers and take more active roles
      in their children’s education35
   - In Cyprus, parents were willing to be more involved in children’s education, but
      required training to develop appropriate knowledge and skills (particularly in relation
      to mathematics)36
   - Whilst in the main the effect of the pandemic on children is described as negative, in
      Germany, smaller class sizes lead to improved student-teacher relations, creating
      positive impacts for pupils social and emotional development for those children able to
      physically attend class37

Interventions to reduce the spread of COVID-19 in educational settings
A range of NPIs have been implemented to reduce transmission of COVID-19 in the
school setting.38 Most European countries have introduced measures, including:

     -     Cohorting of pupils, physical distancing, wearing of face masks, improving
           ventilation, moving physical activities outdoors, regular cleaning of surfaces, and
           improving hand hygiene and respiratory etiquette39
     -     Infection prevention and control measures beyond the classroom, particularly
           transport to and from school, during pick-up and drop-off times for both children and
           adults, and during meal times in the school day
     -     Blended learning (a mixture of online and in-person learning) in secondary schools
     -     Use of testing for surveillance in schools and prioritisation of teachers for immunisation

     -     There is increasing evidence that COVID-19 in educational settings is strongly
           associated with community infection rates in adults40
     -     Maintaining low community infection rates is critical for reducing the risk of virus
           entering educational settings
     -     Further studies are needed to understand the contribution of in-school and outside-
           school transmission, especially the role of asymptomatic infection and
           transmission among staff and students

32
  https://www.pnas.org/content/118/17/e2022376118?fbclid=IwAR0B0gKSv_jBS3SdoSJpgPQWkFezms20Z2vkEKcNgPggCVlfMhJTAXrxa7Q
33
  https://www.frontiersin.org/articles/10.3389/feduc.2020.00103/full?fbclid=IwAR1XjPYVHi7puClLHJcyRDEV09UW4GMN4c_VKpvaR_yQnrxLbn8onE4excY#F1
34
   https://www.sciencedirect.com/science/article/pii/S0190740920323288
35
   https://dergipark.org.tr/en/pub/tojde/issue/61115/906485
36
   https://ojs.wiserpub.com/index.php/SER/article/view/547
37
   https://www.frontiersin.org/articles/10.3389/feduc.2021.635180/full
38
   https://www.cdc.gov/coronavirus/2019-ncov/community/ventilation.html
39
   https://www.bmj.com/content/bmj/372/bmj.n524.full.pdf
40
   https://www.thelancet.com/action/showPdf?pii=S2666-7762%2821%2900097-1

                                                                         7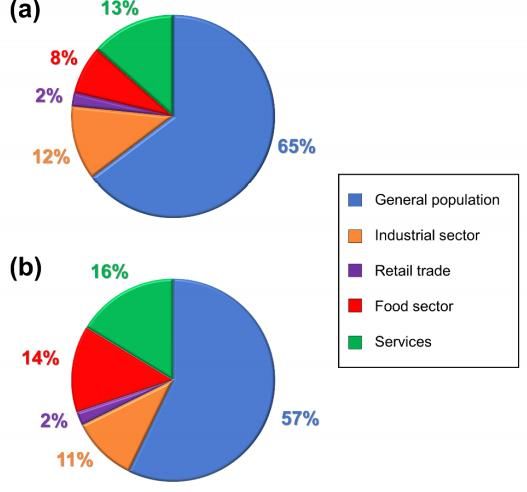
In the US, an Operational Strategy for schools through ‘Phased Prevention’ outlines:
1. Evidence that many schools that have strictly implemented prevention strategies have
been able to safely open for in-person instruction and remain open
2. A pathway for schools to provide in-person instruction safely through consistent use of
prevention strategies, including universal and correct use of masks and physical
distancing
3. All schools should implement and layer prevention strategies and should prioritise
universal and correct use of masks and physical distancing
4. Testing and vaccination for teachers and staff provide additional layers of protection
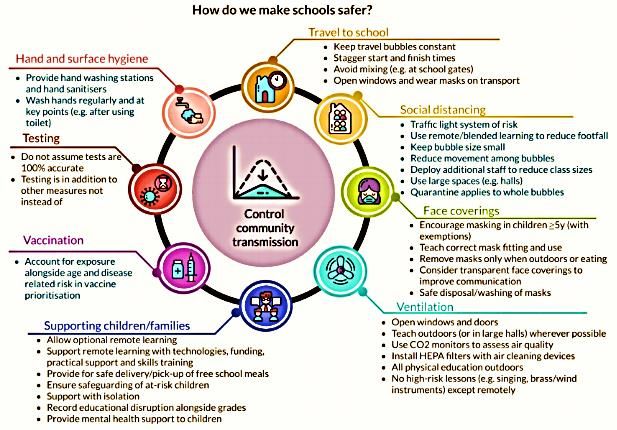
Recommendations to reduce the risk of transmission in schools and mitigate the impact of
COVID-19 on children and families is presented in figure 241
Figure 2: Recommendations to reduce transmission of COVID-19 in educational settings42
Opportunities for education
– In higher education, the additional support offered to students to assist them continue their
studies could be beneficial after the pandemic has ended, including: positive changes to
student assessment, clarity and flexibility of online learning, compassion, financial support,
extra well-being support, university community engagement and others43
Recommendations for education settings re-opening and continuation are outlined in Table 2
41
mmc1.pdf (thelancet.com)
42
https://www.thelancet.com/cms/10.1016/S0140-6736(21)00622-X/attachment/524b9f7e-5847-4cc2-9cac-75d4beeff556/mmc1.pdf
43
The impact of COVID-19 on higher education - Publications Office of the EU (europa.eu)
8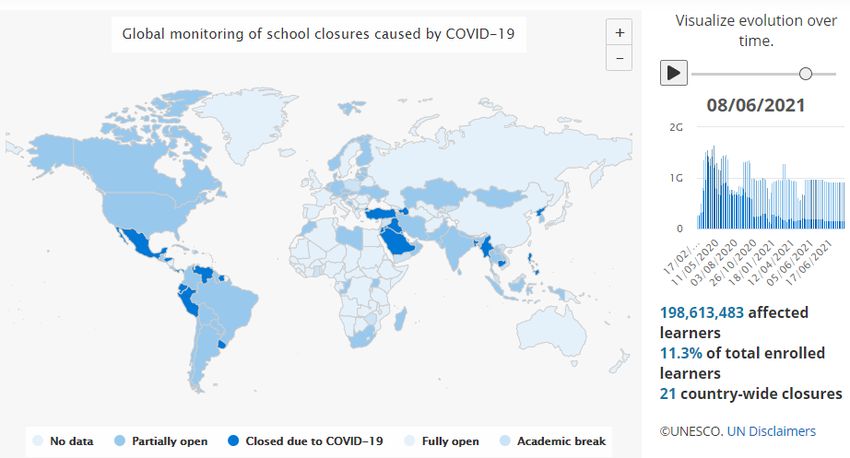
Table 2. Recommendations: re-opening and continuation of educational settings
The Centre for Global Development’s five dimensions of school re-opening and recovery44
1. Engaging communities in reopening plans
Inclusive community engagement should occur early on in the planning process in order
to build trust
Open and clear communication with the wider community should be maintained
throughout the planning process
2. Targeting resources to where they are most needed
There needs to be coordination across different sectors and agencies in order to manage
competing priorities for the available resources
Target communities with the greatest needs
Plans must take account for underlying risk factors such as vulnerable groups,
disadvantage and attendance rates
3. Getting children back to school
Prioritise students most likely to drop out using information on deprivation and attendance
to help identify those most at risk
Provide financial support to the most vulnerable to help tackle costs associated with
returning to school, including fee waivers and school feeding
4. Making school environments safe
Ensure schools are equipped with adequate health and hygiene infrastructure, including
the distribution of alcohol-based hand sanitiser and adequate hand washing facilities
Students and staff should be regularly screened for temperature and symptoms
Prioritise learning and social-emotional wellbeing to support children back into education
5. Recovering learning loss and building back better
Engage students in accelerated learning programmes
Engage teachers in training and coaching to helps students catch up
Engage parents by building upon their current involvement in remote learning
World Bank: Re-imaging education- a continuous and accelerated learning approach (May
2021)4546
– Focus is on re-imagining education to blur the lines between school and home
– The report states that the world must respond quickly and deliberately to mitigate impacts
while seizing opportunities to make education more inclusive, effective and resilient than pre-
COVID-19. This will require adopting two main strategies:
1. Countries should support reforms of teaching, curricula and assessment of learning to
enable resilience and accelerated learning anytime, anywhere;
2. Develop mechanisms to support children and parents at home for continuous learning
The National Education Union (NEU) recommendations47
1. Safety in schools and colleges
Social distancing in schools and colleges
Limit numbers on site through rotas and remote education
Increase the use of face coverings and better ventilation
Education staff should be vaccinated as a priority
2. Building a better education system
A reintegration plan, with flexibility for schools to meet the needs of their communities
Employ supply teachers and qualified teachers who have left the profession to work
in schools and colleges
Develop and properly resource a recovery curriculum to run over a number of years
Plans must be made for those who are in transition years
3. Work as a nation to give all children and young people the best start in life
All pupils must be guaranteed access to broadband and laptops, which will enable
them to learn remotely, and to study and develop their skills once schools are fully
open
A fully-resourced national plan for children’s wellbeing should be launched to support
those who suffered trauma in the pandemic
Welfare reform is needed so that parents are not working for their family’s poverty
44
Planning for School Reopening and Recovery After COVID-19 (cgdev.org)
45
https://blogs.worldbank.org/education/getting-back-learning-key-policy-actions-reopening-schools
46
https://www.worldbank.org/en/topic/education/brief/joint-initiative-for-continuous-accelerated-learning-in-response-to-covid-19
47
https://neu.org.uk/recovery-plan
9Environmental impact of COVID-19
Air pollution
Of all environmental factors outdoor air pollution, particularly in high-income countries, is
regarded as the most influential environmental determinant of health.48
- Globally, prior to the COVID-19 pandemic, air pollution was responsible for 16% of
deaths making it the primary cause of preventable premature death worldwide. 49
Air quality problems are caused by 3 main pollutants: nitrogen oxides, ozone and
particulate matter (PM10 and PM2.5)50
- Carbon dioxide contributes to air pollution in its role in the greenhouse effect.
COVID-19 impact
The implementation of NPIs has produced positive improvement in air quality in many
cities, for example:
- NPIs were responsible for a 30% reduction in nitrogen dioxide emissions during the first
lockdown period in Asian and European Countries 51
- Cities such as Mumbai, Delhi and Wuhan saw large reductions in PM10, which can be
taken into the lungs (figure 3)
- Delhi, Seoul and Los Angeles saw substantial decreases in PM2.5, which can be taken
into the lungs and bloodstream (figure 4)
- Rome bucked the trend and saw an increase in both PM2.5 and PM10 (figure 3 and 4)
- While the decline in emissions were significant in major cities globally, PM2.5 levels did not
reach World Health Organization (WHO) accepted standards in Delhi or Wuhan, this is
largely due to the types of solid fuels burned in these cities
- Lockdowns across the globe has caused sharp declines in the movement of goods and
people, resulting in less air pollutants (table 3, figure 3 and figure 4)
Table 3: Mobility index report based on Google tracking for period 23 February to 5 April 2021
(Muhammad et al, 2020)52
Location Public Grocery & Retail & Workplace Parks & Residential
Transport pharmacy recreation outings
USA −54% −20% −49% −40% −20% +13%
Spain −89% −77% −94% −68% −90% +23%
Italy −86% −82% −95% −62% −90% +24%
France −82% −62% −85% −53% −73% +17%
Germany −47% −13% −58% −30% +61% +8%
UK −70% −41% −82% −54% −29% +15%
48
WHO (2013). Health risks of air pollution in Europe – HRAPIE project; recommendations for concentration–response functions for cost–benefit analysis of particulate
matter, ozone and nitrogen dioxide. WHO Regional Office for Europe; Copenhagen, Denmark).
49
https://www.ncbi.nlm.nih.gov/pmc/articles/PMC7571423/
50
https://www.who.int/news-room/fact-sheets/detail/ambient-(outdoor)-air-quality-and-health
51
https://www.ncbi.nlm.nih.gov/pmc/articles/PMC7241861/
52
https://www.ncbi.nlm.nih.gov/pmc/articles/PMC7169881/
10Figure 3. Average PM10 concentration before and after lockdown (2020) 53
Figure 4: Average PM2.5 concentration with and without lockdown (2020) 54
In India the following have also been reported55,56
- Between 16 March 2020 and 14 April 2020 a large scale reduction in PM2.5 and PM10,
was noted across 22 major cities in India
- PM2.5 and PM10 decreased by 200% in Delhi during the first lockdown
- A reduction in transport saw carbon monoxide emissions from car and motorbike
fumes fall by 27 gigagrams in Delhi and 20 gigagrams in Mumbai
53
https://link.springer.com/article/10.1007/s11356-021-14462-9
54
https://link.springer.com/article/10.1007/s11356-021-14462-9
55
https://www.ncbi.nlm.nih.gov/pmc/articles/PMC7175882/
56
https://link.springer.com/content/pdf/10.1007/s41810-020-00062-6.pdf
11Carbon dioxide levels57
- Large volumes of carbon dioxide are generated by human activity: this is one of the
gases having an impact on global warming
- Despite the NPIs, weekly global carbon dioxide emissions largely returned to their
2019 levels by mid-2020, with subsequent restrictions introduced for second and third
waves having less of an impact than during the first wave (figure 5, below)
- This is despite aviation’s substantial decline in activity globally: aviation fuel produces
carbon dioxide
Figure 5: Weekly global CO2 emissions in 20205859
KEY
- 1 – First lockdown in Wuhan, China.
- 2 – National lockdown implemented in Italy.
- 3 – California enters lockdown.
- 4 – India enters nationwide lockdown.
- 5 – New restrictions introduced in Europe to counter emerging second waves.
- 6 – California enters 3 week lockdown.
57
https://www.nature.com/articles/d41586-021-00090-3
58
https://www.nature.com/articles/d41586-021-00090-3
59
NOTE: 1 – First lockdown in Wuhan, China. 2 – National lockdown implemented in Italy. 3 – California enters lockdown. 4 – India enters nationwide
lockdown. 5 – New restrictions introduced in Europe to counter emerging second waves. 6 – California enters 3 week lockdown.
12Electricity consumption
Global electricity consumption has decreased as a result of the pandemic (figure 6). The
split between domestic use and commercial use cannot be identified from these data.
Figure 6: Percentage change in electricity consumption by country during lockdown (2020)60
Domestic waste
Measures to reduce the spread of COVID-19 have had a significant impact on the
purchasing habits of consumers globally:
- Online sales in the UK accounted for 35.2% of all retail sales in January 2021, up from
a previous high of 34.1% in May 2020.61
- An increase in online shopping may result in an increase in packaging.62
- During the pandemic, 46% of UK consumers had purchased something online that
they had previously only ever bought in store.63
Food shopping changed in the following ways during the pandemic:
- Consumption of packaged food and food delivery increased64
- In Italy, USA, France and the UK (during the first wave) consumption of frozen foods
increased, as consumers sought long lasting goods, purchasing of longer lasting
goods in Italy lead to a decrease in the amount of food waste produced65
- Panic buying and trends in frozen food purchases did not continue into the second
wave, as consumers adjusted to the pandemic measures66
- In USA, Italy and Japan food delivery increased by 15-29%67
- In a UK study on food purchasing, respondents reported purchasing more long lasting
items (such as tinned foods and pasta) than usual68
The COVID-19 pandemic has also had inadvertent effects on the management of recycling:
- Italy did not allow infected residents to sort their waste69
60
https://www.ncbi.nlm.nih.gov/pmc/articles/PMC7859094/
61
https://www.ons.gov.uk/businessindustryandtrade/retailindustry/bulletins/retailsales/january2021
62
https://www.ncbi.nlm.nih.gov/pmc/articles/PMC7556229/
63
https://www.retaileconomics.co.uk/white-papers/outlook-for-uk-retail-and-leisure-2021-ten-trends
64
https://www.sciencedirect.com/science/article/pii/S0048969721010640
65
https://www.frontiersin.org/articles/10.3389/fnut.2020.585090/full
66
https://www.frontiersin.org/articles/10.3389/fnut.2020.585090/full
67
https://www.frontiersin.org/articles/10.3389/fnut.2020.585090/full
68
https://wrap.org.uk/sites/default/files/2021-02/WRAP-Life-under-Covid-19-Food-waste-attitudes-and-behaviours-in-2020.pdf
69
https://www.ncbi.nlm.nih.gov/pmc/articles/PMC7169883/
13- In the USA, residential waste peaked at 20% above the normal average in late April,
causing some communities to temporarily suspend collection services in order to
ensure correct waste management70,71
Personal Protective Equipment (PPE)
- The use of PPE has been a common method used to try to reduce the spread of COVID-
19 globally
- If production and disposal are managed poorly, PPE can have a devastating impact
on the environment and pose a threat to human health, as well as terrestrial and marine
ecosystems72
- The COVID-19 pandemic has resulted in an unprecedented increase in the production,
use and disposal of PPE, including face masks, face shields, disposable gowns,
disposable gloves and disinfectant wipes, which often contain single use plastic73
- Demand for PPE is expected to increase annually, with a 20% increase in the production
of single use face masks between the years 2020 and 202574
- Evidence suggests that the exacerbated plastic pollution globally may impact the marine
environment causing an increase of microplastics in the ocean75
- The extensive use of face masks in clinical as well as public settings, has resulted in
disruptions of the supply chain and waste disposal system, with studies suggesting that
globally around 3.4 billion single-use facemasks/face shields are discarded daily as a
result of the COVID-19 pandemic.76 This is having an impact on the progress in reducing
plastic waste.
70
https://swana.org/docs/default-source/advocacy-documents/senate-epw---final-swana-testimony---june-17-2020.pdf?sfvrsn=c3af10a2_2
71
https://www.ncbi.nlm.nih.gov/pmc/articles/PMC7169883/
72
https://www.ncbi.nlm.nih.gov/pmc/articles/PMC7430241/
73
https://www.sciencedirect.com/science/article/pii/S0269749120368494
74
Personal Protective Equipment (PPE) Market Global Forecast to 2022 | MarketsandMarkets
75
What we need to know about PPE associated with the COVID-19 pandemic in the marine environment - ScienceDirect
76
https://www.sciencedirect.com/science/article/pii/S2405844021004485
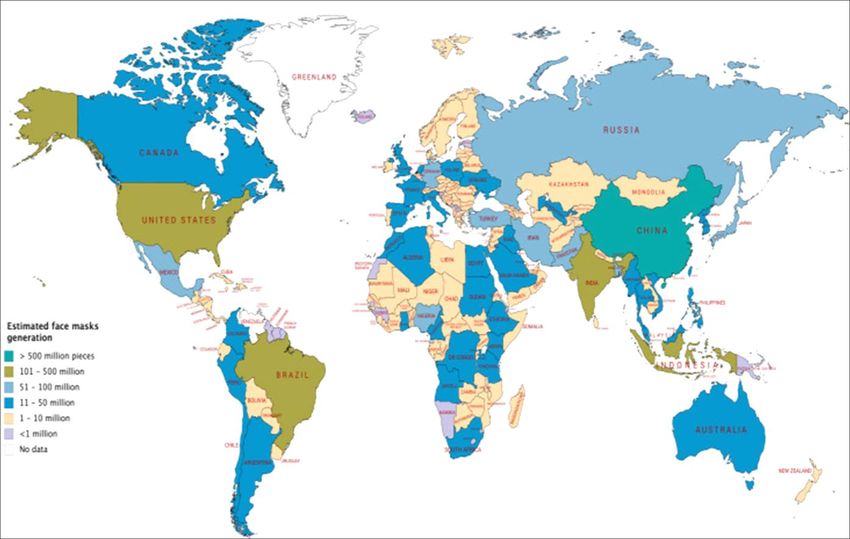
14Figure 7: Estimated number of face masks discarded as COVID-19 waste by country77
Further research is necessary to find sustainable solutions and mitigation measures to
reduce the environmental impact of PPE waste, such as eco-friendly materials, the
development of reusable equipment (that meets the needs of healthcare professionals) and
greener manufacturing processes.78
Country insights
Italy (Lombardy)79
Findings from the Lombardy study show:
- An increased costs for waste management
- PPE materials (specifically masks) have the potential to increase levels of microplastics in
the marine environment
- The amount of waste from PPE used by the general population was more than all the other
categories (figure 8), for all phases of the pandemic for masks (a) and in phases 1 and 280
only of the pandemic for gloves (b)
Three more environmentally friendly alternatives to PPE use proposed:
1. Hand Sanitisers
2. Social distancing
3. Reusable masks
77
https://www.sciencedirect.com/science/article/pii/S2405844021004485
78
https://www.sciencedirect.com/science/article/pii/S2405844021004485
79
Environments | Free Full-Text | Evaluating the Environmental Impacts of Personal Protective Equipment Use by the General Population during the COVID-19
Pandemic: A Case Study of Lombardy (Northern Italy) (mdpi.com)
80
Phase 1- 9th March until 18 May 2020 (first lockdown); phase 2 - 19 May 14 June (period of easing following of lockdown)
15Figure 8 Production rates of wastes from different sectors for masks for all of 2020 (a) and for
gloves for phases 1 and 2 only (b)
Sub-Saharan Africa81
Research from Sub-Saharan Africa makes the following recommendations to reduce the
impact on the environment and human health of increased PPE:
- Health and environmental advocates, governments and non-governmental organisations
(NGOs) need to improve public education on the need to properly discard used PPE
to reduce sources of environmental pollution and harming human lives
- Collection bins should be provided for disposing of PPE equipment materials alongside
other wastes (including markets, truck parks, tourist sites, and attraction centres)
- Governments should encourage the use of PPE that can be treated with disinfectant and
reused and masks that are eco-friendly
- Innovative ways of recycling used PPE are necessary to avoid litter
United Kingdom82
A UK study exploring the environmental impact from the most common PPE items estimated
that:
- Carbon footprint of PPE distributed during the study period (6 months) totalled 106,478
tonnes of carbon dioxide equivalents with the greatest contributions from gloves,
aprons, face shields and Type IIR surgical masks
- Scenario modelling indicated UK manufacture would have reduced the carbon footprint
by 12%; eliminating gloves (handwashing only) would have reduced carbon footprint by
45%; reusing gowns (laundered 75 times) and face shields (cleaned with detergent wipes
five times) would reduce carbon footprint by 10% and maximal recycling of products
(including seeking recycled materials) would reduce carbon footprint by 35%
Whilst this study is based on modelling and has some limitations it is useful to help explore
the potential options to try to minimise and mitigate the environmental impact of increased use
of PPE.
81
https://www.tandfonline.com/doi/full/10.1080/15487733.2020.1857571
82
https://journals.sagepub.com/doi/full/10.1177/01410768211001583
16Country insight: South Africa
South Africa has been following an alert level system (figure 9) to determine the levels of
restrictions for the public, manage non-pharmaceutical interventions and the easing of
lockdown measures83
Figure 9: COVID-19 alert levels in South Africa
Co-morbidities and COVID-19 in South Africa
A study anticipating the impact of COVID-19 and comorbidities on the South African
healthcare system by agent-based simulations published in April 202184 reported that:
- Since 2007, tuberculosis (TB) has been the leading cause of death from a single
infectious agent worldwide, ranking above human immunodeficiency virus (HIV) and
acquired immune deficiency syndrome (AIDS)
- The danger is not only a coinfection, as observed for TB and HIV for a long time, but
that both TB and COVID-19 affect the respiratory organs and thus potentiate their
effect or accelerate the critical course
- The African continent faces preconditions in regard to healthcare capacities and
social welfare which may hinder service delivery for COVID-19 patients and given
the high TB prevalence rates, COVID-19 could lead to a more severe outcome in
African countries, e.g. South Africa
- Data estimation from the WHO TB and public infrastructure data, show that the
symptomatic critical case rate, which affects the healthcare system, is between 8 and
12% due to the interaction of COVID-19 and TB, for a TB population of 0.52% in South
83
https://www.gov.za/covid-19/about/about-alert-system
84
https://pubmed.ncbi.nlm.nih.gov/33846378/
17Africa. This TB prevalence leads to a significant increase in the peak load of critical
cases of COVID-19 patients and potentially exceeds current healthcare capacities
A further review of the impact of COVID-19 in Africa more generally indicated that the course
and outcomes of the pandemic seem to be also dependent on key morbidities prevalent in
a country as well as related healthcare factors such as:85
- pathophysiological processes underlying the interaction of coinfections and
comorbidities in shaping prognosis of COVID-19 patients
- epidemiology of key coinfections and comorbidities, and the state of related
healthcare infrastructure that might shape the course of the pandemic and
- implications of the above for pandemic management and post-pandemic priorities
Epidemiological update from South Africa
- Deaths and tests first peaked in summer 2020 with a further peak in January 2021
(figure 10)
- A sharp decline in testing capacity has been observed in the final week, although this
may be due to incomplete data, further investigation would be required to verify this
decline
Figure 10 COVID-19 deaths and tests in South Africa per 1 million from 07/02/2020 to 11/06/2021
(Extracted 14/06/2021)86
80
70
60
50
40
Deaths per 1 30
million 20
10
0
9,000
8,000
7,000
6,000
5,000
4,000
Tests per 1 3,000
2,000
million
1,000
0
07/08/2020
07/02/2020
07/03/2020
07/04/2020
07/05/2020
07/06/2020
07/07/2020
07/09/2020
07/10/2020
07/11/2020
07/12/2020
07/01/2021
07/02/2021
07/03/2021
07/04/2021
07/05/2021
07/06/2021
85
https://onlinelibrary.wiley.com/doi/epdf/10.1111/tmi.13504
86
https://ourworldindata.org/coronavirus-data-explorer
18Vaccination in South Africa
Figure 11 shows the numbers vaccinated in South Africa from February 2021 to June 2021
and illustrates the following:
- There has been a rapid increase in the number of vaccinations reaching around
28,500 per 1 million in June 2020
- The number of people fully vaccinated is equal to the total number of vaccinations
administered until May 2020: this is because most of the vaccinations that were being
used in South Africa were 1-dose vaccines
- With regard to the number of people fully vaccinated, we begin to see the line diverge
from total vaccinations in May, this may be a result of Pfizer BioNTech vaccinations
(2-dose vaccine) being introduced in South Africa on 17 May 202187
- Data for people fully vaccinated stops at 28/05/2021 as a result of incomplete data,
thus, as it is a cumulative count we have highlighted the remaining points as a dashed
line, as we appreciate the true value would lie between the dashed line and the total
vaccinations line
- The final weeks’ worth of data may not be accurate due to incomplete data. However,
further investigation would be required to verify this
Figure 11: Cumulative COVID-19 vaccinations administered and people fully vaccinated in South
Africa per 1 million from 05/02/2021 to 11/06/2021 (Extracted 14/06/2021) 88
30,000
Total Vaccinations
25,000 People Fully Vaccinated
20,000
15,000
10,000
5,000
0
87
https://github.com/owid/covid-19-data/blob/master/public/data/vaccinations/country_data/South%20Africa.csv
88
https://ourworldindata.org/coronavirus-data-explorer
19Figure 12: Timeline of Weekly COVID-19 cases in South Africa per 1 million, from 05/02/2021 to 11/06/2021 (Extracted 14/06/2021) 89
2500
2. SA went to Alert Level 4 from 01/05/20 – 31/05/20
3. SA went to Alert Level 3 from 01/06/20The country was on alert
– 17/08/20
level 2 from 00h01 on 18
4. SA went to Alert Level 2 from 18/08/20 – 20/09/20
August 2020 The country is on adjusted
5. SA went to Alert Level 1 from 21/09/20 – 28/12/20 alert level 3 from 16 June
2000
6. SA went to Alert
TheLevel 3 from
country was29/12/20 – 28/02/21
on alert level 3 2021
from 1 June to 17 August 2020
7. SA went to Alert Level 1 from 01/03/21 – 30/05/21
8. SA went to Alert Level 2 from 31/05/21 – 15/06/21
The country was on
9. SA adjusted to Alert Level 3 from 16/06/21. adjusted alert level 3 from
1500 The country was on alert level The country was on adjusted
29 December 2020 to 28 alert level 2 from 31 May to 15
4 from 1 to 31 May 2020.
February 2021 June 2021
1000
The country went into The country was on adjusted
lockdown from midnight The country was on alert level 1 from 1 March to
26 March to 30 April 2020. alert level 1 from 21 30 May 2021
(Alert level 5) September to 28
December 2020
500
0
89
https://ourworldindata.org/coronavirus-data-explorer- For the majority of the time the testing strategy has been open public testing90
- There was a period of time in April 2020 where only those showing symptoms of
COVID-19 were tested
Overall, with regard to cumulative totals:
- 200,902.7 tests have been carried out per 1 million in South Africa (time period:
07/02/2020 to 11/06/2021)
- 974 people per 1 million in South Africa have died in relation to COVID-19 (time period:
07/02/2020 to 11/06/2021)
- 29,901.5 vaccinations have been administered per 1 million people in South Africa
(time period: 05/02/2021 to 11/06/2021)
- 29,457.4 cases have been reported per 1 million of South Africa’s population (14 June
2021)
Variants of concern (VOC) in South Africa
- The GISAID Initiative promotes the rapid sharing of data from all influenza viruses
and the coronavirus causing COVID-19 – including genetic sequencing and related
clinical and associated epidemiological data91
- Data extracted from GISAID cannot be used to determine prevalence, however, it does
show the number of genomes sequenced and submitted to the initiative
– The first detection of the Delta variant in South Africa was from a sample collected on
the 24 April 2021. The latest report (28 June 2020) acknowledges that the Delta
variant is rapidly displacing the Beta variant in South Africa and there is clear
evidence of community transmission of the Delta variant.92
90
https://worldhealthorg.shinyapps.io/covid/
91
https://www.gisaid.org/about-us/mission/
92
https://www.gov.za/speeches/minister-blade-nzimande-plans-post-school-education-and-training-institutions-coronavirus
21The International Horizon Scanning and Learning reports are developed by the International
Health Team / the International Health Coordination Centre (IHCC) at the WHO Collaborating
Epidemiological
Centre on Investmentupdate
for Health and Well-being (WHO CC), Public Health Wales.
Executive lead and WHO CC Director: Mark A Bellis
International health lead and WHO CC Deputy Director: Mariana Dyakova
Lead consultant in public health: Claire Beynon
Authors and contributors: Anna Stielke, Charlotte Bowles, Andrew Cotter-Roberts, Corinne
Bourke, Mischa Van Eimeren, James Allen, Benjamin Bainham, Abigail Instone
Contacts: Claire.Beynon@wales.nhs.uk; Anna.Stielke@wales.nhs.uk
All reports are available at: https://phwwhocc.co.uk/covid-19/international-horizon-scanning/
phwwhocc.co.uk
@phwwhocc
/Phwwhocc
22You can also read