A longitudinal analysis of COVID 19 lockdown stringency on sleep and resting heart rate measures across 20 countries - Nature
←
→
Page content transcription
If your browser does not render page correctly, please read the page content below
www.nature.com/scientificreports
OPEN A longitudinal analysis of COVID‑19
lockdown stringency on sleep
and resting heart rate measures
across 20 countries
Ju Lynn Ong1, TeYang Lau1, Mari Karsikas2,3, Hannu Kinnunen2 & Michael W. L. Chee1*
Lockdowns imposed to stem the spread of COVID-19 massively disrupted the daily routines of many
worldwide, but studies to date have been mostly confined to observations within a limited number of
countries, based on subjective reports and surveys from specific time periods during the pandemic.
We investigated associations between lockdown stringency and objective sleep and resting-heart
rate measures in ~ 113,000 users of a consumer sleep tracker across 20 countries from Jan to Jul
2020, compared to an equivalent period in 2019. With stricter lockdown measures, midsleep times
were universally delayed, particularly on weekdays, while midsleep variability and resting heart rate
declined. These shifts (midsleep: + 0.09 to + 0.58 h; midsleep variability: − 0.12 to − 0.26 h; resting
heart rate: − 0.35 to − 2.08 bpm) correlated with the severity of lockdown across different countries (all
Ps < 0.001) and highlight the graded influence of stringency lockdowns on human physiology.
Sans social obligations, sleep–wake timings are determined by the interaction between an individual’s circadian
clock and the timing of natural light e xposure1,2. However, in most industrialized societies, organized work
with its complex web of values and activities have insidiously and incrementally transformed our natural sleep
patterns. Modern-day workers are likely to go to bed later, sleep less regularly and get exposed to greater stress
than their predecessors3–5.
Recent lockdowns imposed around the world to contain the spread of COVID-19 resulted in massive disrup-
tion of daily routines surrounding work and face-to-face social i nteractions6–8. In theory, closure of workplaces
and schools as well as sports, entertainment and social hubs should free up much time for neglected uses of time,
including sleep. Work-from-home arrangements can afford individuals more latitude to adopt their preferred
sleep–wake timings9. In turn, this could reduce variability in sleep timing that, when high, has been linked
to poor sleep quality, impaired health and well-being as well as metabolic abnormalities10–14. On the other
hand, being in a state of lockdown might cause anxiety and depression for many, reducing the amount of sleep
obtained15. In addition, reduced morning light exposure and increased evening light exposure from screens could
lead to progressive delays in c hronotype16 and a loss of circadian rhythm e ntrainment17. Perhaps as a consequence
of the aforesaid factors that push sleep in opposite directions, reports of sleep behavior during the lockdown
suggest only modest gains in sleep t ime15,18–23 and are mixed depending on region and demographic surveyed
as well as study design (e.g. cross-sectional vs. longitudinal) and instrumentation (e.g. single-item/multi-item
questionnaire vs. sleep tracking device) used.
To date, studies documenting COVID-19 pandemic changes in sleep behavior and their potential health impli-
cations have largely been confined to observations within a country or a limited number of c ountries6–8,18,20,22,24–32,
with only a handful surveying from a wider geographic region21,33–35. As prevailing social norms and the severity
of lockdowns differ across countries, the generalizability of such reports is unclear. Additionally, most studies
have utilized questionnaires in which baseline data was inferred from participant recollection of past sleep habits
and few studies have followed the temporal evolution of sleep through both lockdown and the lifting of restric-
tions. Finally, many of the existing reports also naturally take advantage of samples that the research group has
ready access to and even ‘international surveys’ tend to be biased to persons who are educated and concerned
enough to take part. This is a key reason why multi-country, objective, passively collected, longitudinal data is
important to give a ‘bird’s eye view’ of what is occurring in the wider population.
1
Centre for Sleep and Cognition, Human Potential Program, Yong Loo Lin School of Medicine, National University
of Singapore, 12 Science Drive 2, Singapore 117549, Singapore. 2Oura Health, Oulu, Finland. 3Centre for Life
Course Health Research, University of Oulu, Oulu, Finland. *email: michael.chee@nus.edu.sg
Scientific Reports | (2021) 11:14413 | https://doi.org/10.1038/s41598-021-93924-z 1
Vol.:(0123456789)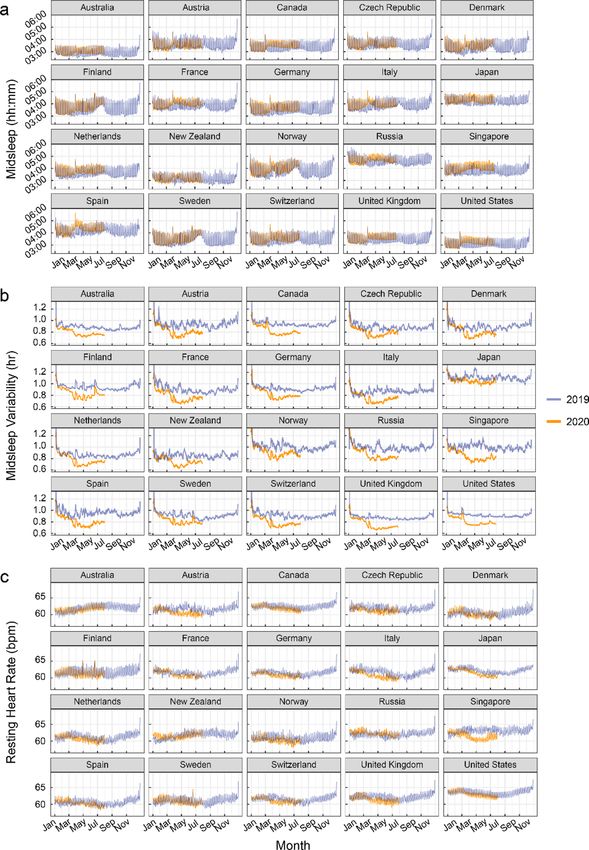
www.nature.com/scientificreports/
To fill these gaps in our understanding of sleep behavior throughout this challenging period, we analyzed
nocturnal sleep behavior and resting heart rate of ~ 113,000 users of the Oura ring sleep tracker from Jan to Jul
2020, using an equivalent period in 2019 as a baseline control. The Oura ring is a novel multisensor device that
uses motion, heart-rate and temperature sensors to detect sleep/wake states (https://ouraring.com/). It has been
validated in various population groups with sleep–wake detection performance comparable to that of research
grade actigraphy and p olysomnography36–40, and HR measurement comparable to that of ECG ( R2 = 0.996 with
a mean bias of − 0.63 bpm)41. This tracker allowed for large streams of longitudinal data to be collected during
this period with minimal user effort, enabling analysis from a pre-pandemic baseline period, through lockdowns
and lifting of restrictions in the 20 countries, spanning regions in North America, Europe, Asia and Oceania.
We sought to (a) assess how two critical sleep parameters were influenced by pandemic-related lockdown
and subsequent partial lifting of restrictions, (b) determine the extent to which these sleep parameters were
influenced by the severity of lockdown measures and (c) relate how alterations in sleep behavior affected resting
heart rate, an indicator of cardiovascular health. To optimize clarity and utility of sleep data from a public health
perspective, we focused on average midsleep time and sleep variability. The former provides a compact measure
that is influenced by later bed and wake times linked to academic and health outcomes42,43, while the latter is an
indicator of irregular sleep/wake patterns—also associated with negative health and cognitive outcomes inde-
pendently of sleep d uration10,12,44,45. Lockdown stringency was assessed using scores extracted from the Oxford
Government Response T racker46, which considers factors such as school and workplace closures, cancellations
of public events and gatherings and closures of public transport.
Results
Regional and global trends in sleep and resting heart rate. Data was obtained from Oura users who
had valid sleep and HR records across two equivalent periods in 2019 and 2020. Only countries with a minimum
of 500 users were included in subsequent analyses. Sample size, age, BMI and proportion of male users by coun-
try are detailed in Table S1A while stringency indices by country alongside midsleep times, midsleep variability
and resting heart rate values for each month are detailed in Table S1B–D. Users were predominantly male in all
countries, with mean age between 35 and 45y. Lockdowns were strictest between the months of Apr and May in
most countries surveyed, with the exception of Australia—which peaked in July.
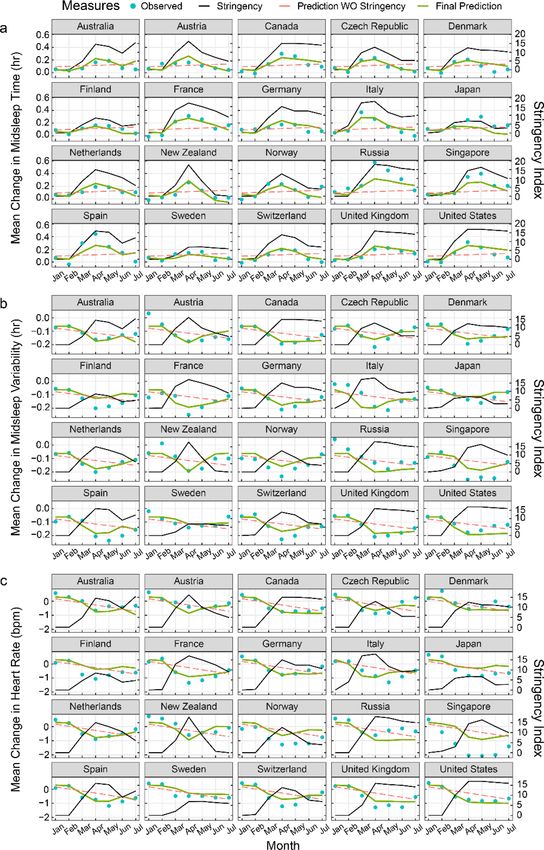
Figure 1 shows plots of descriptives across 2019 and 2020 for the 3 indicator variables inspected: (a) midsleep
time, (b) midsleep variability and (c) resting heart rate (interactive plots are provided in Supplementary Materi-
als), while plots for sleep duration are shown in Figure S1A. Qualitatively, we observed that midsleep time as well
as resting heart rate showed weekday-weekend differences whereby weekends (periodic 7-day peaks) presented
later midsleep time as well as higher resting heart rate compared to weekdays (periodic 7-day troughs) (Fig. 1).
Inspection of trends also suggest that when lockdowns were most severe across 20 countries (Table S1B–D), mid-
sleep time shifted later, midsleep variability decreased and resting heart rate decreased. Later weekday midsleep
times appeared to be contributed by delayed bedtimes and commensurately more delayed wake times (elevated
troughs of orange relative to blue time courses in Figure S1B–C), decreasing the weekday-weekend difference
in midsleep times and in turn reducing midsleep variability.
Lockdown stringency modulates changes in sleep and resting heart rate. Mirroring the het-
erogeneity in the severity of lockdowns, the shifts in midsleep time and sleep regularity differed widely across
countries as evidenced by the high heterogeneity I2 statistic (> 75%). Forest plots (Fig. 2) depict country-level,
month-by-month trends in the lockdown related shifts in midsleep time, midsleep variability and resting heart
rate obtained by comparing monthly averages of data from comparable days in 2020 and 2019. Pooled effects
derived from a random effects meta-analyses representing global changes by month are shown below each forest
plot. In general, the largest shifts in midsleep time (+ 0.09 to + 0.58 h), midsleep variability (− 0.12 to − 0.26 h)
and resting heart rate (− 0.35 to − 2.08 bpm) occurred in April and May when most countries imposed their
strictest lockdown measures. Conversely the gradually lifting of restrictions from around June was accompanied
by a return to patterns recorded in the previous year.
Multilevel modelling revealed that the extent to which sleep timings and resting heart rate shifted during
the pandemic’s most pressing early months, could be largely explained by the severity of the stringency index
(Fig. 3 and Tables S2–S4). Marginal R2 values increased from 0.02, 0.18 and 0.28 in baseline models to 0.56, 0.60
and 0.57 for midsleep time, midsleep variability and resting heart rate respectively when stringency index was
included as a predictor in the model. For each unit increase in stringency index, midsleep time was delayed by
0.96 ± 0.15 min (mean ± CI; Model 2, Table S2) midsleep variability decreased by 0.46 ± 0.08 min (mean ± CI;
Model 2, Table S3) and resting heart rate decreased by 0.06 ± 0.01 bpm (mean ± CI; Model 2, Table S4).
Changes in sleep patterns predict changes in resting heart rate. Finally, in models predicting
2020–2019 changes in resting heart rate associated with changes in midsleep time, midsleep variability and
absolute sleep duration, we found that while each of the three variables significantly predicted resting heart
rate in separate models, the model fit was significantly improved when all three predictors were included in the
model (marginal R2 = 0.75, Table 1) compared to all previous models (all Ps < 0.001). In this model (Model 5),
midsleep variability was also shown to be the strongest predictor of resting heart rate, wherein an hour increase
in the standard deviation of midsleep variability predicted a 5.12 ± 1.07 increase in bpm, while an hour increase
in midsleep time only predicted a 1.25 ± 0.55 decrease in bpm. Sleep duration in 2020 also no longer signifi-
cantly predicted resting heart rate changes in Model 5 (Table 1). The final model fit using Model 5 was fitted to
each country (Fig. 4). It was evident that the fitted curves mirrored the trends of changes in midsleep variability
observed in each country.
Scientific Reports | (2021) 11:14413 | https://doi.org/10.1038/s41598-021-93924-z 2
Vol:.(1234567890)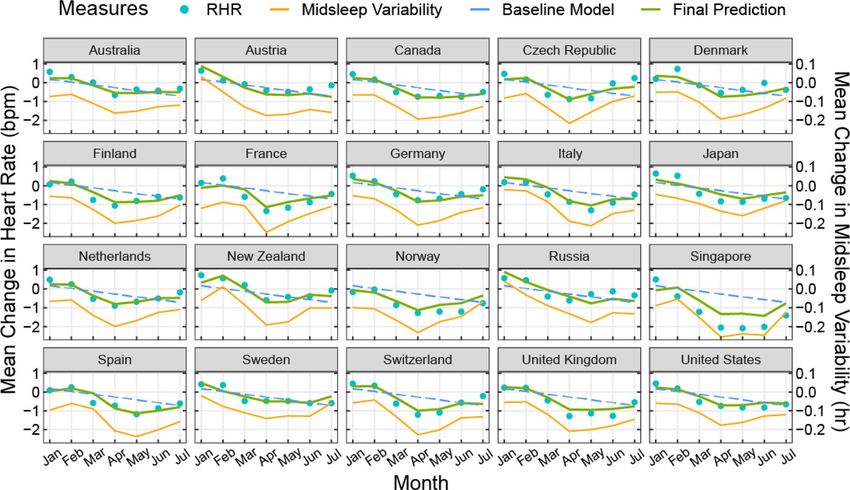
www.nature.com/scientificreports/

                                  Figure 1.  Sleep patterns and resting heart rate measures by country. (a) midsleep time, (b) midsleep variability
                                  and (c) resting heart rate from Jan to Jul 2020 (orange curves), compared to Jan–Dec 2019 (purple curves).
                                  Dates in 2019 were shifted in order to ensure a matching by day of the week. Daylight savings time (social clocks
                                  shifted later by 1 h) began in March in select countries of the Northern Hemisphere, and ended in April in
                                  Australia and New Zealand (social clocks shifted earlier by 1 h), explaining sudden shifts in midsleep time and
                                  variability on these dates.

                                  Discussion
                                  In all 20 countries across 4 continents, objective data obtained over successive years showed that pandemic-
                                  related lockdowns delayed sleep midpoint, reduced sleep variability and reduced resting heart rate as a function
                                  of the prevailing lockdown severity. Favorable resting heart rate decreases were most strongly related to reduction
                                  in sleep variability even after accounting for sleep duration. Although these changes were generalized across
                                  geographies and cultures, they unwound with easing of lockdowns.

Scientific Reports |   (2021) 11:14413 |               https://doi.org/10.1038/s41598-021-93924-z                                                  3

                                                                                                                                              Vol.:(0123456789)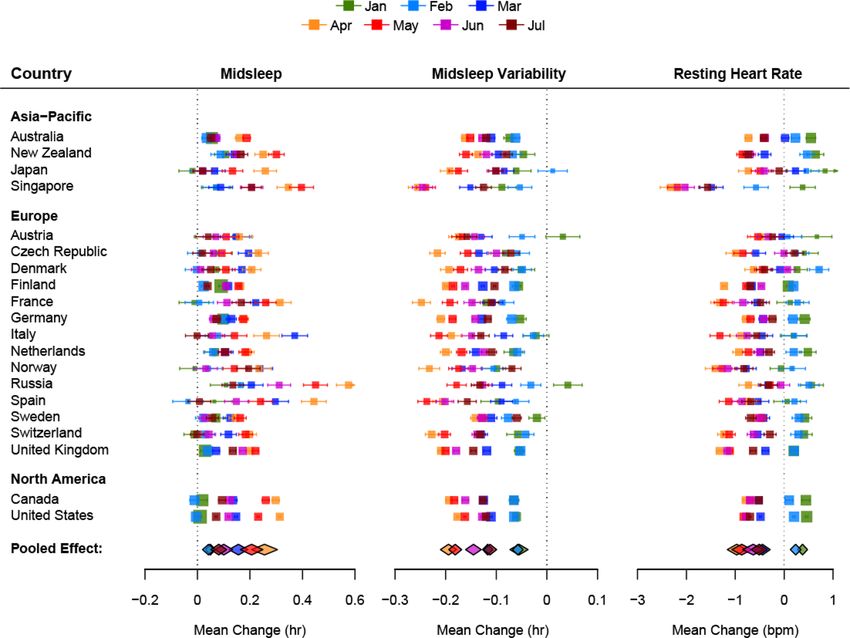
www.nature.com/scientificreports/
Figure 2. Forest plots of the average change in midsleep time, midsleep variability and resting heart rate by
month and country. The size of the colored squares is proportional to the sample size of each country while
whiskers indicate the mean and 95% confidence interval of the estimated difference between 2020 and 2019
by month (Jan–Jul). The overall pooled effect across countries for each month is represented by the colored
diamonds below each plot.
Later timing of sleep has been associated with higher rates of metabolic dysfunction and cardiovascular
isease47–50, while deviations from normal bedtimes have been shown to elevate resting heart r ate51. There is also
d
a risk that absence or attenuation of social cues together with reduced morning light exposure and increased
evening light exposure from screens could lead to a loss of circadian rhythm entrainment17. However, freed from
the usual obligations to wake up earlier than preferred during lockdown and removal of commuting time, the
negative effects of later bedtimes were partially compensated by later wake times and reduced weekday-weekend
sleep timing differences, with resultant gains in sleep regularity—results similarly echoed in prior w ork18,20,22.
44
The latter can have positive effects on cardiometabolic h ealth possibly reflected here in reduced resting heart
rate. While a lower resting heart rate is most often associated with higher physical fitness, studies examining
physical activity following lockdown have found declines of up to 40%52,53, making improved fitness an unlikely
contributor in this context. Instead, our data indicated that at the country-level, sleep variability alone explained
70% of the variance in resting heart rate.
Our analysis also critically compared equivalent days across successive years. Raw measures in individual
countries contain weekday-weekend, holiday and seasonality effects (e.g. in 2019) whereby weekends and holi-
days qualitatively show later sleep midpoints and higher resting heart rates. Conversely, summertime presented
with later sleep midpoints, but with reduced sleep variability and lower resting heart rate. Seasonality effects are
modulated by residential latitude and are phase-opposite in the Southern Hemisphere (Australia, New Zealand)
compared to the Northern Hemisphere, while being practically absent in equatorial countries like S ingapore54.
Seasonality effects also appeared to be modulated during the lockdown, with an apparent advance in the onset
of summertime in the Northern hemisphere and apparent prolongation of summertime in the South.
The benefits of improving sleep on health have economic impact and are increasingly r ecognized55. A large,
time-use study suggested that interventions to increase sleep should concentrate on delaying morning start time
for work and educational activities, increasing sleep opportunities and reducing commute times56. Creating
greater opportunity for sleep by working from home and giving workers some flexibility in sleeping according
to preferred s chedules57 could yield benefits to both productivity and sleep health if properly i mplemented9,58. To
Scientific Reports | (2021) 11:14413 | https://doi.org/10.1038/s41598-021-93924-z 4
Vol:.(1234567890)www.nature.com/scientificreports/
Figure 3. Prediction of changes in sleep patterns and resting heart rate by lockdown stringency. Plots for fitted
models (green curves) across 20 countries estimating changes in (a) midsleep time, (b) midsleep variability and
(c) resting heart rate using lockdown stringency as a predictor. Observed mean differences between 2020 and
2019 (blue dots), lockdown stringency (black line) and predictions without (WO) lockdown stringency in the
model (red dashed line) are also shown for comparison.
Scientific Reports | (2021) 11:14413 | https://doi.org/10.1038/s41598-021-93924-z 5
Vol.:(0123456789)www.nature.com/scientificreports/
Model 1 Model 2 Model 3 Model 4 Model 5
Fixed effects β (SE)
Intercept 0.18 (0.10) 5.85 (2.07)** 0.38 (0.08)*** 0.64 (0.07)*** − 1.18 (1.26)
Month − 0.15 (0.02)*** − 0.14 (0.03)*** − 0.13 (0.02)*** − 0.08 (0.02)*** − 0.08 (0.01)***
Sleep duration (h) – − 0.82 (0.30)** – – 0.27 (0.18)
Δ Midsleep (h) – – − 2.38 (0.29)*** – − 1.25 (0.28)***
Δ Midsleep 6.21 5.12
– – –
Variability (h) (0.50)*** (0.55)***
Random effects σ2 (SE)
Intercept 0.00 (0.06) 0.00 (0.09) 0.00 (0.03) 0.01 (0.02) 0.01 (0.01)
Residual 0.23 (0.07) 0.26 (0.10) 0.15 (0.04) 0.08 (0.02) 0.07 (0.01)
Number of parameters 5 6 6 6 8
Model comparison
AIC 140.31 136.42 87.73 41.62 26.11
Likelihood ratio (χ2)a – 5.88* 54.57* 100.69*** 120.20***
Marginal R2 0.28 0.31 0.52 0.70 0.75
Conditional R2 0.28 0.31 0.52 0.73 0.79
Table 1. Model fit statistics predicting changes in resting heart rate. Unstandardized fixed and random effects
and model fit statistics for five multilevel models predicting change in resting heart rate (bpm) from change
in sleep patterns. Model 1 represents the baseline model while Models 2–4 included additional predictors for
sleep duration (Model 2), change in midsleep time (Model 3) and change in midsleep variability (Model 4)
factors. Finally, Model 5 included all three additional predictors to assess the independent contributions of
each predictor in the model. SE, standard error; AIC, Akaike information criterion. a Likelihood ratio value is
based on comparison to Model 1. *P < .05; **P < .01; ***P < .001.
Figure 4. Prediction of changes in resting heart rate by changes in sleep patterns. Plots showing final fitted
models (green curves) across 20 countries predicting changes in resting heart rate (RHR) (2020–2019) using
changes in midsleep time, changes in midsleep variability, and sleep duration in 2020 as time-varying predictors
in the same model. Observed mean differences between 2020 and 2019 (blue dots) and predictions without sleep
variability in the model (blue dashed line) are also shown for comparison. Sleep variability was found to be the
strongest predictor of resting heart rate and is shown here in orange solid line for visualization purposes.
Scientific Reports | (2021) 11:14413 | https://doi.org/10.1038/s41598-021-93924-z 6
Vol:.(1234567890)www.nature.com/scientificreports/
realize sustained improvements in sleep behavior, a critical area to address is the erosion of boundaries between
work and home life, and a growing expectation for workers to be ‘always on’ and reachable using information
and communications t echnology59,60. For example, in France, there are laws governing the ‘right to disconnect’,
to protect employees from having to engage in work-related electronic communications beyond working h ours60.
The explosive expansion of video-conferencing has made functional home-based work and learning widely
accessible—something unlikely had the current pandemic occurred just two decades ago. The precipitous growth
in remote work and learning was reflected in a 10–60% rise in internet traffic within OECD countries during
the early lockdown period in Mar–Apr 202061. The National Bureau of Economic Research found that for over
3 million users across 16 metropolitan areas, COVID-19 related mobility restrictions lengthened workdays by
48.5 min from the sending of emails outside regular working h ours62. One network service provider reported an
increase of 1–3 work hours per day in the US, UK, France, Spain, Canada and the Netherlands. In lieu to time
saved from not having to commute, some started work earlier but ended at their habitual t ime63. Outside work,
online gaming platforms and social media activity also increased64. Facebook reported increases of 100% on voice
over internet calls and 50% in text messages on WhatsApp, Facebook Messenger and Instagram platforms during
lockdown. For those with young children, adapting to home-based learning may also have displaced work time
later. Some workers could also deliberately procrastinate sleep to regain a sense of control of personal time use.
Together, these new daily routines could have contributed to progressively delayed midsleep timing. Future stud-
ies, supplemented by tools like ecological momentary assessments, would do well to understand heterogeneity in
individual reactions to the blurring of work/non-work boundaries merits, and to include a wider demographic,
particularly shift workers and lower income persons who live outside urban centers.
While this study highlights the strengths of being able to rapidly and remotely assess the impact of vari-
ous intervention policies on sleep and resting heart rate, there are a few limitations to consider. (1) Only sleep
periods between 4 and 12 h were analyzed. Shorter sleep periods could increase in frequency with work from
home arrangements, but is in general challenging to detect and distinguish from other brief periods of sedentary
behavior, e.g. sitting in bed reading a book or watching television. (2) Oura users typically come from middle
to upper class households who could be more cushioned by the impact of COVID-19 and have flexible work
arrangements. (3) Sleep quality measures were not obtained. These could be affected by anxiety over potential
loss of jobs or contracting the disease. Results reported to date are mixed, and largely dependent on the demo-
graphic surveyed. Health professionals65, those with low levels of education65, shift workers15, individuals who
showed symptoms of COVID-1915, those who usually lead active lifestyles66, females27,32, those who were laid off
from jobs or experienced domestic c onflicts35 and certain groups of s tudents27,32 were amongst those more likely
to report poorer quality during the lockdown. (4) As these data were extracted from a large wearable database,
demographic variables (age, BMI, gender) were self-reported, and we were not able to obtain information about
occupations, shift work status, presence of sleep disorders, medications, alcohol use, ethnic backgrounds, free
versus work days or caregiving responsibilities of these users. Those with additional childcare responsibilities
due to school closures or have had a member of the household fall ill might also have had to work late hours in
order to catch up on work. Not-withstanding these limitations, our models based on stringency indices were
able to capture > 50% of the variance in sleep and resting heart rate measures, indicating that it is a key predictor
of sleep and resting heart rate trends during this period.
In sum, the use of large-scale wearable data revealed consistent and geographically widespread nature of the
correlation between lockdown severity and shift to delayed but more regular sleep with reductions in resting
heart rate measures. These findings should spur governments to consider the secondary health impact of various
policies and interventions during this period and beyond.
Methods
Dataset. Data from 2019 was used as the reference year, representing a typical annual cycle and seasonal
variation, for example, in terms of holidays, amount of light/daylength, and incidence of influenza-like illnesses.
In order to ensure alignment by day of the week between 2019 and 2020, days were shifted before further com-
putations were conducted. Due to the extra leap day in 2020, data was shifted by 1 day in Jan and Feb 2020 and
by 2 days in Mar–Jul 2020. Local timestamps for each country and time zone were also utilized, which included
shifts that reflect daylight savings start (Mar–Apr in the Northern Hemisphere, Sep–Oct in the Southern Hemi-
sphere) and end points (Apr in the Southern Hemisphere, Sep–Nov in the Northern Hemisphere). Paired dif-
ferences between matching days in 2019 and 2020 for users who had valid data in both timepoints were then
computed and included in subsequent analyses.
Each valid sleep period was defined as the longest sleep episode for each day, with time in bed between 4 and
12 h. Three major variables were then extracted for each of these sleep periods: (1) Midsleep time was computed
as the midpoint between bedtime and wake time, representing a proxy for circadian phase/chronotype67 (2)
Midsleep variability was computed using a rolling 7-day standard deviation of midsleep times, representing a
proxy for sleep time regularity, and (3) Resting heart rate was computed as an average of 5-min heart rate meas-
ures during the sleep period, across all sleep stages. Only sleep periods were considered in the assessment of
RHR, because there are fewer confounding factors (e.g. food/alcohol/caffeine intake, prior physical activity and
ambient temperature) during sleep as compared to daytime wake periods. Average resting heart rates < 30 bpm
and > 100 bpm were removed as these were likely to represent physiologic or device anomalies. Due to an algo-
rithm update in the spring of 2019 that affected computation of sleep duration by delaying bedtimes and advanc-
ing wake times, we could not reliably compare these changes between years. However, absolute sleep duration in
2020 was included as an additional variable in time-varying models predicting resting heart rate.
Age, BMI and gender information was self-reported by users upon app registration, and entered into mod-
els as potential covariates. This study was exempt from formal review by the National University of Singapore
Scientific Reports | (2021) 11:14413 | https://doi.org/10.1038/s41598-021-93924-z 7
Vol.:(0123456789)www.nature.com/scientificreports/
Institutional Review Board following their initial consideration of the protocol, as analysis involved the use of
datasets stored without identifiers.
Computation of stringency index. Publicly available measures of restriction severity were extracted
from the Oxford COVID-19 Government Response T racker46, focusing on 7 subscales believed to be most
reflective of movement controls. These scales consisted of (1) school closures [0–3], (2) workplace closures
[0–3], (3) cancellation of public events [0–2], (4) restrictions on public gatherings [0–4], (5) closures of public
transport [0–2], (6) stay-at-home requirements [0–3] and (7) restrictions on internal movements [0–2]. These
7 subscales were summed up into a single stringency index [range: 0–19] and a mean value was computed for
every month from January to July for each country.
Quantification of regional and global trends in sleep and resting heart rate. Changes in sleep
and resting heart rate measures were derived for each month within each country separately, by first computing
differences between equivalent days in Jan–Jul 2019 and 2020, and then averaging these differences by month.
To estimate global (pooled) changes, separate random-effects meta-analyses by month were conducted for
each predictor of interest—midsleep time, midsleep variability (standard deviation of the midsleep time over
a 7-day rolling window) and resting heart rate. Meta-analyses were conducted using the R package ‘metafor’68.
As there was evidence of high statistical heterogeneity between country estimates by month (Cochrane’s Q;
P < 0.05, I2 > 75%), pooled estimates were weighted by the inverse variance of estimators for each country plus
the estimated variance between countries. Note that values depict means ± 95% confidence intervals (CIs) unless
explicitly stated otherwise.
Quantification of the effect of lockdown stringency on changes in sleep and resting heart
rate. In order to quantify the effect of lockdown stringency on the heterogenous changes in sleep and rest-
ing heart rate patterns across countries, we ran multilevel growth curve models (MLMs) based on a sequential
model-building approach. Multilevel models account for correlations between months within each country by
allowing each country to have its own intercept. A null or baseline model is first constructed, and subsequent
models consisting of the baseline model + additional explanatory variables were added sequentially to assess if
the more complex model improved the overall model fit using a likelihood ratio test with degrees of freedom
equal to the number of extra parameters. A significant likelihood ratio test indicates that the extra parameters
improved the fit of the model to the data.
For each variable of interest (midsleep time, midsleep variability, resting heart rate), baseline MLMs (Model 1)
were first estimated using country as a random intercept, month as a fixed effect, and a first-order autoregressive
term. The latter was included to account for the nature of correlated time points in the repeated variable (month).
Age, gender and BMI were entered as covariates, but were subsequently removed as they did not significantly
improve the baseline model. Finally, in Model 2, we included the average lockdown stringency index by month
as a time-varying factor to Model 1, in order to examine the overall effect of lockdown stringency on sleep and
resting heart rate measures.
Quantification of the effect of changes to sleep patterns on changes to resting heart rate. To
test our hypothesis that changes to sleep patterns (midsleep time and midsleep variability) would lead to asso-
ciated changes in resting heart rate, we conducted further MLM analyses with changes in resting heart rate as
the dependent variable and changes in midsleep time and midsleep variability as explanatory variables. Sleep
duration in 2020 was also included as an additional variable of interest in this model. A baseline MLM (Model
1) with a random intercept, month as fixed effect, and first-order autoregressive structure was first constructed.
Age, gender and BMI were entered as covariates, but were subsequently removed as they did not significantly
improve the baseline model. Next, in Models 2–4, sleep duration in 2020, changes to midsleep time and changes
to midsleep variability were added as time-varying predictors in separate models. Finally, in Model 5, all three
sleep measures were entered in at the same time to assess the independent contributions of each predictor in
the model.
All MLMs were estimated using the full information maximum likelihood method and performed using
the nlme package in R (version 3.6.1). Significance level was determined at an alpha level of 0.05. Marginal and
conditional R2 values for mixed models were calculated based on the method proposed by Nakagawa, Johnson
and Schielzeth69. Notably, the marginal R2 only takes into account the variance of the fixed effects, while the
conditional R2 takes both fixed and random effects into account.
Data availability
The Oura dataset is not publicly available, but aggregate and anonymized data are available from the authors
upon reasonable request, subject to review by an ethics committee.
Received: 15 March 2021; Accepted: 1 July 2021
References
1. Duffy, J. F. & Czeisler, C. A. Effect of light on human circadian physiology. Sleep Med. Clin. 4, 165–177. https://doi.org/10.1016/j.
jsmc.2009.01.004 (2009).
2. Duffy, J. F. & Wright, K. P. Entrainment of the human circadian system by light. J. Biol. Rhythms 20, 326–338. https://doi.org/10.
1177/0748730405277983 (2005).
Scientific Reports | (2021) 11:14413 | https://doi.org/10.1038/s41598-021-93924-z 8
Vol:.(1234567890)www.nature.com/scientificreports/
3. Bannai, A. & Tamakoshi, A. The association between long working hours and health: a systematic review of epidemiological
evidence. Scand. J. Work. Environ. Health 40, 5–18. https://doi.org/10.5271/sjweh.3388 (2014).
4. Ishida, Y., Murayama, H. & Fukuda, Y. Association between overtime-working environment and psychological distress among
Japanese workers: a multilevel analysis. J. Occup. Environ. Med. 62, 641–646. https://doi.org/10.1097/JOM.0000000000001920
(2020).
5. Virtanen, M. et al. Long working hours and sleep disturbances: the Whitehall II prospective cohort study. Sleep 32, 737–745.
https://doi.org/10.1093/sleep/32.6.737 (2009).
6. Di Renzo, L. et al. Eating habits and lifestyle changes during COVID-19 lockdown: an Italian survey. J. Transl. Med. 18, 229. https://
doi.org/10.1186/s12967-020-02399-5 (2020).
7. Elmer, T., Mepham, K. & Stadtfeld, C. Students under lockdown: comparisons of students’ social networks and mental health
before and during the COVID-19 crisis in Switzerland. PLoS ONE 15, e0236337. https://doi.org/10.1371/journal.pone.0236337
(2020).
8. Huckins, J. F. et al. Mental health and behavior of college students during the early phases of the COVID-19 pandemic: longitudinal
smartphone and ecological momentary assessment study. J. Med. Internet Res. 22, e20185. https://doi.org/10.2196/20185 (2020).
9. Bloom, N., Liang, J., Roberts, J. & Ying, Z. Does working from home work? Evidence from a Chinese experiment. Quart. J. Econ.
https://doi.org/10.1093/qje/qju032 (2013).
10. Bei, B., Wiley, J. F., Trinder, J. & Manber, R. Beyond the mean: a systematic review on the correlates of daily intraindividual vari-
ability of sleep/wake patterns. Sleep Med. Rev. 28, 108–124. https://doi.org/10.1016/j.smrv.2015.06.003 (2016).
11. Fischer, D. et al. Irregular sleep and event schedules are associated with poorer self-reported well-being in US college students.
Sleep https://doi.org/10.1093/sleep/zsz300 (2020).
12. Huang, T. & Redline, S. Cross-sectional and prospective associations of actigraphy-assessed sleep regularity with metabolic abnor-
malities: the multi-ethnic study of atherosclerosis. Diabetes Care 42, 1422–1429. https://doi.org/10.2337/dc19-0596 (2019).
13. Lemola, S., Ledermann, T. & Friedman, E. M. Variability of sleep duration is related to subjective sleep quality and subjective
well-being: an actigraphy study. PLoS ONE 8, e71292. https://doi.org/10.1371/journal.pone.0071292 (2013).
14. Molzof, H. E. et al. Intraindividual sleep variability and its association with insomnia identity and poor sleep. Sleep Med. 52, 58–66.
https://doi.org/10.1016/j.sleep.2018.08.014 (2018).
15. Gao, C. & Scullin, M. K. Sleep health early in the coronavirus disease 2019 (COVID-19) outbreak in the United States: integrating
longitudinal, cross-sectional, and retrospective recall data. Sleep Med. 73, 1–10. https://d oi.o
rg/1 0.1 016/j.s leep.2 020.0 6.0 32 (2020).
16. Leone, M. J., Sigman, M. & Golombek, D. A. Effects of lockdown on human sleep and chronotype during the COVID-19 pandemic.
Curr. Biol. 30, R930–R931. https://doi.org/10.1016/j.cub.2020.07.015 (2020).
17. Mehra, R. & Teodorescu, M. Sleep, circadian disruption, and microbial-immune interactions: a new frontier. Chest 154, 740–742.
https://doi.org/10.1016/j.chest.2018.07.007 (2018).
18. Blume, C., Schmidt, M. H. & Cajochen, C. Effects of the COVID-19 lockdown on human sleep and rest-activity rhythms. Curr.
Biol. 30, R795–R797. https://doi.org/10.1016/j.cub.2020.06.021 (2020).
19. Cellini, N., Canale, N., Mioni, G. & Costa, S. Changes in sleep pattern, sense of time and digital media use during COVID-19
lockdown in Italy. J. Sleep Res. 29, e13074. https://doi.org/10.1111/jsr.13074 (2020).
20. Ong, J. L. et al. COVID-19-related mobility reduction: heterogenous effects on sleep and physical activity rhythms. Sleep https://
doi.org/10.1093/sleep/zsaa179 (2020).
21. Sun, S. et al. Using smartphones and wearable devices to monitor behavioral changes during COVID-19. J. Med. Internet Res. 22,
e19992. https://doi.org/10.2196/19992 (2020).
22. Wright, K. P. et al. Sleep in university students prior to and during COVID-19 stay-at-home orders. Curr. Biol. 30, R797–R798.
https://doi.org/10.1016/j.cub.2020.06.022 (2020).
23. Giuntella, O., Hyde, K., Saccardo, S. & Sadoff, S. Lifestyle and mental health disruptions during COVID-19. Proc. Natl. Acad. Sci.
U. S. A. https://doi.org/10.1073/pnas.2016632118 (2021).
24. Guo, Y. et al. Mental health disorders and associated risk factors in quarantined adults during the COVID-19 outbreak in China:
cross-sectional study. J. Med. Internet Res. 22, e20328. https://doi.org/10.2196/20328 (2020).
25. Majumdar, P., Biswas, A. & Sahu, S. COVID-19 pandemic and lockdown: cause of sleep disruption, depression, somatic pain, and
increased screen exposure of office workers and students of India. Chronobiol. Int. 37, 1191–1200. https://doi.org/10.1080/07420
528.2020.1786107 (2020).
26. Morin, C. M. et al. Sleep and circadian rhythm in response to the COVID-19 pandemic. Can. J. Public Health. 111, 654–657.
https://doi.org/10.17269/s41997-020-00382-7 (2020).
27. Romero-Blanco, C. et al. Sleep pattern changes in nursing students during the COVID-19 lockdown. Int. J. Environ. Res. Public
Health https://doi.org/10.3390/ijerph17145222 (2020).
28. Sanudo, B., Fennell, C. & Sanchez-Oliver, A. Objectively-assessed physical activity, sedentary behavior, smartphone use, and sleep
patterns pre- and during-COVID-19 quarantine in young adults from Spain. Sustainability 12, 5890. https://d oi.o rg/1 0.3 390/s u121
55890 (2020).
29. Sinha, M., Pande, B. & Sinha, R. Impact of COVID-19 lockdown on sleep-wake schedule and associated lifestyle related behavior:
a national survey. J. Public Health Res. 9, 1826. https://doi.org/10.4081/jphr.2020.1826 (2020).
30. Son, C., Hegde, S., Smith, A., Wang, X. & Sasangohar, F. Effects of COVID-19 on college students’ mental health in the United
States: interview survey study. J. Med. Internet Res. 22, e21279. https://doi.org/10.2196/21279 (2020).
31. Stanton, R. et al. Depression, anxiety and stress during COVID-19: associations with changes in physical activity, sleep, tobacco
and alcohol use in Australian adults. Int. J. Environ. Res. Public Health 17, 4065. https://doi.org/10.3390/ijerph17114065 (2020).
32. Marelli, S. et al. Impact of COVID-19 lockdown on sleep quality in university students and administration staff. J. Neurol. 268,
8–15. https://doi.org/10.1007/s00415-020-10056-6 (2021).
33. Lee, P. H., Marek, J. & Nálevka, P. Sleep pattern in the US and 16 European countries during the COVID-19 outbreak using
crowdsourced smartphone data. Eur. J. Public Health 31, 23–30. https://doi.org/10.1093/eurpub/ckaa208 (2021).
34. Robbins, R. et al. Estimated sleep duration before and during the COVID-19 pandemic in major metropolitan areas on different
continents: observational study of smartphone app data. J. Med. Internet Res. 23, e20546. https://doi.org/10.2196/20546 (2021).
35. Yuksel, D. et al. Sleeping when the world locks down: correlates of sleep health during the COVID-19 pandemic across 59 countries.
Sleep Health 7, 134–142. https://doi.org/10.1016/j.sleh.2020.12.008 (2021).
36. Asgari Mehrabadi, M. et al. Sleep tracking of a commercially available smart ring and smartwatch against medical-grade actigraphy
in everyday settings: instrument validation study. JMIR mHealth uHealth 8, e20465. https://doi.org/10.2196/20465 (2020).
37. Chee, N. et al. Multi-night validation of a sleep tracking ring in adolescents compared with a research actigraph and polysomnog-
raphy. Nat. Sci. Sleep 13, 177–190. https://doi.org/10.2147/nss.S286070 (2021).
38. de Zambotti, M., Rosas, L., Colrain, I. M. & Baker, F. C. The sleep of the ring: comparison of the ōura sleep tracker against poly-
somnography. Behav. Sleep Med. 17, 124–136. https://doi.org/10.1080/15402002.2017.1300587 (2019).
39. Roberts, D. M., Schade, M. M., Mathew, G. M., Gartenberg, D. & Buxton, O. M. Detecting sleep using heart rate and motion data
from multisensor consumer-grade wearables, relative to wrist actigraphy and polysomnography. Sleep https://doi.org/10.1093/
sleep/zsaa045 (2020).
Scientific Reports | (2021) 11:14413 | https://doi.org/10.1038/s41598-021-93924-z 9
Vol.:(0123456789)www.nature.com/scientificreports/
40. Kinnunen, H. Sleep lab validation of a wellness ring in detecting sleep patterns based on photoplethysmogram, actigraphy and body
temperature. https://d1a0efioav7lro.cloudfront.net/wp-content/uploads/2018/10/23112923/Validity-of-the-OURA-Ring-in-deter
mining-Sleep-Quantity-and-Quality-2016.pdf (2016).
41. Kinnunen, H., Rantanen, A., Kenttä, T. & Koskimäki, H. Feasible assessment of recovery and cardiovascular health: accuracy of
nocturnal HR and HRV assessed via ring PPG in comparison to medical grade ECG. Physiol. Meas. 41, 04nt01. https://doi.org/
10.1088/1361-6579/ab840a (2020).
42. Goldin, A. P., Sigman, M., Braier, G., Golombek, D. A. & Leone, M. J. Interplay of chronotype and school timing predicts school
performance. Nat. Hum. Behav. 4, 387–396. https://doi.org/10.1038/s41562-020-0820-2 (2020).
43. Partonen, T. Chronotype and health outcomes. Curr. Sleep Med. Rep. 1, 205–211. https://doi.org/10.1007/s40675-015-0022-z
(2015).
44. Huang, T., Mariani, S. & Redline, S. Sleep irregularity and risk of cardiovascular events: the multi-ethnic study of atherosclerosis.
J. Am. Coll. Cardiol. 75, 991–999. https://doi.org/10.1016/j.jacc.2019.12.054 (2020).
45. Lunsford-Avery, J. R., Engelhard, M. M., Navar, A. M. & Kollins, S. H. Validation of the sleep regularity index in older adults and
associations with cardiometabolic risk. Sci. Rep. 8, 14158. https://doi.org/10.1038/s41598-018-32402-5 (2018).
46. Hale, T. et al. A global panel database of pandemic policies (Oxford COVID-19 Government Response Tracker). Nat. Hum. Behav.
5, 529–538. https://doi.org/10.1038/s41562-021-01079-8 (2021).
47. Koopman, A. D. M. et al. The association between social jetlag, the metabolic syndrome, and type 2 diabetes mellitus in the general
population: the New Hoorn study. J. Biol. Rhythms 32, 359–368. https://doi.org/10.1177/0748730417713572 (2017).
48. Merikanto, I. et al. Associations of chronotype and sleep with cardiovascular diseases and type 2 diabetes. Chronobiol. Int. 30,
470–477. https://doi.org/10.3109/07420528.2012.741171 (2013).
49. Reutrakul, S. & Knutson, K. L. Consequences of circadian disruption on cardiometabolic health. Sleep Med. Clin. 10, 455–468.
https://doi.org/10.1016/j.jsmc.2015.07.005 (2015).
50. Yu, J. H. et al. Evening chronotype is associated with metabolic disorders and body composition in middle-aged adults. J. Clin.
Endocrinol. Metab. 100, 1494–1502. https://doi.org/10.1210/jc.2014-3754 (2015).
51. Faust, L., Feldman, K., Mattingly, S. M., Hachen, D. & Chawla, N. V. Deviations from normal bedtimes are associated with short-
term increases in resting heart rate. NPJ Digit. Med. 3, 39. https://doi.org/10.1038/s41746-020-0250-6 (2020).
52. Dunton, G. F., Do, B. & Wang, S. D. Early effects of the COVID-19 pandemic on physical activity and sedentary behavior in children
living in the U.S.. BMC Public Health 20, 1351. https://doi.org/10.1186/s12889-020-09429-3 (2020).
53. Tison, G. H. et al. Worldwide effect of COVID-19 on physical activity: a descriptive study. Ann. Intern. Med. 173, 767–770. https://
doi.org/10.7326/M20-2665 (2020).
54. Koskimäki, H., Kinnunen, H., Rönkä, S. & Smarr, B. Following the heart: what does variation of resting heart rate tell about us as
individuals and as a population, in Adjunct proceedings of the 2019 ACM international joint conference on pervasive and ubiquitous
computing and proceedings of the 2019 ACM international symposium on wearable computers. New York, NY, USA, 1178–1181.
https://doi.org/10.1145/3341162.3344836 (2019)
55. Hafner, M., Stepanek, M., Taylor, J., Troxel, W. M. & Van Stolk, C. Why sleep matters - the economic costs of insufficient sleep: a
cross-country comparative analysis. Rand Health Q. https://doi.org/10.7249/RR1791 (2016).
56. Basner, M. et al. American time use survey: sleep time and its relationship to waking activities. Sleep 30, 1085–1095. https://doi.
org/10.1093/sleep/30.9.1085 (2007).
57. Kantermann, T. Behavior: how a global social lockdown unlocks time for sleep. Curr. Biol. 30, R822–R823. https://doi.org/10.
1016/j.cub.2020.06.037 (2020).
58. Vetter, C., Fischer, D., Matera, J. L. & Roenneberg, T. Aligning work and circadian time in shift workers improves sleep and reduces
circadian disruption. Curr. Biol. 25, 907–911. https://doi.org/10.1016/j.cub.2015.01.064 (2015).
59. Becker, W. J., Belkin, L. Y., Conroy, S. A. & Tuskey, S. Killing me softly: organizational e-mail monitoring expectations’ impact on
employee and significant other well-being. J. Manag. https://doi.org/10.1177/0149206319890655 (2019).
60. Von Bergen, C., Bressler, M. & Proctor, T. On the grid 24/7/365 and the right to disconnect. Employee Relat. Law J. 45, 3–20 (2019).
61. Organisation for Economic Cooperation and Development (OECD). Keeping the internet up and running in times of crisis. https://
www.oecd.org/coronavirus/policy-responses/keeping-the-internet-up-and-running-in-times-of-crisis-4017c4c9/ (2020).
62. DeFilippis, E., Impink, S., Singell, M., Polzer, J. & Sadun, R. Collaborating during coronavirus: the impact of COVID-19 on the
nature of work. SSRN Electron. J. https://doi.org/10.2139/ssrn.3654470 (2020).
63. Martech Cube. US employees spending an extra 3 hours working during the COVID-19 mandated remote work. Martech Cube.
https://www.martechcube.com/us-employees-spending-an-extra-3-hrs-working-during-covid-19/ (2020).
64. Amin, K. P., Griffiths, M. D. & Dsouza, D. D. Online gaming during the COVID-19 pandemic in India: strategies for work-life
balance. Int. J. Ment. Health Addict. https://doi.org/10.1007/s11469-020-00358-1 (2020).
65. Trakada, A. et al. Sleep during “lockdown” in the COVID-19 pandemic. Int. J. Environ. Res. Public Health. https://doi.org/10.3390/
ijerph17239094 (2020).
66. Martínez-de-Quel, Ó., Suárez-Iglesias, D., López-Flores, M. & Pérez, C. A. Physical activity, dietary habits and sleep quality before
and during COVID-19 lockdown: a longitudinal study. Appetite 158, 105019. https://doi.org/10.1016/j.appet.2020.105019 (2021).
67. Kantermann, T. & Burgess, H. J. Average mid-sleep time as a proxy for circadian phase. PsyCh J. 6, 290–291. https://doi.org/10.
1002/pchj.182 (2017).
68. Viechtbauer, W. Conducting meta-analyses in r with the metafor package. J. Stat. Softw. 36, 48. https://doi.org/10.18637/jss.v036.
i03 (2010).
69. Nakagawa, S., Johnson, P. C. D. & Schielzeth, H. The coefficient of determination r2 and intra-class correlation coefficient from
generalized linear mixed-effects models revisited and expanded. J. R. Soc. Interface 14, 20170213. https://d oi.o
rg/1 0.1 098/r sif.2 017.
0213 (2017).
Author contributions
All authors contributed to study design, interpretation of the reported results and drafting/revision of the manu-
script. M.K. and H.K. contributed to data extraction efforts from the Oura database. J.L.O., T.L. and M.K. con-
tributed to data analysis and production of figures and tables.
Funding
Work conducted at the National University of Singapore is supported by a Grant awarded to Michael Chee from
the National Medical Research Council Singapore (STAR19may-0001).
Competing of interest
M.K. and H.K. are employees of Oura Health, but this work represents their individual opinion and initiative.
The other authors declare no competing interests.
Scientific Reports | (2021) 11:14413 | https://doi.org/10.1038/s41598-021-93924-z 10
Vol:.(1234567890)www.nature.com/scientificreports/
Additional information
Supplementary Information The online version contains supplementary material available at https://doi.org/
10.1038/s41598-021-93924-z.
Correspondence and requests for materials should be addressed to M.W.L.C.
Reprints and permissions information is available at www.nature.com/reprints.
Publisher’s note Springer Nature remains neutral with regard to jurisdictional claims in published maps and
institutional affiliations.
Open Access This article is licensed under a Creative Commons Attribution 4.0 International
License, which permits use, sharing, adaptation, distribution and reproduction in any medium or
format, as long as you give appropriate credit to the original author(s) and the source, provide a link to the
Creative Commons licence, and indicate if changes were made. The images or other third party material in this
article are included in the article’s Creative Commons licence, unless indicated otherwise in a credit line to the
material. If material is not included in the article’s Creative Commons licence and your intended use is not
permitted by statutory regulation or exceeds the permitted use, you will need to obtain permission directly from
the copyright holder. To view a copy of this licence, visit http://creativecommons.org/licenses/by/4.0/.
© The Author(s) 2021
Scientific Reports | (2021) 11:14413 | https://doi.org/10.1038/s41598-021-93924-z 11
Vol.:(0123456789)You can also read