Transcriptome comparisons of in vitro intestinal epithelia grown under static and microfluidic gut on chip conditions with in vivo human epithelia
←
→
Page content transcription
If your browser does not render page correctly, please read the page content below
www.nature.com/scientificreports
OPEN Transcriptome comparisons
of in vitro intestinal epithelia
grown under static and microfluidic
gut‑on‑chip conditions with in vivo
human epithelia
Kornphimol Kulthong1,2,3*, Guido J. E. J. Hooiveld4, Loes Duivenvoorde2,
Ignacio Miro Estruch1, Victor Marin2, Meike van der Zande2 & Hans Bouwmeester1*
Gut-on-chip devices enable exposure of cells to a continuous flow of culture medium, inducing shear
stresses and could thus better recapitulate the in vivo human intestinal environment in an in vitro
epithelial model compared to static culture methods. We aimed to study if dynamic culture conditions
affect the gene expression of Caco-2 cells cultured statically or dynamically in a gut-on-chip device
and how these gene expression patterns compared to that of intestinal segments in vivo. For this we
applied whole genome transcriptomics. Dynamic culture conditions led to a total of 5927 differentially
expressed genes (3280 upregulated and 2647 downregulated genes) compared to static culture
conditions. Gene set enrichment analysis revealed upregulated pathways associated with the immune
system, signal transduction and cell growth and death, and downregulated pathways associated with
drug metabolism, compound digestion and absorption under dynamic culture conditions. Comparison
of the in vitro gene expression data with transcriptome profiles of human in vivo duodenum, jejunum,
ileum and colon tissue samples showed similarities in gene expression profiles with intestinal
segments. It is concluded that both the static and the dynamic gut-on-chip model are suitable to study
human intestinal epithelial responses as an alternative for animal models.
Current toxicological safety studies of chemicals and pharmaceuticals often rely on the use of laboratory animals.
The use of animals not only is time consuming, considered unethical and expensive, but importantly also raises
scientific questions on the differences in physiology of laboratory animals compared to h umans1–3. To refine,
4
reduce or ultimately replace the use of animal models (the 3R principle) , in vitro assays have been intensively
studied5–7. By using human cells, specific functions of the organ of origin can be emulated in vitro. Here, we
focused on human intestinal cells that are extensively used to model the human intestinal epithelium.
With the emergence of microfluidic technology several organ-on chip platforms have been launched8,9. More
specifically, gut-on-chip devices have been introduced that allow to culture epithelial cells under continuous
perfusion and physiological shear stress attempting to better recapitulate the environment in the human intestine
compared to static culture m ethods10–13. While stem cell-based intestinal models can be used to study the human
intestinal function, the reproducibility and culture efficiency of the models in vitro is still challenging14,15. There-
fore, human intestinal epithelial cell line-based models, specifically Caco-2 cells, currently remain the most widely
used and accepted in vitro model for toxicological safety studies16–18. Despite the variety in existing gut-on-chip
models, there are only a few studies that evaluated the basal gene expression of Caco-2 cells compared to that of
human intestinal (in vivo) t issues19. Kim et al. published such a comparison of a specific subclone of Caco-2 cells,
but due to the very limited sample size in this study the results have to be interpreted with caution. In addition,
the consequences of different chip designs need to be interpreted with care, as the resulting differences in shear
1
Division of Toxicology, Wageningen University, P.O. box 8000, 6700 EA Wageningen, The
Netherlands. 2Wageningen Food Safety Research, P.O. Box 230, 6700 AE Wageningen, The
Netherlands. 3National Nanotechnology Center (NANOTEC), National Science and Technology Development
Agency, Pathum Thani 12120, Thailand. 4Nutrition, Metabolism and Genomics group, Division of Human Nutrition
and Health, Wageningen University, Wageningen, The Netherlands. *email: Kornphimol@nanotec.or.th;
hans.bouwmeester@wur.nl
Scientific Reports | (2021) 11:3234 | https://doi.org/10.1038/s41598-021-82853-6 1
Vol.:(0123456789)
www.nature.com/scientificreports/
Figure 1. Schematic illustration of the experimental setup of the gut-on-chip (A) Schematic design of the
microfluidic system showing a vertical cross-section of the glass chip. The red lines represent the flows in
and out of both compartments. (B) Schematic drawing of the three glass layers that form the chip, the oval
in the middle layer represents a cut-out in the glass and the darker square represents the porous membrane
covering the cut-out. The dark blue lines in (A) and (B) represent the gaskets that form the boundaries of
the compartments when the three glass layers are pressed together in the chip holder. (C) Schematic drawing
showing how cells were exposed to fluid flow.
stress induce different phenotypical and functional c hanges20. To the best of our knowledge, no other compara-
tive studies addressing this issue in the commonly used wild type Caco-2 cell line have been published so far.
The aim of the current study was to comprehensively investigate the effects of dynamic flow conditions on
the gene expression profile and affected biological pathways of Caco-2 cells compared to the gene expression
profile of Caco-2 cells cultured under static conditions. Next, the gene expression profiles of Caco-2 cells, cul-
tured under both conditions, were compared with those of healthy human in vivo intestinal tissues. For this, we
retrieved data from publicly available gene expression databases. Briefly, Caco-2 cells were grown for 21 days
in Transwells according to a standard p rotocol21, and in our gut-on-chip d
evice12,13. Gene expression data were
obtained using a microarray platform and differential expression was determined by a bioinformatics approach.
Linear models and an intensity-based moderated t-statistic were used for identification of differentially expressed
genes and gene set enrichment analysis (GSEA) for identification of affected biological pathways. The differential
expression of intestine-specific genes in Caco-2 cells was compared to those reported for different regions of
human intestinal tissues in vivo22.
Results
Cellular morphological assessment. Monolayer integrity of Caco-2 cells grown for 21 days in the gut-
on-chip under dynamic flow (Fig. 1A–C) or in the static Transwell was assessed using confocal microscopy
imaging. The top views of representative images are shown in Fig. 2A,B. Caco-2 cells grown under continuous
flow showed a comparable monolayer formation and cell morphology at day 21 to cells grown under static con-
ditions, as reflected by immunofluorescence staining of nuclei (blue), actin filaments (green) and tight junctions
(red). Cells cultured under flow, however, seemed to be larger than those grown under static conditions. Vertical
cross-sections of the monolayers, created by Z-stacks (Fig. 2C,D), showed cell polarization with core bundles of
actin filaments in the microvilli and tight junctions on the apical side, in cells grown under both conditions. The
cell heights were comparable in both systems, reaching ~ 10 µm at day 21.
Gene expression in Caco‑2 human epithelial cells under static and dynamic condi‑
tions. Genome-wide changes in gene expression in Caco-2 cells grown under dynamic culture conditions
in the gut-on-chip were identified by comparison of gene expression of cells grown under static versus dynamic
culture conditions. After 21 days of culturing, total RNA was isolated and gene expression was analyzed using
Affymetrix GeneChips.
After data processing, differential gene expression was visualized in a volcano plot (Fig. 3A). The expression of
29,635 genes in Caco-2 cells grown in the gut-on-chip device was compared with that in cells grown under static
conditions. In total, 5927 differentially expressed genes were observed in the gut on chip (3280 upregulated and
2647 downregulated) with a FDR < 0.01 (Fig. 3B). The top 10 most up- and downregulated genes in cells grown
in the gut-on-chip device, compared to cells grown in the Transwell inserts, are listed in Table 1. Compared to
the Transwell inserts, the most upregulated gene in cells grown in the gut-on-chip device was metallothionein
1H (MT1H; log2FC = 5.89) coding for metallothionein 1H protein, whereas the gene glucose-6-phosphatase
Scientific Reports | (2021) 11:3234 | https://doi.org/10.1038/s41598-021-82853-6 2
Vol:.(1234567890)
www.nature.com/scientificreports/
Figure 2. Cell morphology of Caco-2 cells after 21 days of culture under static (Transwell) and dynamic, with a
flow of 100 µL/h, (gut-on-chip) conditions, visualized by confocal microscopy. Top views of the cell layer in (A)
the Transwell and in (B) the gut-on-chip. Vertical cross-sections of the cell monolayer in (C) the Transwell and
(D) the gut-on-chip. Actin filaments (Phalloidin) in green, cell nuclei (DAPI) in blue, and tight junctions (ZO-1/
TJP1) in red.
Figure 3. Overview of the differential gene expression in Caco-2 cells grown in a gut-on-chip device versus
Transwell inserts after 21 days of culture. (A) Volcano plot of all differentially expressed genes where the FDR
value of each gene is plotted against the fold change in expression; the dotted line indicates an FDR of 0.01. (B)
The number and percentages of differentially expressed genes in Caco-2 cells grown in a gut-on-chip device
compared to cells grown in Transwell inserts.
catalytic subunit (G6PC; log2FC = -6.79) coding for glucose-6-phosphatase catalytic subunit protein was most
downregulated.
Overview of gene set enrichment analysis. GSEA was performed to elucidate whether biological pro-
cesses were potentially affected in cells cultured under dynamic conditions compared to cells cultured under
Scientific Reports | (2021) 11:3234 | https://doi.org/10.1038/s41598-021-82853-6 3
Vol.:(0123456789)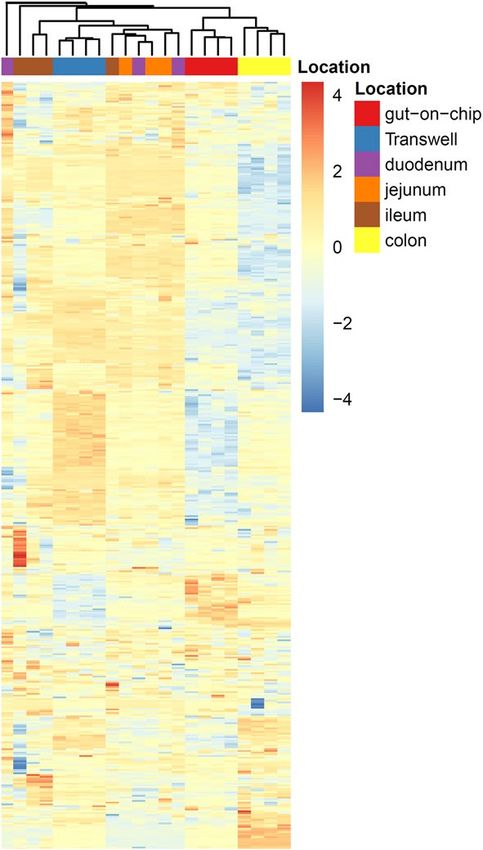
www.nature.com/scientificreports/
EntrezID Gene symbol Gene full name Core function in cellsa Log2 FC P-value FDR
Upregulated genes
4496 MT1H Metallothionein 1H Mineral absorption, Metal binding 5.89 5.6E−12 3.0E−09
4495 MT1G Metallothionein 1G Mineral absorption, Metal binding 5.32 5.0E−13 7.4E−10
301 ANXA1 Annexin A1 Anti-inflammation 4.91 8.0E−14 2.4E−10
UDP glucuronosyltransferase fam-
54658 UGT1A1 Metabolism 4.87 2.1E−07 6.1E−06
ily 1 member A1
10202 DHRS2 Dehydrogenase/reductase 2 Metabolism 4.68 2.3E−06 4.0E−05
4501 MT1X Metallothionein 1X Mineral absorption, Metal binding 4.31 1.9E−12 1.7E−09
Interferon induced transmembrane
10410 IFITM3 Immune system 4.30 2.5E−08 1.2E−06
protein 3
9120 SLC16A6 Solute carrier family 16 member 6 Membrane transporter 4.02 1.5E−11 6.7E−09
7348 UPK1B Uroplakin 1B Cellular development and growth 3.99 4.3E−10 6.7E−08
Interferon alpha inducible protein
3429 IFI27 Immune system 3.98 9.9E−07 2.0E−05
27
Downregulated genes
Glucose-6-phosphatase catalytic
2538 G6PC Metabolism − 6.79 4.7E−13 7.3E−10
subunit
229 ALDOB Aldolase, fructose-bisphosphate B Metabolism − 5.81 8.3E−13 1.0E−09
Chromosome 17 open reading
284099 C17orf78 Unknown − 5.67 4.3E−14 2.1E−10
frame 78
N-acylsphingosine amidohydro-
56624 ASAH2 Metabolism, Biosynthesis − 5.64 6.1E−12 3.1E−09
lase 2
6476 SI Sucrase-isomaltase Metabolism, Digestion − 5.28 7.4E−08 2.7E−06
Mineral absorption, Membrane
795 S100G S100 calcium binding protein G − 4.99 2.2E−12 1.7E−09
transporter
Cytochrome P450 family 2 subfam-
1557 CYP2C19 Metabolism − 4.94 2.0E−12 1.7E−09
ily C member 19
Microsomal triglyceride transfer
4547 MTTP Lipid digestion and absorption − 4.92 2.2E−13 3.9E−10
protein
Transmembrane 4 L six family Cell growth, proliferation and
79853 TM4SF20 − 4.84 1.7E−13 3.6E−10
member 20 activities
Interferon alpha inducible protein
NRN1 Neurite outgrowth − 4.55 2.1E−08 1.1E−06
27
Table 1. Top 10 most up- and downregulated genes in Caco-2 cells cultured under dynamic conditions
compared to static conditions after 21 days of culture. a References on the gene functions are provided in
Supplementary Table S3.
static conditions, based on gene expression data. The studied pathways were derived from the KEGG database.
This database is structured into KEGG categories that are subdivided into category subgroups and each category
subgroup contains various pathways, each represented by a gene set. As described in the material section we
have considered gene sets belonging to 5 categories namely ‘metabolism’, ‘genetic information processing’, ‘envi-
ronmental information processing’, ‘cellular processes’ and ‘organismal systems’ (BRITE Functional Hierarchy
level 1). This resulted in the analysis of 225 gene sets. Of these 225 gene sets, 108 gene sets were differently
expressed, of which 52 gene sets were upregulated in Caco-2 cells cultured in the gut-on-chip versus Caco-2
cells cultured in Transwells and 56 gene sets were downregulated in Caco-2 cells grown in the gut-on-chip
(p-value < 0.05 and FDR < 0.25). The most prominently upregulated gene set in Caco-2 cells cultured in the gut-
on-chip represented the ‘ribosome biogenesis’ pathway (normalized enrichment score, NES = 2.52) under the
KEGG category ‘genetic information processing’ and KEGG category subgroup ‘translation’ (suppl. Table S1).
The most prominently downregulated pathway in Caco-2 cells cultured under dynamic conditions represented
the ‘protein digestion and absorption’ pathway (NES = − 2.23) under the KEGG category ‘organismal system’
and KEGG category subgroup ‘digestive system’ (suppl. Table S2). The gene expression analysis was continued
by focusing on up- and downregulated gene sets that represent pathways belonging to crucial small intestinal
functions, core signaling and cell survival. Twenty-four gene sets, belonging to the KEGG category subgroups:
‘xenobiotics biodegradation and metabolism’, ‘membrane transport’, ‘cellular transport’, ‘immune system’, ‘signal
transduction’, ‘cell growth and death’ and ‘digestive system’ (Table 2), were evaluated. Various gene sets in the
KEGG category subgroups ‘xenobiotics biodegradation and metabolism’ and ‘digestive system’ were downregu-
lated. Various gene sets in the KEGG category subgroups ‘cellular transport’, ‘immune system’ and ‘cell growth
and death’ were upregulated, In the 24 enriched gene sets, there were 575 genes that were contributing most to
the enrichment, the so called leading edge genes, which are shown in a heatmap in Fig. 4.
Transcriptomic comparison of Caco‑2 cells grown in the gut‑on‑chips and transwells, and
human in vivo data. Next, we compared the gene expression profiles of the Caco-2 cells grown under
dynamic and static conditions in vitro, with human intestinal in vivo gene expression profiles. For this, we
Scientific Reports | (2021) 11:3234 | https://doi.org/10.1038/s41598-021-82853-6 4
Vol:.(1234567890)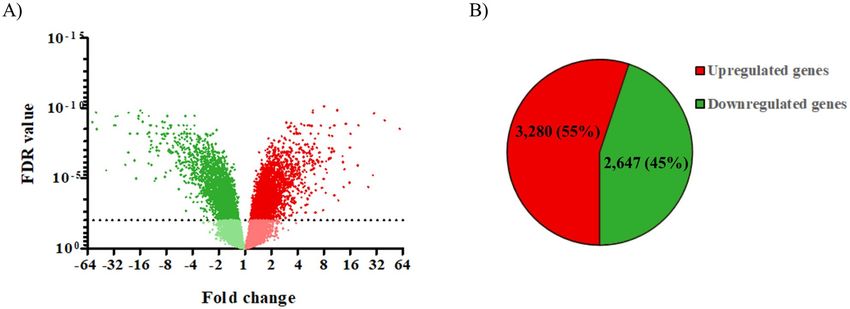
www.nature.com/scientificreports/
KEGG pathway name KEGG category KEGG category subgroup Size NES p-value FDR
Upregulated gene sets
Endocytosis Cellular processes Transport and catabolism 243 1.42 3.4E−03 7.8E−02
NOD-like receptor signaling
Organismal system Immune system 168 1.93 0.00E+00 5.6E−04
pathway
RIG-I-like receptor signaling
Organismal system Immune system 67 1.60 3.8E−03 2.8E−02
pathway
Cytosolic DNA-sensing
Organismal system Immune system 58 2.01 0.0E+00 1.7E−04
pathway
IL-17 signaling pathway Organismal system Immune system 93 1.72 3.7E−04 9.5E−03
Environmental information
MAPK signaling pathway Signal transduction 292 1.60 0.0E+00 2.7E−02
processing
Environmental information
TGF-beta signaling pathway Signal transduction 92 1.47 1.3E−02 5.9E−02
processing
Environmental information
Jak-STAT signaling pathway Signal transduction 158 1.41 1.1E−02 8.3E−02
processing
Environmental information
NF-kappa B signaling pathway Signal transduction 97 1.96 0.0E+00 3.5E−04
processing
Environmental information
TNF signaling pathway Signal transduction 110 2.00 0.0E+00 2.2E−04
processing
Cell cycle Cellular processes Cell growth and death 124 1.92 0.0E+00 6.5E−04
Apoptosis Cellular processes Cell growth and death 133 1.66 1.8E−04 1.6E−02
Necroptosis Cellular processes Cell growth and death 128 1.77 0.0E+00 6.2E−03
p53 signaling pathway Cellular processes Cell growth and death 72 1.70 1.1E−03 1.1E−02
Cellular senescence Cellular processes Cell growth and death 158 1.39 1.4E−02 9.3E−02
Downregulated gene sets
Drug metabolism-cytochrome Xenobiotics biodegradation
Metabolism 62 − 2.00 0.0E+00 4.4E−04
P450 and metabolism
Drug metabolism-other Xenobiotics biodegradation
Metabolism 70 − 1.42 2.5E−02 8.5E−02
enzymes and metabolism
Environmental information
ABC transporters Membrane transport 45 − 1.48 2.9E−02 5.8E−02
processing
Carbohydrate digestion and
Organismal system Digestive system 39 − 2.19 0.0E+00 5.7E−05
absorption
Protein digestion and absorp-
Organismal system Digestive system 83 − 2.23 0.0E+00 1.1E−04
tion
Fat digestion and absorption Organismal system Digestive system 41 − 2.17 0.0E+00 3.8E−05
Vitamin digestion and absorp-
Organismal system Digestive system 23 − 2.00 0.0E+00 4.8E−04
tion
Phosphatidylinositol signaling Environmental information
Signal transduction 99 − 1.60 2.2E−03 2.9E−02
pathway processing
Environmental information
AMPK signaling pathway Signal transduction 119 − 1.39 2.1E−02 9.9E−02
processing
Table 2. Most enriched gene sets representing pathways associated with intestinal cell function, core signaling
and cell survival in Caco-2 cells cultured under dynamic conditions compared to static conditions.
selected a publicly available gene expression data set from the human proteome atlas that contained data of
human intestinal tissues24. The gene expression profiles were evaluated by a principal component analysis
(PCA). A PCA scatterplot representing the first two principal components based on the transcriptome profiles
from 14 human in vivo samples and 4 samples each of the Transwell and the gut-on-chip cell culturing system
is shown in Fig. 5. PC1 and PC2 explain 51.32% and 16.88% of the total variation, respectively. Samples from
the cells cultured in the gut-on-chip device and in the Transwells clustered together showing the low variation
and high robustness in each in vitro data set. This was also observed for the in vivo colon samples, while the
small intestinal samples (especially the ilieum samples) clustered somewhat more scattered. The first component
(PC1) indicates that Caco-2 cells cultured in gut-on-chip clusters were more distant from the clusters of jejunum
and duodenum samples, and closer to the colon in vivo samples than the Caco-2 cells cultured in the Transwell
system. The second component (PC2) indicates that the in vivo data sets located between the two clusters of
the in vitro samples (i.e. gut-on-chip and Transwell). In the database of the human proteome atlas, from which
we selected the intestinal tissue in vivo data sets, 764 genes have been annotated as intestine specific, 483 (63%)
of these genes were expressed in our gene expression data from Caco-2 cells cultured under static or dynamic
conditions and data from selected tissue samples from human duodenum, jejunum, ileum and c olon22 and were
hierarchically clustered (Fig. 6). The clustering pattern of the various in vitro and in vivo samples as observed by
PCA is confirmed by the hierarchical clustering based on the intestine specific 483 genes.
Scientific Reports | (2021) 11:3234 | https://doi.org/10.1038/s41598-021-82853-6 5
Vol.:(0123456789)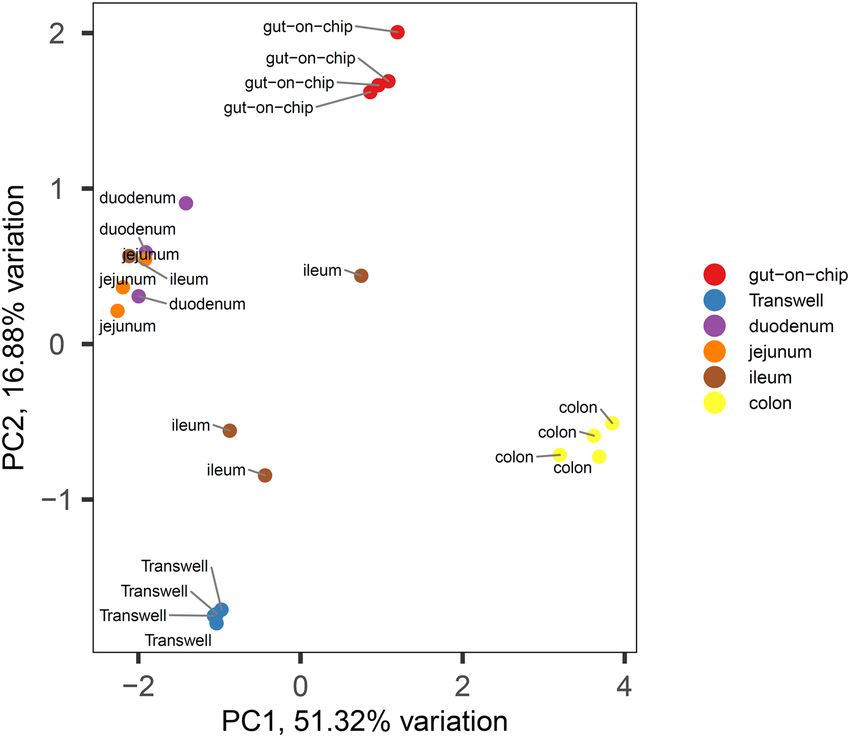
www.nature.com/scientificreports/
Figure 4. Heatmap showing the leading edge genes (575 genes in total) of 24 enriched gene sets. In the GSEA,
gene expression patterns of Caco-2 cells cultured in a gut-on-chip were compared with those of Caco-2 cells
cultured in Transwells. Heatmaps of selected genes were made using the R library pheatmap (version 3.6.3, https
://cran.r-project.org/web/packages/Pheatmap/index.html)23.
Discussion
In this study we provide a comprehensive overview on whole genome differential gene expression in Caco-2 cells
when cultured under dynamic in vitro culture conditions versus static in vitro culture conditions. In addition,
we compared the transcriptome profiles of our in vitro experiments with the transcriptome profiles as observed
in human (in vivo) intestinal segments. Monolayers of Caco-2 cells grown in conventional static systems have
been widely used to study effects of exposure to chemicals to predict the in vivo human intestinal epithelial
responses25–27. However, in vivo the epithelial cells of the intestinal wall experience physical forces including
strain, fluid shear stress, and villous motility. Shear stresses to cells might be important triggers in the develop-
ment and maturation of epithelial c ells28. We here show a differential expression of 5927 genes in Caco-2 cells
induced by dynamic culture conditions as compared to static culture conditions. The shear stress of ~ 0.002 dyne/
cm2 in our model induced comparable changes in gene expression profiles as reported before in a model that
exposed Caco-2 cells to an estimated shear stress of ~ 0.02 dyne/cm219. No other studies on the effects of shear
Scientific Reports | (2021) 11:3234 | https://doi.org/10.1038/s41598-021-82853-6 6
Vol:.(1234567890)www.nature.com/scientificreports/
Figure 5. PCA plot of genomic expression data of 483 of human intestine-specific g enes24 from human
duodenum, jejunum, ileum and colon tissues, and Caco-2 cells cultured in a gut-on-chip or Transwell system.
Figure 6. Hierarchical clustering of the expression data of 483 of human intestine-specific genes in Caco-2 cells
grown in the gut-on-chip or Transwell and in human intestinal tissue samples. Heatmaps of selected genes were
made using the R library pheatmap (version 3.6.3, https://cran.r-project.org/web/packages/Pheatmap/index
.html)23.
Scientific Reports | (2021) 11:3234 | https://doi.org/10.1038/s41598-021-82853-6 7
Vol.:(0123456789)www.nature.com/scientificreports/
forces on Caco-2 cells based on transcriptomics data could be found. As reported previously, cells grown under
dynamic conditions seemed to be larger compared to cells grown under static conditions12,13. The morphology
of Caco-2 cells has been shown to be affected by differences in shear forces. Using a microfluidic device with
decreasing dimensions, thus increasing shear forces, Delon et al. have studied the consequences of increased
shear forces on cell morphology and functionality of 5 day old Caco-2 cells. The authors reported that increasing
shear forces resulted in increased cell heights, microvilli formation and mucus production by Caco-2 cells20, and
corroborate our findings on cell morphology at low shear forces. Interestingly, for two other types of cells the
effects of shear forces on gene expression have been studied in detail, namely for human vascular endothelial cells
(with fluid shear stresses ranging from 1.5 to 15 dyne/cm2;29,30) and on murine proximal tubular epithelial cells
(with fluid shear stresses ranging from 0 to 1.9 dyne/cm2;31). These studies revealed clear effects of fluid shear
stresses on gene expression profiles in the cells. A comparison of the findings on affected genes and processes in
these studies with our results will be discussed further below.
At the individual gene level, fluid flow applied to Caco-2 cells resulted in the upregulation of several genes
related to mineral absorption/metal binding. Highly upregulated genes were the metallothionein genes (i.e.
MT1H, MT1G, MT1X) that provide protection against metal t oxicity32 and oxidative stress33. Interestingly, the
modulation of metallothionein genes has been observed in endothelial cells in vitro upon physical s tress30,34.
The KEGG category ‘xenobiotics biodegration and metabolism’ was down regulated under dynamic condi-
tions. Various individual genes related to cellular metabolism (i.e. G6PC, ALDOB, ASAH2) were downregu-
lated under dynamic conditions. Exceptions, however, were genes coding for UGT1A1 and CYP1A1 that were
extremely upregulated in Caco-2 cells cultured under dynamic conditions (top 20 most upregulated genes). The
latter genes relate to isoforms of enzymes that are important in drug and xenobiotic metabolism in the small
intestine. UGT1A1 catalyzes glucuronic acid conjugation to a nucleophilic substrate35,36 and CYP1A1 is involved
in the modification of aromatic hydrocarbons. Gene expression of UGT1A1 and CYP1A1 is regulated by the aryl
hydrocarbon receptor (AhR)37,38. The AhR gene and AhR dependent genes (i.e. CYP1B1, TIPARP, PTGS2) were
also upregulated under dynamic culturing conditions. The upregulated expression of this functional group of
AhR regulated genes has also been observed in human endothelial cells exposed to shear s tress39–41.
We next set off to analyze if the differential gene expression also affected biological pathways using GSEA. The
most relevant affected pathways for intestinal functions and core signaling pathways were listed in Table 2. It is of
interest that gene sets involved in inflammatory pathways (i.e. IL-17 signaling pathway, cytosolic DNA-sensing
pathway) were upregulated in Caco-2 cells that were cultured in the gut-on-chip. This included the upregulation
of genes for the NOD-like receptor, RIG-I receptor signaling pathways that are involved in the innate immune
responses42,43. This indicates that fluid shear stresses might modulate the defense mechanism of intestinal epithe-
lial cells by stimulating the innate immune response. Miravete et al. observed that human proximal tubular cells
(HK-2) exposed to a shear stress of 0.1 dyne/cm2 activated the differentiation of monocytes into macrophages
by secretion of TNF-alpha44, which also are elements of the innate immune system.
Various signaling pathways (e.g. MAPK, TGF-beta, Jak-STAT, NF kappa B, TNF, p53) belonging to the ‘signal
transduction’ and ‘cell growth and death’ KEGG category subgroups were upregulated in Caco-2 cells grown
under dynamic conditions. These pathways have important regulatory roles in a wide variety of cellular processes
including cell proliferation, differentiation, apoptosis and stress responses in mammalian cells45–49. While the
effects of shear stresses on signaling processes in intestinal cells is poorly studied, much more is known from
endothelial cells and these findings corroborate the results observed in the present study. In endothelial cells,
shear stress-induced IL-8 gene expression (4.2 dyne/cm2) regulated by MAPK signaling50. TGF-beta signal-
ing is also described to be induced in endothelial cells by shear stress of 10 dyne/cm251. NF kappa B signaling,
stimulating pro-inflammatory cytokine and chemokine release, was activated by a shear stress of 15 dyne/cm2
in endothelial c ells52.
Compound metabolism pathways, drug metabolism-cytochrome P450 and other enzymes, belonging to the
‘xenobiotics biodegradation and metabolism’ KEGG category subgroup were downregulated in Caco-2 cells
exposed to shear stress, as was also observed at the individual gene expression level with the exception of
UGT1A1 and CYP1A1(AhR dependent genes). Studies with a different subclone of Caco-2 cells (i.e. Caco-2BBE)
cultured under a shear stress of 0.02 dyne/cm211, or under a range of shear stresses (ranging from 0.002 to 0.03
dyne/cm220 showed a shear stress dependent increase in activity of the drug metabolizing cytochrome CYP3A4
enzyme compared to cells cultured under static conditions11,20. In our results, the pathways associated to general
cellular metabolism were also downregulated (suppl. Table S2). This is in line with a study in renal epithelial
cells where a downregulation of gene expression at several levels for cellular homeostasis, including fatty acid,
amino acid and cholesterol metabolism, was observed after exposure to a shear stress of 1.9 dyne/cm231. Nutri-
ent digestion and absorption by epithelial cells might also be affected by fluid flow exposure as indicated by the
downregulation of gene sets associated with those processes (i.e. gene sets for the protein, carbohydrate and
fat digestion and absorption pathways belonging to the ‘digestive system’ KEGG category subgroup). This has
also been observed in endothelial cells, in which shear stresses (20 dyne/cm2) reduced the expression of genes
involved in glucose a bsorption53.
Lastly, we compared the gene expression patterns of both our in vitro models with those of samples taken from
different intestinal segments as reported in literature22. In a PCA analysis of all data samples from our in vitro
models cluster together in two separate groups that both are different from the in vivo gene expression clusters.
The PCA clustering revealed that the gene expression profiles of Caco-2 cells cultured under both culture condi-
tions more closely recapitulated small intestine gene expression than the colonic gene expression. However, the
profiles of the Caco-2 cells grown under shear stress were clustered more towards the colonic samples than the
Caco-2 cells grown under static conditions (Fig. 5). Interestingly, the duodenal and jejunum samples clustered
together, while the gene expression of the ileum samples (from the same donors) seemed to be much more vari-
able. To the authors knowledge, there is only one other study reporting on the transcriptomes of Caco-2 cells
Scientific Reports | (2021) 11:3234 | https://doi.org/10.1038/s41598-021-82853-6 8
Vol:.(1234567890)www.nature.com/scientificreports/
cultured in gut-on-chip and Transwell devices compared with in vivo d ata19. However, with the very limited num-
ber of samples (n = 2) the authors included it is quite challenging to draw the strong conclusion from this study.
In conclusion, our study provides a comprehensive profile of altered gene expression in Caco-2 cells under
flow culturing conditions versus culturing under static conditions. The responses were mainly related to cellu-
lar homeostasis, immunological responses, cell growth and dead, as well as signal transduction. While general
cellular metabolism and absorption pathways were repressed, specific genes in xenobiotic biotransformation
pathways were induced upon exposure to fluid flow. Interestingly, comparable responses have been noted in
endothelial and renal tubular epithelial cells that were also exposed to shear stress. Our unbiased comparison with
global gene expression in samples from intestinal segments did not reveal a striking similarity with any of these
segments. The results obtained do not apparently favor one of the two in vitro models and it can be concluded
that both model systems can be equally well used to study human intestinal epithelial responses, thus selection
may depend on the endpoint of interest. For instance, to derive uptake rates for pharmacokinetic modelling the
robust and routinely used Transwell models might be the preferred a pproach54, while to emulate complex inter-
actions in the intestine organ-on-chip models might be the preferred m odel55–57. It should be kept in mind that
some specific gene functions are differently modulated in each model. This information may be used to further
advance the applicability of flow conditions in in vitro cells systems for use as alternatives for animal models.
Materials and methods
Chemicals and reagents. Dulbecco’s Modified Eagle Medium (DMEM), Hank’s balanced salt solution
(HBSS), penicillin/streptomycin and Bovine serum albumin (BSA) were purchased from Sigma-Aldrich (Zwijn-
drecht, The Netherlands). Fetal bovine serum (heat inactivated) (FBS), MEM-Non-essential amino acids Phos-
phate Buffered Saline (PBS) were obtained from Fisher Scientific (Landsmeer, The Netherlands).
Design of the gut‑on‑chip system. The microfluidic gut-on-chip device has been developed and
described previously12,13. Briefly, the chip consists of three 15 × 45 mm (width x length) re-sealable glass slides
that result in two flow chambers (i.e. an upper apical (AP) and lower basolateral (BL) chamber) upon assembly
(see Fig. 1A; Micronit, Enschede, The Netherlands). Both the upper and lower glass slides were spaced from the
middle layer membrane by a 0.25 mm thick silicone gasket. The flow chambers were separated by a glass slide
containing a polyester (PET) porous cell culture membrane with a 0.4 µm pore size and a cell culture area of ~ 1.6
cm2. The volume of the AP chamber is 75 mm3 with a chamber height of 0.25 mm (membrane to top layer)
and the BL chamber is 110 mm3 with a chamber height of 0.65 mm (bottom layer to membrane), resulting in a
total volume of 185 m m3 (µL) of the device (Fig. 1B). The chip was placed in a chip holder with a quick locking
mechanism, constructed for connection of external capillaries to the chip via specific ferrules to ensure tight
connections and a leak-free system.
The constant flow was introduced to the chip using a microsyringe pump (NE-4000, New Era Pump Systems,
Inc.) equipped with two polypropylene syringes (30 mL, Luer-locktm, Becton, Dickinson and company), with
each syringe connected to either the AP or the BL compartment using Ethylene Propylene (FEP) tubing (0.50 mm
inner diameter, with a length of 25 cm and 10 cm for the inlet and outlet, respectively). Before the start of each
experiment, all tubing and chips were sterilized using an autoclave and rinsed with 70% ethanol. Tubing and chips
were prefilled with medium to eliminate air bubbles in the system. The entire system was put in an incubator at
37 °C to maintain cell culture conditions.
Cell culture. The cell culture was performed using a protocol described previously in our studies12,13. A
Caco-2 cell line (HTB-37), derived from a human colorectal adenocarcinoma (ATCC, Manassas, VA, USA),
were grown (at passage number 29–45) in DMEM supplemented with 1% penicillin/streptomycin, 1% MEM
non-essential amino acid and 10% FBS, further indicated as DMEM+.
The cells, in the microfluidic chip, were seeded at a density of 75,000 cell per cm2 in the devices and were
allowed to attach to the membrane for 24 h, without the fluid flow. The membrane was then inserted in the
microfluidic chip and cells were exposed to a continuous flow of 100 µL/h DMEM+ until day 21 of culturing
(Fig. 1C). By doing so, the shear stress in the AP compartment was ~ 0.002 dyne/cm2 at the cell membrane area
where the cells were grown. In vivo shear stress in the gut is reported to range between ~ 0.002 and 12.0 dyne/
cm210,58,59. The DMEM+ medium contained sodium bicarbonate (10 mM) to optimize the pH buffering capacity.
In Transwell, the cells were seeded at the same density as in the microfluidic chip (~ 75,000 cells per c m2) on
12-well Transwell PET inserts with pore size of 0.4 µm and surface area of 1.12 cm2 (Corning Amsterdam, The
Netherlands) and cultured in D MEM+ for 21 days. The medium was replaced every two to three days.
Fluorescent imaging of epithelial cell morphology. Morphological assessment of the Caco-2 cell
monolayers, grown in the gut-on-chip or Transwell for 21 days, was performed as described previously in our
studies12,13. In short, the cells were fixed with 4% formaldehyde for 10 min and rinsed with PBS at room tem-
perature. Cells were then permeabilized with 0.25% Triton X100 in PBS for 10 min and blocked with 1% acety-
lated bovine serum albumin in PBS for 30 min. Conjugated antibody ZO-1/TJP1-Alexa Fluor 594 (Invitrogen,
Waltham, MA) at 10 µg/mL was used to stain tight junctions. The nuclei were stained with 5 µg/mL DAPI
(Invitrogen, Waltham, MA) and 4 U/mL Phalloidin Alexa Fluor 488 (Life technologies, Carlsbad, CA) was used
to stain actin filaments (i.e. cytoskeleton). All stainings were incubated for 30 min. The membrane was then
placed between two cover slips separated by a spacer (0.12 mm depth × 20 mm diameter) and a drop of anti-
fading mounting medium was applied on the cells. The same staining procedure was used for the cells cultured
on Transwell membranes. The stained monolayers of cells were analyzed using a confocal microscope (LSM 510
UVMETA; Carl Zeiss, Germany). Samples were excited with 405, 488 and 543 nm lasers. Multi-tracked images
Scientific Reports | (2021) 11:3234 | https://doi.org/10.1038/s41598-021-82853-6 9
Vol.:(0123456789)www.nature.com/scientificreports/
were captured to avoid bleed through. The used pinholes were in the range of 148–152 µm at a magnification of
40x. The gain and offset for the different channels were kept constant during the entire experiment.
RNA isolation. Caco-2 cells were grown in the gut-on-chip or Transwell for 21 days. The chips were opened,
and cells were washed with PBS. After that, 100 µL of RLT lysis buffer were added to the cell culture membrane
and incubated for 1–2 min, then the membrane was rinsed with another 100 µL RLT lysis buffer. Cell lysates were
then collected and the total RNA extraction was performed using the Qiagen RNAeasy Micro kit according to
the manufacturer’s instructions. The RNA amount was determined using a Nanodrop (ND-1000 Thermoscien-
tific Wilmington, Delaware, USA).
To the cells cultured on Transwell membranes 350 µL of RLT lysis buffer were added, cell lysates were then
collected and analyzed using the same procedure.
Affymetrix microarray processing, and analysis. The isolated RNA (n = 4 per group) was subjected
to genome‐wide expression profiling. In brief, total RNA was labelled using the Whole-Transcript Sense Target
Assay (Affymetrix, Santa Clara, CA, USA) and hybridized on human Gene 2.1 ST arrays (Affymetrix). The qual-
ity control and data analysis pipeline has been described in detail p reviously60. Normalized expression estimates
of probe sets were computed by the robust multiarray analysis (RMA) a lgorithm61,62 as implemented in the
Bioconductor library affyPLM. Probe sets were redefined using current genome definitions available from the
NCBI database, which resulted in the profiling of 29,635 unique genes (custom CDF version 23)63. Differentially
expressed probe sets (genes) were identified by using linear models (library limma) and an intensity-based mod-
erated t-statistic64,65. Probe sets that satisfied the criterion of a False Discovery Rate (FDR) < 0.01 were considered
to be significantly regulated66. Microarray data have been submitted to the Gene Expression Omnibus (accession
number: GSE156269).
Biological interpretation of array data. Changes in gene expression were related to biologically mean-
ingful changes using gene set enrichment analysis (GSEA). It is well accepted that GSEA has multiple advantages
over analyses performed on the level of individual g enes67–69. GSEA evaluates gene expression on the level of
gene sets that are based on prior biological knowledge, GSEA is unbiased, because no gene selection step (fold
change and/or p-value cutoff) is used; a GSEA score is computed based on all genes in the gene set, which boosts
the S/N ratio and allows to detect affected biological processes that are due to only subtle changes in expression
of individual genes. Gene sets were retrieved from the expert‐curated KEGG database70,71, but sets belonging
to the categories ‘6—Human Disease’ and ‘7—Drug Development’ (BRITE Functional Hierarchy level 1) were
excluded. Moreover, only gene sets comprising more than 15 and fewer than 500 genes were taken into account.
For each comparison, genes were ranked on their t‐value that was calculated by the moderated t‐test. Statistical
significance of GSEA results was determined using 10,000 permutations.
Comparison of Caco‑2 and human in vivo gastrointestinal tract transcriptome data. To com-
pare the transcriptome profiles of Caco-2 cells grown under dynamic (gut-on-chip) or static conditions (Tran-
swell) with healthy human intestinal tissues, transcriptome data from 5 locations taken along the gastrointes-
tinal tract (duodenum, jejunum, ileum, and colon) in 4 healthy human volunteers was u sed22. Datasets were
72
integrated applying a cumulative proportion transformation using YuGene , and visualized by principal com-
ponent analysis (PCA), essentially as described before73. In brief, raw data transcriptome (CEL) files from the
gastrointestinal were obtained from the Gene Expression Omnibus (GEO)74 (accession number: GSE10867).
Next, each dataset was separately background corrected, log2-transformed and summarized at the probe set
level, which was followed by filtering out all genes that were not shared on the two array platforms. Samples were
then combined by rescaling using the cumulative proportion transformation. The combined dataset included
the gene expression measurements of 12,746 genes in 22 samples. Before PCA, expression data was centered by
dataset. PCA was performed and visualized using the library P CAtools75. A list of 764 intestine-specific genes
24
was obtained from The Human Proteome Atlas , and used when indicated.
Received: 9 September 2020; Accepted: 22 January 2021
References
1. Martignoni, M., Groothuis, G. M. M. & de Kanter, R. Species differences between mouse, rat, dog, monkey and human CYP-medi-
ated drug metabolism, inhibition and induction. Expert. Opin. Drug Met. 2, 875–894. https://doi.org/10.1517/17425255.2.6.875
(2006).
2. Komura, H. & Iwaki, M. In vitro and in vivo small intestinal metabolism of CYP3A and UGT substrates in preclinical animals
species and humans: Species differences. Drug Metab. Rev. 43, 476–498. https://doi.org/10.3109/03602532.2011.597401 (2011).
3. Punt, A., Bouwmeester, H., Schiffelers, M. W. A. & Peijnenburg, A. Expert opinions on the acceptance of alternative methods in
food safety evaluations: Formulating recommendations to increase acceptance of non-animal methods for kinetics. Regul. Toxicol.
Pharmacol. 92, 145–151. https://doi.org/10.1016/j.yrtph.2017.11.015 (2018).
4. Flecknell, P. Replacement, reduction and refinement. Altex 19, 73–78 (2002).
5. Guerra, A., Campillo, N. E. & Paez, J. A. Neural computational prediction of oral drug absorption based on CODES 2D descriptors.
Eur. J. Med. Chem. 45, 930–940. https://doi.org/10.1016/j.ejmech.2009.11.034 (2010).
6. Kampfer, A. A. M. et al. Development of an in vitro co-culture model to mimic the human intestine in healthy and diseased state.
Toxicol. In Vitro 45, 31–43. https://doi.org/10.1016/j.tiv.2017.08.011 (2017).
Scientific Reports | (2021) 11:3234 | https://doi.org/10.1038/s41598-021-82853-6 10
Vol:.(1234567890)www.nature.com/scientificreports/
7. Creff, J. et al. Fabrication of 3D scaffolds reproducing intestinal epithelium topography by high-resolution 3D stereolithography.
Biomaterials 221, 119404. https://doi.org/10.1016/j.biomaterials.2019.119404 (2019).
8. Bhise, N. S. et al. Organ-on-a-chip platforms for studying drug delivery systems. J. Control Rel. 190, 82–93. https: //doi.org/10.1016/j.
jconrel.2014.05.004 (2014).
9. Kimura, H., Sakai, Y. & Fujii, T. Organ/body-on-a-chip based on microfluidic technology for drug discovery. Drug Metab. Phar-
macokinet. 33, 43–48. https://doi.org/10.1016/j.dmpk.2017.11.003 (2018).
10. Kim, H. J., Huh, D., Hamilton, G. & Ingber, D. E. Human gut-on-a-chip inhabited by microbial flora that experiences intestinal
peristalsis-like motions and flow. Lab Chip 12, 2165–2174. https://doi.org/10.1039/c2lc40074j (2012).
11. Kim, H. J. & Ingber, D. E. Gut-on-a-Chip microenvironment induces human intestinal cells to undergo villus differentiation. Integr.
Biol. (Camb) 5, 1130–1140. https://doi.org/10.1039/c3ib40126j (2013).
12. Kulthong, K. et al. Implementation of a dynamic intestinal gut-on-a-chip barrier model for transport studies of lipophilic dioxin
congeners. RSC Adv. 8, 32440–32453. https://doi.org/10.1039/c8ra05430d (2018).
13. Kulthong, K. et al. Microfluidic chip for culturing intestinal epithelial cell layers: Characterization and comparison of drug transport
between dynamic and static models. Toxicol In Vitro 65, 104815. https://doi.org/10.1016/j.tiv.2020.104815 (2020).
14. Ortmann, D. & Vallier, L. Variability of human pluripotent stem cell lines. Curr. Opin. Genet. Dev. 46, 179–185. https://doi.
org/10.1016/j.gde.2017.07.004 (2017).
15. Kasendra, M. et al. Development of a primary human small intestine-on-a-chip using biopsy-derived organoids. Sci. Rep. 8, 2871.
https://doi.org/10.1038/s41598-018-21201-7 (2018).
16. del Carmen, P. M., Jean-Pierre, G. & Caroline, L. B. Intestinal in vitro cell culture models and their potential to study the
effect of food components on intestinal inflammation (vol 59, pg 1, 2019). Crit Rev Food Sci. 59, 2166–2168. doi:https://doi.
org/10.1080/10408398.2018.1543037 (2019).
17. Punt, A., Peijnenburg, A., Hoogenboom, R. & Bouwmeester, H. Non-animal approaches for toxicokinetics in risk evaluations of
food chemicals. Altex 34, 501–514. https://doi.org/10.14573/altex.1702211 (2017).
18. Li, C., Liu, T., Cui, X., Uss, A. S. & Cheng, K. C. Development of in vitro pharmacokinetic screens using Caco-2, human hepatocyte,
and Caco-2/human hepatocyte hybrid systems for the prediction of oral bioavailability in humans. J. Biomol. Screen 12, 1084–1091.
https://doi.org/10.1177/1087057107308892 (2007).
19. Kim, H. J., Li, H., Collins, J. J. & Ingber, D. E. Contributions of microbiome and mechanical deformation to intestinal bacte-
rial overgrowth and inflammation in a human gut-on-a-chip. Proc. Natl. Acad. Sci. USA 113, E7–E15. https://doi.org/10.1073/
pnas.1522193112 (2016).
20. Delon, L. C. et al. A systematic investigation of the effect of the fluid shear stress on Caco-2cells towards the optimization of
epithelial organ-on-chip models. Biomaterials 225, 119521. https://doi.org/10.1016/j.biomaterials.2019.119521 (2019).
21. Hubatsch, I., Ragnarsson, E. G. & Artursson, P. Determination of drug permeability and prediction of drug absorption in Caco-2
monolayers. Nat. Protoc. 2, 2111–2119. https://doi.org/10.1038/nprot.2007.303 (2007).
22. Comelli, E. M. et al. Biomarkers of human gastrointestinal tract regions. Mamm. Genome 20, 516–527. https://doi.org/10.1007/
s00335-009-9212-7 (2009).
23. R: A Language and Environment for Statistical Computing (R Foundation for Statistical Computing, Vienna, Austria, 2020).
24. Uhlen, M. et al. Proteomics. Tissue-based map of the human proteome. Science 347, 1260419. doi:https://doi.org/10.1126/scien
ce.1260419 (2015).
25. Meunier, V., Bourrie, M., Berger, Y. & Fabre, G. The human intestinal epithelial cell line Caco-2; pharmacological and pharma-
cokinetic applications. Cell Biol. Toxicol. 11, 187–194. https://doi.org/10.1007/bf00756522 (1995).
26. Sun, H., Chow, E. C., Liu, S., Du, Y. & Pang, K. S. The Caco-2 cell monolayer: Usefulness and limitations. Expert Opin. Drug Metab.
Toxicol. 4, 395–411. https://doi.org/10.1517/17425255.4.4.395 (2008).
27. Wang, Z., Litterio, M. C., Muller, M., Vauzour, D. & Oteiza, P. I. (-)-Epicatechin and NADPH oxidase inhibitors prevent bile acid-
induced Caco-2 monolayer permeabilization through ERK1/2 modulation. Redox. Biol. 28, 101360. https: //doi.org/10.1016/j.redox
.2019.101360 (2020).
28. Gayer, C. P. & Basson, M. D. The effects of mechanical forces on intestinal physiology and pathology. Cell Signal 21, 1237–1244.
https://doi.org/10.1016/j.cellsig.2009.02.011 (2009).
29. Chen, B. P. et al. DNA microh shear stressarray analysis of gene expression in endothelial cells in response to 24-. Physiol. Genomics
7, 55–63. https://doi.org/10.1152/physiolgenomics.2001.7.1.55 (2001).
30. Ohura, N. et al. Global analysis of shear stress-responsive genes in vascular endothelial cells. J. Atheroscler. Thromb. 10, 304–313.
https://doi.org/10.5551/jat.10.304 (2003).
31. Kunnen, S. J., Malas, T. B., Semeins, C. M., Bakker, A. D. & Peters, D. J. M. Comprehensive transcriptome analysis of fluid shear
stress altered gene expression in renal epithelial cells. J. Cell. Physiol. 233, 3615–3628. https://doi.org/10.1002/jcp.26222 (2018).
32. Sigel, A., Sigel, H., Sigel, R. K. O. & Royal Society of Chemistry (Great Britain). Metallothioneins Related chelators. (RSC Pub.,
2009).
33. Kumari, M. V., Hiramatsu, M. & Ebadi, M. Free radical scavenging actions of metallothionein isoforms I and II. Free Radic. Res.
29, 93–101. https://doi.org/10.1080/10715769800300111 (1998).
34. Conway, D. E. et al. Endothelial metallothionein expression and intracellular free zinc levels are regulated by shear stress. Am. J.
Physiol. Cell Physiol. 299, C1461-1467. https://doi.org/10.1152/ajpcell.00570.2009 (2010).
35. Radominska-Pandya, A., Czernik, P. J., Little, J. M., Battaglia, E. & Mackenzie, P. I. Structural and functional studies of UDP-
glucuronosyltransferases. Drug Metab. Rev. 31, 817–899. https://doi.org/10.1081/dmr-100101944 (1999).
36. Miners, J. O. & Mackenzie, P. I. Drug glucuronidation in humans. Pharmacol. Therapeut. 51, 347–369. https: //doi.org/10.1016/0163-
7258(91)90065-T (1991).
37. Yueh, M. F., Bonzo, J. A. & Tukey, R. H. The role of ah receptor in induction of human UDP-glucuronosyltransferase 1A1. Method
Enzymol. 400, 75. https://doi.org/10.1016/S0076-6879(05)00005-4 (2005).
38. Brauze, D. et al. Induction of expression of aryl hydrocarbon receptor-dependent genes in human HepaRG cell line modified by
shRNA and treated with beta-naphthoflavone. Mol. Cell. Biochem. 425, 59–75. https://doi.org/10.1007/s11010-016-2862-3 (2017).
39. Han, Z. et al. Aryl hydrocarbon receptor mediates laminar fluid shear stress-induced CYP1A1 activation and cell cycle arrest in
vascular endothelial cells. Cardiovasc. Res. 77, 809–818. https://doi.org/10.1093/cvr/cvm095 (2008).
40. Lano, G. et al. Aryl hydrocarbon receptor activation and tissue factor induction by fluid shear stress and indoxyl sulfate in endothe-
lial cells. Int. J. Mol. Sci. 21, 1. https://doi.org/10.3390/ijms21072392 (2020).
41. Conway, D. E. et al. Expression of CYP1A1 and CYP1B1 in human endothelial cells: Regulation by fluid shear stress. Cardiovasc.
Res. 81, 669–677. https://doi.org/10.1093/cvr/cvn360 (2009).
42. Chen, G., Shaw, M. H., Kim, Y. G. & Nunez, G. NOD-like receptors: role in innate immunity and inflammatory disease. Annu.
Rev. Pathol. 4, 365–398. https://doi.org/10.1146/annurev.pathol.4.110807.092239 (2009).
43. Loo, Y. M. & Gale, M. Jr. Immune signaling by RIG-I-like receptors. Immunity 34, 680–692. https://doi.org/10.1016/j.immun
i.2011.05.003 (2011).
44. Miravete, M. et al. Renal tubular fluid shear stress facilitates monocyte activation toward inflammatory macrophages. Am. J. Physiol.
Renal. Physiol. 302, F1409-1417. https://doi.org/10.1152/ajprenal.00409.2011 (2012).
45. Harrison, D. A. The Jak/STAT pathway. Cold Spring Harb Perspect Biol 4. doi:https://doi.org/10.1101/cshperspect.a011205 (2012).
46. Eric Ho, J. W. in Handbook of Cell Signaling (ed Edward A. Dennis Ralph A. Bradshaw) Ch. 71, 533–538 (Academic Press, 2010).
Scientific Reports | (2021) 11:3234 | https://doi.org/10.1038/s41598-021-82853-6 11
Vol.:(0123456789)www.nature.com/scientificreports/
47. Veronica Lifshitz, D. F. in Handbook of Biologically Active Peptides (ed Abba J. Kastin) Ch. 225, 1647–1653 (Academic Press, 2013).
48. Varfolomeev, E. & Vucic, D. Intracellular regulation of TNF activity in health and disease. Cytokine 101, 26–32. https://doi.
org/10.1016/j.cyto.2016.08.035 (2018).
49. Mitchell, S., Vargas, J. & Hoffmann, A. Signaling via the NFkappaB system. Wiley Interdiscip. Rev. Syst. Biol. Med. 8, 227–241. https
://doi.org/10.1002/wsbm.1331 (2016).
50. Cheng, M., Wu, J., Li, Y., Nie, Y. & Chen, H. Activation of MAPK participates in low shear stress-induced IL-8 gene expression in
endothelial cells. Clin. Biomech. (Bristol, Avon) 23(Suppl 1), S96–S103. https://doi.org/10.1016/j.clinbiomech.2008.06.003 (2008).
51. Walshe, T. E. The role of shear-induced transforming growth factor-beta signaling in the endothelium. Arterioscler. Thromb. Vasc.
Biol. 33, 2608–2617. https://doi.org/10.1161/ATVBAHA.113.302161 (2013).
52. Hay, D. C. et al. Activation of NF-kappaB nuclear transcription factor by flow in human endothelial cells. Biochim. Biophys. Acta
1642, 33–44. https://doi.org/10.1016/s0167-4889(03)00084-3 (2003).
53. Doddaballapur, A. et al. Laminar shear stress inhibits endothelial cell metabolism via KLF2-mediated repression of PFKFB3.
Arterioscler. Thromb. Vasc. Biol. 35, 137–145. https://doi.org/10.1161/ATVBAHA.114.304277 (2015).
54. Punt, A. et al. New approach methodologies (NAMs) for human-relevant biokinetics predictions. Meeting the paradigm shift
in toxicology towards an animal-free chemical risk assessment. ALTEX 37, 607–622. doi:https://doi.org/10.14573/altex.2003242
(2020).
55. Steinway, S. N., Saleh, J., Koo, B. K., Delacour, D. & Kim, D. H. Human microphysiological models of intestinal tissue and gut
microbiome. Front. Bioeng. Biotechnol. 8, 725. https://doi.org/10.3389/fbioe.2020.00725 (2020).
56. Ashammakhi, N. et al. Gut-on-a-chip: Current progress and future opportunities. Biomaterials 255, 120196. https://doi.
org/10.1016/j.biomaterials.2020.120196 (2020).
57. Hewes, S. A. et al. In vitro models of the small intestine: Engineering challenges and engineering solutions. Tissue Eng. Part B Rev.
26, 313–326. https://doi.org/10.1089/ten.TEB.2019.0334 (2020).
58. Guo, P., Weinstein, A. M. & Weinbaum, S. A hydrodynamic mechanosensory hypothesis for brush border microvilli. Am. J. Physiol.
Renal. Physiol. 279, F698-712. https://doi.org/10.1152/ajprenal.2000.279.4.F698 (2000).
59. Hardacre, A. K., Lentle, R. G., Yap, S.-Y. & Monro, J. A. Does viscosity or structure govern the rate at which starch granules are
digested?. Carbohyd. Polym. 136, 667–675. https://doi.org/10.1016/j.carbpol.2015.08.060 (2016).
60. Lin, K. et al. MADMAX: Management and analysis database for multiple ~omics experiments. J. Integr. Bioinform. 8, 160. https://
doi.org/10.2390/biecoll-jib-2011-160 (2011).
61. Irizarry, R. A. et al. Exploration, normalization, and summaries of high density oligonucleotide array probe level data. Biostatistics
4, 249–264. https://doi.org/10.1093/biostatistics/4.2.249 (2003).
62. Bolstad, B. M., Irizarry, R. A., Astrand, M. & Speed, T. P. A comparison of normalization methods for high density oligonucleotide
array data based on variance and bias. Bioinformatics 19, 185–193. https://doi.org/10.1093/bioinformatics/19.2.185 (2003).
63. Dai, M. H. et al. Evolving gene/transcript definitions significantly alter the interpretation of GeneChip data. Nucleic Acids Res 33,
e175. https://doi.org/10.1093/nar/gni179 (2005).
64. Ritchie, M. E. et al. limma powers differential expression analyses for RNA-sequencing and microarray studies. Nucleic Acids Res.
43, e47. https://doi.org/10.1093/nar/gkv007 (2015).
65. Sartor, M. A. et al. Intensity-based hierarchical Bayes method improves testing for differentially expressed genes in microarray
experiments. BMC Bioinformatics 7, 1. https://doi.org/10.1186/1471-2105-7-538 (2006).
66. Benjamini, Y. & Hochberg, Y. Controlling the false discovery rate: A practical and powerful approach to multiple testing. J. R Stat.
Soc. B 57, 289–300 (1995).
67. Subramanian, A. et al. Gene set enrichment analysis: A knowledge-based approach for interpreting genome-wide expression
profiles. Proc. Natl. Acad. Sci. USA 102, 15545–15550. https://doi.org/10.1073/pnas.0506580102 (2005).
68. Allison, D. B., Cui, X., Page, G. P. & Sabripour, M. Microarray data analysis: from disarray to consolidation and consensus. Nat.
Rev. Genet. 7, 55–65. https://doi.org/10.1038/nrg1749 (2006).
69. Abatangelo, L. et al. Comparative study of gene set enrichment methods. BMC Bioinformatics 10, 275. https: //doi.org/10.1186/1471-
2105-10-275 (2009).
70. Kanehisa, M., Furumichi, M., Tanabe, M., Sato, Y. & Morishima, K. KEGG: New perspectives on genomes, pathways, diseases and
drugs. Nucleic Acids Res. 45, D353–D361. https://doi.org/10.1093/nar/gkw1092 (2017).
71. Kanehisa, M. & Goto, S. KEGG: kyoto encyclopedia of genes and genomes. Nucleic Acids Res. 28, 27–30. https://doi.org/10.1093/
nar/28.1.27 (2000).
72. Le Cao, K. A., Rohart, F., McHugh, L., Korn, O. & Wells, C. A. YuGene: a simple approach to scale gene expression data derived
from different platforms for integrated analyses. Genomics 103, 239–251. https://doi.org/10.1016/j.ygeno.2014.03.001 (2014).
73. Rohart, F. et al. A molecular classification of human mesenchymal stromal cells. Peer J. 4, e1845. https://doi.org/10.7717/peerj
.1845 (2016).
74. Clough, E. & Barrett, T. The gene expression omnibus database. Methods Mol. Biol. 1418, 93–110. https://doi.org/10.1007/978-1-
4939-3578-9_5 (2016).
75. Blighe, K., PCAtools: everything Principal Components Analysis, https://github.com/kevinblighe/PCAtools (2018).
Acknowledgements
The authors sincerely acknowledge the support and assistance of prof.dr.ir. IMCM (Ivonne) Rietjens. K. K. is
supported by a Royal Thai government Scholarship. This work was in part supported by the Dutch Ministry of
Agriculture, Nature and Food Quality (project KB-23-002-022).
Author contributions
K.K. performed the experiments and together with M.Z. and H.B. wrote the main manuscript text, L.D. per-
formed the immuno histochemistry, V.M. performed the shear stress simulations, G.H. with the support of K.K.
and I.M.E. performed the biostatistical analysis.
Competing interests
The authors declare no competing interests.
Additional information
Supplementary Information The online version contains supplementary material available at https://doi.
org/10.1038/s41598-021-82853-6.
Correspondence and requests for materials should be addressed to K.K. or H.B.
Reprints and permissions information is available at www.nature.com/reprints.
Scientific Reports | (2021) 11:3234 | https://doi.org/10.1038/s41598-021-82853-6 12
Vol:.(1234567890)You can also read