A novel epitope tagging system to visualize and monitor antigens in live cells with chromobodies - Nature
←
→
Page content transcription
If your browser does not render page correctly, please read the page content below
www.nature.com/scientificreports
OPEN A novel epitope tagging system
to visualize and monitor antigens
in live cells with chromobodies
Bjoern Traenkle1,2,3, Sören Segan2,3, Funmilayo O. Fagbadebo1, Philipp D. Kaiser2 &
Ulrich Rothbauer1,2*
Epitope tagging is a versatile approach to study different proteins using a well-defined and established
methodology. To date, most epitope tags such as myc, HA, V5 and FLAG tags are recognized by
antibodies, which limits their use to fixed cells, tissues or protein samples. Here we introduce a
broadly applicable tagging strategy utilizing a short peptide tag (PepTag) which is specifically
recognized by a nanobody (PepNB). We demonstrated that the PepNB can be easily functionalized
for immunoprecipitation or direct immunofluorescence staining of Pep-tagged proteins in vitro. For in
cellulo studies we converted the PepNB into a fluorescently labeled Pep-chromobody (PepCB) which
is functionally expressed in living cells. The addition of the small PepTag does not interfere with the
examined structures in different cellular compartments and its detection with the PepCB enables
optical antigen tracing in real time. By employing the phenomenon of antigen-mediated chromobody
stabilization (AMCBS) using a turnover-accelerated PepCB we demonstrated that the system is
suitable to visualize and quantify changes in Pep-tagged antigen concentration by quantitative live-
cell imaging. We expect that this novel tagging strategy offers new opportunities to study the dynamic
regulation of proteins, e.g. during cellular signaling, cell differentiation, or upon drug action.
Antibodies are still the key players to detect and study given proteins in biomedical research. However, their
large size and multi-domain nature as well as their instability in the intracellular milieu limits their application
within living cells or organisms. Single-domain antibody fragments (referred to as nanobodies, Nbs) derived from
heavy-chain-only antibodies of camelids have become an attractive alternative to conventional antibodies1,2. Due
to their natural single-domain structure, small size, high stability and solubility, Nbs have beneficial properties
for intracellular applications and there are numerous reports available which describe the selection of nano-
bodies for live-cell s tudies3–8. To visualize and monitor endogenous antigens in their native surroundings, Nbs
are genetically fused to fluorescent proteins to generate so-called chromobodies (CBs) which are introduced as
DNA-encoded expression constructs in living cells9. During the last decade multiple CBs have been developed
and successfully applied in various approaches to monitor dynamic changes of their antigens in cell models
and organisms (reviewed i n2). Despite their potential to directly probe native antigens, the de novo generation
of gene-specific CBs is still cumbersome and time-consuming10–15. Thus, generic CBs recognizing protein- or
peptide-tags would be a promising alternative. A well-established example is the GFP-CB which has become
widely used for multiple functional and imaging applications ranging from targeted relocalization9,16,17, induced
proteasomal degradation18,19, or high-throughput translocation a ssays20 of GFP-tagged proteins. However, it
has to be considered that the addition of large protein tags such as GFP can affect expression, cellular localiza-
tion, folding and/or function of the fusion protein21,22. Thus, CBs targeting smaller peptide-derived epitope tags
would be favorable. Notably, most Nbs bind conformational epitopes which strongly limits the identification
of peptide specific Nbs23–25. To date only very few peptide-binding Nbs are reported26–28. Recently, Strokappe
et. al. described a Nb (VHH 2E7) which binds with high affinity to a helix-forming peptide located in the first
heptad repeat of the glycoprotein 41 (gp41) of HIV29. Considering the viral origin of the peptide and the lack of
homologous sequences within proteins of eukaryotic cells (blast.ncbi.nlm.nih.gov/Blast.cgi), we reasoned that the
isolated peptide would provide an interesting epitope tag, which could be matched by a VHH 2E7-derived CB.
For a better understanding we refer to the helical epitope sequence (AVERYLKDQQLLGIW) as “PepTag” and
1
Pharmaceutical Biotechnology, Eberhard Karls University, Tuebingen, Germany. 2Natural and Medical Sciences
Institute, University of Tuebingen, Markwiesenstr. 55, 72770 Reutlingen, Germany. 3These authors contributed
equally: Bjoern Traenkle and Sören Segan. *email: ulrich.rothbauer@uni‑tuebingen.de
Scientific Reports | (2020) 10:14267 | https://doi.org/10.1038/s41598-020-71091-x 1
Vol.:(0123456789)
www.nature.com/scientificreports/
the VHH 2E7 as “PepNb” or “PepCB” respectively. In this study, we demonstrate the functionality and applica-
tion of the novel PepNb and PepCB for biochemical and live-cell studies. We show that the PepCB is capable of
visualizing the dynamic distribution of Pep-tagged proteins in living cells. Additionally, following our recent
developments in generating turnover-accelerated chromobodies, which can be used to optically monitor dynamic
changes in protein concentration in live cells30, we demonstrate that a turnover-accelerated PepCB is stabilized
in the presence of its antigen. Based on our findings, we propose that the PepTag/PepCB pair yields a versatile
system to use a small generic epitope tag in combination with a specific chromobody for multiple live cell studies.
Material and methods
Expression constructs. Oligonucleotide sequences used for cloning are listed in Table S1. Expression
constructs and cell lines used in this study are listed in Table S2. For bacterial expression of PepNb, cod-
ing sequence of the PepNb was produced by gene synthesis (Integrated DNA Technologies, Iowa, USA) and
cloned into the pHEN6 vector31, thereby adding a C-terminal His6-Tag for immobilized metal affinity chro-
matography (IMAC) purification as described previously32. For generating Pep-chromobody (PepCB) expres-
sion constructs either comprising eGFP or TagRFP as fluorescent moiety, the PepNb sequence was ligated into
BglII- and BstEII-digested backbone plasmids previously described as lamin-chromobody (eGFP)7 and PCNA-
chromobody (TagRFP)33 (kindly provided by ChromoTek GmbH, Planegg-Martinsried, Germany). To generate
homologous DNA for AAVS1 PepCB integration, first, eGFP of the previously described donor plasmid EF1-
α-Ub-R-ACT-CB34 was replaced by TagRFP using BamHI and XbaI restriction sites. Secondly, the ACT-Nb
was replaced by PepNb using PstI and BspEI. The expression construct coding for C-terminally Pep-tagged
mCherry-vimentin (mCherry-VIMPep) was generated by site-directed mutagenesis of mCherry-vimentin14
using the primer set vimentin-PepTag-for and vimentin-PepTag-rev. The amplified DNA was purified, digested by
the restriction enzyme KpnI, and religated. Accordingly, the N-terminally Pep-tagged eGFP (PepGFP) construct
was produced from BC2T-eGFP27 using the primer pair PepTag-eGFP-for and PepTag-eGFP-rev. Utilizing the
primer set PepTag-ACTB-for and PepTag-ACTB-rev Pepactin was generated from BC2T-actin35. The expression
construct coding for PepGFP-tubulin was generated by replacing PAmCherry in the plasmid PAmCherry-tubulin
(PAmCherry-a-tubulin was a gift from Vladislav Verkhusha; addgene plasmid #31930) using NheI and BsrGI.
For the GFP-PCNAPep expression construct a C-terminal PepTag was introduced by site-directed mutagenesis of
the previously described GFP-PCNA36 using the primers PCNA-PepTag-for and PCNA-PepTag-rev. To generate
the expression construct for PepGFP-NLS the NLS sequence was introduced C-terminally to PepGFP with primers
eGFP-NLS-fwd and eGFP-NLS-rev. The expression construct coding for eGFP-NLS was produced from pEGFP-
N1 (Takara Bio USA, Inc., Mountain View, CA, USA) accordingly. For the generation of the PCNAPep expres-
sion construct the N-terminal GFP was deleted from GFP-PCNAPep utilizing the primer set Del-GFP-for and
Del-GFP-rev. Correspondingly, the expression construct VIMPep was generated from mCherry-VIMPep using the
primers Del-mCherry-for and Del-mCherry-rev. The expression construct encoding pepMiro1 was generated by
DNA assembly of two fragments: fragment 1—the vector backbone of the pepactin plasmid amplified with the
primer set Bkb-pepAct-for and Bkb-pepAct-rev. Fragment 2 was generated in two steps: First, an N-terminal G4S
linker was introduced by site-directed mutagenesis of Miro1-His6 (kindly provided by Julia Fitzgerald) with the
primers mutMiro1-for and mutMiro1-rev. Subsequently, Miro1 was amplified from the resulting plasmid with
the primers Miro1-for and Miro1-rev. Fragment assembly was carried out using NEBuilder HiFi DNA assembly
Master Mix (New England Biolabs) according to the manufacturer’s protocol. All generated expression con-
structs were sequence analyzed after cloning.
Cell culture, transfection, CRISPR and compound treatment. HEK293T and U2OS cell lines were
obtained from ATCC (CRL3216, HTB-96), and transgenic BHK cells containing multiple lac operator repeats
from T. Tsukamato37 (Cold Spring Harbor University, New York, NY, USA). The HeLa Kyoto cell line (Cellosau-
rus no. CVCL_1922) was obtained from S. Narumiya (Kyoto University, Japan). The cell lines were tested nega-
tive for mycoplasma using the PCR mycoplasma kit Venor GeM Classic (Minerva Biolabs, Berlin, Germany)
and the Taq DNA polymerase (Minerva Biolabs). Since this study does not include cell line-specific analysis,
cell lines were used without additional authentication. Cell lines were cultured according to standard protocols.
Briefly, growth media containing DMEM (high glucose, pyruvate, ThermoFisher Scientific, Waltham, MA, USA)
supplemented with 10% (v/v) fetal calf serum (FCS, ThermoFisher Scientific), L-glutamine (ThermoFisher Sci-
entific) and penicillin/streptomycin (ThermoFisher Scientific) was used for cultivation. Cells were routinely pas-
saged using 0.05% trypsin–EDTA (ThermoFisher Scientific) and were cultivated at 37 °C in a humidified cham-
ber with a 5% C O2 atmosphere. Transient transfection of U2OS and HeLa Kyoto cells with Lipofectamine 2000
(ThermoFisher Scientific, cat. # 11668019) was carried out according to manufactures instruction. HEK293T
and transgenic BHK cells were transfected with Polyethylenimine (PEI, Sigma-Aldrich, St. Louis, MO, USA)
as previously d escribed8,27. For site-directed integration of the PepCB into AAVS1 genomic locus, 5 × 10⁵ U2OS
cells were co-transfected with 4.5 µg of the respective donor plasmid and 0.5 µg plasmid expression vector cod-
ing for Cas9 nuclease and gRNA specific for the AAVS1 locus. 24 h post transfection cells were subjected to a
48 h selection period using 1 µg/mL puromycin dihydrochloride (Sigma-Aldrich). Puromycin-resistant cells
were expanded for one week before single clones were derived from the cell pool by limiting dilution. To verify
site-directed integration of the CB-donor plasmid at the AAVS1 locus, genomic DNA of individual clones and
the respective parental cell line was isolated using QIAamp DNA mini Kit (Qiagen, Hilden, Germany) according
to manufacturer’s instructions. Next, primer pair AAVS-1-vor-HA-L-for and AAVS1-T2A-rev (AAVS1-primer-
pair-1) primer set, and AAVS1-HA-L-for and AAVS1-HA-R-rev (AAVS1-primer-pair-2) were used for PCR-
based genotyping (strategy outlined in Supplementary Fig. 3). Successful CB integration into the AAVS1 locus
results in an amplicon of 1,018 bps using AAVS1-primer-pair-1. To determine whether a homozygous or a
Scientific Reports | (2020) 10:14267 | https://doi.org/10.1038/s41598-020-71091-x 2
Vol:.(1234567890)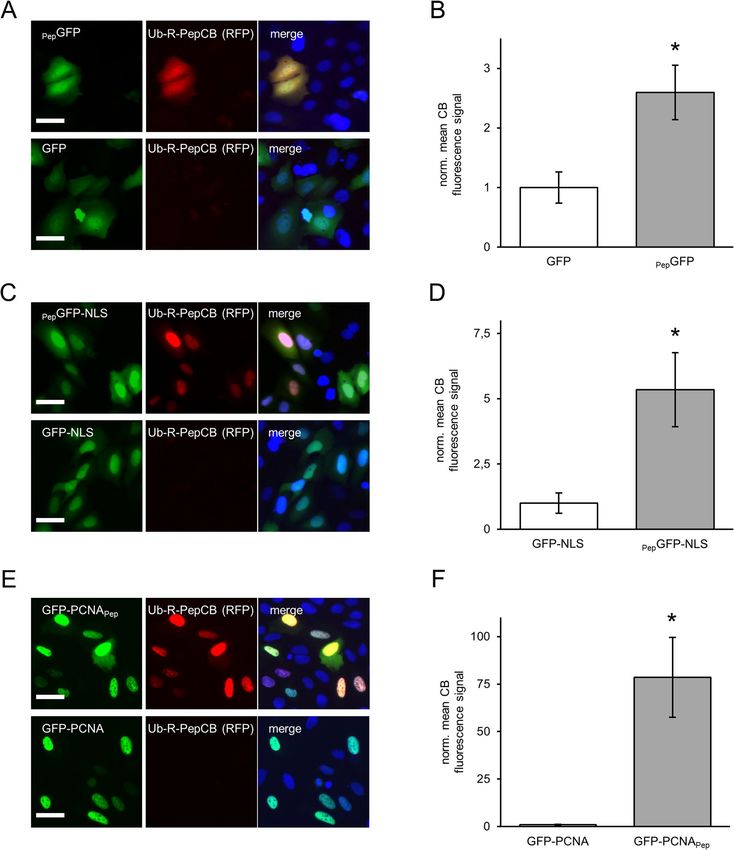
www.nature.com/scientificreports/
heterozygous CRISPR event occurred AAVS-1-primer-pair-2 was utilized: homozygous CRISPR events result in
an amplicon of 4,346 bps, while heterozygous CRISPR events result in two amplicons of 4,346 bps and 289 bps.
Compound treatment with 2 µM cytochalasin D (Sigma-Aldrich) was performed for 10 min, followed by an
exchange to cytochalasin D-free medium for additional 35 min.
Recombinant protein production and nanobody labeling. PepNb comprising a C-terminal Sortase-
tag was expressed, purified and site-directed conjugated to Alexa Fluor 647 (AF647) or ATTO488-coupled pep-
tides H-Gly-Gly-Gly-Doa-Lys-NH2 (sortase substrate, Intavis AG, Köln, Germany) as previously d escribed35,38.
Briefly, 25 µM nanobody, 75 µM dye-labeled peptide dissolved in sortase buffer (50 mM Tris, pH 7.5, and
150 mM NaCl) and 100 µM sortase were mixed in coupling buffer (50 mM Tris, pH 7.5, 150 mM NaCl, and
10 mM CaCl2) and incubated for 5 h at 25 °C. Uncoupled nanobody and sortase were depleted using Ni–NTA
resin (Biorad, Hercules, CA, USA). Unbound dye was removed using Zeba Spin Desalting Columns (Ther-
moFisher Scientific). The dye-labeled protein fraction was analyzed by SDS-PAGE followed by fluorescent scan-
ning on a Typhoon Trio (GE-Healthcare, Chicago, IL, USA, excitation 633 nm, emission filter settings 670 nm
BP 30) and subsequent Coomassie staining. For sortase-coupled nanobodies degree of labeling values (DOLs)
of 0.7 ± 0.15 were determined.
Immunoprecipitation, SDS‑PAGE and western blot. 3 × 10⁶ HEK 293 T cells were seeded in 100 mm
culture dishes (Corning, New York, NY, USA) and cultivated for 24 h. In the following, cells were subjected
to plasmid DNA transfection with equal amounts of expression vectors. Subsequently, cells were washed and
harvested in PBS, snap-frozen in liquid nitrogen and stored at − 20 °C. Cell pellets were homogenized in 100 µL
lysis buffer (10 mM Tris/HCl, 150 mM NaCl, 0.5 mM EDTA, 0.5% NP40, 1 mM PMSF, 1 µg/mL DnaseI, 2.5 mM
MgCl2, 1 × protease inhibitor cocktail (Serva, Heidelberg, Germany)) by repeated pipetting and vortexing for
60 min on ice. Lysates were clarified by subsequent centrifugation at 18.000 × g for 15 min at 4 °C. The super-
natant was adjusted with dilution buffer (10 mM Tris/HCl ,150 mM NaCl, 0.5 mM EDTA, 1 mM PMSF) to
0.5 mL. 10 μL (2%) were added to 2 × SDS-containing sample buffer (60 mM Tris/HCl, 2% (w/v) SDS, 5% (v/v)
2-mercaptoethanol, 10% (v/v) glycerol, 0.02% bromophenole blue; referred to as input). For immunoprecipita-
tion purified PepNb was immobilized to NHS-activated sepharose (GE-Healthcare) as described previously 15.
30 μL of sepharose-coupled nanobodies were added to the protein solution and incubated for 16 h on an end-
over-end rotor at 4 °C. After centrifugation (2 min, 2,500 × g, 4 °C) supernatant was removed and the bead pellet
was washed two times in 0.5 mL dilution buffer, resuspended in 2 × SDS-containing sample buffer and boiled for
10 min at 95 °C. Denaturing polyacrylamid gel electrophoresis (SDS-PAGE) was performed according to stand-
ard procedures. For western blotting, proteins were transferred on nitrocellulose membrane (GE Healthcare).
Antibodies. Following primary antibodies were used in this study: anti-GFP clone 3H9 (ChromoTek, Mar-
tinsried, Germany), anti-vimentin, (α-VIM-IgG, clone V9) (Sigma Aldrich), anti-tRFP (Evrogen, Moscow, Rus-
sia). For detection, fluorophore-labeled species-specific secondary antibodies (Alexa-647, Alexa-546, Alexa-488;
goat-anti-mouse, goat-anti-rabbit, goat-anti-rat; Thermo Fisher Scientific) were used. Blots were scanned on a
Typhoon-Trio laser scanner (GE Healthcare).
Intracellular immunoprecipitation (IC‑IP). 3 × 10⁶ HEK293T cells were transiently co-transfected with
equal amounts of expression vectors coding for PepCB (TagRFP) and PepGFP or eGFP. 24 h after transfection
cells were harvested, lysed as described and PepCB or eGFP were precipitated using the RFP-trap or GFP-trap
(ChromoTek) according to manufacturer’s protocol. Input and bound fractions were subjected to SDS-PAGE
followed by immunoblotting analysis.
Immunofluorescence. For immunofluorescence staining, U2OS cells were plated at 8 × 10³ per well in a
μClear 96 well plate (Greiner Bio-One, Kremsmünster, Austria). Next day, cells were transfected with plasmids
coding for Pepactin or GFP-PCNAPep. 24 h after transfection, cells were washed twice with PBS and fixed with
4% (w/v) paraformaldehyde (PFA) in PBS for 15 min at RT or with a 1:1 mixture of methanol/acetone for 15 min
at -20 °C. Incubation with labeled PepNbs (50 ng/mL in 5% BSA in TBST) was performed overnight at 4 °C.
For nuclear staining 4′,6-diamidino-2-phenylindole (DAPI, Sigma-Aldrich) was used. Unbound nanobody and
DAPI were removed by three washing steps with PBS and images were acquired immediately afterwards with a
MetaXpress Micro XL system (Molecular Devices, San Jose, CA, USA).
Microscopy and FRAP analysis. For fluorescence recovery after photobleaching (FRAP) experiments,
8 × 10³ U2OS cells per well were seeded in a Cellstar 96-well plate (Greiner Bio-One) and transiently trans-
fected with cDNAs encoding GFP-actin, actin-CB or PepCB in combination with Pepactin. FRAP recordings
were performed with a Zeiss confocal laser scanning microscope (CLSM 510 Meta) using a 488 nm argon laser
and 63 × magnification. For photobleaching, the laser was set to 20% output and 100% transmission to bleach a
2.2 × 2.2 μm region of interest for 2.4 s. Confocal imaging series were acquired with 1% laser transmission and
the pinhole opened to 1.5 Airy units. Generally, 5 prebleach and 145 postbleach images were recorded with
588 ms time intervals. Normalized mean fluorescence intensities were corrected for background and for total
loss of fluorescence over time. Fluorescence recovery curves were fitted with Origin 7.5 using an exponential
function, given by I(t) = A(1 − e−kt ), where I(t) is the signal intensity dependent on time, A is the end value of
intensity, k is the time constant. Half-times of recovery were determined by t1/2 = ln0.5
−k .
Scientific Reports | (2020) 10:14267 | https://doi.org/10.1038/s41598-020-71091-x 3
Vol.:(0123456789)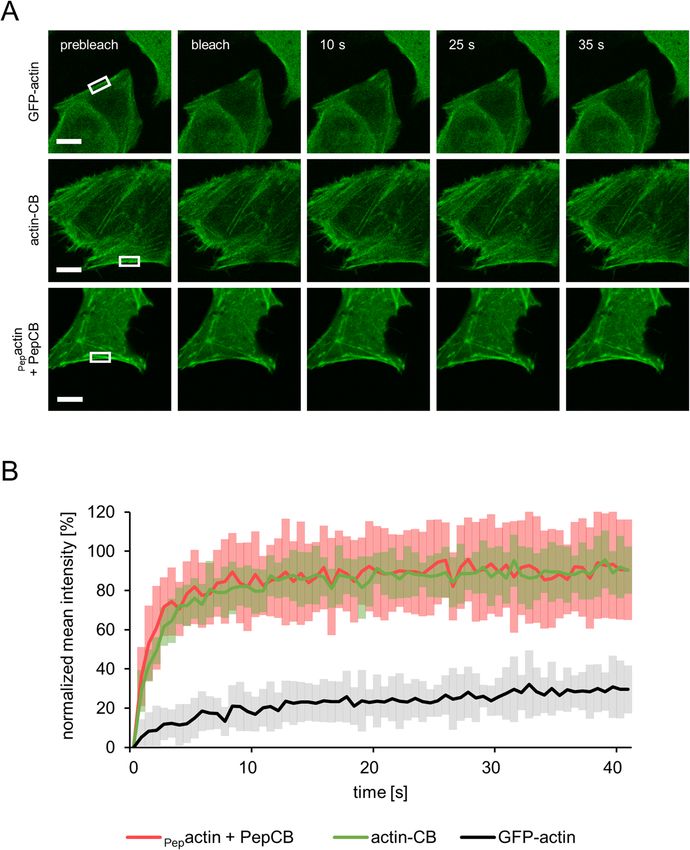
www.nature.com/scientificreports/
Image segmentation and analysis. 8 × 10³ cells were plated per well in a black μClear 96-well plate
(Greiner Bio-One) and transfected as described above. For automated nuclear segmentation, nuclei of live cells
were stained by addition of 2 μg/mL Hoechst33258 (Sigma-Aldrich) to the cell culture medium. Images were
acquired with an ImageXpress micro XL system (Molecular Devices) and analyzed by MetaXpress software (64
bit, 6.2.3.733, Molecular Devices). Fluorescence images comprising a statistically relevant number of cells were
acquired for each condition (> 200 cells). For quantitative fluorescence analysis, the mean fluorescence of the
PepCB in cells transiently expressing a PepTag-comprising antigen or its respective control was determined.
Custom Module Editor (version 2.5.13.3) of the MetaXpress software was used to establish an image segmenta-
tion algorithm based on the parameters size and fluorescence intensity above local background. An image seg-
mentation mask was generated based on the PepTag-comprising antigen or its control. The average chromobody
fluorescence intensities were determined for each image followed by subtraction of background fluorescence.
From these values the mean fluorescence was determined and standard errors were calculated for three inde-
pendent biological replicates and student’s t-test was used for statistical analysis.
Results and discussion
Generation of a PepTag/PepNb capture system. To test whether the PepNb is able to capture recom-
binant proteins of interest (PoIs) comprising a PepTag, we covalently coupled purified PepNb to sepharose beads
and generated an affinity matrix refered to as Pep-nanotrap. For immunoprecipitation we incubated soluble
protein lysates of HEK293T cells transiently expressing N-terminally Pep-tagged eGFP (PepGFP) or eGFP as
control (Fig. 1A) with the Pep-nanotrap and analyzed the input, non-bound and bound fractions by SDS-PAGE
followed by Coomassie staining and immunoblotting. Pep-nanotrap specifically precipitated PepGFP but not
eGFP (Fig. 1B). However, immunoblotting revealed that a significant amount of PepGFP remained in the non-
bound fraction indicating that the Pep-nanotrap was not able to deplete PepGFP quantitatively from the cellular
lysate (Fig. 1B). This might be due to a high dissociation rate of the antigen, which is supported by an improved
pulldown efficiency when using a greater amount of Pep-nanotrap (data not shown). Next, we tested whether the
Pep-nanotrap is also suited to capture proteins displaying the PepTag at their C-terminus. Thus, we performed
immunoprecipitation of the structural protein vimentin comprising a PepTag at its C-terminus (mCherry-
VIMPep) (Fig. 1A). The results show that Pep-tagged vimentin was efficiently precipitated by the Pep-nanotrap
(Fig. 1C). In contrast to PepGFP, we detected only minor amounts of the mCherry-VIMPep in the non-bound
fraction. Additionally, western blot analysis revealed co-precipitation of endogenous vimentin along with the
tagged version indicating an incorporation of mCherry-VIMPep into the network of the endogenous intermedi-
ary filaments. From these findings, we conclude that the PepNb binds its epitope in the context of exogenously
expressed proteins and can be converted into an affinity matrix to capture recombinant Pep-tagged proteins.
Considering the observed differences in binding capacities of the Pep-nanotrap, it is conceivable that binding
efficiencies of the PepNb rely more on the formation of an alpha helical structure of the PepTag as previously
shown by the complex crystal structure29 than on its position at the N- or C-terminus of the tested PoIs. Thus,
short linker sequences placed between the PepTag and the PoI might be helpful to improve pulldown efficiencies.
Detection of Pep‑tagged proteins by direct immunofluorescence. To test whether the PepTag/
PepNb system is also suitable for direct detection of epitope-tagged proteins in immunofluorescence (IF), we
coupled the organic dyes Alexa Fluor 647 (AF647) and Atto 488 site specifically to the C-terminus of the PepNb
using Sortase A 35. First we monitored the performance of the PepNb in IF by fluorescence colocalization stud-
ies in U2OS cells transiently expressing a fusion construct encoding GFP-PCNAPep, which localizes at discrete
sites of DNA replication in the nucleus forming characteristic patterns during the S-phase of the cell c ycle36. IF
staining with the PepNbAF647 revealed a clear co-localization of the Nb and the GFP signal at DNA replication
foci in the nucleus (Fig. 1D). Secondly, we performed IF staining of actin filaments using the P epNbATTO488. In
this experiment, we additionally tested the compatibility of the PepTag with standard fixation methods. Thus,
we transiently expressed Pepactin in U2OS cells and fixed the cells 24 h post transfection using PFA followed by
methanol/acetone treatment, or methanol/acetone alone. For all tested fixation methods IF staining with the
PepNbATTO488 showed characteristic fibers of the actin cytoskeleton (Fig. 1E). From these data, we concluded
that addition of the PepTag does not affect the characteristic localization of proteins and fluorophore-conjugated
PepNbs are suitable to directly visualize antigens comprising this epitope tag in immunofluorescence staining
independent of the applied fixation method.
Detecting PepCB binding of Pep‑tagged proteins in living cells. For intracellular applications, we
fused the PepNb to TagRFP or eGFP thereby generating Pep-chromobody (PepCB) expression constructs. In a
first step, we performed intracellular immunoprecipitations (IC-IPs) to test the antigen binding capability of the
PepCB. Thus we co-transfected HEK293T cells with the PepCB (TagRFP) in combination with PepGFP or eGFP
as control and incubated the soluble protein fraction with the RFP-trap to pull down PepCB or the GFP-trap to
pull down the a ntigen14,30. Immunoblot analysis of the input, non-bound and bound fractions using anti-GFP
or anti-TagRFP antibodies showed a clear enrichment of the PepCB in the bound fraction of PepGFP. A lower
amount of PepGFP is also co-precipitated along with the PepCB (Fig. 2A, left panel). Notably, for co-expression
of PepCB and eGFP no co-precipitation was observed (Fig. 2A, right panel). To further confirm intracellular
chromobody binding we visualized the interaction of the PepCB with the Pep-tagged proteins in living cells
using the Fluorescent Two-Hybrid Assay (F2H8). We performed triple transfections of BHK cells comprising a
stably integrated lac operator (lacO) array37 with constructs encoding for a fusion of lac inhibitor-GFP binding
protein (lacI-GBP), PepGFP or eGFP and the PepCB. Fluorescence imaging showed a clear localization of both
eGFP constructs at the spot-like lacO array in the nucleus of BHK cells (Fig. 2B). A recruitment of the PepCB to
Scientific Reports | (2020) 10:14267 | https://doi.org/10.1038/s41598-020-71091-x 4
Vol:.(1234567890)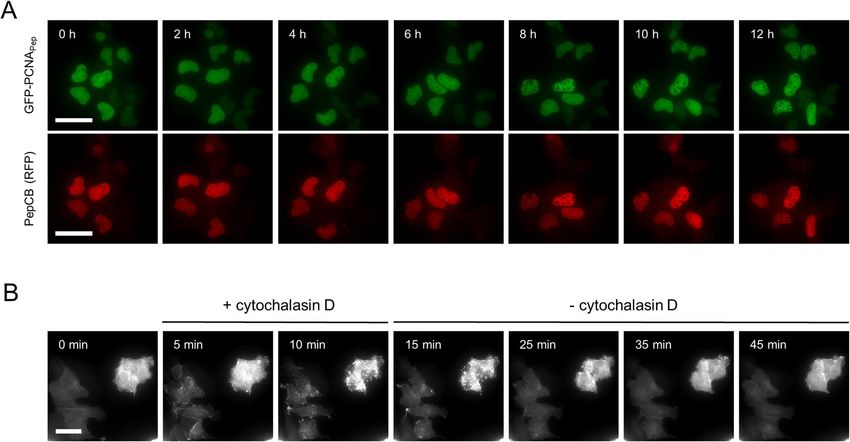
www.nature.com/scientificreports/
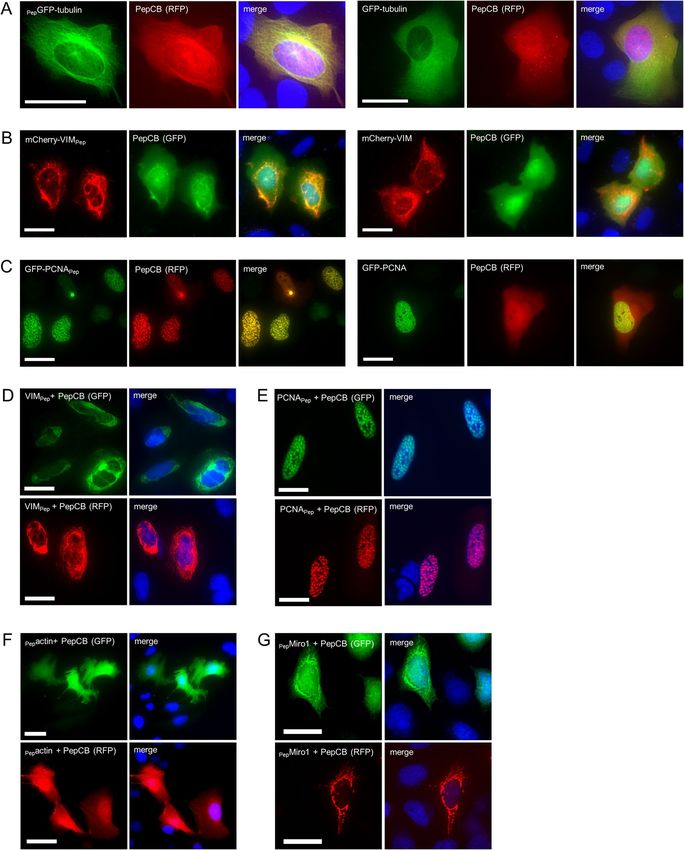
Figure 1. Purification and detection of Pep-tagged proteins with functionalized PepNb. (A) Schematic
illustration of Pep-tagged fusion proteins and control proteins used for immunoprecipitation. (B, C) For
immunoprecipitation soluble protein fractions of HEK293T cells either expressing GFP with an N-terminal
PepTag (PepGFP) or eGFP (B), or mCherry-vimentin comprising the PepTag at the C-terminus (mCherry-
VIMPep), or mCherry-vimentin (mCherry-VIM) (C), were incubated with the Pep-Nb immobilized on
sepharose-beads (Pep-nanotrap). Input (I), non-bound (NB) and bound (B) fractions were separated by SDS-
PAGE and analyzed either by Coomassie Blue staining (top) or immunoblot with an anti-GFP antibody (B)
or anti-Vimentin antibody (bottom) (C). (D) U2OS cells expressing GFP-PCNAPep were fixed with methanol/
acetone and stained with PepNb conjugated to AlexaFluor647 ( PepNbAF647, red) and nuclei were stained
with DAPI (blue). Scale bar 25 µm. (E) U2OS cells expressing Pepactin were fixed using either 4% PFA, 4%
PFA followed by methanol/acetone (MeOH/Ace) or MeOH/Ace alone and stained with PepNb conjugated to
Atto488 (PepNbAtto488, green). Nuclei were stained with DAPI (blue). Scale bar 25 µm.
Scientific Reports | (2020) 10:14267 | https://doi.org/10.1038/s41598-020-71091-x 5
Vol.:(0123456789)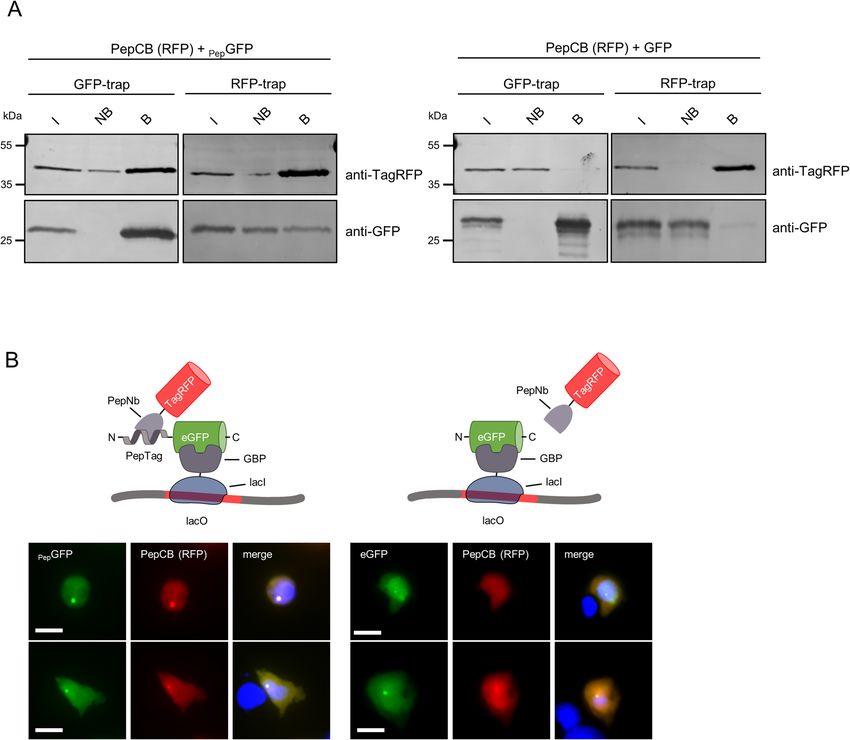
www.nature.com/scientificreports/
Figure 2. PepCB binds to its antigen in living cells. (A) Intracellular immunoprecipitation (IC-IP). Lysates of
HEK293T cells expressing PepGFP or GFP in combination with the PepCB comprising TagRFP as detectable
moiety were subjected to immunoprecipitation with the GFP-trap or the RFP-trap. Input (I), non-bound (NB)
and bound fractions (B) were analyzed by immunoblot with anti-TagRFP antibody (upper panel) and anti-
GFP antibody (lower panel). (B) F2H assay to test the functionality of the PepCB in cellulo. Schematic drawing
shortly outlines the assay principle (top). Transgenic BHK cells containing lac operator repeats (lacO) were
co-transfected with lacI-GBP, PepCB (TagRFP) and PepGFP (left panel) or eGFP (right panel). lacI-GBP binds
to the lacO array and recruits GFP (bait protein, visible as a green spot, left column). PepCB (prey protein)
binds anchored PepGFP but not GFP (middle column). Nuclei were counterstained with DAPI (right column).
Representative images are shown. Scale bar 25 µm.
the lacO-spot was only observable in the presence of PepGFP (Fig. 2B, left panel) whereas upon co-expression of
eGFP a dispersed distribution of the PepCB signal was observable (Fig. 2B right panel). To further validate these
findings, we transfected U2OS cells with constructs encoding GBP-lamin B 132, PepGFP or eGFP in combination
with the PepCB. Fluorescence images of triple transfected cells revealed the recruitment of both GFP constructs
to the nuclear lamina via the lamin-GBP construct. However, only in cells expressing PepGFP the PepCB was
detectable at the nuclear membrane (Supplementary Fig. 1, left panel). In summary, both the biochemical bind-
ing analysis and the fluorescence colocalization studies showed a specific intracellular binding capacity of the
PepCB in living cells.
Visualization of intracellular proteins using the PepCB. Next, we studied whether the PepTag/PepCB
system is applicable to different cellular structures. To monitor antigen binding of the PepCB in living cells, we
performed fluorescent colocalization studies of U2OS cells transiently expressing the PepCB in combination
with differently labeled fluorescent protein (FP)-fusions of the microtubules (PepGFP-tubulin), intermediary
Scientific Reports | (2020) 10:14267 | https://doi.org/10.1038/s41598-020-71091-x 6
Vol:.(1234567890)www.nature.com/scientificreports/
filaments (mCherry-VIMPep) and the replication machinery (GFP-PCNAPep). All fluorescently labeled antigens
could be imaged at their innate cellular localization (Fig. 3A—C). As shown for microtubules, PepCB visual-
ized these structures exclusively in cells expressing PepGFP-tubulin (Fig. 3A, left panel) but not in the absence
of the PepTag (Fig. 3A, right panel and Supplementary Fig. 2A). Similar findings were obtained for mCherry-
VIMPep, which comprises the PepTag at the C-terminus (Fig. 3B, right panel and Supplementary Fig. 2B). Also
for GFP-PCNAPep we observed a clear colocalization of the PepCB and the antigen-derived GFP signal at DNA
replication foci within the nuclei of double transfected cells (Fig. 3C, left panel), whereas the PepCB was diffu-
sively distributed in cells coexpressing GFP-PCNA without the PepTag (Fig. 3C, right panel and Supplementary
Fig. 2C). To exclude an influence of FPs on antigen binding, we analyzed corresponding non-fluorescent anti-
gens. Visualizing the PepCB, labeled either with GFP or RFP, we detected in V IMPep expressing cells characteris-
tic filamentous structures in the cytoplasm and for PCNAPep expressing cells typical DNA replication foci within
the nucleus (Fig. 3D, E). Finally, we aimed to visualize microfilaments and mitochondria using the PepCB. Thus
we transfected U2OS cell with Pepactin (Fig. 3F) and HeLa cells with PepMiro1 (Fig. 3G) in combination with the
GFP- or RFP-labeled PepCB. For both antigens, we detected a clear PepCB staining of the respective cellular
structures. In conclusion, these data demonstrate the capability of the PepCB to visualize Pep-tagged antigens in
different compartments in living cells. As tested for five different structural proteins, neither the addition of the
PepTag nor binding of the PepCB showed any sign of disturbing the characteristic localization of the antigen.
The PepCB binds only transiently to its epitope within living cells. Our findings suggest that the
PepCB visualizes the Pep-tagged target structure without interfering with its localization or function. As dem-
onstrated previously for other CBs this could be due to a transient binding m ode9,12,14,33. To analyze intracel-
lular binding properties, we determined the turnover-rate of the PepCB upon binding to Pepactin by fluores-
cence recovery after photobleaching (FRAP). U2OS cells transiently expressing PepCB and Pepactin or respective
control constructs (GFP-actin or actin-CB) were photobleached at indicated regions (Fig. 4A). Quantitative
evaluation of the FRAP data revealed that only ~ 30% of the GFP-actin fluorescence signal recovered within 40 s
(Fig. 4B) indicating a stable incorporation of fluorescently labeled GFP-actin in the cytoskeletal filaments. In
contrast, both CBs targeting either endogenous actin (actin-CB) or Pepactin (PepCB) showed significantly higher
recovery rates of ~ 90% within the analyzed time frame (Fig. 4B). Notably, the PepCB relocalized even faster to
actin structures ( t1/2 = 1.08 s) compared to the actin-CB (t1/2 = 2.01 s). Such fast recovery rates are characteristic
for transient antigen binding and in accordance with previous fi ndings33. From these data we concluded that
despite of high affinities determined for the original nanobody VHH 2E7 (KD: 0.6 nM) in vitro29 the PepCB
displays high off-kinetics in cellulo. Considering published data on transient binding chromobodies it is con-
ceivable that such a binding mode results in only minor influence on the function and dynamics of the target
protein9,33.
Intracellular visualization of protein dynamics using the PepCB. Next, we investigated the abil-
ity of the PepCB to trace dynamic changes of its antigen in living cells, again using GFP-PCNAPep and Pepactin.
GFP-PCNAPep constitutes a special challenge to live-cell microscopy because it is an essential component of the
replication machinery that concentrates at replication foci in S phase and shows a diffuse pattern in G1 and G236.
We followed the subcellular distribution of GFP-PCNAPep and the red fluorescent PepCB in non-synchronized
cells throughout different stages of the cell cycle by taking images every 60 min for 12 h (Fig. 5A, Supplementary
Video 1). At the beginning of the time series both GFP-PCNAPep and the PepCB showed a dispersed nuclear
localization indicative for G1 phase shifted to more punctate structures which are characteristic for the progres-
sion of cells into S phase. Throughout the complete observation period, the PepCB signal colocalizes with the
GFP signal derived from its antigen GFP-PCNAPep.
To test whether the PepCB also visualizes dynamic changes of its antigen upon compound treatment, we
performed time-lapse imaging on U2OS cells co-expressing the PepCB and Pepactin, which were initially treated
with the actin-modulating compound cytochalasin D, for 10 min. Subsequently, we removed the compound and
continuously imaged the cells for 30 min (Fig. 5B, Supplementary Video 2). The PepCB signal revealed a rapid
re-organization of filamentous actin within 5 min of cytochalasin D treatment followed by the reappearance of
actin fibers upon removal of the compound within 30 min. These time-lapse analyses showed that the PepCB
can trace essential components of the replication machinery as well as tightly organized cytoplasmic structures
without major impact on cell viability.
Antigen‑mediated stabilization of the PepCB. Recently, we demonstrated that intracellular CB levels
respond to the amount of their respective antigens, a phenomenon termed antigen-mediated chromobody sta-
bilization (AMCBS)30. Applying the ubiquitin fusion technique39,40 we previously generated ubiquitin-CB fusion
proteins (Ub-R-CBs). Co-translational cleavage of ubiquitin is employed to expose an N-terminal arginine
residue that—in agreement with the N-end rule—confers rapid turnover of non-antigen-bound C B30. Using
these turnover-accelerated Ub-R-CBs (Ub-R-CBs) we employed AMCBS to visualize and monitor fast revers-
ible changes in cellular antigen concentration upon compound treatment by quantitative live-cell imaging30.
Additionally, we established a protocol for site-directed integration of CB encoding sequences into the genomic
safe-harbor AAVS-1 locus of human cells using the CRISPR/Cas9 technology to generate stable cell lines dis-
playing a homogenous CB e xpression34. Here, we applied this approach to generate U2OS cells stably express-
ing a turnover-accelerated version of the PepCB (Ub-R-PepCB) and analyzed its performance to visualize and
quantify changes of Pep-tagged antigen levels by quantitative live-cell imaging.
Starting from a polyclonal pool of U2OS cells expressing the Ub-R-PepCB from the safe harbor locus we
performed monoclonal selection and PCR-based genotyping to identify and validate positive clones. For U2OS
Scientific Reports | (2020) 10:14267 | https://doi.org/10.1038/s41598-020-71091-x 7
Vol.:(0123456789)www.nature.com/scientificreports/
Figure 3. PepCB visualizes Pep-tagged proteins in living cells. PepCB with fluorescently tagged antigens:
Representative fluorescence images of living U2OS cells transiently expressing PepCB labeled either with eGFP
(GFP) or TagRFP (RFP) in combination with fluorescently tagged antigens: (A) PepGFP-tubulin, (B) mCherry-
VIMPep, or (C) GFP-PCNAPep (left panels) or the corresponding controls without PepTag (right panels). PepCB
with non-fluorescently tagged antigens: living U2OS (D–F) or HeLa cells (E) transiently co-expressing PepCB
(GFP, top) or PepCB (RFP, bottom) and non-fluorescently tagged (D) VIMPep, (E) PCNAPep, (F) Pepactin, (G)
PepMiro1. Nuclei were stained with Hoechst33258. Scale bar 50 µm.
clone E02 our data revealed an amplicon at the size of ~ 1,018 bps indicating a correct integration of the CB
transgene into the AAVS1 locus, which was further confirmed by a single amplicon at the size of ~ 4,346 bps,
suggesting a homologous integration of Ub-R-PepCB into the AAVS1 locus of the monoclonal U2OS cells (Sup-
plementary Fig. 3).
Scientific Reports | (2020) 10:14267 | https://doi.org/10.1038/s41598-020-71091-x 8
Vol:.(1234567890)www.nature.com/scientificreports/
Figure 4. Quantification of intracellular binding properties of the PepCB. (A) Fluorescence recovery after
photobleaching (FRAP) analysis of GFP-actin (upper row), actin-chromobody (actin-CB, middle row) and
PepCB (eGFP) in combination with Pepactin (lower row) transiently expressed in U2OS cells. Shown are
representative images at indicated time points before and after photobleaching of a defined region (white box).
Scale bar 10 µm. (B) Quantification of FRAP data showing mean values of fluorescence signal in photobleached
regions. Fluorescence was normalized to its intensity before bleaching. PepCB shows a recovery to 90.5 ± 25.6%
with a halftime of 1.1 s. actin-CB recovered to 90.4 ± 12.1% with a halftime of 2.0 s whereas the recovery of GFP-
actin amounted to 29.5 ± 12.2% with a half time of 20.3 s. n = 15, N = 1. Data are represented as mean ± stds.
To investigate whether the Ub-R-PepCB is stabilized in the presence of its antigen, we transiently transfected
CRISPR-engineered U2OS_E02 cells with PepGFP, PepGFP-NLS and GFP-PCNAPep. By comparing nuclear-local-
ized PepGFP and homogenous distributed PepGFP we additionally aimed to analyze the influence of these two
different cellular compartments on AMCBS. For quantitative analysis, we determined the average CB fluores-
cence signal within transfected cells in comparison to cells expressing the corresponding, non-tagged constructs.
Notably, in these cells we hardly detected any PepCB signal in line with a fast turnover of the stably expressed
Ub-R-PepCB (Fig. 6).
Upon transient transfection of PepGFP, we observed a stabilization of the Ub-R-PepCB exclusively in cells
expressing the antigen (Fig. 6A). Quantification of Ub-R-PepCB signal revealed a stabilization factor of ~ 2.6
(Fig. 6B). Expressing the nucleus-localized PepGFP-NLS cells not only showed greater GFP fluorescence com-
pared to cytosolic GFP but also a more pronounced stabilization of Ub-R-PepCB by ~ 5.3-fold (Fig. 6C, D). This
becomes even more evident when transiently transfecting nucleus-localized GFP-PCNAPep (Fig. 6E). Deduced
Scientific Reports | (2020) 10:14267 | https://doi.org/10.1038/s41598-020-71091-x 9
Vol.:(0123456789)www.nature.com/scientificreports/
Figure 5. PepCB visualizes distribution and reorganization of Pep-tagged proteins in living cells. (A) Time-
lapse microscopy of U2OS cells co-transfected with constructs encoding for PepCB (TagRFP) and GFP-
PCNAPep. Images were taken every hour, shown are representative images at indicated time points. Scale bar
50 µm. (B) U2OS cells expressing PepCB (TagRFP) and Pepactin. Immediately after starting the time series cells
were treated with 2 µM cytochalasin D (actin polymerization inhibitor) for 10 min. Subsequently, cytochalasin
D was removed and cells were continuously imaged for additional 30 min. Shown are representative
fluorescence images displaying chromobody signal at indicated time points. Scale bar 50 µm.
from the observable GFP signal this construct showed substantially higher expression rates compared to both
PepGFP or PepGFP-NLS. In parallel we observed a significantly brighter Ub-R-PepCB signal (Fig. 6E) and calcu-
lated a stabilization factor of ~ 78 (Fig. 6F).
In summary our data demonstrated that the stably expressed, turnover-accelerated Ub-R-PepCB is stabilized
in the presence of various Pep-tagged antigens. This is in accordance to previous findings of antigen-mediated
stabilization of intrabodies and chromobodies targeting endogenous epitopes30,41–43. While the precise molecu-
lar and structural mechanisms for this phenomenon remain to be elucidated, three potential explanations how
antigen-binding interferes with proteasomal degradation of the PepCB can be considered: (i) antigen-binding
interferes with N-terminal recognition and ubiquitination by E3 ubiquitin ligases of the PepCB; (ii) antigen-
binding conceals unstructured CDRs that might otherwise initiate d egradation44; (iii) antigen-binding reduces
diffusion of the PepCB and hence the frequency of proteasome encounter30. Besides the obvious dependency
of the extent of CB stabilization on the present amount of antigen, a nuclear localization of the antigen might
additionally contribute to the observed higher levels of PepCB observed for PepGFP and P CNAPep. Although
ubiquitin–proteasome systems (UPS) exist in both cytoplasm and nucleus, it is conceivable that individual steps
of the CB degradation procedure differ in rate and efficiency between UPS of different cellular compartments.
Summary and outlook
Epitope tagging is not only an effective way to facilitate expression and purification of recombinant proteins but
also a favored approach to study biogenesis, localization and molecular interactions of proteins of interest (PoIs)
when lacking well-defined and reproducible capture and/or detection reagents. In this context we and others have
developed nanobodies which on multiple occasions have proven to be valuable and versatile tools for applications
ranging from one-step purification to super-resolved imaging of proteins comprising a small peptide t ag26–28,35.
Here we build on previous work describing a nanobody in complex with a short helical peptide within the gp41
protein of H IV29 and designed numerous mammalian expression constructs displaying the minimal (12 AA)
epitope (PepTag) either on the C- or N-terminus. We demonstrated the capability of functionalized versions of
the nanobody (PepNb) for immunoprecipitation (IP) and direct immunofluorescence (IF) of Pep-tagged pro-
teins. Focusing on live-cell imaging, we generated intracellularly functional PepCB constructs and showed that
these PepCBs efficiently target and trace Pep-tagged antigens in living cells. Notably, neither the short PepTag
nor binding to the PepCB affects localization and dynamics of Pep-tagged proteins analyzed in different cellular
compartments which is likely due to a high-off rate as indicated from fast recovery rates measured by FRAP.
Finally, following up our recent findings on antigen-mediated chromobody s tabilization30,34 we showed for the
first time that a turnover-accelerated PepCB can be used as a broadly applicable generic biosensor to monitor
changes in cellular concentrations of antigens harboring a small and inert peptide tag simply by quantitative
Scientific Reports | (2020) 10:14267 | https://doi.org/10.1038/s41598-020-71091-x 10
Vol:.(1234567890)www.nature.com/scientificreports/
Figure 6. PepCB is stabilized in the presence of Pep-tagged antigens. (A) Fluorescence images of living U2OS E02 cells comprising
a homologous integration of the turnover-accelerated PepCB (Ub_R_PepCB) at the AAVS-1 locus upon transfection with PepGFP
(top) or eGFP as control (bottom). (B) Bar chart displaying normalized mean nuclear chromobody fluorescence detected in eGFP
or PepGFP expressing U2OS_E02 cells. Mean fluorescence was calculated from three samples (n = 3; > 200 cells) and normalized to
GFP-transfected cells (set to 1). (C) Fluorescence images of cells as described in (A) upon expression of PepGFP-NLS (top) or GFP-
NLS as control (bottom). (D) Bar chart displaying the normalized mean chromobody fluorescence detected in nuclei of GFP-NLS or
PepGFP-NLS expressing U2OS_E02 cells (n = 3; > 200 cells). Mean fluorescence was calculated from three samples (n = 3; > 200 cells)
and normalized to GFP-NLS expressing cells (set to 1). (E) Fluorescence images of cells as described in (A) upon expression of GFP-
PCNAPep (top) or GFP-PCNA (bottom). (F) Bar chart of normalized mean nuclear fluorescence of PepCB detected in GFP-PCNA or
GFP-PCNAPep expressing cells. Mean fluorescence was calculated from three samples (n = 3; > 200 cells) and normalized to GFP-
PCNA expressing cells (set to 1). (A, C, E) Shown are cells 24 h post transfection. For nuclear segmentation, cells were stained with
Hoechst33258. Scale bar: 50 µm. (B, D, F) Data are represented as mean ± stds. For statistical analysis student’s t-test was performed, *
p < 0.05.
Scientific Reports | (2020) 10:14267 | https://doi.org/10.1038/s41598-020-71091-x 11
Vol.:(0123456789)www.nature.com/scientificreports/
live-cell imaging. Moreover, applying gene editing approaches such as CRISPR/Cas9 the PepTag can be added
to endogenous PoIs. We conceive that the combination of visualizing and simultaneously monitoring changes
of endogenous protein levels using the turnover-accelerated PepCB will have benefits compared to studies using
overexpressed target proteins. In summary, the PepTag/PepCB tagging system described herein provides a highly
versatile and broadly applicable approach to study PoIs in different experimental settings.
Received: 8 June 2020; Accepted: 6 August 2020
References
1. Muyldermans, S. Nanobodies: Natural single-domain antibodies. Annu. Rev. Biochem. 82, 775–797 (2013).
2. Traenkle, B. & Rothbauer, U. Under the microscope: Single-domain antibodies for live-cell imaging and super-resolution micros-
copy. Front. Immunol. 8, 1030. https://doi.org/10.3389/fimmu.2017.01030 (2017).
3. Jobling, S. A. et al. Immunomodulation of enzyme function in plants by single-domain antibody fragments. Nat. Biotechnol. 21,
77–80. https://doi.org/10.1038/nbt772 (2003).
4. 4Moutel, S. et al. NaLi-H1: A universal synthetic library of humanized nanobodies providing highly functional antibodies and
intrabodies. Elife 5, https://doi.org/10.7554/eLife.16228 (2016).
5. Pellis, M. et al. A bacterial-two-hybrid selection system for one-step isolation of intracellularly functional nanobodies. Arch.
Biochem. Biophys. 526, 114–123. https://doi.org/10.1016/j.abb.2012.04.023 (2012).
6. Van Audenhove, I. et al. Mapping cytoskeletal protein function in cells by means of nanobodies. Cytoskeleton 70, 604–622. https
://doi.org/10.1002/cm.21122(2013).
7. Zolghadr, K., Gregor, J., Leonhardt, H. & Rothbauer, U. Case study on live cell apoptosis-assay using lamin-chromobody cell-lines
for high-content analysis. Methods Mol. Biol. 911, 569–575. https://doi.org/10.1007/978-1-61779-968-6_36 (2012).
8. Zolghadr, K. et al. A fluorescent two-hybrid assay for direct visualization of protein interactions in living cells. Mol. Cell. Proteomics
(MCP) 7, 2279–2287. https://doi.org/10.1074/mcp.M700548-MCP200 (2008).
9. Rothbauer, U. et al. Targeting and tracing antigens in live cells with fluorescent nanobodies. Nat. Methods 3, 887–889 (2006).
10. Helma, J. et al. Direct and dynamic detection of HIV-1 in living cells. PLoS ONE 7, e50026 (2012).
11. Fridy, P. C. et al. A robust pipeline for rapid production of versatile nanobody repertoires. Nat. Methods 11, 1253–1260. https://
doi.org/10.1038/nmeth.3170 (2014).
12. Jullien, D. et al. Chromatibody, a novel non-invasive molecular tool to explore and manipulate chromatin in living cells. J. Cell Sci.
129, 2673–2683. https://doi.org/10.1242/jcs.183103 (2016).
13. Li, T. et al. Camelid single-domain antibodies: A versatile tool for in vivo imaging of extracellular and intracellular brain targets.
J. Control. Release 243, 1–10 (2016).
14. Maier, J., Traenkle, B. & Rothbauer, U. Real-time analysis of epithelial-mesenchymal transition using fluorescent single-domain
antibodies. Sci. Rep. 5, 13402 (2015).
15. Traenkle, B. et al. Monitoring interactions and dynamics of endogenous beta-catenin with intracellular nanobodies in living cells.
Mol. Cell. Proteomics (MCP) 14, 707–723. https://doi.org/10.1074/mcp.M114.044016 (2015).
16. Rothbauer, U. et al. A versatile nanotrap for biochemical and functional studies with fluorescent fusion proteins. Mol. Cell Proteom-
ics 7, 282–289 (2008).
17. Schornack, S. et al. Protein mislocalization in plant cells using a GFP-binding chromobody. Plant J. 60, 744–754. https://doi.
org/10.1111/j.1365-313X.2009.03982.x (2009).
18. Caussinus, E., Kanca, O. & Affolter, M. Fluorescent fusion protein knockout mediated by anti-GFP nanobody. Nat. Struct. Mol.
Biol. 19, 117–121. https://doi.org/10.1038/nsmb.2180 (2012).
19. Shin, Y. J. et al. Nanobody-targeted E3-ubiquitin ligase complex degrades nuclear proteins. Sci. Rep. 5, 14269. https://doi.
org/10.1038/srep14269 (2015).
20. Kirchhofer, A. et al. Modulation of protein properties in living cells using nanobodies. Nat. Struct. Mol. Biol. 17, 133–138. https://
doi.org/10.1038/nsmb.1727 (2010).
21. Snapp, E. L. Fluorescent proteins: A cell biologist’s user guide. Trends Cell Biol. 19, 649–655 (2009).
22. Stadler, C. et al. Immunofluorescence and fluorescent-protein tagging show high correlation for protein localization in mammalian
cells. Nat. Methods 10, 315–323 (2013).
23. De Genst, E. et al. Molecular basis for the preferential cleft recognition by dromedary heavy-chain antibodies. Proc. Natl. Acad.
Sci. U.S.A. 103, 4586–4591. https://doi.org/10.1073/pnas.0505379103 (2006).
24. Nunes-Silva, S. et al. Llama immunization with full-length VAR2CSA generates cross-reactive and inhibitory single-domain
antibodies against the DBL1X domain. Sci. Rep. 4, 7373. https://doi.org/10.1038/srep07373 (2014).
25. Pardon, E. et al. A general protocol for the generation of Nanobodies for structural biology. Nat. Protoc. 9, 674–693. https://doi.
org/10.1038/nprot.2014.039 (2014).
26. De Genst, E. J. et al. Structure and properties of a complex of alpha-synuclein and a single-domain camelid antibody. J. Mol. Biol.
402, 326–343. https://doi.org/10.1016/j.jmb.2010.07.001 (2010).
27. 27Braun, M. B. et al. Peptides in headlock—A novel high-affinity and versatile peptide-binding nanobody for proteomics and
microscopy. Sci. Rep. 6 (2016).
28. Gotzke, H. et al. The ALFA-tag is a highly versatile tool for nanobody-based bioscience applications. Nat. Commun. 10, 4403. https
://doi.org/10.1038/s41467-019-12301-7 (2019).
29. 29Strokappe, N. M. et al. Super potent bispecific llama VHH antibodies neutralize HIV via a combination of gp41 and gp120
epitopes. Antibodies (Basel) 8, https://doi.org/10.3390/antib8020038 (2019).
30. Keller, B. M. et al. Chromobodies to quantify changes of endogenous protein concentration in living cells. Mol. Cell. Proteomics
(MCP) 17, 2518–2533. https://doi.org/10.1074/mcp.TIR118.000914 (2018).
31. 31Arbabi Ghahroudi, M., Desmyter, A., Wyns, L., Hamers, R. & Muyldermans, S. Selection and identification of single domain
antibody fragments from camel heavy-chain antibodies. FEBS J 414, 521–526, https://doi.org/10.1016/s0014-5793(97)01062-4
(1997).
32. Rothbauer, U. et al. A versatile nanotrap for biochemical and functional studies with fluorescent fusion proteins. Mol. Cell. Prot-
eomics (MCP) 7, 282–289. https://doi.org/10.1074/mcp.M700342-MCP200 (2008).
33. Panza, P., Maier, J., Schmees, C., Rothbauer, U. & Sollner, C. Live imaging of endogenous protein dynamics in zebrafish using
chromobodies. Development 142, 1879–1884. https://doi.org/10.1242/dev.118943 (2015).
34. 34Keller, B. M. et al. A strategy to optimize the generation of stable chromobody cell lines for visualization and quantification of
endogenous proteins in living cells. Antibodies (Basel) 8, https://doi.org/10.3390/antib8010010 (2019).
35. Virant, D. et al. A peptide tag-specific nanobody enables high-quality labeling for dSTORM imaging. Nat. Commun. 9, 930. https
://doi.org/10.1038/s41467-018-03191-2 (2018).
Scientific Reports | (2020) 10:14267 | https://doi.org/10.1038/s41598-020-71091-x 12
Vol:.(1234567890)www.nature.com/scientificreports/
36. Leonhardt, H. et al. Dynamics of DNA replication factories in living cells. J. Cell Biol. 149, 271–280 (2000).
37. Tsukamoto, T. et al. Visualization of gene activity in living cells. Nat. Cell Biol. 2, 871–878. https: //doi.org/10.1038/350465 10 (2000).
38. Massa, S. et al. Sortase A-mediated site-specific labeling of camelid single-domain antibody-fragments: A versatile strategy for
multiple molecular imaging modalities. Contrast Media Mol. Imaging 11, 328–339 (2016).
39. Varshavsky, A. Ubiquitin fusion technique and related methods. Methods Enzymol. 399, 777–799. https://doi.org/10.1016/S0076
-6879(05)99051-4 (2005).
40. Varshavsky, A. The N-end rule pathway and regulation by proteolysis. Protein Sci. 20, 1298–1345. https://doi.org/10.1002/pro.666
(2011).
41. Sibler, A. P., Courtete, J., Muller, C. D., Zeder-Lutz, G. & Weiss, E. Extended half-life upon binding of destabilized intrabodies
allows specific detection of antigen in mammalian cells. FEBS J. 272, 2878–2891. https://doi.org/10.1111/j.1742-4658.2005.04709
.x (2005).
42. 42Blanco-Toribio, A., Muyldermans, S., Frankel, G. & Fernandez, L. A. Direct injection of functional single-domain antibodies
from E. coli into human cells. PloS one 5, e15227, https://doi.org/10.1371/journal.pone.0015227 (2010).
43. 43Tang, J. C. et al. Detection and manipulation of live antigen-expressing cells using conditionally stable nanobodies. Elife 5, https
://doi.org/10.7554/eLife.15312 (2016).
44. Prakash, S., Tian, L., Ratliff, K. S., Lehotzky, R. E. & Matouschek, A. An unstructured initiation site is required for efficient
proteasome-mediated degradation. Nat. Struct. Mol. Biol. 11, 830–837. https://doi.org/10.1038/nsmb814 (2004).
Acknowledgements
This research was supported by the German Research Foundation (DFG) through RTG 2364 "MOMbrane" to
U.R. and F.O.F. The authors also gratefully acknowledge the Ministry of Science, Research and Arts of Baden-
Württemberg (V.1.4.-H3-1403-74) for financial support. We acknowlegde support by Open Access Publishing
Fund of University of Tuebingen.
Author contributions
B.T. and U.R. conceived the study. B.T., S.S., F.O.F., P.D.K. and U.R. performed all experiments. B.T., S.S. and U.R.
analyzed the data. B.T., S.S. and U.R. wrote the manuscript.
Funding
Open Access funding provided by Projekt DEAL.
Competing interests
U.R. is shareholder of the commercial company ChromoTek GmbH. Rest of the authors does not have any
competing interest.
Additional information
Supplementary information is available for this paper at https://doi.org/10.1038/s41598-020-71091-x.
Correspondence and requests for materials should be addressed to U.R.
Reprints and permissions information is available at www.nature.com/reprints.
Publisher’s note Springer Nature remains neutral with regard to jurisdictional claims in published maps and
institutional affiliations.
Open Access This article is licensed under a Creative Commons Attribution 4.0 International
License, which permits use, sharing, adaptation, distribution and reproduction in any medium or
format, as long as you give appropriate credit to the original author(s) and the source, provide a link to the
Creative Commons license, and indicate if changes were made. The images or other third party material in this
article are included in the article’s Creative Commons license, unless indicated otherwise in a credit line to the
material. If material is not included in the article’s Creative Commons license and your intended use is not
permitted by statutory regulation or exceeds the permitted use, you will need to obtain permission directly from
the copyright holder. To view a copy of this license, visit http://creativecommons.org/licenses/by/4.0/.
© The Author(s) 2020
Scientific Reports | (2020) 10:14267 | https://doi.org/10.1038/s41598-020-71091-x 13
Vol.:(0123456789)You can also read