DRP1 IS REQUIRED FOR AGRP NEURONAL ACTIVITY AND FEEDING - ELIFE
←
→
Page content transcription
If your browser does not render page correctly, please read the page content below
RESEARCH ARTICLE

                                        Drp1 is required for AgRP neuronal
                                        activity and feeding
                                        Sungho Jin1, Nal Ae Yoon1, Zhong-Wu Liu2,3, Jae Eun Song2,3, Tamas L Horvath2,3,
                                        Jung Dae Kim1, Sabrina Diano1,4,5*
                                        1
                                         Institute of Human Nutrition, Columbia University Irving Medical Center, New
                                        York, United States; 2Department of Comparative Medicine, Yale University School
                                        of Medicine, New Haven, United States; 3Program in Integrative Cell Signaling and
                                        Neurobiology of Metabolism, Yale University School of Medicine, New Haven,
                                        United States; 4Department of Molecular Pharmacology and Therapeutics, Columbia
                                        University Irving Medical Center, New York, United States; 5Department of Cellular
                                        and Molecular Physiology, Yale University School of Medicine, New Haven, United
                                        States

                                        Abstract The hypothalamic orexigenic Agouti-related peptide (AgRP)-expressing neurons are
                                        crucial for the regulation of whole-body energy homeostasis. Here, we show that fasting-induced
                                        AgRP neuronal activation is associated with dynamin-related peptide 1 (DRP1)-mediated
                                        mitochondrial fission and mitochondrial fatty acid utilization in AgRP neurons. In line with this, mice
                                        lacking Dnm1l in adult AgRP neurons (Drp1 cKO) show decreased fasting- or ghrelin-induced AgRP
                                        neuronal activity and feeding and exhibited a significant decrease in body weight, fat mass, and
                                        feeding accompanied by a significant increase in energy expenditure. In support of the role for
                                        mitochondrial fission and fatty acids oxidation, Drp1 cKO mice showed attenuated palmitic acid-
                                        induced mitochondrial respiration. Altogether, our data revealed that mitochondrial dynamics and
                                        fatty acids oxidation in hypothalamic AgRP neurons is a critical mechanism for AgRP neuronal
                                        function and body-weight regulation.
*For correspondence:
sabrina.diano@columbia.edu

Competing interests: The                Introduction
authors declare that no
                                        The central nervous system (CNS) regulates whole-body energy metabolism through multiple neuro-
competing interests exist.
                                        nal networks (Diano, 2013; Myers and Olson, 2012). The hypothalamus has been considered a key
Funding: See page 22                    area of the brain in regulating metabolism via the ability of hypothalamic neurons to sense, inte-
Received: 26 October 2020               grate, and respond to fluctuating metabolic signals (Coll and Yeo, 2013; Sandoval et al., 2009).
Accepted: 27 February 2021              The hypothalamic arcuate nucleus (ARC) contains two distinct neuronal subpopulations that produce
Published: 09 March 2021                either orexigenic neuropeptides agouti-related peptide (AgRP) and neuropeptide-Y (NPY), or
                                        anorexigenic neuropeptides including alpha-melanocyte stimulating hormone (a-MSH) derived from
Reviewing editor: Richard D
                                        proopiomelanocortin (POMC) (Batterham et al., 2002; Ollmann et al., 1997; Roh et al., 2016). The
Palmiter, Howard Hughes
Medical Institute, University of
                                        anatomical location of the hypothalamic ARC allows these neurons to rapidly respond to fluctuations
Washington, United States               of numerous circulating metabolic signals, including nutrients and hormones (Gao and Horvath,
                                        2007). However, the intracellular mechanisms underlying their ability to sense circulating signals,
    Copyright Jin et al. This article
                                        and, specifically nutrients, remain to be elucidated.
is distributed under the terms of
                                           Mitochondria are the main powerhouse of the cell by producing adenosine triphosphate (ATP)
the Creative Commons
Attribution License, which              (Mattson et al., 2008; Picard et al., 2016). Neurons rely on mitochondrial electron transport chain
permits unrestricted use and            and oxidative phosphorylation to meet their high energy demands (Bélanger et al., 2011). In addi-
redistribution provided that the        tion, mitochondria are highly dynamic organelles able to change their morphology and location
original author and source are          according to the needs of the cell (Chan, 2006). The ability of mitochondria to change their morpho-
credited.                               logical characteristics in response to the metabolic state to match with the needs of the cells occurs

Jin et al. eLife 2021;10:e64351. DOI: https://doi.org/10.7554/eLife.64351                                                                1 of 24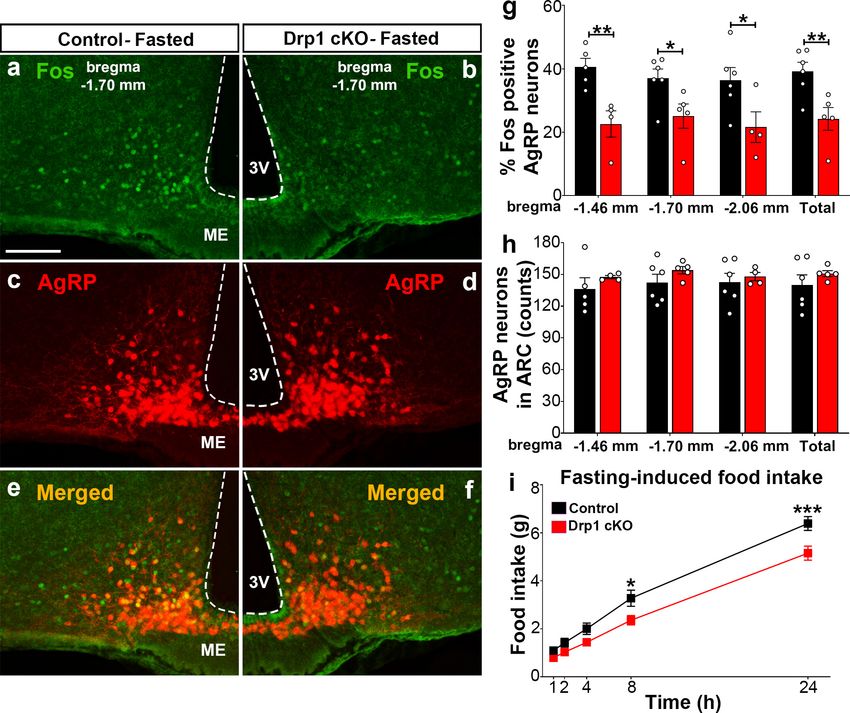
Research article Neuroscience
through fusion and fission events, process defined as mitochondrial dynamics. Mitochondrial mor-
phological changes are associated with several proteins, including mitofusin 1 and 2 (MFN1 and
MFN2) in the mitochondrial outer membrane and optic atrophy-1 (OPA1) in the mitochondrial inner
membrane for mitochondrial fusion (Kasahara and Scorrano, 2014; Youle and van der Bliek,
2012), whereas mitochondrial fission is regulated by the activity of the dynamin-related protein 1
(DRP1, a mechanochemical protein encoded by the Dnm1l gene), which is recruited to the mitochon-
drial outer membrane to interact with mitochondrial fission factor (Mff) and mitochondrial fission 1
(Fis1) (Losón et al., 2013).
Previous studies from our laboratory have shown that NPY/AgRP neuronal activation is associated
with changes in mitochondrial morphology and density during fasting or after ghrelin administration
(Andrews et al., 2008; Coppola et al., 2007; Dietrich et al., 2013), suggesting that changes in
mitochondrial dynamics play a role in the regulation of neuronal activation of these neurons
(Nasrallah and Horvath, 2014). In addition, we found that high-fat-diet-induced inactivation of
NPY/AgRP neurons is associated with mitochondrial dynamics leaning towards mitochondrial fusion
in this neuronal population (Dietrich et al., 2013). In the present study we interrogated the rele-
vance of mitochondrial fission in AgRP neurons in relation to fuel availability.
Results
Fasting induces mitochondrial fission in AgRP neurons
Recent studies have demonstrated that hypothalamic mitochondrial dynamics play a critical role in
regulating nutrient sensing (Dietrich et al., 2013; Santoro et al., 2017; Schneeberger et al., 2013;
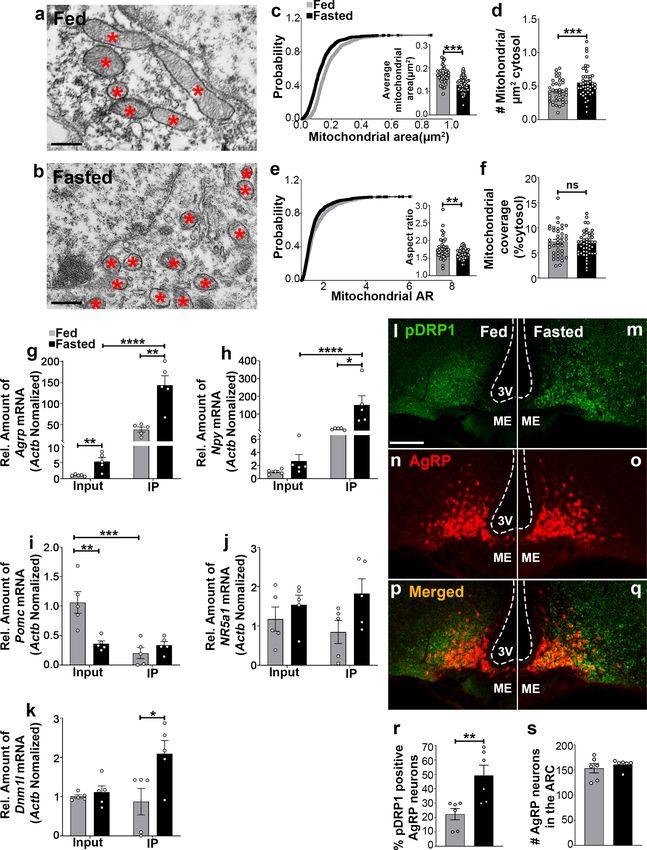
Toda et al., 2016). Using electron microscopy, we observed that compared to feeding
(0.174 ± 0.007 mm2, p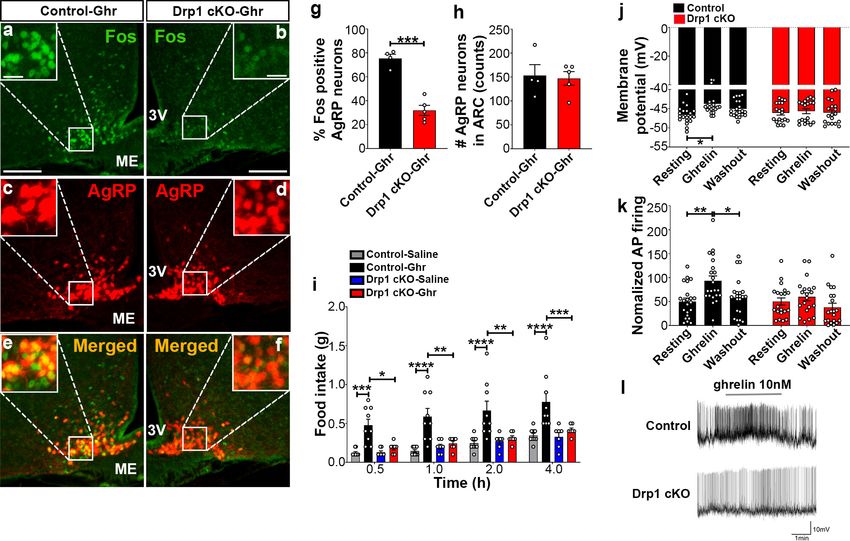
Research article                                                                                                                 Neuroscience

Figure 1. Fasting induces mitochondrial fission and activation of DRP1 in AgRP neurons. (a and b) Representative electron micrographs showing
mitochondria (asterisks) in an AgRP neuron of 5-month-old fed (a) and the fasted male mouse (b). Scale bar represents 500 nm. (c–f) Cumulative
probability distribution of cross-sectional mitochondria area and average mitochondrial area (c), mitochondrial density (d), aspect ratio and a cumulative
probability distribution of mitochondrial aspect ratio (e), and mitochondrial coverage (f) in AgRP neurons from fed and fasted male mice (fed mice,
Figure 1 continued on next page

Jin et al. eLife 2021;10:e64351. DOI: https://doi.org/10.7554/eLife.64351                                                                          3 of 24
Research article                                                                                                              Neuroscience

Figure 1 continued
n = 779 mitochondria/39 AgRP neurons/4 mice; fasted mice, n = 1559 mitochondria/47 AgRP neurons/6 mice). Data are presented as mean ± SEM.
**p
Research article                                                                                                           Neuroscience

Figure 2. Fasting-induced b-oxidation in the hypothalamic neurons. (a) Graphs showing oxygen consumption rate (OCR) under 2.5 mM glucose
incubation with or without palmitate-BSA (200 mM) and with or without etomoxir (40 mM) in primary hypothalamic neuronal culture (n = 6–8/group) from
Dnm1l+/+-AgrpCre:ERT2; tdTomato mice. Cultures were treated with tamoxifen (TMX). (b) Graph showing the quantification of OCR showed in panel (a) in
primary hypothalamic neuronal culture. Data are presented as mean ± SEM. *p
Research article                                                                                                           Neuroscience

Figure 2 continued
hoc analysis for multiple comparisons. (c) Graphs showing OCR under low glucose (0.5 mM) with or without palmitate-BSA (200 mM) and with or without
etomoxir (40 mM) in primary hypothalamic neuronal culture (n = 6–8/group). (d) Graph showing the quantification of OCR shown in panel c in primary
hypothalamic neuronal culture. Data are presented as mean ± SEM. ***p
Research article                                                                                                             Neuroscience

Figure 3. Deletion of Dnm1l in AgRP neurons affects fasting-induced mitochondrial fission and mitochondrial respiration. (a and b) Representative
electron micrographs showing mitochondria (asterisks) in an AgRP neuron of the 5-month-old fed Drp1 cKO (a) and the fasted Drp1 cKO male mice (b).
Scale bar represents 500 nm. (c–f) Cumulative probability distribution of cross-sectional mitochondria area and average mitochondrial area (c),
mitochondrial density (d), aspect ratio and a cumulative probability distribution of mitochondrial aspect ratio (e), and mitochondrial coverage (f) in
Figure 3 continued on next page

Jin et al. eLife 2021;10:e64351. DOI: https://doi.org/10.7554/eLife.64351                                                                      7 of 24
Research article Neuroscience
Figure 3 continued
AgRP neurons from fed Drp1 cKO (n = 720 mitochondria/32 AgRP neurons/4 mice) and fasted Drp1 cKO male mice (n = 746 mitochondria/35 AgRP
neurons/4 mice). Data are presented as mean ± SEM. Two-tailed Student’s t-test was used for statistical significance. ns = not significant. (g and h)
Graphs showing OCR (g) and its quantification (h) under 2.5 mM glucose incubation with or without palmitate-BSA (200 mM) and with or without
etomoxir (40 mM) in primary hypothalamic neuronal culture of control (Dnm1lfl/fl; AgrpCre:ERT2; tdTomato treated with vehicle) and Drp1 cKO mice
(n = 6–8/group). Data are presented as mean ± SEM. Two-way ANOVA with Tukey’s post hoc analysis for multiple comparisons was used for statistical
significance. (i and j) Graphs showing OCR (i) and its quantification (j) under low glucose (0.5 mM) incubation with or without palmitate-BSA (200 mM)
and with or without etomoxir (40 mM) in primary hypothalamic neuronal culture of control (Dnm1lfl/fl; AgrpCre:ERT2; tdTomato treated with vehicle) and
Drp1 cKO mice (n = 6–8/group). Data are presented as mean ± SEM. Two-way ANOVA with Tukey’s post hoc analysis for multiple comparisons was
used for statistical significance.
The online version of this article includes the following source data and figure supplement(s) for figure 3:
Source data 1. Deletion of Dnm1l in AgRP neurons affects fasting-induced mitochondrial fission and mitochondrial respiration.
Figure supplement 1. Generation of AgRP neurons-specific Dnm1l deleted mice.
Figure supplement 1—source data 1. Generation of AgRP neuron-specific Dnm1l-deleted mice.
Figure supplement 2. Percentage of tdTomato-expressing AgRP neurons and cell viability and Dnm1l deletion induced by 4-hydroxytamoxifen in
hypothalamic neuronal cell cultures.
Figure supplement 2—source data 1. Source data for Figure 3—figure supplement 2.
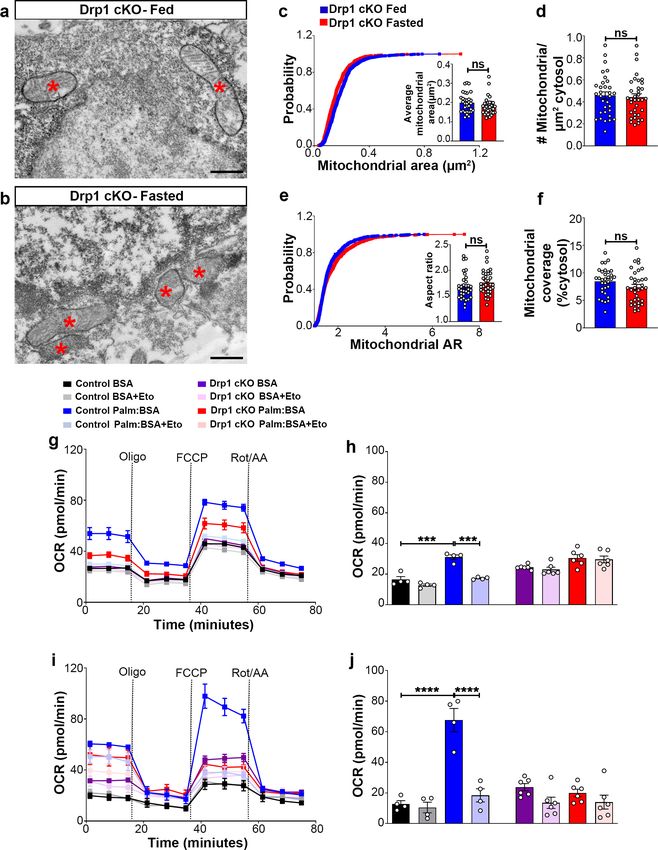
in PA-induced maximal oxygen consumption rate was observed in high (2.5 mM) (Figure 3g,h) or
low glucose (0.5 mM) (Figure 3i,j). In addition, no effects induced by etomoxir incubation were
observed in primary hypothalamic neurons derived from Drp1 cKO mice (Figure 3g–j), indicating
that DRP1 in the hypothalamic AgRP neurons plays an essential role in regulating PA-induced mito-
chondrial respiration.
Inducible and selective deletion of Dnm1l in AgRP neurons decreases
neuronal activation and projection of AgRP neurons in the
hypothalamus
To assess the effect of Dnm1l deletion on AgRP neuronal activation, we then performed and ana-
lyzed immunostaining for Fos in the hypothalamic arcuate nucleus of Drp1 cKO male mice and con-
trols in fasting state (Figure 4a–f; Figure 4—figure supplement 1). Compared to fasted controls
(bregma 1.70 mm: 37.0 ± 2.95% of AgRP neurons, n = 6, Figure 4a,c,e,g; bregma 1.46 mm: 40.6
± 2.71% of AgRP neurons, n = 5, Figure 4g, Figure 4—figure supplement 1a–c; bregma 2.06
mm: 36.4 ± 3.97% of AgRP neurons, n = 6; total 39.14 ± 2.925% of AgRP neurons, n = 6, Figure 4g,
Figure 4—figure supplement 1g–i), fasted Drp1 cKO male mice showed a significant decrease in
immunoreactivity for Fos in AgRP neurons (bregma 1.70 mm: 25.1 ± 3.83% of AgRP neurons,
n = 5, p=0.0336, Figure 4b,d,f,g; bregma 1.46 mm: 22.6 ± 4.15% of AgRP neurons, n = 4,
p=0.0069, Figure 4g, Figure 4—figure supplement 1d–f; bregma 2.06 mm: 21.6 ± 4.82% of
AgRP neurons, n = 4, p=0.0455; total, 24.2 ± 3.58% of AgRP neurons, n = 6, p=0.0097, Figure 4g,
Figure 4—figure supplement 1j–l). No changes in AgRP cell number were observed between con-
trol (bregma 1.46 mm, 136.2 ± 10.71 counts, n = 5; bregma 1.70 mm, 142.3 ± 7.89 counts, n = 6;
bregma 2.06 mm, 142.7 ± 8.841 counts, n = 6) and Drp1 cKO male mice (bregma 1.46 mm,
147.5 ± 1.50 counts, n = 4, p=0.3858; bregma 1.70 mm, 154.0 ± 3.48 counts, n = 5, p=0.2397;
bregma 2.06 mm, 148.0 ± 3.89 counts, n = 4, p=0.6395; total, 150.833 ± 2.753 counts, n = 5,
p=0.3467, Figure 4h). In agreement with reduced AgRP neuronal activation, a significant reduction
in overnight fasting-induced food intake was observed in Drp1 cKO mice (5.155 ± 0.294 g, n = 11,
p=0.005) compared to controls (6.391 ± 0.290 g, n = 11, Figure 4i).
Furthermore, we analyzed AgRP immunoreactive fibers in one of the major target areas of the
hypothalamus, the PVN, of fasted Drp1 cKO male mice and controls. We observed that compared
to controls, a significant decrease in the PVN AgRP fluorescent intensity (bregma 0.70 mm:
control = 1.000 ± 0.1175, n = 4; Drp1 cKO mice = 0.4372 ± 0.0864, n = 4, p=0.0084, Figure 5a–c;
bregma 0.82 mm: control = 1.000 ± 0.03906, n = 4; Drp1 cKO mice = 0.3182 ± 0.032222, n = 4,
pResearch article Neuroscience Figure 4. Dnm1l deficiency in AgRP neurons affects neuronal activation of the hypothalamic AgRP neurons. (a–f) Immunostaining for Fos (green, a and b) and tdTomato (red, representing AgRP, c and d) and merged (e and f) in the hypothalamic ARC (bregma 1.70 mm) of a fasted male control (a, c, and e) and a Drp1 cKO mouse (b, d, and f) at 5 months of age. (g) Graph showing the percentage of Fos-positive AgRP neurons in the three bregma coordinates (bregma 1.46 mm, 1.70 mm, and 2.06 mm) corresponding to anterior, medial, and posterior ARC of fasted control (n = 5–6 mice) and Drp1 cKO male mice (n = 4–5 mice) at 5 months of age. Data are presented as mean ± SEM. *p
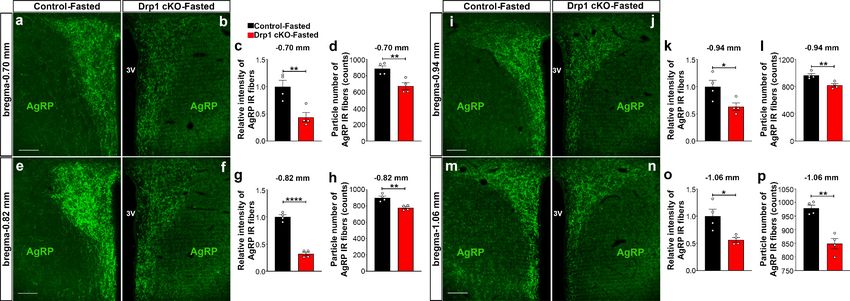
Research article                                                                                                                Neuroscience

Figure 5. AgRP-selective Dnm1l deficiency affects AgRP projections within the hypothalamic PVN. (a and b) Immunostaining for AgRP (green) in the
PVN (bregma 0.70 mm) of a fasted male control (a) and a fasted Drp1 cKO mouse (b) at 5 months of age. (c and d) Graphs showing the quantification
of relative intensity (c) and particle number (d) of AgRP fibers in the PVN (bregma 0.70 mm) of fasted male control and Drp1 cKO male mice (n = 4
mice). (e and f) Immunostaining for AgRP (green) in the PVN (bregma 0.82 mm) of a fasted male control (e) and a fasted Drp1 cKO mouse (f). (g and h)
Graphs showing the quantification of relative intensity (g) and particle number (h) of AgRP fibers in the PVN (bregma 0.82 mm) of fasted male control
and Drp1 cKO male mice (n = 4 mice). (i and j) Immunostaining for AgRP (green) in the PVN (bregma 0.94 mm) of a fasted male control (i) and a
fasted Drp1 cKO mouse (j). (k and l) Graphs showing the quantification of relative intensity (k) and particle number (l) of AgRP fibers in the PVN (bregma
  0.94 mm) of fasted male control and Drp1 cKO male mice (n = 4 mice). (m and n) Immunostaining for AgRP in the PVN (bregma 1.06 mm) of a
fasted control (m) and a fasted Drp1 cKO mouse (n). (o and p) Graphs showing the quantification of relative intensity (o) and particle number (p) of
AgRP fibers in the PVN (bregma 1.06 mm) of fasted control and Drp1 cKO male mice (n = 4 mice). Scale bar represents 100 mm (a, e, i, and m). All
data are presented as mean ± SEM. *p
Research article                                                                                                Neuroscience

                                    figure supplement 1k) and particle number (control = 157.625 ± 13.488 counts, n = 4; Drp1 cKO
                                    mice = 393.400 ± 19.290 counts, n = 5, p
Research article Neuroscience
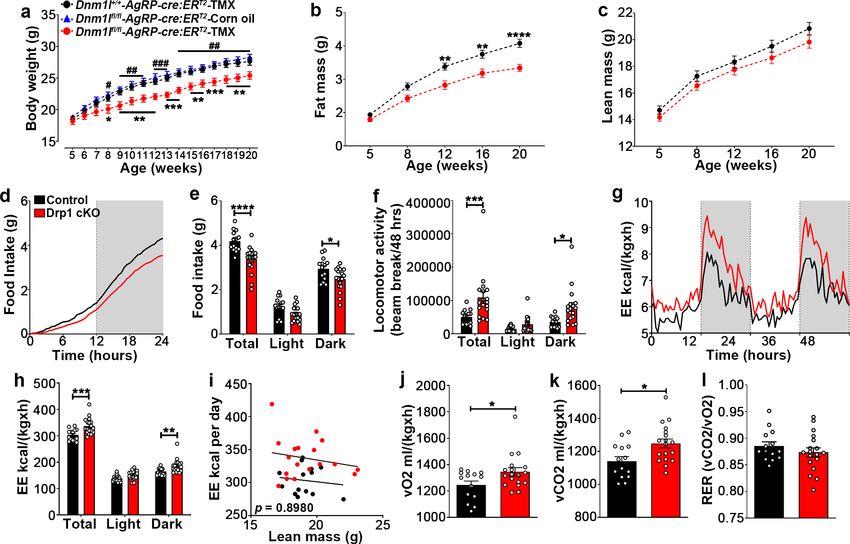
Figure 6. Deletion of Dnm1l in AgRP neurons affects metabolic phenotype in male mice. (a) Graph showing body weight of Dnm1l+/+; AgrpCre:ERT2
mice injected with tamoxifen (n = 18 mice), Dnm1lfl/fl; AgrpCre:ERT2 mice injected with corn oil (n = 10 mice) as control groups, and Dnm1lfl/fl; AgrpCre:
ERT2
mice injected with tamoxifen (n = 17 mice). Data are presented as mean ± SEM. *pResearch article Neuroscience
Deletion of Dnm1l in AgRP neurons results in increased brown adipose
tissue thermogenesis
BAT thermogenesis is a critical component of the homeostatic energy balance to maintain body tem-
perature (Morrison and Madden, 2014). We then examined whether deletion of Dnm1l in AgRP
neurons affects body temperature. We found that BAT temperature was significantly increased in
Drp1 cKO mice compared to control mice (control = 33.388 ± 0.223˚C, n = 8; Drp1 cKO
mice = 35.038 ± 0.318˚C, n = 8, p=0.0008, Figure 6—figure supplement 2a–c). Rectal temperature
was also significantly increased in Drp1 cKO mice (37.300 ± 0.105˚C, n = 8) compared to controls
(36.654 ± 0.226˚C, n = 8; p=0.0283, Figure 6—figure supplement 2d). Similar to males, the rectal
temperature of female Drp1 cKO mice (37.181 ± 0.085˚C, n = 7) was significantly greater than that
of female controls (36.652 ± 0.142˚C, n = 9; p=0.0102; Figure 6—figure supplement 2e).
Ghrelin-induced hyperphagia and AgRP activation are dependent on
DRP1
Ghrelin, a gut-derived hormone secreted during food deprivation, promotes feeding behavior
through NPY/AgRP neurons (Andrews et al., 2008). We found a significant decrease in Fos immu-
noreactivity in AgRP neurons of ghrelin-treated Drp1 cKO mice (30.22 ± 4.652% of AgRP neurons,
n = 5, p=0.0001) compared to controls (75.35 ± 3.464% of AgRP neurons, n = 4, Figure 7a–g). No
difference in the number of AgRP neurons in the ARC was observed between the two groups
(Figure 7h). In agreement with that, ghrelin-induced hyperphagia was not observed in Drp1 cKO
mice compared to controls (Figure 7i). Next, we performed patch-clamp whole-cell electrophysio-
logical recordings in slices from Drp1 cKO mice and controls. Consistent with the Fos results, ghrelin
significantly increased membrane potential (resting = 46.644 ± 0.502 mV, n = 20;
ghrelin = 43.757 ± 0.678 mV, n = 20, p=0.0102; Figure 7j,l) and relative firing activity
(resting = 100.000 ± 14.584, n = 22; ghrelin = 186.894 ± 20.266, n = 22, p=0.0041; Figure 7k,l) of
AgRP neurons in control mice, while ghrelin-induced excitation of AgRP neurons was significantly
attenuated in Drp1 cKO mice compared to controls (membrane potential, resting = 46.104 ± 0.577
mV, n = 19; ghrelin = 45.677 ± 0.644 mV, n = 19, p=0.9962, Figure 7j,l; relative firing activity,
resting = 100.000 ± 15.106, n = 20; ghrelin = 119.985 ± 16.502, n = 20, p=0.9644, Figure 7k,l). Of
note, no differences in the total (Figure 7—figure supplement 1a) and active form of ghrelin levels
(Figure 7—figure supplement 1b) were observed between male control and Drp1 cKO mice in
either fed or fasted states. Together, these data suggest that DRP1-mediated mitochondrial fission
plays a critical role in regulating ghrelin-triggered AgRP neuronal activity and hyperphagia.
Discussion
Our findings revealed a crucial role of mitochondrial fission in AgRP neurons in the regulation of
hypothalamic feeding control. First, we found that activated AgRP neurons have decreased mito-
chondrial size accompanied by an increase in mitochondria number suggesting a mitochondrial fis-
sion process. In agreement with this, we found that Dnm1l mRNA levels and DRP1 activation
(Liesa et al., 2009) are significantly increased in AgRP neurons of fasted mice compared to fed
mice. These data were associated with a significant increase in FA-induced mitochondrial respiration
in primary hypothalamic neuronal cells when low glucose levels (similar to fasting) were present com-
pared to higher glucose levels. To determine the physiological relevance of mitochondrial fission in
AgRP neurons, we generated a mouse model for conditional deletion of Dnm1l in AgRP neurons
(Drp1 cKO mice). We found that Drp1 cKO mice, in which fasting did not induce mitochondrial fis-
sion and changes in mitochondrial function, had significant decreases in body weight, composition,
and feeding that were accompanied by increases in locomotion and energy expenditure. Finally,
Drp1 cKO mice also showed attenuated ghrelin-induced hyperphagia and neuronal activity of AgRP
neurons. Altogether, these data revealed that DRP1-driven mitochondrial fission in AgRP neurons is
an adaptive process enabling these neurons to respond to the changing metabolic environment.
Mitochondria are energy-producing organelles fundamental in support of cellular functions. Mito-
chondria are highly dynamic organelles able not only to move within the cell to sites where their
function is required, but also to fuse (mitochondrial fusion) and divide (mitochondrial fission) in order
to maintain proper cellular function.
Jin et al. eLife 2021;10:e64351. DOI: https://doi.org/10.7554/eLife.64351 13 of 24Research article Neuroscience Figure 7. Deletion of Dnm1l in AgRP neurons attenuates ghrelin-induced neuronal activation and feeding. (a–f) Immunostaining for Fos (green, a and b) and tdTomato (red, representing AgRP, c and d) and merged (e and f) in the ARC of a ghrelin-injected male control (a, c, and e) and a Drp1 cKO mouse (b, d, and f) at 5 months of age. (g) Graph showing the percentage of Fos expression in AgRP neurons of ghrelin-injected control and Drp1 cKO mice (n = 4–5 mice). Data are presented as mean ± SEM. ***p
Research article                                                                                                       Neuroscience

                                      hypothalamic neurons with palmitic acid induced a significant increase in mitochondrial respiration
                                      when glucose levels were low, mimicking fasting. Fasting induced increased AgRP neuronal activa-
                                      tion and increased mitochondrial fission. However, when DRP1-induced mitochondrial fission in
                                      AgRP neurons was abolished, palmitic acid-induced mitochondrial respiration was diminished. In
                                      association with these, ghrelin-triggered changes in membrane potential and firing frequency of
                                      AgRP neurons were significantly attenuated in Drp1 cKO mice, leading to failure in inducing hyper-
                                      phagia. In line with our results, Dietrich et al., 2013 have shown that in mice with AgRP-selective
                                      deletion of Mfn1 and Mfn2, mediators of mitochondrial fusion process, neuronal firing frequency
                                      was impaired in diet-induced obesity mice. The impairment of AgRP neuronal activation was
                                      reversed by increasing intracellular ATP levels (Dietrich et al., 2013), indicating that the impaired
                                      AgRP neuronal firing frequency is likely due to low intracellular ATP levels. In addition to these func-
                                      tions, changes in shape and size of mitochondria may also affect the ability of a cell to distribute its
                                      mitochondrial population to specific subcellular locations. This function is especially important in
                                      highly polarized cells, such as neurons. Future studies assessing mitochondrial dynamics with
                                      changes in mitochondrial subcellular distribution will address this point.
                                         In addition to mitochondria, DRP1 has been also shown to enable peroxisomal fission. Peroxi-
                                      somes are single-membrane organelles that similar to mitochondria catalyze the breakdown of long
                                      chain fatty acids through beta-oxidation and regulate the maintenance of redox homeostasis
                                      (Smith and Aitchison, 2013). Because of these shared properties and metabolic pathways, we can-
                                      not exclude a possible involvement of peroxisomes in the phenotype observed in our mice. Further
                                      studies are warranted to address this issue.
                                         Overall, our data unmask that mitochondrial fission in hypothalamic AgRP neurons is a fundamen-
                                      tal mechanism that allows these neurons to sense and respond to changes in circulating signals,
                                      including hormones such as ghrelin and nutrients such as glucose and palmitic acid, in the regulation
                                      of feeding and energy metabolism.

                                      Materials and methods
Key resources table
Reagent type
(species) or resource         Designation                    Source or reference         Identifiers               Additional information
Strain, strain background     AgrpCre:ERT2                   Wang et al., 2013
(M. musculus)
Strain, strain background     Ai14(Rosa-CAG-LSL-tdTmoato)    The Jackson Laboratory      Stock No: #007914
(M. musculus)
Strain, strain background     Dnm1l floxed mouse             Kageyama et al., 2014
(M. musculus)
Strain, strain background     Rpl22 floxed mouse             The Jackson Laboratory      Stock No #029977
(M. musculus)
Biological sample             Primary hypothalamic           This paper                                            Freshly isolated from
(M. musculus)                 neuronal cells                                                                       M. musculus in S. Diano Lab.
Antibody                      Anti-HA antibody               Biolegend                   Cat# 901513,              Immunoprecipitation
                              (Mouse monoclonal) antibody                                RRID:AB_2565335           (5 ml/sample)
Antibody                      Anti-phosphorylated DRP1       Cell Signaling Technology   Cat# 4494,                IHC (1:500)
                              (Ser-616) antibody (Rabbit                                 RRID:AB_11178659
                              monoclonal antibody)
Antibody                      Anti-Fos antibody (Rabbit      Santa Cruz Biotechnology    Cat# sc-52,               IHC (1:2000)
                              polyclonal) antibody                                       RRID:AB_2106783
Antibody                      Anti-POMC (Rabbit              Phoenix Pharmaceuticals     Cat# H-029–30,            IHC (1:2000)
                              polyclonal) antibody                                       RRID:AB_2307442
Antibody                      Anti-AgRP (Rabbit              Phoenix Pharmaceuticals     Cat# H-003–57,            IHC (1:1000)
                              polyclonal) antibody                                       RRID:AB_2313909
Antibody                      Anti-Melanocyte Stimulating    Millipore Sigma             Cat#: ab5087,             IHC (1:1000)
                              Hormone (Sheep polyclonal)                                 RRID:AB_91683
                              antibody
Continued on next page

Jin et al. eLife 2021;10:e64351. DOI: https://doi.org/10.7554/eLife.64351                                                                15 of 24
Research article Neuroscience
Continued
Reagent type
(species) or resource Designation Source or reference Identifiers Additional information
Antibody Anti-rabbit Alexa Fluor 488 Life Technologies Cat# A21206, IHC (1:500)
(donkey polyclonal antibody) RRID:AB_2535792
Antibody Anti-sheep Alexa Fluor 488 Life Technologies Cat# A11015, IHC (1:1000)
(donkey polyclonal antibody) RRID:AB_141362
Antibody Alexa Fluor 594 anti-goat IgG Life Technologies Cat# A11058, IHC (1:500)
(donkey polyclonal antibody) RRID:AB_2534105
Antibody Biotinylated anti-rabbit IgG Vector Laboratories Cat# BA-1000, IHC (1:250)
(goat polyclonal antibody) RRID:AB_2313606
Peptide, Streptavidin-conjugated Life Technologies Cat# A21370 IHC (1:2000)
recombinant protein Alexa Fluor 488
Sequence- Dnm1l Thermo Fisher Scientific Assay ID Mm01342903_m1 TaqMan Gene Expression
based reagent Assay (FAM)
Sequence- Agrp Thermo Fisher Scientific Assay ID Mm00475829_g1 TaqMan Gene Expression
based reagent Assay (FAM)
Sequence- Npy Thermo Fisher Scientific Assay ID Mm01410146_m1 TaqMan Gene Expression
based reagent Assay (FAM)
Sequence- Pomc Thermo Fisher Scientific Assay ID Mm00435874_m1 TaqMan Gene Expression
based reagent Assay (FAM)
Sequence- Nr5a1 Thermo Fisher Scientific Assay ID Mm00446826_m1 TaqMan Gene Expression
based reagent Assay (FAM)
Sequenced- Actb Thermo Fisher Scientific Assay ID Mm02619580_g1 TaqMan Gene Expression
based reagent Assay (FAM)
Sequenced- Rn18s Thermo Fisher Scientific Assay ID Mm04277571_s1 TaqMan Gene Expression
based reagent Assay (FAM)
Peptide, Ghrelin ProSpec Cat# HOR-297-B
recombinant protein
Commercial Ghrelin ELISA kit Millipore Sigma Cat# EZRGRT-91K
assay or kit
Commercial Rat/Mouse Total Millipore Sigma Cat# EZRGRT-90K
assay or kit Ghrelin ELISA kit
Chemical 4-hydroxytamoxifen Sigma-Aldrich Cat# H7904
compound, drug
Chemical Seahorse XF Palmitate- Agilent Technologies Cat# 1102720–100
compound, drug BSA FAO substrate
Chemical Oligomycin Sigma-Aldrich Cat# 495455
compound, drug
Chemical Carbonyl cyanide-p- Sigma-Aldrich Cat# C2920
compound, drug (trifluoromethoxy)
phenylhydrazone
Chemical Antimycin A Sigma-Aldrich Cat# A8674
compound, drug
Chemical Rotenone Sigma-Aldrich Cat# R8875
compound, drug
Chemical Avidin–biotin–peroxidase Vector Laboratories ABC Elite kit IHC (1:250)
compound, drug
Software, algorithm FLIR Tools FLIR Thermal FLIR C2
Imaging System
Software, algorithm AxoGraph AxoGraph Scientific AxoGraph X
Software, algorithm KaleidaGraph Synergy Software KaleidaGraph v4.5.4
Software, algorithm Leading Analysis Software WaveMetrics Igor Pro
Software, algorithm Prism software GraphPad Software Prism 7.01 software
Other Standard chow diet Harlan Teklad 2018; 18% calories from fat
Other DAPI Thermo Fisher Scientific Cat# P36962
Jin et al. eLife 2021;10:e64351. DOI: https://doi.org/10.7554/eLife.64351 16 of 24Research article Neuroscience
Animals
All animal care and experimental procedures done in this study were approved by the Yale Univer-
sity (protocol # 10670) and the Columbia University (protocols # AC-AABI0565 and AC-AABH9564)
Institutional Animal Care and Use Committees. All mice were housed in a temperature-controlled
environment (22–24˚C) with a 12 hr light and 12 hr dark (19.00–07.00 hr) photoperiod. Animals were
provided standard chow diet (SD) (2018; 18% calories from fat; Harlan Teklad, Madison, WI, USA)
and water ad libitum unless otherwise stated. All fasted mice were food deprived for 16 hr (18.00–
10.00 hr) prior to the experiment. All mice studied were of the same (mixed) background.
Generation of experimental mice with inducible deletion of Dnm1l
specifically in AgRP neurons
We used the inducible Cre/loxP technology to generate mice in which DRP1 was selectively ablated
in AgRP neurons (Drp1 cKO mice). First, mice expressing a tamoxifen-inducible Cre recombinase
(CreERT2) in cells expressing AgRP (AgrpCre:ERT2, Wang et al., 2014) were crossed with Rosa26-lox-
stop-lox-tdTomato (Ai14; cre-recombinase-dependent expression) mice (Ai14 reporter mice; stock
#007914; The Jackson Laboratory, Bar Harbor, ME, USA) to label AgRP-expressing cells. AgrpCre:
ERT2
; Rosa26-lox-stop-lox-tdTomato (AgrpCre:ERT2; tdTomato) mice have AgRP-expressing cells with
the expression of tdTomato by tamoxifen administration. No observation of AgRP-tdTomato expres-
sion was found in the absence of tamoxifen administration, indicating that recombination was strictly
dependent upon tamoxifen-induced Cre recombinase activation. The mice with AgrpCre:ERT2; tdTo-
mato were then crossed with mice harboring conditional alleles Dnm1l floxed (Dnm1lfl/fl;
Kageyama et al., 2014) to generated mice with inducible deletion of Dnm1l specifically in AgRP
neurons (Drp1 cKO mice).
Dnm1lfl/fl; AgrpCre:ERT2; tdTomato mice injected with corn oil and Dnm1l+/+; AgrpCre:ERT2; tdTo-
mato mice injected with tamoxifen (TMX) were used as controls. Dnm1lfl/fl; AgrpCre:ERT2; tdTomato
mice were injected intraperitoneally (i.p.) with tamoxifen (0.10 mg/g BW for every 3 days with five
times fasting) starting at 5 weeks of age to induce mature-onset deletion of Dnm1l in AgRP neurons
of Drp1 cKO mice, and Dnm1l+/+; AgrpCre:ERT2; tdTomato mice were injected with tamoxifen and
Dnm1lfl/fl; AgrpCre:ERT2; tdTomato were mice injected with corn oil as control groups. Because we
found no differences between these two control groups, the majority of the experiments were per-
formed using Dnm1l+/+; AgrpCre:ERT2; tdTomato and Dnm1lfl/fl; AgrpCre:ERT2; tdTomato mice injected
with tamoxifen (to label AgRP neurons with tdTomato expression) as a control and Drp1 cKO group,
unless otherwise stated.
Ribotag assays
We performed transcriptomic profiling by using ribosomal tagging strategy to analyze AgRP neu-
rons-specific mRNA expression in vivo. To avoid the potential disadvantage that the embryonic
POMC-expressing progenitor neurons differentiate into AgRP-expressing neurons, we crossed Agrp-
Cre:ERT2
mice (Wang et al., 2014) with Rpl22 floxed (RiboTag, #029977, The Jackson Laboratories,
Bar Harbor, ME, USA) mice to eventually generate AgrpCre:ERT2; RiboTag mice, expressing a hemag-
glutinin A (HA)-tagged ribosomal protein in the AgRP neurons upon tamoxifen injection. Eleven- to
twelve-week-old mice (1 month after the last tamoxifen injection) were used. After mice were anes-
thetized with isoflurane and decapitated, the brains were rapidly dissected out. To carefully collect
the hypothalamic arcuate nucleus (ARC), brain tissues were sectioned in two-millimeter thick coronal
sections containing mediobasal hypothalamus (MBH) in a brain matrix. The MBH ARC samples were
collected under a stereomicroscope according to the brain atlas for appropriate regions and pre-
venting differences in tissue weight. Three animals were pooled for each N. The MBH ARC samples
from AgrpCre:ERT2; RiboTag mice were homogenized by supplemented homogenization buffer (HB-
S: 50 mM Tris, pH 7.4, 100 mM KCl, 12 mM MgCl2, and 1 % NP-40 supplemented with 1 mM DTT, 1
mg/ml heparin, 100 mg/ml cycloheximide, 200 U/ml RNasin Ribonuclease inhibitor, and protease
inhibitor cocktail). Samples were then centrifuged at 10,000 rpm for 10 min at 4˚C. Then, 50 ml of
each supernatant was transferred to a new tube serving as input fraction (containing all mRNAs). To
isolate polyribosomes, we performed immunoprecipitation of ribosome-bound mRNAs in AgRP neu-
rons. by utilizing anti-HA antibody (5 ml/sample; Cat#901513, Biolegend, San Diego, CA, USA).
Jin et al. eLife 2021;10:e64351. DOI: https://doi.org/10.7554/eLife.64351 17 of 24Research article Neuroscience
RNA was extracted using Qiagen RNeasy Plus Micro Kit (Cat# 74034, Qiagen, Valencia, CA, USA)
according to the protocol supplied by the manufacturer. cDNA was synthesized using High Capacity
cDNA Reverse transcription Kit (Cat# 4368814, Thermo Fisher Scientific, Waltham, MA, USA). qRT-
PCR experiment was performed by Taqman Gene Expression Assay primers (Thermo Fisher Scien-
tific) in triplicates using LightCycler 480 Real-Time PCR System (Roche Diagnostics, Mannheim, Ger-
many). All genes were normalized to Actb or Rn18s. The 2(-Delta Delta C(t)) method was used to
analyze the relative quantification of gene expression. The following primers were utilized: Dnm1l,
Mm01342903_m1; Agrp, Mm00475829_g1; Npy, Mm01410146_m1; Pomc, Mm00435874_m1;
Nr5a1, Mm00446826_m1; Actb, Mm02619580_g1; Rn18s, Mm04277571_s1.
Metabolic assays
Four-month-old mice were acclimated in metabolic chambers (TSE System-Core Metabolic Pheno-
typing Center, Yale University) for 3 days before the start of the recordings. Mice were continuously
recorded for 2 days, with the following measurements taken every 30 min: food intake, locomotor
activity (in the x-, y-, and z-axes), and gas exchange (O2 and CO2; The TSE LabMaster System, Ches-
terfield, MO, USA). Energy expenditure was calculated according to the manufacturer’s guidelines
(PhenoMaster Software, TSE System, Chesterfield, MO, USA). The respiratory quotient was esti-
mated by calculating the ratio of CO2 production to O2 consumption. Values were adjusted by body
weight to the power of 0.75 (kg 0.75) where mentioned. Body composition was measured in vivo
by MRI (EchoMRI, Echo Medical Systems, Houston, TX, USA) monthly at 10:00 AM. Body core tem-
perature was measured at 10:00 AM using a thermocouple rectal probe and thermometer (Physi-
temp instruments, Clifton, NJ, USA). Rectal temperature was measured for repeated three times,
and the average was calculated. The temperature of the surface overlying BAT was measured using
infrared thermography images (FLIR C2, FLIR Thermal Imaging System, Arlington, VA, USA). The
infrared thermography images were taken at least three times and analyzed using FLIR Tools (FLIR
Thermal Imaging System, Arlington, VA, USA).
Phosphorylated-DRP1 immunostaining
Five-month-old mice were deeply anesthetized and transcardially perfused with 0.9% saline contain-
ing heparin (10 mg/l), followed by fresh fixative of 4% paraformaldehyde in phosphate buffer (0.1 M
PB, pH 7.4) as previously described (Andrews et al., 2008; Diano et al., 2011; Toda et al., 2016).
Brains were post-fixed overnight at 4˚C and sliced to a thickness of 50 mm using a vibratome
(#11000, PELCO easySlicer, TED PELLA Inc, Redding, CA, USA) and coronal brain sections contain-
ing the ARC were selected under the stereomicroscope (Stemi DV4, Carl Zeiss Microimaging Inc,
Thornwood, NY, USA). After several washes with 0.1 M PB, brain sections were preincubated with
0.2% triton X-100 (Sigma-Aldrich, Saint Louis, MO, USA) and 2% normal goat serum in 0.1 M PB for
30 min to permeabilize tissue and cells. Brain sections were incubated with rabbit anti-phosphory-
lated-DRP1 (Ser-616) antibody (diluted 1:500 in 0.1 M PB, #4494, Cell Signaling, Technology, Dan-
vers, MA, USA) overnight at room temperature (RT). The following day, brain sections were washed
and incubated with a biotinylated goat anti-rabbit IgG (diluted 1:200 in 0.1M PB, BA-1000, Vector
Laboratories, Inc, Burlingame, CA, USA) for 2 hr at RT. Sections were then washed and incubated in
streptavidin-conjugated Alexa Fluor 488 (diluted 1:2000 in 0.1 M PB, A21370, Life Technologies,
Carlsbad, CA, USA) for 2 hr at RT. No staining was performed to visualize AgRP neurons since mice
were expressing tdTomato in this neuronal population, which is per se fluorescent. After several
washes with 0.1 M PB, brain sections were mounted on glass slides and coverslipped with a drop of
Vectashield mounting medium (H-1000, Vector Laboratories, Burlingame, CA, USA). The coverslip
was sealed with nail polish to prevent drying and movement under the microscope. All slides were
stored in the dark at 4˚C.
Fos immunostaining
Five-month-old mice were deeply anesthetized and transcardially perfused as described above.
Immunofluorescent staining was performed using rabbit anti-Fos antibody (diluted 1:2000 in 0.1 M
PB, sc-52, Santa Cruz Biotechnology, Dallas, TX, USA) overnight at RT. The following day, brain sec-
tions were washed and incubated with a biotinylated goat anti-rabbit IgG secondary antibody
(diluted 1:200 in 0.1M PB, BA-1000, Vector Laboratories, Burlingame, CA, USA) for 2 hr at RT.
Jin et al. eLife 2021;10:e64351. DOI: https://doi.org/10.7554/eLife.64351 18 of 24Research article Neuroscience
Sections were then washed and incubated in streptavidin-conjugated Alexa Fluor 488 (diluted
1:2000 in 0.1 M PB, A21370, Life Technologies, Carlsbad, CA, USA) for 2 hr at RT. No staining was
performed to visualize AgRP neurons since mice were expressing tdTomato in this neuronal popula-
tion, which is per se fluorescent. For double-label immunohistochemistry of Fos and POMC neurons,
sections were processed using goat anti-Fos antibody (diluted 1:2000 in 0.1 M PB, sc-52-G, Santa
Cruz Biotechnology, Dallas, TX, USA) overnight at RT. The following day, brain sections were washed
and incubated with a Alexa Fluor 594 donkey anti-goat IgG secondary antibody (diluted 1:500 in
0.1M PB, A11058, Life Technologies, Carlsbad, CA, USA) for 2 hr at RT. Brain sections were then
incubated with rabbit anti-POMC antibody (diluted 1:2000 in 0.1 M PB, H-029–30, Phoenix Pharma-
ceuticals, Burlingame, CA, USA). The following day, sections were washed and incubated with Alexa
Fluor 488 donkey anti-rabbit IgG secondary antibody (diluted 1:500 in 0.1 M PB, A21206, Life Tech-
nologies) for 2 hr at RT. After several washes with 0.1 M PB, brain sections were mounted on glass
slides and coverslipped with a drop of vectashield mounting medium (H-1000, Vector Laboratories,
Inc, Burlingame, CA, USA) and analyzed with a fluorescence microscope.
AgRP and a-MSH fiber immunostaining
Five-month-old mice were deeply anesthetized and transcardially perfused as described above. Brain
sections containing the hypothalamic paraventricular nucleus (PVN) were selected under the stereo-
microscope. Immunofluorescence staining was performed using rabbit anti-AgRP antibody (diluted
1:1000 in 0.1 M PB, H-003–57, Phoenix Pharmaceuticals, Inc) and sheep anti-a-MSH antibody
(diluted 1:1000 in 0.1 M PB, ab5087, Millipore Sigma, Burlington, MA, USA) overnight at RT. The fol-
lowing day, brain sections were washed and incubated with anti-rabbit Alexa Fluor 488 (diluted
1:1000 in 0.1M PB, A21206, Life Technologies) and anti-sheep Alexa Fluor 488 (diluted 1:1000 in
0.1M PB, A11015, Life technologies) for 2 hr at RT. After several washes with 0.1 M PB, brain sec-
tions were mounted on glass slides, coverslipped with a drop of vectashield mounting medium, and
analyzed with a fluorescence microscope.
Fluorescent image capture and analyses
Five-month-old mice were deeply anesthetized and transcardially perfused as described above. Fluo-
rescent images were captured with Fluorescence Microscope (Model BZ-X710, KEYENCE, Osaka,
Japan). For all immunohistochemistry (IHC) analyses, coronal brain sections were anatomically
matched (ARC: between 1.46 and 2.06 mm from bregma, PVN: 0.70 and 1.06 mm from
bregma) with the mouse brain atlas (Franklin and Paxinos, 2019). Both sides of the bilateral brain
region (ARC and PVN) were analyzed per mouse. For each mouse, three hypothalamic level-matched
per mouse were used to quantify Fos immunoreactive cells in all AgRP and POMC immunostained
cells observed in the ARC. The number of immunostained cells was counted manually using ImageJ
software (Schneider et al., 2012) by an unbiased observer. For area measurements and particle
counting, region of interest (ROI) within fluorescence images was manually selected with the mouse
brain atlas for ARC, DMH, and PVN, and was then measured by ImageJ software as previously
described (Jin et al., 2016).
Hypothalamic primary neuronal cell culture
Eight to ten neonatal (0–1 day old) pups were used for hypothalamic primary neuronal cell culture.
For control culture, we used either Dnm1lfl/fl; AgrpCre:ERT2; tdTomato mice which neuronal cultures
were treated with vehicle (ethanol) or Dnm1l+/+; AgrpCre:ERT2; tdTomato mice which neuronal cul-
tures were treated with 4-hydroxytamoxifen (2 mM). Hypothalamic primary neuronal cultures from
Drp1 cKO mice (Dnm1lfl/fl; AgrpCre:ERT2; tdTomato mice) were treated with 4-hydroxytamoxifen (2
mM). In brief, we carefully removed the MBH of the brain and placed it onto a small culture dish that
contains a small volume of Hibernate-A Medium (Cat# A1247501, Gibco-Thermo Fisher Scientific,
Waltham, MA, USA). The tissues dissociated to single cells after digestion with 6 ml of Hibernate-A
Medium containing 2.5% of Trypsin-EDTA for 15 min at 37˚C. Suspended cells were filtered (40 mm)
and centrifuged for 5 min at 1000 rpm and the pellet was re-suspended and plated on XF96 cell cul-
ture microplates (Cat# 101085–004, Agilent Technologies, Santa Clara, CA, USA) coated with poly-
D-lysine (Cat# P6407, Sigma-Aldrich, Saint Louis, MO, USA) at a density of 1 105 cells per well,
and they were cultured in Neurobasal medium (Cat# 21103049, Gibco-Thermo Fisher Scientific,
Jin et al. eLife 2021;10:e64351. DOI: https://doi.org/10.7554/eLife.64351 19 of 24Research article Neuroscience
Waltham, MA, USA) supplemented with 1% penicillin–streptomycin, 2% B-27 Supplement (Cat#
17504044, Gibco-Thermo Fisher Scientific, Waltham, MA, USA), and GlutaMAX-I (Cat# 35050061,
Gibco-Thermo Fisher Scientific, Waltham, MA, USA). After 10 days in culture, primary neuronal cells
isolated from control (Dnm1l+/+; AgrpCre:ERT2; tdTomato) and Drp1 cKO mice were treated with 2
mM 4-hydroxytamoxifen (H7904, Sigma-Aldrich, Saint Louis, MO, USA) for expression of a CreER
recombinase while the other control group (generated from Dnm1lfl/fl; AgrpCre:ERT2; tdTomato mice)
was treated with vehicle (ethanol) to assess the effect of 4-hydroxytamoxifen on cell viability. Primary
neuronal cells were used for the measurement of mitochondria fatty acid oxidation 5 days later.
Cell quantification in cultures
Cells were analyzed by capturing six to eight random fields per coverslip. For the quantitative analy-
sis of cell number, tomato expressing cells in DAPI (Cat# p36962, Thermo Fisher Scientific, Waltham,
MA, USA)-stained cultures were manually counted using Image J software. Cells were visualized
using Fluorescence Microscope (Model BZ-X710, KEYENCE, Osaka, Japan). Five coverslips per
group were counted within an experiment.
Viability assay in cultures
Neuronal cell viability was determined by trypan blue exclusion assay in cultures maintained in each
condition. The cultures were stained with 0.4% trypan blue (Cat# 302643, Sigma-Aldrich, Saint Louis,
MO, USA) for 15 min at room temperature and then washed with phosphate-buffered saline (PBS).
And then, 10 mL of suspended cells was loaded into each chamber of the hemocytometer. Counts
were performed by triplicate by one analyst under a 40 objective according to the standard meth-
odology. The non-stained (live) and Trypan blue-stained (dead) cell counts were counted and calcu-
lated in three randomly selected areas (0.2 mm2) in each well (n = 5 per treatment condition) to
calculate the cell viability percentage.
Measurement of mitochondrial fatty acid oxidation assay
The fatty acid oxidation (FAO) was measured using a microfluorimetric Seahorse XF96 Analyzer (Agi-
lent Technologies, Santa Clara, CA, USA) according to the protocol supplied by the manufacturer
with minor modifications. Cells were starved with minimal substrate neurobasal-A medium (Cat#
10888022, Thermo Fisher Scientific) for 24 hr. The minimal substrate medium included 1% B-27 Sup-
plement (Cat# 17504044, Gibco-Thermo Fisher Scientific, Waltham, MA, USA), 1 mM glutamine, 0.5
mM carnitine, and 2.5 or 0.5 mM of glucose. The day of the assay, 45 min prior to the assay, starved
cells were washed and incubated with Seahorse XF Base medium Minimal DMEM (Cat# 102353–100,
Agilent Technologies, Santa Clara, CA, USA) supplemented with 2.5 or 0.5 mM glucose and 0.5 mM
carnitine in a non-CO2 37˚C incubator. Fifteen minutes prior to the assay, 40 mM etomoxir was added
to the cells to measure endogenous fatty acid uptake for FAO. Palmitate-BSA or BSA control (Sea-
horse XF Palmitate-BSA FAO substrate, Cat# 1102720–100, Agilent Technologies, Santa Clara, CA,
USA) were added to cells right before initiating the XF assay. During the assay, cells were exposed
to compounds in the following order: 5 mM of oligomycin (Cat# 495455, Sigma), 10 mM of FCCP [car-
bonyl cyanide-p-(trifluoromethoxy) phenylhydrazone] (Cat# C2920, Sigma-Aldrich, Saint Louis, MO,
USA), 10 mM of antimycin A (Cat# A8674, Sigma-Aldrich, Saint Louis, MO, USA), and 5 mM of rote-
none (Cat# R8875, Sigma-Aldrich, Saint Louis, MO, USA). Wave 2.6.0 (Agilent Technologies soft-
ware, Santa Clara, CA, USA) software was used to analyze the parameters.
Electrophysiology analysis
Electrophysiology analyses were performed as previously described (Toda et al., 2016). Briefly, 11–
12-week-old mice were used for recordings. After mice were anesthetized with isoflurane and
decapitated, the brains were rapidly removed and immersed in an oxygenated cutting solution at 4˚
C containing (in mM): sucrose 220, KCl 2.5, NaH2PO4 1.23, NaHCO3 26, CaCl2 1, MgCl2 6, and glu-
cose 10, pH (7.3) with NaOH. After being amputated to a small tissue block, coronal slices contain-
ing the hypothalamus (300 mm thick) were cut with a vibratome. After preparation, slices were
stored in a holding chamber with an oxygenated (with 5% CO2% and 95% O2) artificial cerebrospinal
fluid (aCSF) containing (in mM): NaCl 124, KCl 3, CaCl2 2, MgCl2 2, NaH2PO4 1.23, NaHCO3 26, glu-
cose 3, pH 7.4 with NaOH. The slices were eventually transferred to a recording chamber perfused
Jin et al. eLife 2021;10:e64351. DOI: https://doi.org/10.7554/eLife.64351 20 of 24Research article Neuroscience
continuously with aCSF at 33˚C at a rate of 2 ml/min after at least a 1 hr recovery in the storage
chamber. Perforated patch recording was performed in AgRP-Tomato neurons of the ARC under
voltage and current clamp. The membrane and spontaneous action potential were recorded in
AgRP neurons under zero current clamp condition. For ghrelin-induced AgRP neuronal activation,
baseline activity was recorded for at least 15 min. Slices were then perfused with 10 nM ghrelin,
diluted in aCSF for 3 min, followed by a washout (with no ghrelin). At the end of the perforated
patch recordings, the membrane of every cell was ruptured and whole-cell patch recording mea-
sured to check current–voltage relationship. All data were sampled at 5 kHz, filtered at 2.4 kHz, and
analyzed with an Apple Macintosh computer using AxoGraph X (AxoGraph Scientific, Foster City,
CA, USA). Statistics and plotting were performed with KaleidaGraph (Synergy Software, Inc, Read-
ing, PA, USA) and Igor Pro (WaveMetrics, Lake Oswego, OR, USA). The average firing rate was cal-
culated in the last 2 min of each control period or treatment application. All the experiments were
performed blindly to the electrophysiologist.
Ghrelin administration
Individually housed 4-month-old mice were i.p. injected with either 0.9% saline (#0409-1966-12, Hos-
pira Inc, Lake Forest, IL, USA) or ghrelin (10 nmol, HOR-297-B, ProSpec, Rehovot, Israel) at 9:00 AM.
Immediately after injection, mice were returned to their home cages, which contained a pre-weighed
amount of food. The remaining food was measured at 0.5, 1, 2, and 4 hr post-injection. For immu-
nostaining, mice were injected with ghrelin at 9:00 AM and 1 hr later, mice were deeply anesthetized
and transcardially perfused, and brains were dissected and sectioned (50 mm) using a vibratome.
Brain sections were processed for Fos immunostaining. Fluorescent images were captured with a
Fluorescence Microscope (BZ-X710, KEYENCE, Osaka, Japan). Fos/AgRP positive cells were counted
using ImageJ software.
Electron microscopy analysis
Mice (5 months old) were deeply anesthetized and transcardially perfused with 0.9% saline contain-
ing heparin (10 mg/l), followed by fresh fixative (4% paraformaldehyde, 15% picric acid, 0.1% glutar-
aldehyde in 0.1 M PB). Brain coronal sections were immunostained with rabbit anti-RFP antibody
(diluted 1:1000 in 0.1 M PB, 600-401-379, Rockland Immunochemicals, Limerick, PA, USA) for AgRP
neurons. After several washes with 0.1 M PB, sections were incubated with biotinylated goat anti-
rabbit IgG (diluted 1:250 in 0.1 M PB, BA-1000, Vector Laboratories, Burlingame, CA, USA) for 2 hr
at RT, and then rinsed in 0.1 M PB three times 10 min each time and incubated for 2 hr at RT with
avidin–biotin–peroxidase (ABC; diluted 1:250 in 0.1 M PB; ABC Elite kit, Vector Laboratories). The
immunoreaction was visualized with 3,3-diaminobenzidine (DAB). Sections were then osmicated (1%
osmium tetroxide) for 30 min, dehydrated through increasing ethanol concentrations (using 1% ura-
nyl acetate in the 70% ethanol for 30 min), and flat-embedded in araldite between liquid release-
coated slides (Electron Microscopy Sciences, Hatfield, PA, USA). After capsule embedding, blocks
were trimmed. Ribbons of serial ultrathin sections were collected on Formvar-coated single slot grids
and examined using a Philips CM-10 electron microscope. Mitochondria morphology in AgRP neu-
rons of fed and fasted mice were analyzed using ImageJ software as previously described
(Toda et al., 2016).
Measurement of circulating hormones
Five-month-old mice were deeply anesthetized and decapitated. The blood was collected into a cap-
illary tube (Microvette, CB 300 Z, Sarstedt, Nümbrecht, Germany) containing 0.2 mg 4-(2-amino-
ethyl)-benzene-sulfonyl fluoride (AEBSF, Roche, Basel, Switzerland). Serum from blood samples was
obtained by centrifugation at 3000 rpm for 15 min, and each circulating hormone was determined
using a commercially available ELISA kit for total ghrelin (Rat/Mouse Total Ghrelin ELISA kit,
EZRGRT-91K, Millipore Sigma, Burlington, MA, USA) and active ghrelin (Rat/Mouse Total Ghrelin
ELISA kit, EZRGRT-90K, Millipore Sigma, Burlington, MA, USA). Serum samples and standards were
analyzed in duplicate. All procedures were performed by following the manufacturer’s protocol.
Jin et al. eLife 2021;10:e64351. DOI: https://doi.org/10.7554/eLife.64351 21 of 24Research article Neuroscience
Statistical analysis
Two-way ANOVA was used to determine the effect of the genotype and treatment with the Prism
7.01 software (GraphPad Software). For repeated measures analysis, ANOVA was used when values
over different times were analyzed. When only two groups were analyzed, statistical significance was
determined by an unpaired Student’s t-test. A value of pResearch article Neuroscience
Additional files
Supplementary files
. Transparent reporting form
Data availability
All data generated or analyzed during this study are included in the manuscript and supporting files.
References
Andrews ZB, Liu ZW, Walllingford N, Erion DM, Borok E, Friedman JM, Tschöp MH, Shanabrough M, Cline G,
Shulman GI, Coppola A, Gao XB, Horvath TL, Diano S. 2008. UCP2 mediates ghrelin’s action on NPY/AgRP
neurons by lowering free radicals. Nature 454:846–851. DOI: https://doi.org/10.1038/nature07181, PMID: 1866
8043
Batterham RL, Cowley MA, Small CJ, Herzog H, Cohen MA, Dakin CL, Wren AM, Brynes AE, Low MJ, Ghatei
MA, Cone RD, Bloom SR. 2002. Gut hormone PYY(3-36) physiologically inhibits food intake. Nature 418:650–
654. DOI: https://doi.org/10.1038/nature00887, PMID: 12167864
Bélanger M, Allaman I, Magistretti PJ. 2011. Brain energy metabolism: focus on astrocyte-neuron metabolic
cooperation. Cell Metabolism 14:724–738. DOI: https://doi.org/10.1016/j.cmet.2011.08.016, PMID: 22152301
Chan DC. 2006. Mitochondria: dynamic organelles in disease, aging, and development. Cell 125:1241–1252.
DOI: https://doi.org/10.1016/j.cell.2006.06.010, PMID: 16814712
Coll AP, Yeo GS. 2013. The hypothalamus and metabolism: integrating signals to control energy and glucose
homeostasis. Current Opinion in Pharmacology 13:970–976. DOI: https://doi.org/10.1016/j.coph.2013.09.010,
PMID: 24075719
Coppola A, Liu ZW, Andrews ZB, Paradis E, Roy MC, Friedman JM, Ricquier D, Richard D, Horvath TL, Gao XB,
Diano S. 2007. A central thermogenic-like mechanism in feeding regulation: an interplay between arcuate
nucleus T3 and UCP2. Cell Metabolism 5:21–33. DOI: https://doi.org/10.1016/j.cmet.2006.12.002, PMID: 171
89204
Diano S, Liu ZW, Jeong JK, Dietrich MO, Ruan HB, Kim E, Suyama S, Kelly K, Gyengesi E, Arbiser JL, Belsham
DD, Sarruf DA, Schwartz MW, Bennett AM, Shanabrough M, Mobbs CV, Yang X, Gao XB, Horvath TL. 2011.
Peroxisome proliferation-associated control of reactive oxygen species sets melanocortin tone and feeding in
diet-induced obesity. Nature Medicine 17:1121–1127. DOI: https://doi.org/10.1038/nm.2421, PMID: 21873987
Diano S. 2013. Role of reactive oxygen species in hypothalamic regulation of energy metabolism. Endocrinology
and Metabolism 28:3–5. DOI: https://doi.org/10.3803/EnM.2013.28.1.3, PMID: 24396642
Dietrich MO, Liu ZW, Horvath TL. 2013. Mitochondrial dynamics controlled by mitofusins regulate agrp neuronal
activity and diet-induced obesity. Cell 155:188–199. DOI: https://doi.org/10.1016/j.cell.2013.09.004,
PMID: 24074868
Franklin KBJ, Paxinos G. 2019. Paxino’s and Franklin’s the Mouse Brain in Stereotaxic Coordinates: Compact.
Academic Press.
Gao Q, Horvath TL. 2007. Neurobiology of feeding and energy expenditure. Annual Review of Neuroscience 30:
367–398. DOI: https://doi.org/10.1146/annurev.neuro.30.051606.094324, PMID: 17506645
Jin S, Kim JG, Park JW, Koch M, Horvath TL, Lee BJ. 2016. Hypothalamic TLR2 triggers sickness behavior via a
microglia-neuronal Axis. Scientific Reports 6:29424. DOI: https://doi.org/10.1038/srep29424, PMID: 27405276
Jin S, Diano S. 2018. Mitochondrial dynamics and hypothalamic regulation of metabolism. Endocrinology 159:
3596–3604. DOI: https://doi.org/10.1210/en.2018-00667, PMID: 30203064
Kageyama Y, Hoshijima M, Seo K, Bedja D, Sysa-Shah P, Andrabi SA, Chen W, Höke A, Dawson VL, Dawson TM,
Gabrielson K, Kass DA, Iijima M, Sesaki H. 2014. Parkin-independent mitophagy requires Drp1 and maintains
the integrity of mammalian heart and brain. The EMBO Journal 33:2798–2813. DOI: https://doi.org/10.15252/
embj.201488658, PMID: 25349190
Kasahara A, Scorrano L. 2014. Mitochondria: from cell death executioners to regulators of cell differentiation.
Trends in Cell Biology 24:761–770. DOI: https://doi.org/10.1016/j.tcb.2014.08.005, PMID: 25189346
Lam TK, Schwartz GJ, Rossetti L. 2005. Hypothalamic sensing of fatty acids. Nature Neuroscience 8:579–584.
DOI: https://doi.org/10.1038/nn1456, PMID: 15856066
Liesa M, Palacı́n M, Zorzano A. 2009. Mitochondrial dynamics in mammalian health and disease. Physiological
Reviews 89:799–845. DOI: https://doi.org/10.1152/physrev.00030.2008, PMID: 19584314
Losón OC, Song Z, Chen H, Chan DC. 2013. Fis1, mff, MiD49, and MiD51 mediate Drp1 recruitment in
mitochondrial fission. Molecular Biology of the Cell 24:659–667. DOI: https://doi.org/10.1091/mbc.e12-10-
0721, PMID: 23283981
Mattson MP, Gleichmann M, Cheng A. 2008. Mitochondria in neuroplasticity and neurological disorders. Neuron
60:748–766. DOI: https://doi.org/10.1016/j.neuron.2008.10.010, PMID: 19081372
Morrison SF, Madden CJ. 2014. Central nervous system regulation of Brown adipose tissue. Comprehensive
Physiology 4:1677–1713. DOI: https://doi.org/10.1002/cphy.c140013, PMID: 25428857
Jin et al. eLife 2021;10:e64351. DOI: https://doi.org/10.7554/eLife.64351 23 of 24You can also read