Estimating the Cooling Effect of Pocket Green Space in High Density Urban Areas in Shanghai, China - Humboldt-Universität zu Berlin
←
→
Page content transcription
If your browser does not render page correctly, please read the page content below
ORIGINAL RESEARCH
                                                                                                                                              published: 28 May 2021
                                                                                                                                     doi: 10.3389/fenvs.2021.657969

                                           Estimating the Cooling Effect of
                                           Pocket Green Space in High Density
                                           Urban Areas in Shanghai, China
                                           Caiyan Wu 1, Junxiang Li 1*, Chunfang Wang 2, Conghe Song 3, Dagmar Haase 4,5,
                                           Jürgen Breuste 6 and Maroš Finka 7
                                           1
                                             School of Design, Shanghai Jiao Tong University, Shanghai, China, 2Shanghai Municipal Center for Disease Control and
                                           Prevention, Shanghai, China, 3Department of Geography, University of North Carolina at Chapel Hill, Chapel Hill, NC,
                                           United States, 4Department of Geography, Humboldt-Universität zu Berlin, Berlin, Germany, 5Department of Computational
                                           Landscape Ecology, Helmholtz Centre for Environmental Research-UFZ, Leipzig, Germany, 6Department of Geography and
                                           Geology, University of Salzburg, Salzburg, Austria, 7SPECTRA Centre of Excellence EU at Slovak University of Technology in
                                           Bratislava (STU), Bratislava, Slovakia

                                           Recently, pocket green spaces (PGS), i.e., small green spaces, have attracted growing
                                           attention for their various ecological and social services. As a crucial part of urban green
                                           spaces in high-density urban areas, PGS facilitates recreation and relaxation for
                                           neighborhoods and thus improves the livability of cities at the local scale. However,
                                           whether and how the PGS cools the urban heat island effect is still unclear. This research
                                           was performed in the highly developed areas of the city of Shanghai during hot summer
                          Edited by:       daytime. We applied a set of cooling effect indicators to estimate the cooling extent,
                    Ioan Cristian Ioja,    cooling intensity, and cooling efficiency of PGS. We further examined whether and how
    University of Bucharest, Romania
                                           landscape features within and surrounding the PGS influence its cooling effects. The
                      Reviewed by:
                         Weiqi Zhou,
                                           results showed that 90% of PGS are cooler than their surroundings. Among the landscape
            Research Center for Eco-       features, the land surface temperature of PGS logarithmically decreased with its area, and
Environmental Sciences (CAS), China        the maximum local cool island intensity and maximum cooling area logarithmically
            Constantina Alina Hossu,
    University of Bucharest, Romania       increased with the area of PGS. The vegetation types and their composition within the
                  *Correspondence:         PGS also influenced their surface temperature and the cooling effect. The PGS dominated
                           Junxiang Li     by tree-shrub-grass showed the highest cooling efficiency. The surrounding landscape
                junxiangli@sjtu.edu.cn
                                           patterns, especially the patch density and the landscape shape index, influence the cooling
                    Specialty section:
                                           effect of PGS at both class and landscape levels. These findings add new knowledge on
         This article was submitted to     factors influencing the cooling effect of PGS, and provide the biophysical theoretical basis
                  Land Use Dynamics,       for developing nature-based cooling strategies for urban landscape designers and
                a section of the journal
   Frontiers in Environmental Science      planners.
         Received: 24 January 2021         Keywords: pocket green space, land surface temperature, cooling effect, landscape pattern, landscape features
           Accepted: 13 May 2021
           Published: 28 May 2021
                              Citation:    INTRODUCTION
Wu C, Li J, Wang C, Song C, Haase D,
        Breuste J and Finka M (2021)
                                           Urbanization is a primary driver of conversion of vegetated areas to impervious surfaces globally
Estimating the Cooling Effect of Pocket
  Green Space in High Density Urban
                                           (Grimm et al., 2008; Weng, 2012). A primary environmental risk following urbanization is the urban
            Areas in Shanghai, China.      heat island (UHI) effect (Oke, 1982). Urban heat island effect and its associated amplified heatwave
        Front. Environ. Sci. 9:657969.     could pose extraordinary heat stress on urban organisms (Harlan et al., 2006) and cause considerable
     doi: 10.3389/fenvs.2021.657969        heat-related health risks for urban residents, such as increasing heat-related morbidity and mortality

Frontiers in Environmental Science | www.frontiersin.org                          1                                            May 2021 | Volume 9 | Article 657969
Wu et al.                                                                                                                          Pocket Green Space’s Cooling Effect

TABLE 1 | The definition of small or pocket green space (PGS) in literature.

Name                           Area                                   Vegetation structure within                                              Resource
                                                                                 PGS

Pocket park                   560 m2          No specific vegetation information provided                                        Lau et al. (2012)
Small public urban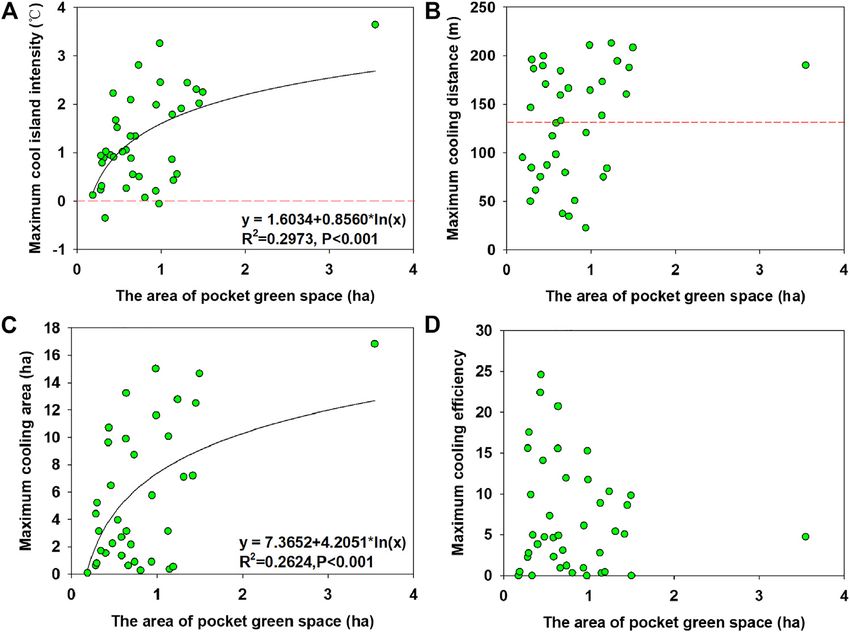
Wu et al. Pocket Green Space’s Cooling Effect
cooling effects of urban PGS are needed in many more cities to encompassing the entire central urban area. Therefore, the
further understand its role in mitigating UHI. study area is suitable to explore the cooling effect of PGS in a
Numerous studies use cooling intensity, i.e., the temperature high-density metropolitan area.
difference between the green space interior and its nearby
surroundings, to evaluate the cooling effect of urban green
space (Chang et al., 2007; Cao et al., 2010; Kong et al., 2014b). Pocket Green Space’s Definition and
Studies found that urban green space can cool well beyond its Selection
own physical boundaries (Upmanis et al., 1998; Cheng et al., There are more than ten thousand small green spaces in the urban
2014; Lin et al., 2015; Andersson et al., 2020). However, few area of Shanghai. In this study, We define a PGS as an urban
studies quantified how far the cooling effect of urban green space public green space whose area is larger than 0.09 ha but less than
could reach. Therefore, more indicators of cooling distance or 3.5 ha, including mini urban parks and street and roadside
extent are needed. Recently, Cheng et al. (2014) established a greenways (excluding the single isolated tree or single row
multi-indicator evaluation framework to estimate the cooling street trees). Peng et al. (2021) demonstrated that the cooling
intensity, distance and area, and efficiency of urban parks, which effect of urban parks could overlap each other. Thus, to identify
has been used to comprehensively measure the cooling effect of the UHI mitigation effect of individual green spaces, it is
urban green and blue spaces from different perspectives (Wu necessary to select green spaces, which are not overwhelmed
et al., 2019; Peng et al., 2021). However, whether such indicators by the other green or blue spaces (Cheng et al., 2014). To do so,
and framework are appropriate for urban PGS remains to be the selected green spaces have to meet the following criteria: 1)
verified. The cooling effects of PGS and the influence of landscape The area of the green space must be more than 0.09 ha but less
characteristics within and surrounding PGS on their cooling than 3.5 ha, which can be identified in the Landsat Thermal
effect are not well understood. image; 2) There should be no larger green spaces within 100 m
This study aims to quantitatively evaluate the cooling effect away from the surrounding green spaces; 3) There should to be no
of PGS on urban surface temperature and to identify the key large blue spaces (river, lake, etc.) within 300 m in the vicinity; 4)
factors that determine the cooling effect. We specifically focus on the total vegetation (trees, shrubs, and grass) coverage within green
the following questions: 1) What is the relationship between space should exceed 80%. Consequently, a total number of 41 PGS
landscape features of PGS and its land surface temperature? 2) were identified via visual interpretation from aerial photos in 1-
How do the landscape features of PGS influence its cooling effect? meter resolution, and their boundaries were digitized with a
and 3) How do the surrounding landscape patterns impact the geographic information systems tool (Figure 1). The areas of
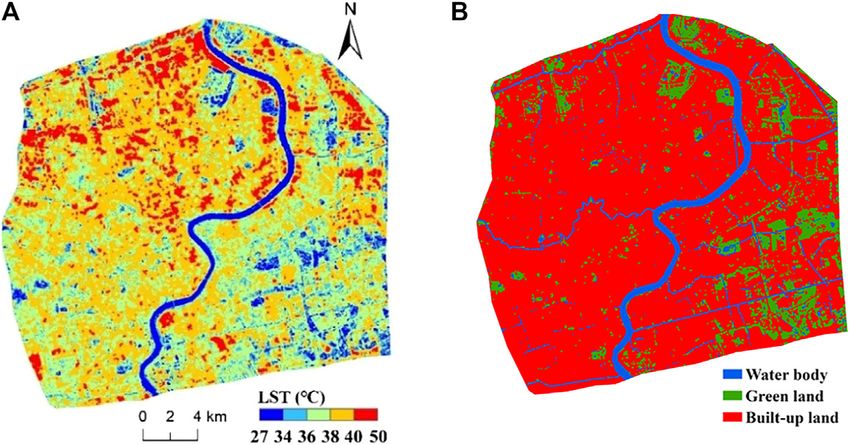
cooling effect of PGS? The answers to these questions will provide selected PGS range from 0.17 to 3.5 ha with mean of 0.81 ha.
novel insights for urban landscape designing and planning In this study, the landscape features of the PGS mainly refer to
regarding the use of PGS for UHI mitigation. its area and the dominant vegetation type within the green space.
We identify three vegetation types in PGS, including trees, shrubs,
and grass. These three types of vegetation can make up seven
METHODS vegetation structure combinations, i.e., trees, shrubs, grass, tree-
shrub, tree-grass, shrub-grass, and tree-shrub-grass, respectively.
Study Area We first identified the vegetation types within each PGS via visual
Shanghai is a megacity in China, located in 30°40′N-31°53′N, interpretation based on high spatial resolution aerial photos,
120°52′E-122°12′E. The city faces the East China Sea on the east, images on Google Earth, and Baidu Panoramic Map (http://
bordered by Hangzhou Bay on the south, and Yangtze River on quanjing.baidu.com/), then further verified on-screen visual
the north, enjoying a superior geographical position with interpretation through field visits. We did not find PGS with a
convenient traffic settings on both land and sea. Shanghai pure shrub type.
covers an area of 6,340.5 km2 (SMBS, 2019). After thirty years
of rapid urbanization since 1990, the proportion of the build-up Land Surface Temperature Calculation
area has reached 46% in 2015 (The Master Plan of Shanghai 2017- The land surface temperature (LST) was retrieved from a cloud-
2035). Nearly 50% of the permanent resident population of the free Landsat 8 thermal image. Although the original spatial
city live in the central urban area. Shanghai situates in the resolution of Landsat 8 thermal band is 100 m, it was
subtropical monsoon climate zone. Previous studies found a resampled to 30 m spatial resolution using cubic convolution
distinct UHI effect in the summer (Tan et al., 2010; Li et al., resampling method at EROS Data Center when downloaded. The
2011). More hot days and heatwaves were observed in urban areas image was acquired on August 3, 2015. Firstly, the at-sensor
than in rural areas, bringing adverse effects on human health spectral radiance was converted to effective at-sensor brightness
(Tan et al., 2010). The frequency of heat wave events in Shanghai temperature using the following equation (Chander et al., 2009):
is increasing in the 21st century (Chen et al., 2013). Therefore,
K2
how to effectively use urban green space as a nature-based TB (1)
solution to mitigate the UHI effect and to ameliorate the lnK1
Lλ
+ 1
urban thermal environment are of great interest to urban
residents and urban planners and designers. We focus on an where TB is the effective at-sensor brightness temperature (oK); Lλ
area located within the Outer-Ring Road of Shanghai, is spectral radiance and calculated according to Wu et al. (2019).
Frontiers in Environmental Science | www.frontiersin.org 3 May 2021 | Volume 9 | Article 657969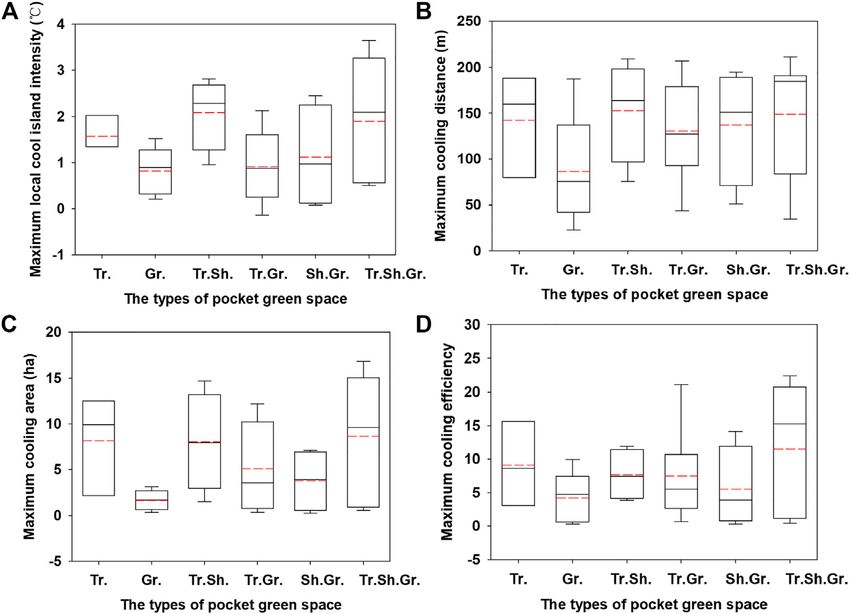
Wu et al.                                                                                                                  Pocket Green Space’s Cooling Effect

 FIGURE 1 | Spatial distribution of sampled PGS in the study area (the high-resolution image was one of the PGS in RGB).

 FIGURE 2 | Land surface temperature (A) and land-use/land-cover types in the study area (B).

K1 and K2 are the calibration constant, which are                                   and α  hc/b (1.438 × 10⁻² mK); h is the Planck’s constant (h
774.89 W·m−2·sr−1·μm−1 and 1,321.08°K respectively for                              6.626 × 10⁻³⁴ Js); b is the Boltzmann constant (b  1.38 × 10⁻²³ J/
Landsat 8 TIRS band 10.                                                             K); c is the speed of light (2.998 × 10⁸ m/s); ε is the surface
   The brightness temperature calculated with Eq. 1 is for a black                  emissivity and was estimated using the equation proposed by Li
body. Therefore, it needs to be converted to LST with the                           et al. (2011), ε  0.02644Fv + 0.96356, where Fv is the vegetation
correction for spectral emissivity (ε) of a gray body. The                          fraction, and estimated from NDVI according to Yu et al. (2014).
emissivity-corrected land surface temperature (Ts) is computed                         The land surface temperature in the study area ranges from 27
as in the following (Artis and Carnahan, 1982):                                     to 50°C in the thermal image, as shown in Figure 2. The hotspots
                                         TB                                         with a high land surface temperature higher than 40°C were
                            Ts                                           (2)       dispersed and spatially associated with high-density built-up area.
                                   1 + λ × TαB lnε
                                                                                    In comparison, the relatively cool spots with a temperature lower
where λ is the wavelength of emitted radiance, taking a value of                    than 34°C were mainly concentrated in urban green and blue
10.90 μm (the center of the bandwidth for Landsat 8 TIRS 10);                       spaces, such as Huangpu River and the green Urban Parks.

Frontiers in Environmental Science | www.frontiersin.org                        4                                          May 2021 | Volume 9 | Article 657969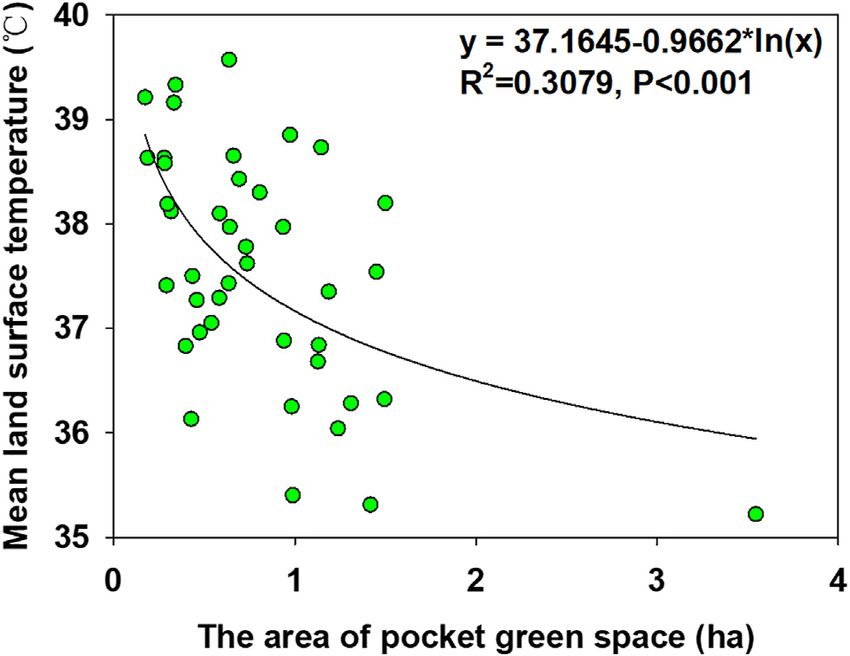
Wu et al.                                                                                                             Pocket Green Space’s Cooling Effect

   Land-cover types were classified using the Landsat 8 OLI image by                the way due to the influence of the surrounding landscape. The
the following steps. First, water bodies were extracted using a                    distance between the PGS and the first LST peak in its surrounding
modified normalized difference water index with the threshold                       is defined as the maximum cooling distance (Cheng et al., 2014).
value of 0.05 (Wu et al., 2019). Second, the built-up land and                         The second indicator is the maximum local cool island
green land were classified using maximum likelihood. Finally,                       intensity (MLCII), which was defined as the difference
three land-cover types, including build-up land, water body, and                   between the land surface temperature corresponding to the
green land, were mapped with a Kappa coefficient for an overall                     MCD and the mean land surface temperature within the PGS,
accuracy of 0.79. They were shown in Figure 2.                                     and was calculated using Eq. 5:
                                                                                                           MLCII  Ts − Tp                           (5)
Estimation of the Cooling Effect
The evaluation of the cooling effect of green space was based upon the             where Ts is the land surface temperature corresponding to where
concept of the local cool island intensity (LCII), which was initially             the MCD occurred, Tp is the mean surface temperature of
proposed by Chang et al. (2007), defined as the temperature                         the PGS.
difference between the inner park and its nearby surroundings.                         We identify the LST peaks along the buffer zones by fitting a
We employed the four cooling indicators proposed by Cheng                          polynomial function of the temperatures within the buffers with
et al. (2014) to measure the cooling effect of PGS in Shanghai,                    the buffer distance for each of the 41 PGS. Among the 41 selected
i.e., the maximum local cool island intensity (MLCII), the maximum                 PGS, there are 2 PGS which presented no robust fitting curves and
cooling distance (MCD), the maximum cooling area (MCA), and the                    2 PGS that behave as weak heat islands. Therefore, we rely on the
maximum cooling efficiency (MCE). To calculate the cooling effect                   37 remaining PGS to calculate their maximum cooling distance
indicators, we create a series of 10 m-width buffer rings up to 500 m              and the associated cooling area and efficiency. The final
starting from the boundary of each PGS, then calculate the mean land               polynomial fittings for the 39 PGS (excluding 2 PGS with no
surface temperature within each buffer ring and that of the PGS. It is             fitting curves) were showed in Supplementary Table S1.
inevitable that some of the buffer rings of the PGS could partially                    The third indicator, the maximum cooling area (MCA), was
overlapped each other when the distance between the PGS is within                  referred to as the largest area, through which the PGS’s cooling
1,000 m. The LST in the overlapping buffer rings may be influenced                  effect would extend (Cheng et al., 2014). To calculate the MCA,
by both PGS, therefore, must be corrected. The temperature in the                  we need to set two threshold values. The one is the minimum
overlapping areas will be estimated using the following equation (Wu               threshold value of Ta, refers to the average land surface
et al., 2019):                                                                     temperature of the PGS. The other is the threshold value of
                                                                                   Tmax, refers to the maximum land surface temperature
                                      Nj1 f ij × T ij
                             T bi                                      (3)        corresponding to the maximum cooling distance. The sum of
                                         Nj1 f ij                                all pixels within the MCD with their land surface temperature
                                                                                   between Ta and Tmax is the MCA. Pixels with temperatures
where, Tbi is the mean LST of a given buffer i of the target PGS A.
                                                                                   outside this range are not counted toward MCA.
Tij is the LST of a pixel in the buffer i; N is the total number of
                                                                                       The fourth indicator is the maximum cooling efficiency
pixels in the buffer i; fij is the weight that a pixel carries for buffer i.
                                                                                   (MCE), which was defined as the ratio of maximum cooling
If a pixel is located in a non-overlapping buffer, fij takes a value of
                                                                                   area to the size of the PGS.
1. If pixel j is in an overlap zone with another PGS B, fij is
calculated with the following equation:                                                                    MCE  MCA/A                               (6)
                                                                                   where MCA is the maximum cooling area, A is the area of
                             ⎝ 1 ⎞
                      f ij  ⎛        ⎝ 1 + 1 ⎞
                                    ⎠ ⎛              ⎠                  (4)
                                2
                              d Aij    d 2Aij d 2Bij                               the PGS.

where dAij is the distance of pixel j in buffer i to target PGS A, and
dBij is the sample pixel to PGS B.                                                 Measurement of the Surrounding
    To estimate the cooling effect of the PGS, the four indicators                 Landscape Pattern
were calculated using the equations developed by Cheng et al.                      Landscape metrics have been widely utilized to characterize
(2014) as follows.                                                                 landscape patterns (Wu et al., 2002; Li and Wu, 2004; Weber
    The first indicator is the maximum cooling distance (MCD). It is                et al., 2014a; Weber et al., 2014b), and landscape composition and
obvious that the MCD depends on the local cool island intensity                    configuration are two aspects of landscape patterns that can be
(LCII), which is strongly affected by the surrounding landscape                    linked to PGS to examine their impacts on PGS’ cooling effects.
setting. LCII is the difference between the mean land surface                      Many landscape pattern metrics have been developed in literature
temperature in each buffer ring and the mean land surface                          at both the landscape and class levels, and many provide similar
temperature of PGS. Generally, the LCII of a green space                           information. We carefully selected eight metrics at the landscape
decreases with the distance from the boundary of the green                         level and seven metrics at the class level to characterize the
space and eventually reaches equilibrium with its surroundings.                    composition and configuration of the areas surrounding the
For each pocket green space, there may exist a relationship between                PGS and examine their impacts on PGS’ cooling effects. The
LCII and the cooling distance, and there may be several peaks along                eight metrics at the landscape level include patch density (PD),

Frontiers in Environmental Science | www.frontiersin.org                       5                                     May 2021 | Volume 9 | Article 657969
Wu et al. Pocket Green Space’s Cooling Effect
FIGURE 4 | The boxplot of mean LST for PGS dominant with different
FIGURE 3 | Relationship between the mean LST and the area of PGS. vegetation type (the dashed line is the mean value, the solid line is the median,
Tr., Sh. and Gr. represents PGS dominated with vegetation type of Tree,
Shrub and Grass, respectively).
edge density (ED), landscape shape index (LSI), aggregate index
(AI), mean Euclidean nearest neighbor distance (ENN_MN),
Contagion(CONTAG), Shannon’s diversity index (SHDI), and
TABLE 2 | Statistics of the cooling effect indicators of the 41 PGS selected in the
Shannon’s evenness index (SHEI), and the seven metrics at the
central urban area of Shanghai based on remotely sensed data from Landsat
class level are Percentage of landscape (PLAND), clumpiness 8 collected on August 3, 2015.
(CLUMPY), patch density (PD), edge density (ED), landscape
Max Min Mean SD
shape index (LSI), aggregate index (AI), mean Euclidean nearest
neighbor distance (ENN_MN). The description and calculation MLCII (°C) 3.6 −0.4 1.2 1.0
of the landscape metrics were listed in Supplementary Table S1. MCD (m) 213 22.6 132 58.1
These metrics are calculated based on the land-cover map using MCA (ha) 16.8 0.1 5.7 5.0
MCE 24.6 0.3 6.8 6.7
Fragstats version 4.2 (McGarigal et al., 2012).
Statistic Analysis Method
To quantify the relationships, the logarithmic regression analysis
was conducted to relate the area of PGS to its own land surface 3.5 ha, while the highest mean land surface temperature of PGS was
temperature, the maximum local cool island intensity, and the 39.6°C with the size of 0.6 ha. The average of the mean land surface
maximum cooling area as: temperature of all PGS was 37.6°C.
Y a + b × ln(X) (7) There is a negative relationship between the land surface
temperature of PGS and its area. The mean land surface
where Y is the mean LST, maximum local cool island intensity, or temperature of PGS decreased logarithmically with the
maximum cooling area of PGS, and X represents the area of PGS. increase of PGS area (Figure 3).
Pearson correlation analysis was used to measure the association It was shown that the mean LST varied with the PGS’s
between surrounding landscape patterns and the cooling effect of vegetation type (Figure 4). The tree-shrub type PGS had the
PGS. Pearson correlation analysis method requires the variables to lowest mean LST, followed by the shrub-grass type. Their mean
satisfy normal distribution, so the variable that did not follow normal LSTs were 36.6 and 37.8°C, respectively. The highest mean LST
distribution were transformed using logarithmic transformation. was occurred in the grass-type PGS.
These steps were done in SPSS software.
The Relationship Between the Landscape
RESULTS Features and Cooling Effect Indicators
of PGS
We found that the PGS’ maximum local cool island intensity
The Relationship Between the Landscape could range from −0.4 to 3.6°C with a mean of 1.2°C. The lower
Features and Land Surface Temperature bound is negative because there is three PGS functioning as heat
of PGS islands in the study area. The maximum cooling distance could
Among the 41 PGS, the lowest mean land surface temperature (LST) reach 213 m with a mean of 132 m. The maximum cooling areas
of pocket green space (PGS) was 35.2°C with an area of approximately varied from 0.1 to 16.8 ha, averaging 5.7 ha. In contrast, the
Frontiers in Environmental Science | www.frontiersin.org 6 May 2021 | Volume 9 | Article 657969Wu et al. Pocket Green Space’s Cooling Effect
FIGURE 5 | Relationship between the area and cooling effect indicators of PGS (the dash line in (A) means that parks above it have cooling effect, the dash line in (B)
indicates the mean value of Max. cooling distance).
maximum cooling efficiency varied greatly from less than 0.3 to an average of 86.7 m (SD 61.0 m). The order of MCD from large
24.6 times of the area of the PGS with a mean of 6.8 (Table 2). to small for PGS with different vegetation types was tree-shrub,
There was a significant relationship between the PGS area and tree, tree-shrub-grass, shrub-grass, tree-grass, and grass
its maximum local cool island intensity. The maximum local cool (Figure 6B). The tree-shrub-grass PGS had the largest MCA
island intensity increased logarithmically with the area with a mean of 8.2 ha (SD 5.4 ha), while the grass PGS had the
(Figure 5A). There were three PGS whose maximum local smallest MCA with an average of 1.7 ha (SD 1.1 ha). MCA for
cool island intensity was less than zero, meaning that they PGS with different vegetation types decreased sequentially in tree,
were hotter than the surroundings. There was no significant tree-shrub, tree-shrub-grass, tree-grass, shrub-grass, and grass
relationship between the PGS area and its maximum cooling (Figure 6C). For MCE, PGS with tree-shrub-grass and grass have
distance (Figure 5B). The maximum cooling distance of the the highest and lowest values at 11.5 (SD 9.2) and 4.2 (SD 3.8),
largest PGS was 190.5 m, and the largest maximum cooling respectively. MCE for PGS decreases with tree-shrub-grass, tree,
distance was 213 m and was observed in the PGS with an area tree-shrub, shrub-grass, tree-grass, and grass type (Figure 6D).
of 1.2 ha. The area of PGS had a significant impact on the Generally, the tree-shrub-grass was the best vegetation
maximum cooling area (Figure 5C). The maximum cooling composition that had the best cooling effect.
area increased with the PGS’ area, and a positive logarithmic
relationship existed between them. No significant statistical
relationship existed between the area of PGS and the maximum The Influence of Surrounding Landscape
cooling efficiency (Figure 5D). However, most PGS have cooling Pattern on the Cooling Effect of PGS
efficiencies that are more than five times their own area. The cooling effect of PGS were significantly affected by the
The dominant vegetation type in the PGS also influences the surrounding landscape pattern at the landscape level
cooling effect of the PGS (Figure 6). We found that tree-shrub (Table 3). Significant negative correlations were found
PGS has the highest MLCII with an average value of 2.1°C (SD between four cooling effect indicators of maximum local cool
0.8°C), and the grass PGS has the lowest MLCII at 0.8°C (SD island intensity (MLCII), maximum cooling distance (MCD),
0.5°C). The ranking of MLCII from high to low for PGS with maximum cooling area (MCA), maximum cooling efficiency
different vegetation types was tree-shrub, tree, tree-shrub-grass, (MCE), and patch density (PD) of the surrounding landscape.
shrub-grass, tree-grass, and grass type, respectively (Figure 6A). These relationships imply that the increasing landscape
Tree type of PGS had the largest MCD with an average value of fragmentation of the PGS surroundings would enhance the
152.8 m (SD 55.9 m), and grass type had the smallest MCD with LST, weakening the cooling effect of PGS. There were
Frontiers in Environmental Science | www.frontiersin.org 7 May 2021 | Volume 9 | Article 657969Wu et al. Pocket Green Space’s Cooling Effect FIGURE 6 | The boxplot of cooling effect indicators for PGS with different vegetation types (the dashed line is the mean value, the solid line is the median, Tr., Gr., Tr.Sh., Tr.Gr, Sh.Gr., Tr.Sh.Gr. represent the vegetation type of tree, grass, tree-shrub, tree-grass, shrub-grass, tree-shrub-grass, respectively). TABLE 3 | Pearson correlation coefficients between cooling effect indicators of PGS and landscape metrics at landscape scale. Indicators PD ED LSI ENN_MN CONTAG SHDI SHEI AI MLCII −0.441** 0.296 0.199 0.442** 0.240 −0.001 −0.238 0.088 MCD −0.469** 0.159 0.303 0.433* 0.128 0.016 −0.147 0.280 MCA −0.435* 0.260 0.316 0.368* 0.273 0.030 −0.256 0.134 MCE −0.344* 0.360* 0.383* 0.238 0.202 0.055 −0.216 0.046 Note: ** denotes significance at the 0.01 level (2-tailed), *at the 0.05 level (2-tailed). significant positive correlations between landscape shape index island intensity (MCLII) and maximum cooling efficiency (LSI), edge density (ED), and the MCE, indicating that the more (MCE). The landscape shape index (LSI) of green space was shape irregularity and complexity of surrounding landscape, the positively correlated to the four cooling effect indicators. The LSI better the cooling efficiency of PGS. Mean Euclidean nearest of built-up land also positively relate to the MCD and MCA. The neighbor distance (ENN_MN) of the surrounding landscape had mean Euclidean nearest neighbor distance (ENN_MN) of green significant positive influences on the MLCII, the MCD, and the land had impacts on the MCLII, and the same trend for the MCA. Thus, the farther away of the patches in the same land-cover ENN_MN of built-up land to MCD. The aggregate index (AI) type at the landscape level, the better the cooling effect of PGS is. and the clumpiness (CLUMPY) of the water body significantly The cooling effect of PGS was also affected by the landscape positively affected the MCD. In addition, the CLUMPY of built- patterns of surrounding land-cover types at the class level up land also positively impacted the MCD. (Table 4). Among the class level pattern metrics, patch density of all classes shows consistent negative effects on all PGS cooling indicators, although not all are statistically significant. There were DISCUSSION statistically significant negative correlations between the maximum cooling distance (MCD), the maximum cooling Influence of Landscape Features of PGS on area (MCA), and patch density (PD) of green and built-up its Surface Temperature per se land types, respectively. The PD of green and built-up land The PGS indeed could be cool islands and lower the urban land significantly negatively influenced the maximum local cool surface temperature. First, our results showed that the vast Frontiers in Environmental Science | www.frontiersin.org 8 May 2021 | Volume 9 | Article 657969
Wu et al.                                                                                                                                          Pocket Green Space’s Cooling Effect

TABLE 4 | Pearson correlation coefficients between cooling effect indicators of PGS and landscape metrics at class scale.

Indicators               LULC                PLAND                    PD                    ED                    LSI                ENN_MN                  CLUMPY                     AI

MLCII                    WA                  −0.119                 −0.383                −0.198               −0.011                  0.079                    0.108                 0.102
                         GR                  −0.020                −0.385*                0.169                0.550**                 0.432*                  −0.107                 −0.070
                         BL                  −0.023                 −0.321                0.154                 0.332                   0.201                   0.176                 −0.160
MCD                      WA                   0.341                 −0.188                0.225                 0.345                  −0.095                  0.458*                 0.462*
                         GR                  −0.131                −0.491**               0.039                0.669**                  0.341                   0.013                 −0.039
                         BL                   0.001                −0.625**               0.135                0.363*                  0.484*                  0.456**                0.009
MCA                      WA                   0.166                 −0.219                0.081                 0.213                  −0.080                   0.239                 0.239
                         GR                  −0.078                −0.402*                0.116                0.648**                  0.219                  −0.118                 −0.108
                         BL                  −0.019                −0.439**               0.172                0.411*                   0.229                   0.233                 −0.192
MCE                      WA                   0.231                 −0.036                0.188                 0.271                  −0.299                   0.089                 0.093
                         GR                  −0.157                 −0.227                0.207                0.559**                  0.248                  −0.170                 −0.227
                         BL                   0.093                −0.458**               0.300                 0.255                   0.118                   0.202                 -0.128

Note: ** denotes significance at the 0.01 level (2-tailed), *at the 0.05 level (2-tailed). WA, GR and BL represent water, greenspace and built-up land use around each sample of urban pocket
greenspace.

majority of the PGS (37 out of 41 PGS, or 90%) were cooler than                                   temperature within the PGS (Figure 4). The tree-shrub
their surroundings, and only two PGS with an area less than 1 ha                                  dominated PGS have the lowest surface temperature, followed
(accounting for 4.8%) were hotter than their surroundings. This                                   by the PGS with tree-grass, tree-shrub-grass, and tree-grass types
finding is similar to previous studies on urban parks, particularly                                with increasing temperature. PGS with the single vegetation type
in the summer daytime. For example, a study conducted in                                          exhibit relatively higher land surface temperature, suggesting that
Taipei, China, reported that most of 61 city parks were cooler                                    a composite vegetation within a PGS will be more effective in
than their surroundings, but nearly one-fifth of the parks were                                    lowering its LST than the ones with single vegetation type.
warmer than their surroundings due to more than 50% paved                                         Therefore, a composite vegetation composition for PGS should
coverage and low tree- and shrub-cover (Chang et al., 2007). A                                    be preferred by urban green landscape design when considering
study in Nagoya, Japan, showed that parks’ cool island intensity                                  its cooling effect.
varies with seasons, and most of the 92 sampled urban parks were
cooler than their urban surroundings in spring, summer, and
autumn. However, there nearly 21 parks in spring, 26 parks in                                     Influence of Landscape Features of PGS on
summer, and 32 parks in autumn appeared hotter than their                                         Cooling Effect
surroundings because the higher buildings’ shadow and higher                                      Urban green space can mitigate urban thermal environment
vegetation coverage resulted in lower LST of the surroundings                                     during the hot summer days (Maimaitiyiming et al., 2014;
(Cao et al., 2010). While in Shanghai, two of the 39 urban parks                                  Weber et al., 2014c; Zhou et al., 2017; Xiao et al., 2018; Cârlan
were warmer than their surroundings because of the disturbance                                    et al., 2020), however, most of the previous studies utilized single
from the nearby river and higher vegetation coverage (Cheng                                       indicator, i.e., local cool intensity, to measure the cooling effect of
et al., 2014). After careful examination of the two hot spot PGS                                  green spaces (Chang et al., 2007; Cao et al., 2010; Kong et al.,
that we encountered in this study, we found that they were located                                2014b). Our study utilized four cooling effect indicators proposed
near residential areas with higher green space coverage, which                                    by Cheng et al. (2014) to quantitatively measure the cooling effect
functions as a cool island, overwhelming the PGS’ cooling effects.                                of PGS. We found that PGS has considerable cooling effects at the
Therefore, The PGS were warmer than their surroundings.                                           local scale. The average maximum local cool island intensity of all
   Second, the LST of urban green space is affected by the                                        the 41 PGS examined in this study reached 1.2°C, which was
landscape components or composition, such as the vegetation                                       equivalent to that in urban parks in Nagoya, Japan (Cao et al.,
types and their coverage, and landscape configuration, such as                                     2010), but less than that (1.8°C) observed in urban green spaces in
area and shape etc. (Chang et al., 2007; Kong et al., 2014a). Our                                 Fuzhou, China (Yu et al., 2017), that (2.2°C) of urban green spaces
study confirmed these findings. The mean land surface                                               in Bengaluru, India (Shah et al., 2021), and that (3.0°C) of large
temperature of PGS decreased logarithmically with the area of                                     urban parks in Shanghai (Cheng et al., 2014). The maximum
PGS (Figure 3). This finding is very similar to the findings in                                     cooling distance could reach 213 m with an average of 132 m in
urban parks in Nagoya, Japan (Cao et al., 2010) and Shanghai,                                     our study (Table 2). The previous studies reported that the
China (Cheng et al., 2014), in which the park area could explain                                  average cooling distance could be 276.7 m for urban parks in
nearly 60 and 37% of the land surface temperature variations                                      Shanghai (Cheng et al., 2014), 104 m for urban green spaces in
within PGS, respectively. However, our results showed that the                                    Fuzhou (Yu et al., 2017), 347 m for urban green spaces in
PGS’ area only explained 31% of surface temperature variation,                                    Bengaluru, India (Shah et al., 2021). The maximum cooling
suggesting that the area of PGS cannot satisfactorily explain its                                 distance was estimated at 240 m in Addis Ababa, Ethiopia
LST, indicating more factors contribute to the LST of PGS due to                                  (Feyisa et al., 2014). The average maximum cooling area of
its small size. Our findings also showed that vegetation                                           PGS was 5.7 ha which was much greater than the area of PGS
components of PGS could influence the land surface                                                 themselves, but this was less than that of 46.5 ha observed in

Frontiers in Environmental Science | www.frontiersin.org                                      9                                                    May 2021 | Volume 9 | Article 657969
Wu et al. Pocket Green Space’s Cooling Effect
urban parks in Shanghai (Cheng et al., 2014). While the average We found that the surrounding landscape pattern could
cooling efficiency of PGS was 6.8, which is much larger than those significantly influence the cooling effect of green space. At the
of 1.36 and 2.54 observed in urban parks in Shenzhen (Peng et al., landscape level, the patch density and mean Euclidean nearest
2021) and Shanghai (Cheng et al., 2014), respectively. It is neighbor distance had significant impacts on the cooling effect of
important to note the much larger cooling efficiency of PGS PGS. Our results showed that increased shape complexity
compared to urban green space in general because the PGS can be indicated by landscape shape index and the isolation distance
easily imbedded in the high-density urban environment, between patches measured by the mean Euclidean nearest
enhancing its cooling efficiency. Overall, The PGS can neighbor distance within the nearby surroundings would
significantly and effectively lower the LST of their increase the cooling effect of PGS. In contrast, the cooling
surroundings, ameliorating urban thermal environment. effect would decrease with the increasing fragmentation of the
Previous studies demonstrated that land cover components nearby surroundings indicated by patch density. At the class level,
drove the variations of land surface temperature (Weng, 2009; the cooling effect of PGS was also significantly affected by patch
Buyantuyev et al., 2010). In addition, the composition/ density and landscape shape index of the surrounding landscape.
configuration of the urban landscape could greatly affect land The increase of the complexity of the shape of surrounding green
surface temperature (Zhou et al., 2011). Zhu et al. (2002) reported land would enhance the cooling effect of PGS. The results were
that the green space with shrub-grass or tree-grass composition consistent with the previous study. As the landscape shape of
had the best cooling effect in Harbin, China. The tree-covered natural or semi-natural green spaces, such as water bodies and
urban green space had a stronger cooling effect than the grass- green spaces, became more complex, it enhances the cooling
covered in both the Temperate Monsoon Climate and effect of urban parks (Cheng et al., 2014).
Mediterranean Climate (Yu et al., 2018b). Our result showed The landscape pattern of the surroundings of PGS influenced
that the cooling effect indicators were affected by the landscape the cooling effect of PGS may be due to the following
features of the PGS itself. For example, the maximum local cool mechanisms. First, our study using the local cool island
island intensity and maximum cooling area were logarithmically intensity concept to quantify the local cooling effect, which
increased with the area of PGS. The cooling effect was also greatly depends on the LST difference between the
influenced by vegetation types and their composition in the surroundings and PGS, while the surrounding landscape
PGS. For instance, the largest maximum cool island intensity pattern facilitates or impedes heat exchange, influencing the
occurred in the PGS dominated with the tree-shrub type, and the LST itself. Second, The previous studies demonstrated that the
PGS dominated with tree type had the longest maximum cooling ecological context of the surroundings, especially the climatic
distance, and the tree-shrub-grass possessed the largest cooling conditions (Wang et al., 2020), the shading, and transpiration
area and cooling efficiency. (Jiao et al., 2017) had significant effects on urban trees’ cooling
The tree-dominated vegetation composition exhibited better efficiency. Third, the landscape structure, such as edge complexity
cooling effect may be due to 1) tree-dominated vegetation and the wider street canyon, facilitates or impedes the energy
composition have a larger and thicker canopy, therefore, can exchanges between PGS and their surroundings, therefore,
provide more shading with higher evapotranspiration than those influencing the cooling effect of PGS (Yan et al., 2019).
of the other vegetation types; 2) the taller tree-dominated Further studies are needed to better quantify the impact of the
vegetation composition can effectively reduce wind speed and surrounding landscape pattern on the PGS cooling efficiency.
generate more eddies within the boundary layer to facilitate heat
dispersion, generating stronger cooling effect (Erell et al., 2011);
and 3) multiple vegetation types enhance the surface roughness, Implications and Limitations for Urban
providing greater cooling effect (Zhao et al., 2014). Planning
Nature-based solutions, such as natural systems agriculture,
ecosystem-based approach, green infrastructures, and their
The Impacts of the Surrounding Landscape combinations, are innovative approaches to ameliorate adverse
Pattern on the Cooling Effect of PGS environmental changes and hazards caused by human activities
The spatial pattern of the landscape can significantly affect the in the long term (Eggermont et al., 2015). Currently, urban green
land surface temperature (Li et al., 2011; Zhou et al., 2011). Most space is widely employed as a vital natural element in sustainable
previous studies revealed the relationship between the cooling urban development, as it could effectively improve urban local
effect of green space and the landscape pattern itself (Zhou et al., climate and outdoor thermal comfort (Erell, 2017; Andersson
2011; Kong et al., 2014a; Zhou et al., 2017). However, since the et al., 2019; Pauleit et al., 2019). Therefore, how to utilize the PGS
urban green space has been greatly promoted for mitigation of the to mitigate the urban thermal environment, especially through
local urban heat island, it is important to understand the impacts optimizing its vegetation composition in high-density urban
of the landscape composition and configuration in their areas, is very important.
surrounding landscape on the cooling effects. Recent studies This study identified some strong relationships between the
have demonstrated that the landscape pattern around the landscape patterns in the PGS surrounding areas and its cooling
green space significantly affects the cooling effect (Oliveira effect. It provides novel insights relevant to urban planning and
et al., 2011; Cheng et al., 2014). Our results also supported landscape design. Firstly, the cooling effect of PGS was
these findings for PGS at both landscape and class levels. particularly significantly influenced by its size, which explained
Frontiers in Environmental Science | www.frontiersin.org 10 May 2021 | Volume 9 | Article 657969Wu et al. Pocket Green Space’s Cooling Effect
30 and 26% variations in the maximum local cool island intensity et al., 2017), and to 50 m for urban wetlands (Sun et al., 2012). In
and maximum cooling area, respectively. Increasing the size of this study, we delineated 10 m width buffer rings around the PGS
the PGS would enhance its cooling effect. Secondly, the due to the small size of PGS and our intention to capture detailed
logarithmic relationship between the maximum local cooling landscape patterns in the surroundings of PGS. The small buffer
island intensity and the size of PGS means that there is a width may result in land surface temperature homogeneity for
certain threshold for the area of the PGS, exceeding which the some pixels across neighboring buffer rings, but it is able to
cooling efficiency would no longer increase much (Cheng et al., capture the horizontal variations of land surface temperature
2014; Yu et al., 2018a; Wu et al., 2019). Such a threshold value within a buffer ring.
should be highly valuable in design PGS in urban landscape Third, there are some residential areas surrounding some of
design for the economical use of green space. Due to space the selected PGS, within which vegetation cover can be high,
limitations in the high-density urban area, the construction of lowering the surface temperature of the surroundings. But the
large urban green spaces is unrealistic (Rotem-Mindali et al., residential areas are not designated as green space. Therefore,
2015). Thirdly, our result showed that tree-dominated composite some of the green space within the residential areas will
vegetation compositions, such as tree-shrub-grass, tree-shrub, inevitably interfere with the cooling effect of the PGS,
and tree-grass types, had a better cooling effect than non-tree leading to overestimate the cooling effect of PGS. But it is
vegetation and thus should be preferred for PGS (Zhang et al., difficult to separate the interference of the residential green
2017) to maximize its cooling effect. Lastly, the cooling effect of space from the cooling effects of PGS. In recent years, with the
the PGS was also affected by the surrounding landscape patterns. advent of Unmanned Aerial Vehicle (UAV) remote sensing, the
Thus, synergizing the effects of the green space and the UAV-borne very-high spatial resolution, hyperspectral and
surrounding landscape could optimize the mitigation effect of thermal images (Zarco-Tejada et al., 2012; Feng and Li,
PGS on urban surface heat islands. 2019; Schiefer et al., 2020), such as those used for grapevine
From the application perspective, our study used land surface (Maimaitiyiming et al., 2020), can be employed to characterize
temperature derived from remotely sensed data of Landsat 8, the detailed, diurnal real-time canopy and thermal information
which are now widely available free charge, and our threshold of PGS in the future.
concept and research approach could serve as a “template” to be
adopted for similar studies in large cities around the world. In
addition, the results could be valuable information for urban CONCLUSIONS
planning and management. In accordance with the New Leipzig
Charter as most current urban policy document of the European This paper investigated the cooling effect of PGS and its
Union, well-designed, managed, and connected urban green and influencing factors. We found that the vast majority of the
blue areas are a requirement for healthy living environments, PGS had a cooling effect on their surroundings. The area and
which help adapt to climate change, enable climate-neutral, vegetation types of the PGS could influence its cooling effects,
resilient, and environmentally sound urban development, and which were quantified by the maximum local cool island
improve air quality. The high pressure on land-use intensification intensity, maximum cooling distance, maximum cooling area,
in large cities around the world increases the importance of the and maximum cooling efficiency. The land surface temperature
PGS for their complex ecosystem services, such as UHI mitigation of PGS logarithmically decreased with its area and was also
and urban resilience enhancement. affected by the composition of vegetation types. The lowest
There were several limitations in our study that should require land surface temperature occurred in PGS with the tree-shrub
attention in the future. First, our study used the land surface composition.
temperature derived from Landsat 8 thermal band instead of the The maximum local cool island intensity could reach 3.6°C
traditional air temperature. Therefore, we could not capture and with an average of 1.2 °C, and the maximum cooling area could
evaluate the cooling effect of PGS at night. Although there are be as large as 5.7 ha on average, both of which increased
several satellites, such as MODIS, which provide nighttime land logarithmically with the area of PGS. The maximum cooling
surface temperature products, they cannot clearly identify the distance reached 132 m on average, while the maximum
thermal performance of our PGS due to their coarse spatial cooling efficiency was 6.8 times the size of PGS. The
resolutions. cooling effect was also affected by the vegetation type
Second, the original spatial resolution of the remote sensing within the PGS. Patch density in the surroundings of PGS
thermal image from Landsat 8 is 100 m and is relatively coarse for negatively correlated with cooling effect indicators.
exploring the cooling effect of PGS. Although the thermal image Landscape shape index and mean Euclidean nearest
was resampled to 30 m, it still has the following limitations: one is neighbor distance positively correlated with the cooling
that the PGS with areas less than 0.09 ha cannot be well effect, which demonstrated that fragmentation, connection,
delineated, and the other is that the PGS with areas less than and complexity of the surrounding landscape also played vital
0.09 ha, even larger than 0.09 ha, may manifest as a mixed pixel roles in affecting the cooling effect at class and landscape
on the thermal image, therefore, influencing the accuracy of their levels, respectively. Our findings provide novel and practical
LST estimation. A series of buffer widths were used to study the insights for urban landscape optimization in urban planning
cooling effect of urban green space, ranging from 20 m for urban and design in the early stage of park and neighborhood
parks (Cheng et al., 2014), to 30 m for urban green spaces (Yu development.
Frontiers in Environmental Science | www.frontiersin.org 11 May 2021 | Volume 9 | Article 657969Wu et al. Pocket Green Space’s Cooling Effect
DATA AVAILABILITY STATEMENT 32001162 to CWU, and Grant No. 31971485 to CWA).
Dagmar benefited from the GreenCityLabHue Project
The raw data supporting the conclusions of this article will be (FKZ 01LE 1910A) and the CLEARING HOUSE
made available by the corresponding author upon reasonable (Collaborative Learning in Research, Information-sharing
request. and Governance on How Urban forest-based solutions
support Sino-European urban futures) Horizon 2020
project (No. 821242). Dagmar further contributed to this
AUTHOR CONTRIBUTIONS paper as part of the EU Horizon 2020 project
CONNECTING Nature-COproductioN with NaturE for
JL and CWU conceived and designed the research, CWU and City Transitioning, Innovation and Governance (Project
CWA performed the research, CWU wrote the manuscript, JL, Number: 730222).
CS, DH, JB, and MF reviewed and edited the manuscript.
SUPPLEMENTARY MATERIAL
FUNDING
The Supplementary Material for this article can be found online at:
This research was partly supported by the Natural Science https://www.frontiersin.org/articles/10.3389/fenvs.2021.657969/
Foundation of China (Grant No. 31870453 to JL, Grant No. full#supplementary-material
Chander, G., Markham, B. L., and Helder, D. L. (2009). Summary of Current
REFERENCES Radiometric Calibration Coefficients for Landsat MSS, TM, ETM+, and EO-1
ALI Sensors. Remote Sensing Environ. 113 (5), 893–903. doi:10.1016/j.rse.2009.
Akbari, H., Levinson, R., and Berdahl, P. (2003). A Review of Methods for the 01.007
Manufacture of Residential Roofing Materials. Berkeley, CA: Lawrence Berkeley Chang, C.-R., Li, M.-H., and Chang, S.-D. (2007). A Preliminary Study on the Local
National Laboratory. Cool-Island Intensity of Taipei City parks. Landscape Urban Plann. 80 (4),
Amaya-Espinel, J. D., Hostetler, M., Henríquez, C., and Bonacic, C. (2019). The 386–395. doi:10.1016/j.landurbplan.2006.09.005
Influence of Building Density on Neotropical Bird Communities Found in Chen, M., Geng, F., Ma, L., Zhou, W., Shi, H., and Ma, J. (2013). Analysis on the
Small Urban parks. Landscape Urban Plann. 190, 103578. doi:10.1016/j. Heat Wave Events in Shanghai in Recent 138 Years. Plateau Meteorology 32 (2),
landurbplan.2019.05.009 2597–2607. doi:10.7522/j.issn.1000-0534.2012.00058
Andersson, E., Haase, D., Scheuer, S., and Wellmann, T. (2020). Neighbourhood Cheng, X., Wei, B., Chen, G., Li, J., and Song, C. (2014). Influence of Park Size
Character Affects the Spatial Extent and Magnitude of the Functional Footprint and its Surrounding Urban Landscape Patterns on the Park Cooling Effect.
of Urban green Infrastructure. Landscape Ecol. 35 (7), 1605–1618. doi:10.1007/ J. Urban Plann. Develop. 141 (3), A4014002. doi:10.1061/(ASCE)UP.1943-
s10980-020-01039-z 5444.0000256
Andersson, E., Langemeyer, J., Borgström, S., McPhearson, T., Haase, D., Cohen, D. A., Marsh, T., Williamson, S., Han, B., Derose, K. P., Golinelli, D., et al.
Kronenberg, J., et al. (2019). Enabling Green and Blue Infrastructure to (2014). The Potential for Pocket Parks to Increase Physical Activity. Am.
Improve Contributions to Human Well-Being and Equity in Urban J. Health Promot. 28 (3_Suppl. l), S19–S26. doi:10.4278/ajhp.130430-
Systems. BioScience 69 (7), 566–574. doi:10.1093/biosci/biz058 QUAN-213
Armato, F. (2017). Pocket Park: Product Urban Design. Des. J. 20 (Suppl. 1), Currie, M. A. (2017). A Design Framework for Small parks in Ultra-urban,
S1869–S1878. doi:10.1080/14606925.2017.1352705 Metropolitan, Suburban and Small Town Settings. J. Urban Des. 22 (1),
Artis, D. A., and Carnahan, W. H. (1982). Survey of Emissivity Variability in 76–95. doi:10.1080/13574809.2016.1234334
Thermography of Urban Areas. Remote Sensing Environ. 12 (4), 313–329. Danford, R. S., Strohbach, M. W., Warren, P. S., and Ryan, R. L. (2018). Active
doi:10.1016/0034-4257(82)90043-8 Greening or Rewilding the City: How Does the Intention behind Small Pockets
Balai Kerishnan, P., Maruthaveeran, S., and Maulan, S. (2020). Investigating the of Urban green Affect Use? Urban For. Urban Green. 29, 377–383. doi:10.1016/
Usability Pattern and Constraints of Pocket parks in Kuala Lumpur, Malaysia. j.ufug.2017.11.014
Urban For. Urban Green. 50, 126647. doi:10.1016/j.ufug.2020.126647 Dong, J., Peng, J., He, X., Corcoran, J., Qiu, S., and Wang, X. (2020). Heatwave-
Borland, J. (2019). Small parks, Big Designs: Reconstructed Tokyo’s New green induced Human Health Risk Assessment in Megacities Based on Heat Stress-
Spaces, 1923-1931. Urban Hist. 47 (1), 106–125. doi:10.1017/ Social Vulnerability-Human Exposure Framework. Landscape Urban Plann.
S0963926819000567 203, 103907. doi:10.1016/j.landurbplan.2020.103907
Buyantuyev, A., Wu, J., and Gries, C. (2010). Multiscale Analysis of the Eggermont, H., Balian, E., Azevedo, J. M. N., Beumer, V., Brodin, T., Claudet, J.,
Urbanization Pattern of the Phoenix Metropolitan Landscape of USA: Time, et al. (2015). Nature-based Solutions: New Influence for Environmental
Space and Thematic Resolution. Landscape Urban Plann. 94 (3-4), 206–217. Management and Research in Europe. GAIA - Ecol. Perspect. Sci. Soc. 24
doi:10.1016/j.landurbplan.2009.10.005 (4), 243–248. doi:10.14512/gaia.24.4.9
Cao, X., Onishi, A., Chen, J., and Imura, H. (2010). Quantifying the Cool Erell, E., Pearlmutter, D., and Williamson, T. (2011). Urban Microclimate:
Island Intensity of Urban parks Using ASTER and IKONOS Data. Designing the Spaces between Buildings. London: Routledge.
Landscape Urban Plann. 96 (4), 224–231. doi:10.1016/j.landurbplan. Erell, E. (2017). “Urban Greening and Microclimate Modification,” in Greening
2010.03.008 Cities. Editors P. Y. Tan and C. Y. Jim (Singapore: Springer), 73–93. doi:10.
Cârlan, I., Haase, D., Große-Stoltenberg, A., and Sandric, I. (2020). Mapping Heat 1007/978-981-10-4113-6_4
and Traffic Stress of Urban Park Vegetation Based on Satellite Imagery - A Feng, X., and Li, P. (2019). A Tree Species Mapping Method from UAV Images
Comparison of Bucharest, Romania and Leipzig, Germany. Urban Ecosyst. 23 over Urban Area Using Similarity in Tree-Crown Object Histograms. Remote
(2), 363–377. doi:10.1007/s11252-019-00916-z Sensing 11 (17), 1982. doi:10.3390/rs11171982
Chan, E. Y. Y., Goggins, W. B., Kim, J. J., and Griffiths, S. M. (2012). A Study of Ferrari, B., Quatrini, V., Barbati, A., Corona, P., Masini, E., and Russo, D. (2019).
Intracity Variation of Temperature-Related Mortality and Socioeconomic Conservation and Enhancement of the green Infrastructure as a Nature-Based
Status Among the Chinese Population in Hong Kong. J. Epidemiol. Solution for Rome’s Sustainable Development. Urban Ecosyst. 22 (5), 865–878.
Community Health 66 (4), 322–327. doi:10.1136/jech.2008.085167 doi:10.1007/s11252-019-00868-4
Frontiers in Environmental Science | www.frontiersin.org 12 May 2021 | Volume 9 | Article 657969Wu et al. Pocket Green Space’s Cooling Effect
Feyisa, G. L., Dons, K., and Meilby, H. (2014). Efficiency of parks in Mitigating Lin, P., Lau, S. S. Y., Qin, H., and Gou, Z. (2017). Effects of Urban Planning
Urban Heat Island Effect: An Example from Addis Ababa. Landscape Urban Indicators on Urban Heat Island: a Case Study of Pocket parks in High-Rise
Plann. 123, 87–95. doi:10.1016/j.landurbplan.2013.12.008 High-Density Environment. Landscape Urban Plann. 168, 48–60. doi:10.1016/j.
Gabriel, K. M. A., and Endlicher, W. R. (2011). Urban and Rural Mortality Rates landurbplan.2017.09.024
during Heat Waves in Berlin and Brandenburg, Germany. Environ. Pollut. 159 Lin, W., Chen, Q., Jiang, M., Zhang, X., Liu, Z., Tao, J., et al. (2019). The Effect of
(8), 2044–2050. doi:10.1016/j.envpol.2011.01.016 green Space Behaviour and Per Capita Area in Small Urban green Spaces on
Gibson, H., and Canfield, J. (2016). Pocket parks as Community Building Blocks: A Psychophysiological Responses. Landscape Urban Plann. 192, 103637. doi:10.
Focus on Stapleton, CO. Community Develop. 47 (5), 732–745. doi:10.1080/ 1016/j.landurbplan.2019.103637
15575330.2016.1220965 Lin, W., Yu, T., Chang, X., Wu, W., and Zhang, Y. (2015). Calculating Cooling
Grimm, N. B., Faeth, S. H., Golubiewski, N. E., Redman, C. L., Wu, J., Bai, X., et al. Extents of green parks Using Remote Sensing: Method and Test. Landscape
(2008). Global Change and the Ecology of Cities. Science 319 (5864), 756–760. Urban Plann. 134, 66–75. doi:10.1016/j.landurbplan.2014.10.012
doi:10.1126/science.1150195 Maimaitiyiming, M., Ghulam, A., Tiyip, T., Pla, F., Latorre-Carmona, P., Halik, Ü.,
Haase, D. (2021). “Integrating Ecosystem Services, Green Infrastructure and et al. (2014). Effects of green Space Spatial Pattern on Land Surface
Nature-Based Solutions-New Perspectives in Sustainable Urban Land Temperature: Implications for Sustainable Urban Planning and Climate
Management,” in Sustainable Land Management in a European Context: A Change Adaptation. ISPRS J. Photogrammetry Remote Sensing 89, 59–66.
Co-design Approach. Editors T. Weith, T. Barkmann, N. Gaasch, S. Rogga, doi:10.1016/j.isprsjprs.2013.12.010
C. Strauß, and J. Zscheischler (Cham: Springer International Publishing), Maimaitiyiming, M., Sagan, V., Sidike, P., Maimaitijiang, M., Miller, A. J., and
305–318. doi:10.1007/978-3-030-50841-8_16 Kwasniewski, M. (2020). Leveraging Very-High Spatial Resolution
Harlan, S. L., Brazel, A. J., Prashad, L., Stefanov, W. L., and Larsen, L. (2006). Hyperspectral and Thermal UAV Imageries for Characterizing Diurnal
Neighborhood Microclimates and Vulnerability to Heat Stress. Soc. Sci. Med. 63 Indicators of Grapevine Physiology. Remote Sensing 12 (19), 3216. doi:10.
(11), 2847–2863. doi:10.1016/j.socscimed.2006.07.030 3390/rs12193216
Harlan, S. L., and Ruddell, D. M. (2011). Climate Change and Health in Cities: Masoudi, M., and Tan, P. Y. (2019). Multi-year Comparison of the Effects of Spatial
Impacts of Heat and Air Pollution and Potential Co-benefits from Mitigation Pattern of Urban green Spaces on Urban Land Surface Temperature. Landscape
and Adaptation. Curr. Opin. Environ. Sustainability 3 (3), 126–134. doi:10. Urban Plann. 184, 44–58. doi:10.1016/j.landurbplan.2018.10.023
1016/j.cosust.2011.01.001 McGarigal, K., Cushman, S. A., and Ene, E. (2012). FRAGSTATS V4: Spatial
Hu, Y. (2018). “A Novel Planning of Vest-Pocket Park in Historic Urban Area in Pattern Analysis Program for Categorical and Continuous Maps. Amherst:
Metropolis: A Case Study of Beijing,” in Green Intelligent Transportation University of Massachusetts.
Systems. Editors W. Wang, K. Bengler, and X. Jiang (Singapore: Springer Morini, E., Castellani, B., De Ciantis, S., Anderini, E., and Rossi, F. (2018). Planning
Singapore), 1035–1053. for Cooler Urban Canyons: Comparative Analysis of the Influence of Façades
Ikin, K., Beaty, R. M., Lindenmayer, D. B., Knight, E., Fischer, J., and Manning, A. Reflective Properties on Urban canyon thermal Behavior. Solar Energy 162,
D. (2013). Pocket parks in a Compact City: How Do Birds Respond to 14–27. doi:10.1016/j.solener.2017.12.064
Increasing Residential Density?. Landscape Ecol. 28 (1), 45–56. doi:10.1007/ Motazedian, A., Coutts, A. M., and Tapper, N. J. (2020). The Microclimatic
s10980-012-9811-7 Interaction of a Small Urban Park in central Melbourne with its
Jaganmohan, M., Knapp, S., Buchmann, C. M., and Schwarz, N. (2016). The Bigger, Surrounding Urban Environment during Heat Events. Urban For. Urban
the Better? the Influence of Urban green Space Design on Cooling Effects for Green. 52, 126688. doi:10.1016/j.ufug.2020.126688
Residential Areas. J. Environ. Qual. 45 (1), 134–145. doi:10.2134/jeq2015.01. Nordh, H., and Østby, K. (2013). Pocket parks for People - A Study of Park Design
0062 and Use. Urban For. Urban Green. 12 (1), 12–17. doi:10.1016/j.ufug.2012.
Jasmani, Z., Ravn, H. P., and van den Bosch, C. C. K. (2017). The Influence of Small 11.003
Urban parks Characteristics on Bird Diversity: A Case Study of Petaling Jaya, Norton, B. A., Coutts, A. M., Livesley, S. J., Harris, R. J., Hunter, A. M., and
Malaysia. Urban Ecosyst. 20 (1), 227–243. doi:10.1007/s11252-016-0584-7 Williams, N. S. G. (2015). Planning for Cooler Cities: A Framework to Prioritise
Jiao, M., Zhou, W., Zheng, Z., Wang, J., and Qian, Y. (2017). Patch Size of Trees green Infrastructure to Mitigate High Temperatures in Urban Landscapes.
Affects its Cooling Effectiveness: A Perspective from Shading and Transpiration Landscape Urban Plann. 134, 127–138. doi:10.1016/j.landurbplan.2014.10.018
Processes. Agric. For. Meteorology 247, 293–299. doi:10.1016/j.agrformet.2017. Oke, T. (1982). The Energetic Basic of the Urban Heat Island. Q. J. R. Meteorol. Soc.
08.013 108 (455), 1–24. doi:10.1002/qj.4971084550210.1256/smsqj.45501
Kong, F., Yin, H., James, P., Hutyra, L. R., and He, H. S. (2014a). Effects of Spatial Oliveira, S., Andrade, H., and Vaz, T. (2011). The Cooling Effect of green Spaces as
Pattern of Greenspace on Urban Cooling in a Large Metropolitan Area of a Contribution to the Mitigation of Urban Heat: A Case Study in Lisbon.
Eastern China. Landscape Urban Plann. 128, 35–47. doi:10.1016/j.landurbplan. Building Environ. 46 (11), 2186–2194. doi:10.1016/j.buildenv.2011.04.034
2014.04.018 Park, J., Kim, J.-H., Lee, D. K., Park, C. Y., and Jeong, S. G. (2017). The Influence of
Kong, F., Yin, H., Wang, C., Cavan, G., and James, P. (2014b). A Satellite Image- Small green Space Type and Structure at the Street Level on Urban Heat Island
Based Analysis of Factors Contributing to the green-space Cool Island Intensity Mitigation. Urban For. Urban Green. 21, 203–212. doi:10.1016/j.ufug.2016.
on a City Scale. Urban For. Urban Green. 13 (4), 846–853. doi:10.1016/j.ufug. 12.005
2014.09.009 Pauleit, S., Andersson, E., Anton, B., Buijs, A., Haase, D., Hansen, R., et al. (2019).
Labuz, R. (2019). Pocket Park - A New Type of Green Public Space in Kraków Urban green Infrastructure - Connecting People and Nature for Sustainable
(Poland). IOP Conf. Ser. Mater. Sci. Eng. 471, 112018. doi:10.1088/1757-899x/ Cities. Urban For. Urban Green. 40, 1–3. doi:10.1016/j.ufug.2019.04.007
471/11/112018 Peng, J., Dan, Y., Qiao, R., Liu, Y., Dong, J., and Wu, J. (2021). How to Quantify the
Lau, S. S., Lin, P., and Qin, H. (2012). A Preliminary Study on Environmental Cooling Effect of Urban parks? Linking Maximum and Accumulation
Performances of Pocket parks in High-Rise and High-Density Urban Context Perspectives. Remote Sensing Environ. 252, 112135. doi:10.1016/j.rse.2020.
in Hong Kong. Int. J. Low-carbon Tech. 7 (3), 215–225. doi:10.1093/ijlct/cts033 112135
Li, H., and Wu, J. (2004). Use and Misuse of Landscape Indices. Landscape Ecol. 19 Peschardt, K. K., Schipperijn, J., and Stigsdotter, U. K. (2012). Use of Small Public
(4), 389–399. doi:10.1023/B:LAND.0000030441.15628.d6 Urban Green Spaces (SPUGS). Urban For. Urban Green. 11 (3), 235–244.
Li, J., Song, C., Cao, L., Zhu, F., Meng, X., and Wu, J. (2011). Impacts of doi:10.1016/j.ufug.2012.04.002
Landscape Structure on Surface Urban Heat Islands: A Case Study of Peschardt, K. K., and Stigsdotter, U. K. (2013). Associations between Park
Shanghai, China. Remote Sensing Environ. 115 (12), 3249–3263. doi:10. Characteristics and Perceived Restorativeness of Small Public Urban green
1016/j.rse.2011.07.008 Spaces. Landscape Urban Plann. 112, 26–39. doi:10.1016/j.landurbplan.2012.
Lin, B.-S., and Lin, Y.-J. (2010). Cooling Effect of Shade Trees with Different 12.013
Characteristics in a Subtropical Urban Park. HortScience: a Publ. Am. Soc. Peschardt, K. K., Stigsdotter, U. K., and Schipperrijn, J. (2016). Identifying Features
Hortic. Sci. 45 (1), 83–86. doi:10.1590/S0102-0536201000010002410.21273/ of Pocket Parks that May Be Related to Health Promoting Use. Landscape Res.
hortsci.45.1.83 41 (1), 79–94. doi:10.1080/01426397.2014.894006
Frontiers in Environmental Science | www.frontiersin.org 13 May 2021 | Volume 9 | Article 657969You can also read