WHERE SHOULD ALL THE TREES GO? - 20% MORE GREEN SPACES IN URBAN AREAS BY 2020 - Greener Spaces Better Places

Page created by Joel Figueroa
 
CONTINUE READING
WHERE SHOULD ALL THE TREES GO? - 20% MORE GREEN SPACES IN URBAN AREAS BY 2020 - Greener Spaces Better Places
WHERE SHOULD
ALL THE TREES GO?

                               Kings Park, Perth
      20% MORE GREEN SPACES
      IN URBAN AREAS BY 2020
WHERE SHOULD ALL THE TREES GO? - 20% MORE GREEN SPACES IN URBAN AREAS BY 2020 - Greener Spaces Better Places
WHAT IS THIS REPORT?
                                        In 2013, the 202020 Vision released
                                        ‘Where are all the trees?’, Australia’s first
                                        national benchmark of urban canopy cover.
                                        This is the next generation of that report.
                                            Like the original, it maps 139 local
                                             governments, providing updated
                                             snapshots of urban canopy cover.

                                      Download it from 202020vision.com.au
                                        1

                           2013                                                         2017

                                                                                          The updated ‘Where should all the trees
                                                                                          go?’ report extends the original report to
  CREDITS & AUTHORSHIP                                                                    measure overall vulnerability based on heat
                                                                                          mapping and socio-demographic data.
  This document is based in its entirety on:
  Amati, M. Boruff, B. Caccetta, P. Devereux,
                                                                                          Research is then enriched with council
  D. Kaspar, J. Phelan K. and Saunders, A. (2017).                                        conversations to create a holistic
  Where should all the trees go? Investigating the impact of tree                         understanding of contributing factors.
  canopy cover on socio-economic status and wellbeing in LGA’s
  prepared for Hort Innovation by the Centre for Urban Research,
                                                                                           In doing so, this report seeks to build on
  RMIT University.                                                                         the question, ‘Where are all the trees?’, to
                                                                                           find out ‘Where should all the trees go?’.
WHERE SHOULD ALL THE TREES GO?                                                                                                            2
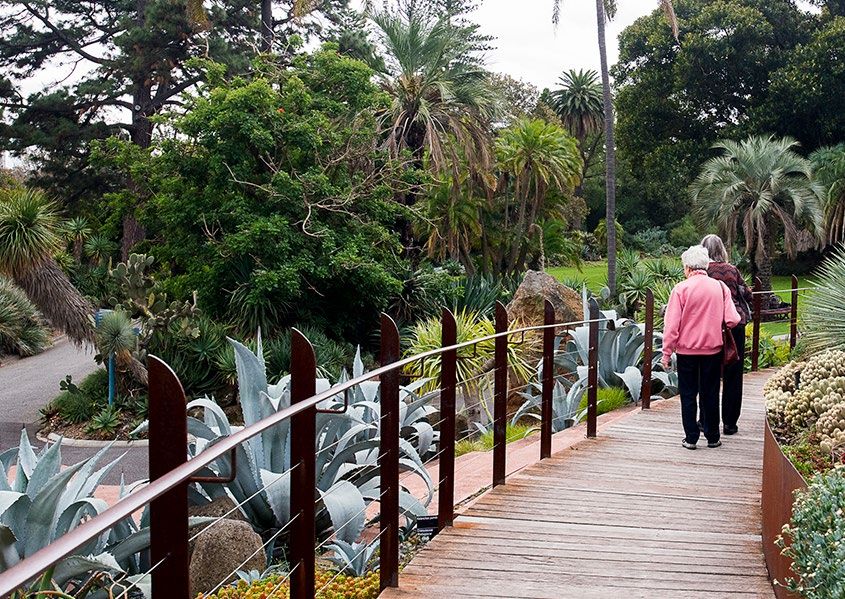
WHERE SHOULD ALL THE TREES GO? - 20% MORE GREEN SPACES IN URBAN AREAS BY 2020 - Greener Spaces Better Places
NATIONAL
OVERVIEW      04    STATE BY
                    STATE           13

               CONTENTS

ABOUT THE
METHODOLOGY   89    ABOUT THE
                    202020 VISION   97
WHERE SHOULD ALL THE TREES GO? - 20% MORE GREEN SPACES IN URBAN AREAS BY 2020 - Greener Spaces Better Places
NATIONAL OVERVIEW

            Australia,               But most people live                          We need to put                               But where should
        it’s a big place.             in a small part of it.                     green space where                               all the trees go?
                                                                                  it’s most needed.

                                                89.5%
         7.692                                 people live in around

      million km2                                  10%
                                                  of the country

                                                      That’s

                                        21.6 million
             Habitable land:                                                        We do this by understanding where        We asked RMIT to identify the urban areas

    768,685 km                   2
                                     people in cities and surrounding suburbs.
                                                                                 it’s being lost, where it’s hot and where
                                                                                          people will benefit most.
                                                                                                                             that would most benefit from more green
                                                                                                                                  space. Here’s what they told us…

                                                                                                                                                                         Canberra Nara Peace Park
WHERE SHOULD ALL THE TREES GO?                                                                                                                                           4
WHERE SHOULD ALL THE TREES GO? - 20% MORE GREEN SPACES IN URBAN AREAS BY 2020 - Greener Spaces Better Places
Our method:

THE VHHEDA                                                                                                            WANT TO KNOW HOW THIS
                                                                                                                         WAS DEVELOPED?

VULNERABILITY
                                                                                                                      Head to our Methodology chapter.

INDEX                                                                           3                              2

(Vulnerability to Heat, poor Health, Economic
Disadvantage and Access to green spaces)

                                                          4                                                                              1
A brand new tool that measures
the vulnerability of an area
based on:
Heat: On the hottest days, how
hot does this area get?
Health: Are people in the area
healthy and able to cope with
prolonged, increased heat?
Trends: Is the area currently
losing, gaining or retaining its
                                                   5                                                                                              0
green space?                                           LEAST                                                                MOST
                                                       VULNERABLE                                                     VULNERABLE
                                                       The higher an area’s                                                    The lower the
                                                       vulnerability rating,                                                number, the more
                                                       the better able it is                                                     vulnerable.
                                                       to cope.                 So where should all the trees go?
                                                                               In the most vulnerable places first.

WHERE SHOULD ALL THE TREES GO? NATIONAL OVERVIEW                                                                                                         5
WHERE SHOULD ALL THE TREES GO? - 20% MORE GREEN SPACES IN URBAN AREAS BY 2020 - Greener Spaces Better Places
VULNERABILITY BY STATE

                                                                                          2.54 Rating
                                                                    2.72 Rating           Victoria           2.25 Rating
                                                                    New South Wales
                                                                                                        Northern Territory

                                                           2.88 Rating                                                2.11 Rating
                                                           Western Australia                                        South Australia

                                                2.9 Rating
                                                Queensland                                                              2.1 Rating
                                                                                                                         Tasmania
                                     3.5 Rating
                                     Australian Capital Territory

                   5                                4                                 3            2                                  1

          LEAST                                                                                                          MOST
       VULNERABLE                                                                                                     VULNERABLE

WHERE SHOULD ALL THE TREES GO? NATIONAL OVERVIEW                                                                                          6
WHERE SHOULD ALL THE TREES GO? - 20% MORE GREEN SPACES IN URBAN AREAS BY 2020 - Greener Spaces Better Places
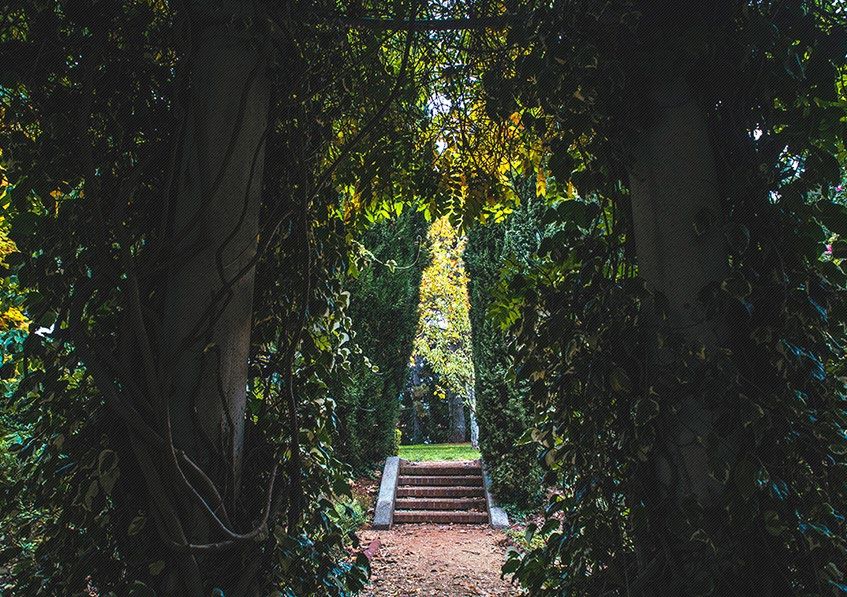
VULNERABILITY BY LGA

4.5 Rating                  4.0 Rating                   3.5 Rating                  3.0 Rating                   2.5 Rating                2.0 Rating                        1.5 Rating                   1.0 Rating            0.5 Rating
Hornsby Shire               Municipality of Lane Cove    Municipality of             Camden Council               City of Hurstville        Municipality of Ashfield          Auburn City                  City of Blacktown     City of Ballarat
Ku-ring-gai Council         Municipality of Leichhardt   Hunter’s Hill               City of Sydney               City of Penrith           Burwood Council                   Bankstown City               City of Botany Bay    City of Darebin
Municipality of Mosman      North Sydney Council         City of Kogarah             City of Banyule              City of Randwick          City of Canada Bay                City of Campbelltown (NSW)   City of Canterbury    City of Hume
Municipality of Woollahra   Sutherland Shire             Manly Council               City of Casey                City of Glen Eira         Marrickville Council              Fairfield City               City of Holroyd       City of Charles Sturt
City of Bayside (VIC)       City of Willoughby           Pittwater Council           City of Maroondah            City of Kingston          City of Newcastle                 City of Liverpool            Rockdale City         Town of Gawler

City of Knox                City of Manningham           City of Ryde                City of Port Phillip         City of Stonnington       City of Parramatta                City of Frankston            City of Brimbank      City of Playford

Shire of Nillumbik          City of Whitehorse           The Hills Shire             Moreton Bay Region           Cairns Regional Council   Municipality of Strathfield       City of Greater Bendigo      City of Maribyrnong   City of Port
                                                         Warringah Council                                                                                                                                                       Adelaide Enfield
Shire of Yarra Ranges       City of Yarra                                            Sunshine Coast               City of Norwood           City of Moonee Valley             City of Greater Dandenong    City of Moreland
                                                         Waverley Council                                         Payneham & St Peters                                                                                           City of West Torrens
City of Adelaide            City of Brisbane                                         City of Unley                                          City of Whittlesea                City of Greater Geelong      City of Marion
                                                         City of Boroondara                                       City of Prospect                                                                                               City of Belmont
City of Mitcham             City of Burnside                                         Town of Walkerville                                    City of Wyndham                   City of Hobsons Bay          City of Salisbury
City of Tea Tree Gully      City of Canning              Shire of Cardinia           City of Bayswater            City of Armadale          City of Ipswich                   City of Melton               City of Kwinana
Town of Claremont           Town of Cottesloe            City of Melbourne           Town of Cambridge            City of Fremantle         Logan City                        Adelaide Hills Council       City of Launceston
                            Shire of Kalamunda           City of Monash              Town of East Fremantle       City of Gosnells          Toowoomba Regional                City of Onkaparinga
                            Shire of Mundaring           Shire of Mornington         City of Melville             City of Perth             Council                           City of Cockburn
                                                         Peninsula                                                City of Rockingham        City of Campbelltown (SA)
                            Shire of Peppermint Grove                                City of Stirling                                                                         Town of Victoria Park
                                                         Gold Coast City                                          City of Palmerston        City of Holdfast Bay
                                                                                     Kingborough Council                                                                      City of Clarence
                                                         Redland City                                                                       Town of Bassendean                City of Glenorchy
                                                         Townsville City Council                                                            Town of Swan
                                                         City of Joondalup                                                                  City of Wanneroo
                                                         Town of Mosman Park                                                                City of Darwin
                                                         City of Nedlands
                                                         City of South Perth
                                                         City of Subiaco
                                                         City of Vincent                                      3                             2
                                                         City of Hobart
                                                         ACT

                                                                                     4                                                                                    1

                                                                                                                                                                                                    START GREENING
                                                                             5                                                                                                      0             OPPORTUNITIES HERE

                                                                                   LEAST                                                                 MOST
WHERE SHOULD ALL THE TREES GO? NATIONAL OVERVIEW
                                                                                   VULNERABLE                                                      VULNERABLE                                                                                            7
WHERE SHOULD ALL THE TREES GO? - 20% MORE GREEN SPACES IN URBAN AREAS BY 2020 - Greener Spaces Better Places
TOP 50 GREENING OPPORTUNITIES IN AUSTRALIA
(BASED ON THE VHHEDA INDEX)

                                         City of Darwin

                                                                                                              Toowoomba
                                                                                                              Regional Council,
                                                                                                              Logan City Council,
                                                                                                              Ipswich City Council
           City of Belmont,
           City of Kwinana,
          City of Cockburn,                                                                                   Blacktown City Council,
  The Town of Victoria Park,                                                                                  City of Botany Bay,
       Town of Bassendean,                                                                                    City of Canterbury Bankstown,
               City of Swan,                                                                                  Holroyd City Council,
          City of Wanneroo                                                                                    Rockdale City Council,
                                                                                                              City of Auburn,
                                                                                                              Bankstown City Council,
                                                                                                              Campbelltown City Council,
                                                          City of Greater Bendigo                             Fairfield City Council,
                                                                                           City of Ballarat   Liverpool City Council
                                                          City of Greater Geelong

                                                                                                              City of Darebin,
                                                                                                              City of Brimbank,
                                                                                                              Maribyrnong City Council,
                                                                    City of Launceston
                                                                                                              Moreland City Council,
                                                                  Clarence City Council,                      Frankston City Council,
                                                                  Glenorchy City Council                      City of Greater Dandenong,
                                                                                                              Hobsons Bay City Council,
                                                                                                              Moonee Valley City Council,
                                                                                                              Whittlesea Council,
                                                                                                              Wyndham City Council

WHERE SHOULD ALL THE TREES GO? NATIONAL OVERVIEW                                                                                            8
WHERE SHOULD ALL THE TREES GO? - 20% MORE GREEN SPACES IN URBAN AREAS BY 2020 - Greener Spaces Better Places
CURRENT GREEN COVER
NT                                                                                   QLD
                                                                                                          National urban average comparison
24.4%
hard surface cover
                                                                                     9.9%
                                                                                     hard surface cover

75.5%
green cover
                                                                                     90.1%
                                                                                     green cover                           37.1 %
                                                                                                                            hard surface
 + 6.35% increase                                                                     + 1.79% increase
 in hard surface*                                                                     in hard surface*

                                                                                                                                           24.6 %
                                                                                                              31.5 %                       tree canopy
                                                                                                                                              cover
                                                                                                              grass cover
WA                                                                                   NSW

41.22%                                                                               42.79%
hard surface cover                                                                   hard surface cover                                  6.7 %
58.78%
green cover
                                                                                     57.21%
                                                                                     green cover
                                                                                                                                         shrub

                                                                                                          In ‘Where are all the trees’, the national average was
 + 2.09% increase                                                                     + 3.01% increase    calculated by averaging the state averages. In this report
 in hard surface*                                                                     in hard surface*    we have chosen to update the methodology to make the
                                                                                                          national average an average of all LGAs, as we believe it
                                                                                                          more accurately represents the true figure.

SA                                         VIC                                       ACT

43.2%                                      37.26%                                    7.4%
                                                                                     hard surface cover
hard surface cover                         hard surface cover   TAS
56.8%                                      62.74%                                    92.6%
                                                                9.96%                green cover

                                                                                                              79%                                 3.2%
green cover                                 green cover
                                                                hard surface cover
 + 2.57% increase                                                                     + 2.2% increase

                                                                90.04%
                                             + 3.01% increase
                                                                                      in hard surface*      Highest tree                          Lowest tree
 in hard surface*                            in hard surface*
                                                                                                              canopy                                canopy
                                                                green cover

*changes represented since 2009                                  + 0.82% increase
                                                                 in hard surface*
WHERE SHOULD ALL THE TREES GO? NATIONAL OVERVIEW                                                                                                                       9
WHERE SHOULD ALL THE TREES GO? - 20% MORE GREEN SPACES IN URBAN AREAS BY 2020 - Greener Spaces Better Places
WHAT’S CHANGED?
2009 TO 2017

  CANOPY
  COVER                                               35%
                                               of councils have undergone
                                                                                61%
                                                                             of councils have had
                                                                                                                    4%
                                                                                                            of councils have undergone
                                                   a significant decline.   no significant change.              a significant increase.

  SHRUB
  COVER                                                16%
                                               of councils have undergone
                                                                                67%
                                                                             of councils have had
                                                                                                                   17%
                                                                                                            of councils have undergone
                                                   a significant decline.   no significant change.              a significant increase.

  HARD
  SURFACES                                           ZERO                             34%
                                                   councils have seen a       of councils have undergone
                                                    significant decline.          a significant increase.

WHERE SHOULD ALL THE TREES GO? NATIONAL OVERVIEW                                                                                          10
COUNCIL     BYnational
1.2 Figures for COUNCILcanopy and green cover change                                                                             HI-RESOLUTION
                                                                                                                                 Zoom for detail.

                                       NATIONAL CHANGE IN URBAN FOREST AND SHRUB CANOPY COVER 2008-2013 TO 2016

     Prepared by Marco Amati

              Figure 16: Changes in Canopy and Shrubs for all LGAs in the study 2008-2013 – 2016
                                                                                                              TREE DIFFERENCE         SHRUB DIFFERENCE

     Prepared by Marco Amati    NATIONAL GAIN AND LOSS IN GREEN COVER IN AUSTRALIA METROPOLITAN AREAS 2008-2013 TO 2016

               Figure 16: Changes in Canopy and Shrubs for all LGAs in the study 2008-2013 – 2016

                                                                                                              SIGNIFICANT LOSS

WHERE SHOULD ALL THE TREES GO? NATIONAL OVERVIEW                                                                                                         11
     Prepared by Marco Amati
KEY TAKE-AWAYS

  THE GOOD NEWS:                                                                            THE BAD NEWS:

                                                                                            Nationally, tree canopy and
                                                                                            shrub cover has dropped by
                                                                                            2.1% over the past four years.

                                                                                            That’s 4,041 km2, or 161,860
                                                                                            Melbourne Cricket Grounds
                                                                                            of urban green space.
             A majority of councils                   Nationally, shrubbery decline
      have not experienced a significant           is only half of tree canopy decline.
    increase in hard surface cover or loss       As shrubs grow, they may compensate
        of tree canopy and shrubbery.                       some canopy loss.

      Councils that have gained the most          In many cases, a decline in canopy is      In many cases a decline in canopy and               The rate of canopy loss
        significant tree canopy have lost         matched by an equivalent increase in        shrubbery is matched by an increase      Rateisof
                                                                                                                                              generally
                                                                                                                                                canopy loss
                                                                                                                                                        higher
                                                                                                                                                             is generally
                                                                                                                                                                in LGAs which
                                                                                                                                                                          higher in
    shrubbery. This suggests that the gain      shrubbery. This suggests that canopy loss    in hard surface and grassed areas. This   LGAs which
                                                                                                                                              have the
                                                                                                                                                    havemost
                                                                                                                                                          thecanopy
                                                                                                                                                               most canopy
                                                                                                                                                                      cover. cover.
          in canopy may be the legacy           is being compensated for by re-planting.    suggests that development and clearing
    of past plantings of small trees (shrubs)                                                       is replacing green spaces.
               maturing into trees.

WHERE SHOULD ALL THE TREES GO? NATIONAL OVERVIEW                                                                                                                                      12
NEW SOUTH WALES

                                                   Wendy’s Secret Garden
WHERE SHOULD ALL THE TREES GO? STATE BY STATE     13
NSW                    WHAT’S HAPPENING?

                                                 The highest canopy           The lowest canopy
                                                 cover in an urban LGA is     cover in an urban LGA is

  Average canopy cover                           54%
                                                 in Hornsby Shire.
                                                                              13.7%
                                                                              in both the City of Botany Bay
                                                                                                               The most significant
  for urban NSW is                                                                                             and beneficial gains

  26.64%
                                                                              and Rockdale City Council.
                                                                                                               could be made in the
                                                                                                               Bayside City Council,
  down 0.83% from                                                                                              Cumberland Council,

  27.47%
                                                                                                               Inner West Council
                                                                                                               and Liverpool
  in 2009.                                                                                                     City Council.

  Now that Bankstown City
  Council has merged with                        Despite the canopy gains
  Canterbury City Council,                       in Bankstown City Councils
  the canopy figure across                       there has been a                                              The most significant
  the amalgamated LGA will
  be reduced, as Canterbury
                                                 SIGNIFICANT                                                   canopy loss was
                                                                                                               in Pittwater Council.
                                                 INCREASE
                                                                                                                13.2%
  City Council has

  2% LESS                                        IN HARD
                                                 SURFACES.
  CANOPY.

WHERE SHOULD ALL THE TREES GO? New South Wales                                                                                         14
NSW                      THE MOST & LEAST VULNERABLE

                                                                                                                           2.5 Rating
                                                                                         Penrith City Council, Hurstville City Council,                                                 2.0 Rating
                                                                                                               Randwick City Council            Ashfield Council, Burwood Council, City of Canada
                               3.0 Rating                                                                                                 Bay Council, Marrickville Council, Newcastle City Council,
                               Camden Council, City of Sydney                                                                                          Parramatta City Council, Strathfield Council
        3.5 Rating                                                                                                                                                                                      1.5 Rating
        Hunter's Hill Council, Kogarah City Council, Manly Council, Pittwater Council,                                                                   Auburn Council, Bankstown Council, Campbelltown City
        City of Ryde, The Hills Shire Council, Warringah Council, Waverley Council                                                                          Council, Fairfield City Council, Liverpool City Council

4.0 Rating                                                                                                                                                                                                1.0 Rating
Willoughby Council, Sutherland Shire Council, Leichhardt                                                                                              Blacktown City Council, City of Botany Bay, Canterbury Council,
Municipal Council, Lane Cove Council, North Sydney Council                                                                                                               Holroyd City Council, Rockdale Ctiy Council

4.5 Rating
Hornsby Shire Council, Ku-ring-gai Council, Mosman Council,
Woolhara Municipal Council

                                                               LEAST                                                               MOST
                                                               VULNERABLE                                                    VULNERABLE

   TOP URBAN GREENING OPPORTUNITIES:
   Blacktown, Botany, Canterbury, Holroyd & Rockdale (which have all been affected by council amalgamations).
   --   Blacktown City Council, City of Botany Bay, Canterbury Council, Holroyd City                       Holroyd City Council (1), Hornsby Shire Council (4.5)
        Council, Rockdale City Council (1)                                                            --   Inner West Council - Ashfield Council (2), Leichhardt Municipal Council (4)
   --   Cumberland Council - Auburn Council (1.5), Holroyd City Council (1)                                Marrickville Council (2)
   --   Amalgamations between Canterbury (1) and Bankstown Councils (1.5)                             --   Northern Beaches Council - Manly Council, Pittwater Council,
   --   City of Parramatta Council - Auburn Council (1.5), Parramatta City Council (2)                     Warringah Council (3.5)

WHERE SHOULD ALL THE TREES GO? New South Wales                                                                                                                                                                        15
NSW                      SNAPSHOT

  THE GREEN KEY                             Tree Canopy Cover               27.47%                        26.64%                                          0.83% Loss

  In technical terms, a tree is a plant     Shrub Cover                     7.01%                         7.2%                                            0.19% Gain
  over six metres, while a shrub is
                                            Grass Cover                     25.73%                        23.36%                                          2.37% Loss
  under six metres. However, for an
  accurate comparison to our                Hard Surface                    39.8%                         42.8%                                           3.0% Increase
  previous mapping report, ‘Where
  are all the trees?’, we have used
  the following definitions:                SHRUB & TREE CANOPY COVER CHANGES IN NSW LGAS 2009-2016

                  Trees
                  Anything that looks
                                            15 %
                  like a tree from
                  above, distinguished
                  from shrubs by the        10 %

                  shadows cast.
                                             5%

                  Shrub
                  Landscaped vegetation      0%
                  as well as bushland
                  shrubs, crops and          -5 %
                  grapevines.

                                            -10 %
                  Grass
                  Cleared road sides,
                  lawns, pastures,
                  sites cleared for
                  development and
                  sporting grounds.
                                             4%

                  Hard surfaces              2%
                  Asphalt, buildings,
                                             0%
                  car parks, footpaths,
                  sandy beaches, train       -2 %

                  lines, rocky coastlines    -4 %
                  and water.
                                             -6 %

                                             -8 %

                                                    SIGNIFICANT INCREASE   NO SIGNIFICANT CHANGE   SIGNIFICANT DECREASE                 SHRUB CHANGE

                                                                                                              * From ‘Benchmarking Australia’s Urban Tree Canopy: An i-Tree Assessment’, Final Report (2014)

WHERE SHOULD ALL THE TREES GO? New South Wales                                                                                                                                                          16
Sydney, NSW
    NSW
     NSW– SYDNEY

                                                                                                                            URBAN HEAT
                                                                                                                            ISLAND MAPPING
                                                                                                                            An urban heat island is an area
                                                                                                                            that heats up more than – and
                                                                                                                            stays hotter than – its surrounding
                                                                                                                            areas due to human impact of
                                                                                                                            hard surfaces and development.
                                                                                                                            Colours are used below to
                                                                                                                            differentiate intensity of urban
                                                                                                                            heat islands.

Legend
Hottest Areas

         Hottest 16%

         Hottest 8%

         Hottest 2.5%

O         0        5.5
Map by: Alex Saunders
                          11Kilometers
                         Date: 23/05/2017
                                            Sources: Esri, HERE, DeLorme, Intermap, increment P Corp., GEBCO, USGS, FAO, NPS, NRCAN, GeoBase, IGN, Kadaster NL, Ordnance Survey, Esri Japan,
                                            METI, Esri China (Hong Kong), swisstopo, MapmyIndia, © OpenStreetMap contributors, and the GIS User Community
Sydney, NSW
    NSW
     NSW– SYDNEY

                                                                   URBAN HEAT
                                                                   CONTINENTS
                                                                   Contiguous areas of urban heat
                                                                   spots or islands show a phenomenon
                                                                   more akin to an urban heat
                                                                   continent than a spot or island.
                                                                   The colours differentiate the
                                                                   various heat continents.

O         0       5.5
Map by: Alex Saunders
                         11Kilometers
                        Date: 23/05/2017   Esri, HERE, DeLorme, MapmyIndia, © OpenStreetMap contributors, and the GIS user community
Newcastle, NSW
    NSW
     NSW– NEWCASTLE

                                                                                                                            URBAN HEAT
                                                                                                                            ISLAND MAPPING
                                                                                                                            An urban heat island is an area
                                                                                                                            that heats up more than – and
                                                                                                                            stays hotter than – its surrounding
                                                                                                                            areas due to human impact of
                                                                                                                            hard surfaces and development.
                                                                                                                            Colours are used below to
                                                                                                                            differentiate intensity of urban
                                                                                                                            heat islands.

Legend
Hottest Areas

         Hottest 16%

         Hottest 8%

         Hottest 2.5%

O         0       1
Map by: Alex Saunders
                        2Kilometers
                        Date: 23/05/2017
                                           Sources: Esri, HERE, DeLorme, Intermap, increment P Corp., GEBCO, USGS, FAO, NPS, NRCAN, GeoBase, IGN, Kadaster NL, Ordnance Survey, Esri Japan,
                                           METI, Esri China (Hong Kong), swisstopo, MapmyIndia, © OpenStreetMap contributors, and the GIS User Community
Newcastle, NSW
    NSW
     NSW– NEWCASTLE

                                                                   URBAN HEAT
                                                                   CONTINENTS
                                                                   Contiguous areas of urban heat
                                                                   spots or islands show a phenomenon
                                                                   more akin to an urban heat
                                                                   continent than a spot or island.
                                                                   The colours differentiate the
                                                                   various heat continents.

O         0       1
Map by: Alex Saunders
                        2Kilometers
                        Date: 23/05/2017   Esri, HERE, DeLorme, MapmyIndia, © OpenStreetMap contributors, and the GIS user community
NSW                THE GOOD NEWS

                                                  The best tree canopy gains have been
                                                 made in Bankstown Council (4% gain) and
                                                       the City of Sydney (3.6% gain).

WHERE SHOULD ALL THE TREES GO? New South Wales                                             21
NSW                COUNCIL COMMENTS
                                                                                      PENRITH CITY COUNCIL

                                                                                      Using data from 2011 Penrith City Council undertook an in-depth
                                                                                      study across the Penrith LGA. This analysis allowed us to identify
                                                                                      priority areas to focus future urban greening and cooling projects.
                                                                                      These areas are St Marys, Penrith, Kingswood, Cranebrook and
                                                                                      Glenmore Park.

                                                         MELISSA MCMANUS
                                                          PARKS DEPARTMENT
                                                           TECHNICAL OFFICE
        NORTH SYDNEY COUNCIL                                                                                                             CARMEL HAMILTON
                                                                                                                                                SUSTAINABILITY
                                                                                                                                                 COORDINATOR
       Since 1997, North Sydney Council has strived to undertake regular
       detailed canopy analysis. LIDAR assessment in 2008 reported 34%
       canopy cover and in 2014, 31% canopy cover. There was no analysis
       in 2016 due to bad weather but the next round of measurement                   SUTHERLAND SHIRE COUNCIL
       is due to be conducted in Spring 2017 and will be carried out in
       conjunction with City of Sydney. Once this additional data has
                                                                                      The snapshot should be read within a broader context to refine
       been measured it will be incorporated into a review of the Urban
                                                                                      future action. For example, the intersection as a priority area is in
       Forestry Strategy which has been in place since 2011.
                                                                                      fact quite treed in its local context. The heat detected is likely to
       Currently, key greening opportunities are aligned with the snapshot            be coming from the Miranda centre and large Westfield shopping
        findings and are focused in and around St Leonards – an area                  centre on Kiora Road. Council has an active Green Streets
       identified as a hotspot. North Sydney Council has been actively                Program designed to maintain tree canopy in the future in the
       planting out carparks over the past five years, and has experienced            face of increased densification.
       good rates of tree growth. The North Sydney Council Urban Forest
                                                                                      The Green Streets Program seeks to grow the next generation
       Strategy is accessible to the public via the website.
                                                                                      of canopy trees in the public domain to offset those lost from
                                                                                      private land with four new trees being planted for each tree
                                                                                      removed in Sutherland Shire. Since 2012, over 7,000 trees have
                                                                                      been planted in the public domain through this project. In
                                                                                      Miranda centre, Syncarpia glomulifera have been planted in the
                                                                       MARK CARLON    Kingsway and species from the Sydney Turpentine Iron Bark
                                                                  MANAGER STRATEGIC   Forest planted in surrounding streets.
                                                                          PLANNING

WHERE SHOULD ALL THE TREES GO? New South Wales                                                                                                                   22
NSW                 COUNCIL COMMENTS

                                                                                                                    KARENNE JURD
                                                                                                                 ASSET PROGRAM
                                                                                                      COORDINATOR, ENVIRONMENT
                                                                                                       INFRASTRUCTURE PLANNING
      NEWCASTLE CITY COUNCIL

       Overall, there is general alignment between the City           established urban trees, our Urban Forest Policy (2008),
       of Newcastle’s (Council) understanding of hotspots             Development Control Plans and Technical Guidance
       and what the RMIT mapping has identified. However,             Manuals, maintenance schedules, community requests,
       it should be noted that the analysis of hard sand that         water sensitive urban design, microclimate modifications
       includes ‘water’ needs to moderated in areas such as           and the location of tree vacancy sites across the LGA.
       the Newcastle LGA, which comprises a substantial
                                                                      Council’s potential planting areas include:
       area of small and large wetlands. For example, the
       substantial constructed wetland at Sandgate needs              Merewether, The Junction – Corlette, Frederick, Kemp,
       to be incorporated in such analysis when projecting            Kilgour, Patrick and Buchanan Streets.
       the performance of this light industrial area. As major        Mayfield East – whole suburb retrofit, and Stevenson Park,
       hotspots identified in industrial areas are on private         Mayfield West.
       land, Council is working to build partnerships to address
       these hotspots through proactively targeting street tree       Kotara – Parkway Avenue and Howell Street,
       planting such as the recent planting of the Beresfield light   Kulliabah Reserve
       industrial areas.                                              Beresfield – Local Centre, Beresford and Landor Street.
       Each year, as part of the annual Street and Park Tree          Wallsend – Local Centre, Wallsend Reserve and road
       Renewal Program, Council plants on average 1,100 trees.        rehabilitation sites.
       Approximately 90% of these are street trees, with the
       remaining planted within park open space. Council’s            Hamilton – Denison and Samdon Streets.
       approach to tree planting is a strategic one that takes into
       account our GIS tree asset inventory of 113,377 new and

WHERE SHOULD ALL THE TREES GO? New South Wales                                                                                     23
VICTORIA

                                                            Royal Botanic Gardens, Melbourne
WHERE SHOULD ALL THE TREES GO? STATE BY STATE              24
VIC                  WHAT’S HAPPENING?

                                                                   There has been an
                                                                   overall increase of
                                                                                          In VIC,44%           of urban LGAs have
                                                                                          undergone a significant loss of tree canopy,

                                                                   3%
  Average canopy cover
  for urban VIC is                                                            in hard             8%
                                                                                          with only           having had a significant

  18.83%                                                           surfaces, which is
                                                                   exactly the same
                                                                                          increase in shrubbery.

  down 2.06% from                                                  rate of increase as

  20.89%
                                                                   NSW, but overall
                                                                   VIC has around
  in 2009.
                                                                   5%         less hard
                                                                   surfaces than NSW.

  THERE HAVE BEEN
  QUITE A FEW
  SIGNIFICANT
  CANOPY LOSSES.
  – Notably in the City of Ballarat (5%), Banyule City Council
  (4.6%), Cardinia Shire Council (5.9%), Nillumbik Shire Council
  (12.8%), Maroondah City Council (4.7%), Mornington Peninsula
  Shire (4.7%) and Eira City Council (4.8%).

WHERE SHOULD ALL THE TREES GO? VICTORIA                                                                                                  25
VIC                     THE MOST & LEAST VULNERABLE

                                                                                                                2.5 Rating
                                                                                      Glen Eira City Council, Kingston City
                                 3.0 Rating                                                   Council, City of Stonnington                                 2.0 Rating
                                 City of Port Phillip, Maroondah City Council,                                                 Moonee Valley City Council, Whittlesea
                                 City of Casey, Banyule City Council                                                                 Council, Wyndham City Council
            3.5 Rating                                                                                                                                                             1.5 Rating
            City of Boroondara, City of Monash, Mornington Peninsula Shire,                                      Frankston City Council, City of Greater Bendigo, City of Greater Dandenong,
            Cardinia Shire Council, City of Melbourne                                                                     City of Greater Geelong, Hobsons Bay City Council, City of Melton

                                                                                                                                                                                1.0 Rating
4.0 Rating                                                                                                                                       City of Brimbank, Maribyrnong City Council,
Yarra City Council, City of Whitehorse, Manningham City Council                                                                                                       Moreland City Council

4.5 Rating
Yarra Ranges Council, Nillumbik Shire Council,                                                                                                                                             0.5 Rating
Knox City Council, Bayside City Council                                                                                                               City of Ballarat, City of Darebin, City of Hume

                                                                 LEAST                                            MOST
                                                                 VULNERABLE                                 VULNERABLE

       TOP URBAN GREENING OPPORTUNITIES:
       --     City of Ballarat, City of Darebin, City of Hume (0.5)                   --   Frankston City Council, City of Greater Bendigo, City of Greater Dandenong, City
                                                                                           of Greater Geelong, Hobsons Bay City Council, City of Melton (1.5)
       --     City of Brimbank, Maribyrnong City Council, Moreland City Council (1)
                                                                                      --   Moonee Valley City Council, Whittlesea Council, Wyndham City Council (2)

WHERE SHOULD ALL THE TREES GO? VICTORIA                                                                                                                                                           26
VIC                    SNAPSHOT
                                            KEY STATISTICS                   2009*                          2016
  THE GREEN KEY                             Tree Canopy Cover                20.89%                         18.83%                                           2.06% Loss

  In technical terms, a tree is a plant     Shrub Cover                      4.82%                          4.89%                                            0.07% Gain
  over six metres, while a shrub is         Grass Cover                      40.04%                         39.03%                                           1.01% Loss
  under six metres. However, for an
  accurate comparison to our                Hard Surface                     34.25%                         37.26%                                           3.01% Increase
  previous mapping report, ‘Where
  are all the trees?’, we have used
  the following definitions:
                                            SHRUB & TREE CANOPY COVER CHANGES IN VIC LGAS 2009-2016

                  Trees
                  Anything that looks
                                            10 %
                  like a tree from
                  above, distinguished
                  from shrubs by the         5%
                  shadows cast.

                  Shrub                      0%

                  Landscaped vegetation
                  as well as bushland
                  shrubs, crops and          -5 %

                  grapevines.

                  Grass                     -10 %

                  Cleared road sides,
                  lawns, pastures,          GREEN COVER GAIN & LOSS IN VIC LGAS 2009-2016
                  sites cleared for
                  development and
                  sporting grounds.
                                             4%

                  Hard surfaces              2%
                  Asphalt, buildings,
                                             0%
                  car parks, footpaths,
                  sandy beaches, train       -2 %

                  lines, rocky coastlines    -4 %
                  and water.
                                             -6 %

                                             -8 %

                                                    SIGNIFICANT INCREASE   NO SIGNIFICANT CHANGE   SIGNIFICANT DECREASE                 SHRUB CHANGE

                                                                                                              * From ‘Benchmarking Australia’s Urban Tree Canopy: An i-Tree Assessment’, Final Report (2014)

WHERE SHOULD ALL THE TREES GO? VICTORIA                                                                                                                                                                 27
Melbourne, VIC
    VIC – MELBOURNE

                                                                                                                              URBAN HEAT
                                                                                                                              ISLAND MAPPING
                                                                                                                              An urban heat island is an area
                                                                                                                              that heats up more than – and
                                                                                                                              stays hotter than – its surrounding
                                                                                                                              areas due to human impact of
                                                                                                                              hard surfaces and development.
                                                                                                                              Colours are used below to
                                                                                                                              differentiate intensity of urban
                                                                                                                              heat islands.

Legend
Hottest Areas

         Hottest 16%

         Hottest 8%

         Hottest 2.5%

O         0
Map by: Alex Saunders
                      10      20 Kilometers
                           Date: 23/05/2017
                                              Sources: Esri, HERE, DeLorme, Intermap, increment P Corp., GEBCO, USGS, FAO, NPS, NRCAN, GeoBase, IGN, Kadaster NL, Ordnance Survey, Esri Japan,
                                              METI, Esri China (Hong Kong), swisstopo, MapmyIndia, © OpenStreetMap contributors, and the GIS User Community
Melbourne, VIC
    VIC – MELBOURNE

                                                                   URBAN HEAT
                                                                   CONTINENTS
                                                                   Contiguous areas of urban heat
                                                                   spots or islands show a phenomenon
                                                                   more akin to an urban heat
                                                                   continent than a spot or island.
                                                                   The colours differentiate the
                                                                   various heat continents.

O         0        10
Map by: Alex Saunders
                           20 Kilometers
                        Date: 23/05/2017   Esri, HERE, DeLorme, MapmyIndia, © OpenStreetMap contributors, and the GIS user community
Ballarat, VIC
    VIC – BALLARAT

                                                                                                                           URBAN HEAT
                                                                                                                           ISLAND MAPPING
                                                                                                                           An urban heat island is an area
                                                                                                                           that heats up more than – and
                                                                                                                           stays hotter than – its surrounding
                                                                                                                           areas due to human impact of
                                                                                                                           hard surfaces and development.
                                                                                                                           Colours are used below to
                                                                                                                           differentiate intensity of urban
                                                                                                                           heat islands.

Legend
Hottest Areas

         Hottest 16%

         Hottest 8%

         Hottest 2.5%

O         0       2.5
Map by: Alex Saunders
                         5Kilometers
                        Date: 23/05/2017
                                           Sources: Esri, HERE, DeLorme, Intermap, increment P Corp., GEBCO, USGS, FAO, NPS, NRCAN, GeoBase, IGN, Kadaster NL, Ordnance Survey, Esri Japan,
                                           METI, Esri China (Hong Kong), swisstopo, MapmyIndia, © OpenStreetMap contributors, and the GIS User Community
Ballarat, VIC
   VIC – BALLARAT

                                                                   URBAN HEAT
                                                                   CONTINENTS
                                                                   Contiguous areas of urban heat
                                                                   spots or islands show a phenomenon
                                                                   more akin to an urban heat
                                                                   continent than a spot or island.
                                                                   The colours differentiate the
                                                                   various heat continents.

O         0      2.5
Map by: Alex Saunders
                         5Kilometers
                        Date: 23/05/2017   Esri, HERE, DeLorme, MapmyIndia, © OpenStreetMap contributors, and the GIS user community
Bendigo, VIC
    VIC – BENDIGO

                                                                                                                               URBAN HEAT
                                                                                                                               ISLAND MAPPING
                                                                                                                               An urban heat island is an area
                                                                                                                               that heats up more than – and
                                                                                                                               stays hotter than – its surrounding
                                                                                                                               areas due to human impact of
                                                                                                                               hard surfaces and development.
                                                                                                                               Colours are used below to
                                                                                                                               differentiate intensity of urban
                                                                                                                               heat islands.

Legend
Hottest Areas

         Hottest 16%

         Hottest 8%

         Hottest 2.5%

O         0
Map by: Alex Saunders
                        5      10 Kilometers
                            Date: 23/05/2017
                                               Sources: Esri, HERE, DeLorme, Intermap, increment P Corp., GEBCO, USGS, FAO, NPS, NRCAN, GeoBase, IGN, Kadaster NL, Ordnance Survey, Esri Japan,
                                               METI, Esri China (Hong Kong), swisstopo, MapmyIndia, © OpenStreetMap contributors, and the GIS User Community
Bendigo, VIC
    VIC – BENDIGO

                                                                   URBAN HEAT
                                                                   CONTINENTS
                                                                   Contiguous areas of urban heat
                                                                   spots or islands show a phenomenon
                                                                   more akin to an urban heat
                                                                   continent than a spot or island.
                                                                   The colours differentiate the
                                                                   various heat continents.

O         0         5
Map by: Alex Saunders
                           10 Kilometers
                        Date: 23/05/2017   Esri, HERE, DeLorme, MapmyIndia, © OpenStreetMap contributors, and the GIS user community
VIC              THE GOOD NEWS

                                             Despite population growth and an increase in hard
                                              surface areas, the City of Melbourne has managed
                                             to maintain its canopy levels – there has been no
                                                          significant loss of canopy.

                                              Given Ballarat’s vulnerability and overall loss of
                                          canopy there is a significant urban greening opportunity
                                              there. However it is likely that these results are
                                          somewhat of an anomaly given that Ballarat has higher
                                            than average areas of pastoral land and is somewhat
                                                        atypical of other urban LGAs.

                                          The City of Yarra has gained 4.3% in canopy cover and has
                                               a longstanding commitment to urban forestry.

WHERE SHOULD ALL THE TREES GO? VICTORIA                                                               37
VIC              COUNCIL COMMENTS
                                                                             WYNDHAM CITY COUNCIL

                                                                             Roughly 58% of the Wyndham municipality is outside the Urban
                                                            JESSICA WINGAD   Growth Boundary.
                                                           MANAGER CLIMATE
                                                            CHANGE, ENERGY   Rural areas are dominated by market gardens and the Western
       MORNINGTON PENINSULA SHIRE                               AND WATER    Grassland Reserve which protects natural temperate grasslands
                                                                             of the volcanic plains, a critically endangered ecosystem where
                                                                             trees are naturally scarce.
       The Mornington Peninsula Shire is located Southeast of
       Melbourne and is surrounded by the coast on three sides.              The low tree canopy percentage of the entire municipality
       We note that the hotspots and areas of vulnerability are generally    reflects this and there are very few locations where dense tree
       outside of our urban growth boundary or not located in our            planting is appropriate within the rural area. Urban Wyndham
       most heavily populated areas. One interpretation of these results     has a much higher tree canopy cover however due to tree
       is that the lack of or change in vegetation may be due                planting within the urban growth zone. The rapid population
       to horticultural or recreational development.                         growth means there is a large portion of young trees, as well as
                                                                             many vacant sites where additional trees can be planted within
                                                                             streets and parks.

               FRANKSTON CITY COUNCIL
                                                                                                                         BENJAMIN DE KLEPPER
        The City of Frankston has limited data on canopy cover and                                                        URBAN FOREST PLANNER
        this is the first we’ve seen about hotspots and heat, so it is of
        great interest to us. Interestingly, the heat mapping showed
        that the hotspots were in our rural, not urban areas, so there
        was limited overlap between where vulnerable people live and
        where it is hottest.
        We would be interested in learning more about where our
        canopy cover is being lost.

                     NATHALIE NUNN
                      ENVIRONMENTAL
                            PLANNER

WHERE SHOULD ALL THE TREES GO? VICTORIA                                                                                                          38
VIC               COUNCIL COMMENTS

                                                                                  MAROONDAH CITY COUNCIL

                                                              TANIA MACLEOD       We realise that this is a broad brush analysis, but observe that
                                                                PROJECT OFFICER   the areas identified as greening opportunities due to the high
                                                                 ARBORICULTURE
                                                                                  temperatures are mostly intensively developed industrial
      CITY OF GREATER BENDIGO
                                                                                  areas, shopping centre car parks and the like. In terms of public
                                                                                  greening, our current opportunities are limited to areas that
       Bendigo’s urban growth boundary covers only 4.2% (126 km2)                 council has control of, such as nature strips. Although it may
       of the Greater Bendigo Local Government area (3000 km2),                   seem challenging, the real opportunity is for there to be more
       therefore canopy cover statistics for the urban area are quite             green infrastructure such as green roofs and walls within private
       different than those for the entire LGA, with large proportions of         locations, which we would encourage.
       agricultural land and national, state and regional parks. Bendigo
       is often referred to as the ‘City in a Forest,’ attributed to the ring
       of Box Ironbark forest (Greater Bendigo National Park) which
       almost encircles the urban area.
                                                                                  RICHARD PHILLIPS
       A canopy cover analysis (using iTree canopy) of Bendigo’s                  TREE MANAGEMENT
       urban area (defined by the urban growth boundary) paints a                          OFFICER
       very different picture than the statistics supplied in your report
       for the entire Greater Bendigo area. Tree canopy here is 19%
       compared to 28% from the 2014 assessment. Impermeable
       surfaces cover over a quarter of all land compared to only 3%
       over all of Greater Bendigo.
       This is predicted to get worse as Bendigo develops, expands into
       new growth areas and infill existing urban areas. We are also
       predicted to lose 44% of all city trees over the next 10 years as our
       ageing European trees come to the end of their natural lives.

WHERE SHOULD ALL THE TREES GO? VICTORIA                                                                                                               39
QUEENSLAND

                                                              7th Brigade
WHERE SHOULD ALL THE TREES GO? STATE BY STATE                40
QLD                  WHAT’S HAPPENING?

                                                                                40%
                                            The rate of loss in
                                                                                                          The increase in hard
                                            QLD is almost
                                                                                                          cover is most pronounced
  Average canopy cover in                   DOUBLE                              of urban LGAs have
                                                                                had no significant loss
                                                                                                          in the City of Brisbane
  urban QLD is the highest                  that of any other state.                                      where that gain seems
                                                                                or increase in canopy.
  in the country at                                                                                       to have come largely at
                                                                                                          the expense of grassed

  47.2%
  down 3% from
                                                                                                          areas. However there is a
                                                                                                          significant increase of

  50.2%                                                                                                   3.3%            in shrubbery
                                                                                                          which, based on trends
  in 2009.                                                                                                seen in other QLD LGAs,
                                                                                                          would predict a canopy
                                                                                                          increase over time.

  There has been a
                                            The 8.9%           loss in canopy
                                            in Redland City Council should be

  1.65%
  increase in shrub
                                            watched because at the same time
                                            there has been a

  cover and a small
                                            3.5%             increase in hard

  0.49%
                                                             surfaces and a

  reduction in grass.
  Hard surface areas
                                            4%          increase in
                                                        grassed areas.
                                            There has not, however, been a
  have increased by
                                            significant increase in shrubbery,

  1.79%                                     indicating that there may not be enough
                                            small saplings and trees being planted to
                                            compensate for the loss of canopy.

WHERE SHOULD ALL THE TREES GO? QUEENSLAND                                                                                                41
QLD                    THE MOST & LEAST VULNERABLE

                                                                                                  2.5 Rating
                                                                                      Cairns Regional Council
                                                                                                                                          2.0 Rating
                               3.0 Rating                                                              Toowoomba Regional Council, Logan City Council,
                               Moreton Bay Regional Council, Sunshine Coast Council                                             Ipswich City Council

         3.5 Rating
         Redland City Council, Townsville City Council, City of Gold Coast

4.0 Rating
Brisbane City Council

                                                               LEAST                                 MOST
                                                               VULNERABLE                      VULNERABLE

   TOP URBAN GREENING OPPORTUNITIES:
   --   Toowoomba Regional Council, Logan City Council, Ipswich City Council (2)
   --   Cairns Regional Council (2.5)
   --   Moreton Bay Regional Council, Sunshine Coast Council (3)

WHERE SHOULD ALL THE TREES GO? QUEENSLAND                                                                                                                42
QLD                    SNAPSHOT
                                            KEY STATISTICS                 2009*                         2016
  THE GREEN KEY                             Tree Canopy Cover              50.2%                         47.2%                                            3% Loss

  In technical terms, a tree is a plant     Shrub Cover                    6.69%                         8.34%                                            1.65% Gain
  over six metres, while a shrub is
                                            Grass Cover                    35%                           34.51%                                           0.49% Loss
  under six metres. However, for an
  accurate comparison to our                Hard Surface                   8.11%                         9.9%                                             1.79% Increase
  previous mapping report, ‘Where
  are all the trees?’, we have used
  the following definitions:
                                            SHRUB & TREE CANOPY COVER CHANGES IN QLD LGAS 2009-2016

                  Trees
                  Anything that looks       6%

                  like a tree from
                  above, distinguished
                                            4%
                  from shrubs by the
                  shadows cast.
                                            2%

                  Shrub
                  Landscaped vegetation
                                            0%
                  as well as bushland
                  shrubs, crops and
                  grapevines.               -2 %

                  Grass                     GREEN COVER GAIN & LOSS IN QLD LGAS 2009-2016
                  Cleared road sides,
                  lawns, pastures,
                  sites cleared for
                                            2%
                  development and
                                            1%
                  sporting grounds.
                                            0%

                  Hard surfaces             -1 %
                  Asphalt, buildings,       -2 %
                  car parks, footpaths,
                                            -3 %
                  sandy beaches, train
                                            -4 %
                  lines, rocky coastlines
                  and water.                -5 %

                                                   SIGNIFICANT INCREASE   NO SIGNIFICANT CHANGE   SIGNIFICANT DECREASE                 SHRUB CHANGE

                                                                                                             * From ‘Benchmarking Australia’s Urban Tree Canopy: An i-Tree Assessment’, Final Report (2014)

WHERE SHOULD ALL THE TREES GO? QUEENSLAND                                                                                                                                                              43
South-East Queensland
    QLD – SOUTH-EAST QUEENSLAND

    URBAN HEAT
    ISLAND MAPPING
    An urban heat island is an area
    that heats up more than – and
    stays hotter than – its surrounding
    areas due to human impact of
    hard surfaces and development.
    Colours are used below to
    differentiate intensity of urban
    heat islands.

Legend
Hottest Areas

         Hottest 16%

         Hottest 8%

         Hottest 2.5%

O         0     10
Map by: Alex Saunders
                        20 Kilometers
                            Date: 23/05/2017
                                               Sources: Esri, HERE, DeLorme, Intermap, increment P Corp., GEBCO, USGS, FAO, NPS, NRCAN, GeoBase, IGN, Kadaster NL, Ordnance Survey, Esri Japan,
                                               METI, Esri China (Hong Kong), swisstopo, MapmyIndia, © OpenStreetMap contributors, and the GIS User Community
South-East Queensland
    QLD – SOUTH-EAST QUEENSLAND

    URBAN HEAT
    CONTINENTS
    Contiguous areas of urban heat
    spots or islands show a phenomenon
    more akin to an urban heat
    continent than a spot or island.
    The colours differentiate the
    various heat continents.

O         0     10
Map by: Alex Saunders
                        20 Kilometers
                            Date: 23/05/2017   Esri, HERE, DeLorme, MapmyIndia, © OpenStreetMap contributors, and the GIS user community
Cairns, QLD
    QLD – CAIRNS

    URBAN HEAT
    ISLAND MAPPING
    An urban heat island is an area
    that heats up more than – and
    stays hotter than – its surrounding
    areas due to human impact of
    hard surfaces and development.
    Colours are used below to
    differentiate intensity of urban
    heat islands.

Legend
Hottest Areas

         Hottest 16%

         Hottest 8%

         Hottest 2.5%

O         0       10
Map by: Alex Saunders
                        20Kilometers
                        Date: 23/05/2017
                                           Sources: Esri, HERE, DeLorme, Intermap, increment P Corp., GEBCO, USGS, FAO, NPS, NRCAN, GeoBase, IGN, Kadaster NL, Ordnance Survey, Esri Japan,
                                           METI, Esri China (Hong Kong), swisstopo, MapmyIndia, © OpenStreetMap contributors, and the GIS User Community
Cairns, QLD
    QLD – CAIRNS

    URBAN HEAT
    CONTINENTS
    Contiguous areas of urban heat
    spots or islands show a phenomenon
    more akin to an urban heat
    continent than a spot or island.
    The colours differentiate the
    various heat continents.

O         0       10
Map by: Alex Saunders
                        20Kilometers
                        Date: 23/05/2017   Esri, HERE, DeLorme, MapmyIndia, © OpenStreetMap contributors, and the GIS user community
Townsville, QLD
    QLD – TOWNSVILLE

    URBAN HEAT
    ISLAND MAPPING
    An urban heat island is an area
    that heats up more than – and
    stays hotter than – its surrounding
    areas due to human impact of
    hard surfaces and development.
    Colours are used below to
    differentiate intensity of urban
    heat islands.

Legend
Hottest Areas

         Hottest 16%

         Hottest 8%

         Hottest 2.5%

O         0
Map by: Alex Saunders
                      6     12 Kilometers
                          Date: 23/05/2017
                                             Sources: Esri, HERE, DeLorme, Intermap, increment P Corp., GEBCO, USGS, FAO, NPS, NRCAN, GeoBase, IGN, Kadaster NL, Ordnance Survey, Esri Japan,
                                             METI, Esri China (Hong Kong), swisstopo, MapmyIndia, © OpenStreetMap contributors, and the GIS User Community
Townsville, QLD
    QLD – TOWNSVILLE

    URBAN HEAT
    CONTINENTS
    Contiguous areas of urban heat
    spots or islands show a phenomenon
    more akin to an urban heat
    continent than a spot or island.
    The colours differentiate the
    various heat continents.

O         0        6
Map by: Alex Saunders
                          12 Kilometers
                        Date: 23/05/2017   Esri, HERE, DeLorme, MapmyIndia, © OpenStreetMap contributors, and the GIS user community
QLD               THE GOOD NEWS

                                        Overall, the state’s VHHEDA Index rating is 2.9%, making it
                                      one of the least vulnerable states to health risks associated with
                                                            urban heat incidences.

                                     Townsville has undergone a 10% gain in canopy, much of which
                                  seems to be a result of grassed (down 9.4%) and shrub-covered (down
                                   2.3%) surfaces maturing and being recognised by analysts as canopy.

                                      In the City of Brisbane, there is a significant increase of 3.3% in
                                  shrubbery which, based on trends seen in other LGAs, would predict
                                                       a canopy increase over time.

                                        In Logan City, the 8.2% loss in canopy appears not to have
                                     been to hard surfaces but instead to a combination of grassed and
                                                         shrub-covered surfaces.

                                    Based on trends elsewhere in QLD, this would likely signify that over
                                  time this grassed area might convert to shrubs and the 2.9% shrubbery
                                      cover to convert into canopy to compensate for the 8.2% loss.

WHERE SHOULD ALL THE TREES GO? QUEENSLAND                                                                   50
QLD               COUNCIL COMMENTS
                                                                                BRISBANE CITY COUNCIL
                                                           CALLUM EDWARDS
     TOOWOOMBA REGIONAL COUNCIL                               SENIOR ARBORIST   Brisbane City Council has recently released ‘Brisbane: Clean,
                                                                                Green, Sustainable 2017-2031’. Chapter 8 (the Urban Forest)
       The urban heat island mapping for a rural local government (like         outlines Council’s goal to value, nurture and protect its urban
       Toowoomba Regional Council) is somewhat misleading and                   forest. Council is committed to identifying the hot parts of
       hard to apply. Land mapped in the Toowoomba LGA and shown                the City with low tree cover in order to target tree plantings in
       as hotspots is either natural grasslands or agricultural land.           areas that require shade and cooling. Council will consider the
                                                                                locations and opportunities identified in ‘Where should all the
       I agree these land types need to be mapped and considered                trees go?’ and their suitability for planting. The strategy also
       when discussing vegetation cover. However, it may be best to             identifies two landmark projects including urban cooling and a
       have two different maps (in a perfect world) – one showing the           memorial ring of green.
       extent of the LGA (including the agricultural and grassland)
       and associated hotspots, and the other showing urban areas (as
       defined by planning schemes/instruments). From a management
       viewpoint, this would provide more useable information for                                                             KRISTEN DANGERFIELD
                                                                                                                                        URBAN FOREST
       strategy and policy development. I do understand this would be
                                                                                                                                     PROGRAM OFFICER
       a time consuming process.

                                                                                   CITY OF GOLD COAST
          REDLAND CITY COUNCIL

                                                                                  Generally speaking the identified hotspot areas seem to
          It is important to acknowledge that this report includes data from      correspond to the urban footprint, with some of the hottest areas
          both the mainland and the islands, specifically North Stradbroke        aligning with suburbs we expect would be subject to additional
          Island, a forested area that is in fact larger than its mainland        urban heat i.e. the City’s northern suburbs.
          counterpart and is currently in the process of becoming a
                                                                                  Unfortunately at this mapping scale it is difficult to confirm and
          National Park. This inclusion skews the data in a positive way, not
                                                                                  ideally we would overlay the outputs with our urban footprint
          necessarily reflecting the reality of our Redlands urban areas.
                                                                                  and other GIS layers to provide a true comparison. To date we
                                                                                  have not produced heat mapping for the City so are unable to
                                                                                  compare with a similar dataset.

               CANDY DAUNT
             SENIOR ADVISOR,
        ENVIRONMENT POLICY
              AND PLANNING                                                          SAMANTHA BONNEY
                                                                                  SUPERVISOR OF NATURAL
                                                                                                HAZARDS
WHERE SHOULD ALL THE TREES GO? QUEENSLAND                                                                                                              51
SOUTH
                                                AUSTRALIA

                                                             Adelaide Botanic Gardens
WHERE SHOULD ALL THE TREES GO? STATE BY STATE               52
SA                   WHAT’S HAPPENING?

                                                 79%            of the
                                                                                   NO COUNCIL
                                                                                   has had a significant
                                                                                                           43%            of urban
                                                 urban LGAs in SA are                                      LGAs have had a
                                                                                   gain in urban tree
  Average canopy cover                           rated as vulnerable on                                    significant loss in tree
                                                                                   canopy cover.
  for urban SA is                                our VHHEDA Index.                                         canopy cover.

  19.45%
  down 1.92% from

  21.37%                                              MOST
                                                      VUNERABLE
                                                      LEAST
                                                      VULNERABLE
                                                                           LEAST
                                                                       VUNERABLE
                                                                          MOST
                                                                   VULNERABLE

  in 2009.

                                                 36%
  The City of Playford appears to be
  the most vulnerable LGA in the state.                                                                    The loss of grassed

  It only has9.4%        canopy
                                                 of urban LGAs                                             surfaces by

                                                                                                           10.9%
                                                 have had a
  cover and has undergone a loss of
                                                 significant

  5.4%        since 2009, in
                                                 increase in hard
                                                 surfaces, on
                                                                                                           in the City of
                                                                                                           Burnside, and the
  combination with a loss of shrubbery
                                                 average this                                              gain in shrubbery
  and a 4.5%             increase in hard        increase has been                                         would suggest
  surfaces. It is rated as one of the
  most vulnerable LGAs in the country.
                                                 by
                                                      5%                                                   some greening.

WHERE SHOULD ALL THE TREES GO? South Australia                                                                                        53
SA                  THE MOST & LEAST VULNERABLE

                                                                                                          2.5 Rating
                                                                                      City of Norwood, Payneham &
                                                                                           St Peters, City of Prospect
                             3.0 Rating                                                                                                                      2.0 Rating
                             City of unley, Town of Walkerville                                                          Campbelltown City Council, City of Holdfast Bay

                                                                                                                                                                                     1.5 Rating
                                                                                                                                                   Adelaide Hills Council, City of Onkaparinga

  4.0 Rating                                                                                                                                                                                1.0 Rating
  City of Burnside                                                                                                                                                    City of Marion, City of Salisbury

                                                                                                                                                                                            0.5 Rating
4.5 Rating                                                                                                                                     City of Charles Sturt, Town of Gawler, City of Playford,
City of Mitcham, Tea Tree Gully Council, City of Adelaide                                                                                           City of Port Adelaide Enfield, City of West Torrens

                                                             LEAST                                               MOST
                                                             VULNERABLE                                    VULNERABLE

   TOP URBAN GREENING OPPORTUNITIES:
  --   City of Charles Sturt, Town of Gawler, City of Playford, City of   --   Campbelltown City Council, City of Holdfast Bay (2)
       Port Adelaide Enfield, City of West Torrens (0.5)                  --   City of Norwood, Payneham & St Peters, City of Prospect (2.5)
  --   City of Marion, City of Salisbury (1)                              --   City of Unley, Town of Walkerville (3)
  --   Adelaide Hills Council, City of Onkaparinga (1.5)

WHERE SHOULD ALL THE TREES GO? South Australia                                                                                                                                                      54
SA                    SNAPSHOT
                                            KEY STATISTICS                 2009*                         2016
  THE GREEN KEY                             Tree Canopy Cover              21.37%                        19.45%                                           1.92% Loss

  In technical terms, a tree is a plant     Shrub Cover                    5.92%                         5.23%                                            0.69% Loss
  over six metres, while a shrub is
                                            Grass Cover                    32.08%                        32.1%                                            0.02% Gain
  under six metres. However, for an
  accurate comparison to our                Hard Surface                   40.63%                        43.2%                                            2.57% Increase
  previous mapping report, ‘Where
  are all the trees?’, we have used
  the following definitions:
                                            SHRUB & TREE CANOPY COVER CHANGES IN SA LGAS 2009-2016

                  Trees
                  Anything that looks
                  like a tree from
                  above, distinguished       4%

                  from shrubs by the
                  shadows cast.              2%

                  Shrub
                                             0%
                  Landscaped vegetation
                  as well as bushland
                                            -2 %
                  shrubs, crops and
                  grapevines.
                                            -4 %
                  Grass
                  Cleared road sides,       -6 %
                  lawns, pastures,
                  sites cleared for
                                            GREEN COVER GAIN & LOSS IN SA LGAS 2009-2016
                  development and
                  sporting grounds.

                  Hard surfaces              6%

                  Asphalt, buildings,        4%
                  car parks, footpaths,      2%
                  sandy beaches, train
                                             0%
                  lines, rocky coastlines
                                            -2 %
                  and water.
                                            -4 %

                                            -6 %

                                            -8 %

                                                   SIGNIFICANT INCREASE   NO SIGNIFICANT CHANGE   SIGNIFICANT DECREASE                 SHRUB CHANGE

                                                                                                             * From ‘Benchmarking Australia’s Urban Tree Canopy: An i-Tree Assessment’, Final Report (2014)

WHERE SHOULD ALL THE TREES GO? South Australia                                                                                                                                                         55
Adelaide, SA
    SA – ADELAIDE

    URBAN HEAT
    ISLAND MAPPING
    An urban heat island is an area
    that heats up more than – and
    stays hotter than – its surrounding
    areas due to human impact of
    hard surfaces and development.
    Colours are used below to
    differentiate intensity of urban
    heat islands.

Legend
Hottest Areas

         Hottest 16%

         Hottest 8%

         Hottest 2.5%

O         0
Map by: Alex Saunders
                      5.5     11Kilometers
                            Date: 23/05/2017
                                               Sources: Esri, HERE, DeLorme, Intermap, increment P Corp., GEBCO, USGS, FAO, NPS, NRCAN, GeoBase, IGN, Kadaster NL, Ordnance Survey, Esri Japan,
                                               METI, Esri China (Hong Kong), swisstopo, MapmyIndia, © OpenStreetMap contributors, and the GIS User Community
Adelaide, SA
    SA – ADELAIDE

    URBAN HEAT
    CONTINENTS
    Contiguous areas of urban heat
    spots or islands show a phenomenon
    more akin to an urban heat
    continent than a spot or island.
    The colours differentiate the
    various heat continents.

O         0       5.5
Map by: Alex Saunders
                          11Kilometers
                        Date: 23/05/2017   Esri, HERE, DeLorme, MapmyIndia, © OpenStreetMap contributors, and the GIS user community
SA              THE GOOD NEWS

                                                 Despite being the most densely populated part of SA,
                                                     the City of Adelaide’s canopy cover of 21.4%
                                                   (up by 1.1% from 2009 figures), has the 8th best
                                                         canopy cover of the 19 urban LGAs.

                                                    Despite a significant loss of grassed surfaces,
                                                   the City of Burnside has gained 3% shrub cover.

WHERE SHOULD ALL THE TREES GO? South Australia                                                          58
SA               COUNCIL COMMENTS
                                                                                      CITY OF ONKAPARINGA

                                                                  NICKY O’BROIN       The City of Onkaparinga undertook high-resolution
                                                       SUSTAINABILITY PLANNER
                                                                                      multispectral airborne image collection for heat and canopy in
      CITY OF WEST TORRENS
                                                                                      February 2016, however this was for our urban area only.
                                                                                      Our urban canopy cover varied from the RMIT snapshot, and
        The City of West Torrens (with the University of South Australia)
                                                                                      instead we recorded tree canopy cover of 12.5% and overall
        undertook an i-tree Canopy assessment in 2017 and came up with
                                                                                      vegetation cover of 24.8%. Our definition of a tree was over
        slightly different results to those in the RMIT report. Notably a 2.3%
                                                                                      three metres as this is the height at which cooling can begin to
        loss of canopy, compared to the 3.9% on the snapshot and a 1.6%
                                                                                      be attributed.
        increase in impervious surfaces, compared to the 4.9% increase
        reported by RMIT. Based on our sample we would be in the ‘no                  The heat mapping is difficult to compare as our focus was on
        significant change’ category.                                                 urban areas only and not the entire LGA. In terms of vulnerability
                                                                                      this would appear to us to be consistent with our understanding
        We are currently undertaking detailed heat mapping which will be
                                                                                      of the area, particularly considering that the 12.5% tree canopy
        available in due course.
                                                                                      cover is one of the lowest rates I’ve encountered.
                                                                                      One of the key challenges is that our LGA is peri-urban and
                                                                                      consequently the rural areas skew findings for tree canopy –
           CAMPBELLTOWN CITY COUNCIL
                                                                                      this would happen favourably or unfavourably depending
                                                                                      on land use. In our LGA, land is used for vineyards, cropping
          The snapshot seems in keeping with our observations. The City               and horticulture whereas in others there may be mainly
          has experienced a notable increase in subdivisions since the                national parks.
          baseline data. In 2016, there were 340 new allotments created
          and in 2015 there were 329. This compares to only 179 new
          allotments in 2014.
                                                                                                                                       JENNI MCGLENNON
          Much of the loss in green cover is on private land and unfortunately
                                                                                                                                         SUSTAINABILITY
          this is something we have little control over. Across all of                                                           COORDINATOR, STRATEGIC
          Campbelltown’s suburbs, Council data suggests an average 6%                                                                           FUTURES
          decrease in tree canopy cover from 2006 to 2016.
          Therefore the key statistic for tree canopy cover that says “no
          change” in the snapshot appears misleading – it doesn’t seem to
          align with the VHHEDA Index rating of 2 (a figure that does seem
          in keeping with our observations).
                                                                                  HENRY HAAVISTO
                                                                                  TREE MANAGEMENT
                                                                                            OFFICE
WHERE SHOULD ALL THE TREES GO? South Australia                                                                                                             59
SA              COUNCIL COMMENTS

                                                                 MAGGIE HINE
                                                       ACTING MANAGER CITY
      CITY OF PORT ADELAIDE ENFIELD                           DEVELOPMENT

       Since the data was collected for this snapshot, the City of Port
       Adelaide Enfield, along with their partners in the Adapt West Climate
       Change Adaptation Program (Cities of West Torrens and Charles
       Sturt with the support of the Adelaide Mount Lofty Ranges Natural                   CITY OF PROSPECT
       Resources Management Board), have undertaken urban heat
       mapping of the region. The councils have also undertaken further                    The areas that have been identified in the heat map are consistent
       i-tree assessments. The findings from Adapt West’s more localised                   with our data because they are either areas with a shopping
       assessment are due to be released in late 2017. These localised                     centre or vacant land. Currently, the land on the north-west
       assessments will provide more detailed information to help identify                 corner of our council area is being developed and will most
       where green infrastructure might be placed.                                         definitely include vegetation and street tree planting.
                                                                                           We have also increased our budget for our Street Tree Planting
                                                                                           program in the last year and this is consistent with the Council
                                                                                           Strategic Plan indicating increased tree canopy cover. We have
                                                                                           a Green Neighbourhoods program running that is specifically
                                                                                           looking at streets of poor tree canopy cover as we aim to achieve
                                                                                           a ‘green tunnel’ canopy cover for all streets. Currently this has
                                                                                           been captured through looking at a minimum of 70% tree canopy
                                                                                           cover. We have identified that the laneways do not achieve this
                                                                                           and will be difficult to achieve as they are so narrow.

                                                                               NINA PHILLIPS
                                                                       LANDSCAPE ARCHITECT

WHERE SHOULD ALL THE TREES GO? South Australia                                                                                                                  60
WESTERN
                                                AUSTRALIA

                                                             Kings Park, Perth
WHERE SHOULD ALL THE TREES GO? STATE BY STATE               61
WA                   WHAT’S HAPPENING?

  Average canopy cover
  urban WA is
                                                   51%          of
                                                   urban LGAs in

  19.95%                                           WA have seen a
                                                   decrease in shrubs.
  down 2.32% from

  22.27%
  in 2009.                                                               The City of Cockburn
                                                                         is of concern given that
                                                                         there has been a

                                                                         16.6%              loss
                                                                         in shrubbery and an almost
                                                                         equivalent gain in grass
                                                                         surfaces, suggesting that
                                                                         clearing may have taken place.

  41%           of                                 24%           of

                                                                               5%
  urban LGAs in WA                                 LGAs in WA have
  have experienced a                               seen an increase      The          loss of canopy in the City of Cockburn is
  significant loss                                 in hard surfaces.     almost equivalent to that of the hard surface increase.
  in canopy.

WHERE SHOULD ALL THE TREES GO? WESTern AUSTRALIA                                                                                   62
WA                  THE MOST & LEAST VULNERABLE

                                                                                                                                              2.5 Rating
                                                                                                                  City of Armadale, City of Fremantle,
                                                                                                    City of Gosnells, City of Perth, City of Rockingham
                               3.0 Rating
                               City of Bayswater, Town of Cambridge, Town of East Fremantle,                                                                            2.0 Rating
                               City of Melville, City of Stirling                                                              Town of Bassendean, City of Swan, City of Wanneroo
         3.5 Rating
         City of Joondalup, Town of Mosman Park, City of Nedlands,                                                                                                                           1.5 Rating
         City of South Perth, City of Subiaco, City of Vincent                                                                                                   City of Cockburn, Town of Victoria Park

4.0 Rating
City of Canning, Town of Cottesloe, Shire of Kalamunda,                                                                                                                                             1.0 Rating
Shire of Mundaring, The Shire of Peppermint Grove                                                                                                                                              City of Kwinana

4.5 Rating                                                                                                                                                                                          0.5 Rating
Town of Claremont                                                                                                                                                                              City of Belmont

                                                             LEAST                                                              MOST
                                                             VULNERABLE                                                   VULNERABLE

   TOP URBAN GREENING OPPORTUNITIES:
   --    City of Belmont (0.5)                                                                 --     Town of Bassendean, City of Swan, City of Wanneroo (2)
   --    City of Kwinana (1)                                                                   --     City of Armadale, City of Fremantle, City of Gosnells, City of Perth,
   --    City of Cockburn, Town of Victoria Park (1.5)                                                City of Rockingham (2.5)
                                                                                               --     City of Bayswater, Town of Cambridge, Town of East Fremantle,
                                                                                                      City of Melville, City of Stirling (3)

WHERE SHOULD ALL THE TREES GO? WESTern AUSTRALIA                                                                                                                                                           63
WA                     SNAPSHOT
                                            KEY STATISTICS                  2009*                         2016
  THE GREEN KEY                             Tree Canopy Cover               22.27%                        19.95%                                           2.32% Loss

  In technical terms, a tree is a plant     Shrub Cover                     8.73%                         7.63%                                            1.1% Loss
  over six metres, while a shrub is
                                            Grass Cover                     29.87%                        31.19%                                           1.32% Gain
  under six metres. However, for an
  accurate comparison to our                Hard Surface                    39.13%                        41.22%                                           2.09% Increase
  previous mapping report, ‘Where
  are all the trees?’, we have used
  the following definitions:                SHRUB & TREE CANOPY COVER CHANGES IN WA LGAS 2011-2016

                  Trees
                  Anything that looks
                                            10 %
                  like a tree from
                  above, distinguished       5%
                  from shrubs by the
                  shadows cast.              0%

                  Shrub                      -5 %

                  Landscaped vegetation
                  as well as bushland       -10 %

                  shrubs, crops and
                                            -15 %
                  grapevines.

                  Grass
                  Cleared road sides,       GREEN COVER GAIN & LOSS IN WA LGAS 2011-2016
                  lawns, pastures,
                  sites cleared for
                  development and           4%
                  sporting grounds.
                                             2%

                  Hard surfaces             0%
                  Asphalt, buildings,
                                            -2 %
                  car parks, footpaths,
                  sandy beaches, train      -4 %

                  lines, rocky coastlines   -6 %
                  and water.

                                                    SIGNIFICANT INCREASE   NO SIGNIFICANT CHANGE   SIGNIFICANT DECREASE                 SHRUB CHANGE

                                                                                                              * From ‘Benchmarking Australia’s Urban Tree Canopy: An i-Tree Assessment’, Final Report (2014)

WHERE SHOULD ALL THE TREES GO? WESTern AUSTRALIA                                                                                                                                                        64
Perth, WA
    WA – PERTH

    URBAN HEAT
    ISLAND MAPPING
    An urban heat island is an area
    that heats up more than – and
    stays hotter than – its surrounding
    areas due to human impact of
    hard surfaces and development.
    Colours are used below to
    differentiate intensity of urban
    heat islands.

Legend
Hottest Areas

         Hottest 16%

         Hottest 8%

         Hottest 2.5%

O         0
Map by: Alex Saunders
                      7     14 Kilometers
                          Date: 23/05/2017
                                             Sources: Esri, HERE, DeLorme, Intermap, increment P Corp., GEBCO, USGS, FAO, NPS, NRCAN, GeoBase, IGN, Kadaster NL, Ordnance Survey, Esri Japan,
                                             METI, Esri China (Hong Kong), swisstopo, MapmyIndia, © OpenStreetMap contributors, and the GIS User Community
Perth, WA
    WA – PERTH

    URBAN HEAT
    CONTINENTS
    Contiguous areas of urban heat
    spots or islands show a phenomenon
    more akin to an urban heat
    continent than a spot or island.
    The colours differentiate the
    various heat continents.

O         0        7
Map by: Alex Saunders
                          14 Kilometers
                        Date: 23/05/2017   Esri, HERE, DeLorme, MapmyIndia, © OpenStreetMap contributors, and the GIS user community
WA              THE GOOD NEWS

  The City of Armadale                      The City of Armadale         The City of Belmont has   Both the City of Belmont
  currently has                             has undergone a              also undergone an         and the City of Armadale

  46% URBAN                                 13.2%                        INCREASE                  are two of
                                                                                                   THE MOST
  TREE                                      INCREASE                     IN TREE                   DEDICATED
  CANOPY                                    IN CANOPY.                   CANOPY                    COUNCILS
  COVER                                     Hard surfaces have had       BY 3.1%                   TO URBAN
   – the second highest                     no significant increase.     This is particularly      FORESTRY,
  cover among urban LGAs                    Grassed surfaces have        important as it has       with strong targets
  in WA.                                    increased by                 happened at the           and committed urban
                                            6%                           most vulnerable end
                                                                         of the scale (0.5).
                                                                                                   forestry teams.

                                            Shrub-covered areas
                                            have decreased by

                                            18.4%
                                            This low incidence of
                                            shrubbery is most likely
                                            due to smaller plantings
                                            maturing and now being
                                            identified as tree canopy.

WHERE SHOULD ALL THE TREES GO? WESTern AUSTRALIA                                                                              67
WA                COUNCIL COMMENTS
                                                                                     CITY OF KWINANA

                                                                                     This is the first heat mapping data the City has had access to for
                                                                                     our Local Government area. It will be useful for an upcoming
                                                                    GRAY STEAD       review of our Climate Change Mitigation and Adaptation Strategy.
                                                          MANAGER OPERATIONS
                                                                                     We feel the map is broadly accurate given our experience on the
      CITY OF SUBIACO                                       AND ENVIRONMENT
                                                                                     ground. It was noted that there are a few vegetated areas that are
                                                                                     classified as hotspots. One large one in particular we noted had
        The City of Subiaco has more detailed thermal imagery to identify            been burnt recently and wondered if this had affected the results.
        heat islands and future planting areas that relates to its new town          There is also another spot that is adjacent to Bollard Bulrush
        planning scheme. A more detailed strategy will be outlined in their          wetland and we wondered if the black soil may have affected this.
        new urban forest strategy by the end of 2017.
                                                                                     There is a large suburb (Bertram) that is undergoing a street tree
                                                                                     planting program as it has very little vegetation. Given the lack
                                                                                     of street trees in this suburb, it was surprising that this was not
                                                                                     a hotspot. Belgravia is noted as a hotspot which matches our
           CITY OF VINCENT                                                           understanding of street tree coverage. There are other areas that
                                                                                     are noted as hotspots that were recently cleared. It would be
                                                                                     interesting to see how they change after urban development.
          Our team has looked at the RMIT report for our LGA and we have
          found nothing that contradicts our expectations. We are yet to
          receive our own set of canopy data for the period in question,
          which means that we have not had the opportunity to compare
          RMIT’s findings to our own dataset.                                                                                               SARAH MCCABE
                                                                                                                                    SUSTAINABILITY OFFICER
          By way of comment, we found it interesting that all the areas                       REDLAND CITY COUNCIL
          of heat vulnerability and greening opportunity identified in the
          RMIT report for our LGA are on State Government controlled
          land, where we have little if any influence on plantings. We can                   This information is not accurate/granular enough to be of much
          however use the information to advocate to State Government,                       use to the City of Darwin. We have conducted several studies
          particularly as we had already identified those areas as a priority                related to managing urban heat with trees/green spaces and
          for greening.                                                                      have work progressing in this area.

                                                                  ANITA MARRIOTT                             MICHAEL BRUVEL
                                                           SUSTAINABILITY OFFICER,                        MANAGER CLIMATE
                                                                  POLICY & PLACE                      CHANGE & ENVIRONMENT
WHERE SHOULD ALL THE TREES GO? WESTern AUSTRALIA                                                                                                              68
You can also read