GLOBE Observer and the GO on a Trail Data Challenge: A Citizen Science Approach to Generating a Global Land Cover Land Use Reference Dataset
←
→
Page content transcription
If your browser does not render page correctly, please read the page content below
METHODS
                                                                                                                                                  published: 22 April 2021
                                                                                                                                          doi: 10.3389/fclim.2021.620497

                                             GLOBE Observer and the GO on a
                                             Trail Data Challenge: A Citizen
                                             Science Approach to Generating a
                                             Global Land Cover Land Use
                                             Reference Dataset
                                             Holli A. Kohl 1,2*† , Peder V. Nelson 3† , John Pring 4 , Kristen L. Weaver 1,2 , Daniel M. Wiley 5 ,
                                             Ashley B. Danielson 5 , Ryan M. Cooper 5 , Heather Mortimer 1,2 , David Overoye 6 ,
                                             Autumn Burdick 6 , Suzanne Taylor 7 , Mitchell Haley 8 , Samual Haley 8 , Josh Lange 8 and
                           Edited by:        Morgan E. Lindblad 5,9
                   Alex de Sherbinin,
                                             1
    Columbia University, United States        National Aeronautics and Space Administration Goddard Space Flight Center, Greenbelt, MD, United States, 2 Science
                                             Systems and Applications, Inc., Lanham, MD, United States, 3 College of Earth, Ocean, Atmospheric Sciences, Oregon State
                        Reviewed by:
                                             University, Corvallis, OR, United States, 4 Geoscience Australia, Canberra, ACT, Australia, 5 Lewis and Clark National Historic
                   Celso Von Randow,
                                             Trail, National Park Service, Omaha, NE, United States, 6 Science Systems and Applications, Inc., Pasadena, CA,
 National Institute of Space Research
                                             United States, 7 Science Math Resource Center, Montana State University, Bozeman, MT, United States, 8 Scouts Australia,
                          (INPE), Brazil
                                             Chatswood, NSW, Australia, 9 School for Environment and Sustainability, University of Michigan, Ann Arbor, MI, United States
                       Nicolas Younes,
Australian National University, Australia
                   *Correspondence:          Land cover and land use are highly visible indicators of climate change and human
                            Holli A. Kohl    disruption to natural processes. While land cover is frequently monitored over a large
                    holli.kohl@nasa.gov
                                             area using satellite data, ground-based reference data is valuable as a comparison point.
     † These authors have contributed
                                             The NASA-funded GLOBE Observer (GO) program provides volunteer-collected land
    equally to this work and share first
                            authorship       cover photos tagged with location, date and time, and, in some cases, land cover type.
                                             When making a full land cover observation, volunteers take six photos of the site, one
                    Specialty section:       facing north, south, east, and west (N-S-E-W), respectively, one pointing straight up to
          This article was submitted to
           Climate Risk Management,
                                             capture canopy and sky, and one pointing down to document ground cover. Together,
                a section of the journal     the photos document a 100-meter square of land. Volunteers may then optionally tag
                     Frontiers in Climate
                                             each N-S-E-W photo with the land cover types present. Volunteers collect the data
          Received: 23 October 2020
                                             through a smartphone app, also called GLOBE Observer, resulting in consistent data.
           Accepted: 23 March 2021
            Published: 22 April 2021         While land cover data collected through GLOBE Observer is ongoing, this paper presents
                               Citation:     the results of a data challenge held between June 1 and October 15, 2019. Called “GO
           Kohl HA, Nelson PV, Pring J,      on a Trail,” the challenge resulted in more than 3,300 land cover data points from around
 Weaver KL, Wiley DM, Danielson AB,
  Cooper RM, Mortimer H, Overoye D,
                                             the world with concentrated data collection in the United States and Australia. GLOBE
Burdick A, Taylor S, Haley M, Haley S,       Observer collections can serve as reference data, complementing satellite imagery for
       Lange J and Lindblad ME (2021)
                                             the improvement and verification of broad land cover maps. Continued collection using
    GLOBE Observer and the GO on a
Trail Data Challenge: A Citizen Science      this protocol will build a database documenting climate-related land cover and land use
       Approach to Generating a Global       change into the future.
       Land Cover Land Use Reference
        Dataset. Front. Clim. 3:620497.      Keywords: citizen science, community engagement, science technology engineering mathematics (STEM),
       doi: 10.3389/fclim.2021.620497        reference data, geotagged photographs, land cover - land use

Frontiers in Climate | www.frontiersin.org                                           1                                               April 2021 | Volume 3 | Article 620497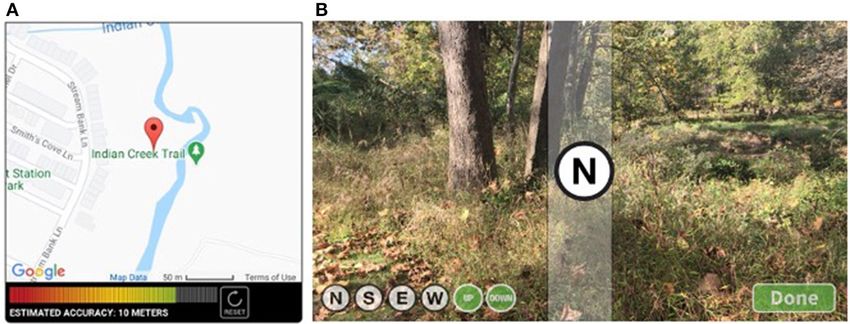
Kohl et al. GO on a Trail Data
INTRODUCTION hydrologic, soils). The GLOBE Observer Land Cover protocol,
which launched in September 2018, is built on an existing
Global land cover and land use (LCLU) mapping is critical in paper-based GLOBE Land Cover measurement protocol that
understanding the impact of changing climatic conditions and has its roots early in the GLOBE Program (Becker et al., 1998;
human decisions on natural landscapes (Sleeter et al., 2018). Bourgeault et al., 2000; Boger et al., 2006; GLOBE, 2020b). The
Modeling the biophysical aspects of climatic change requires connection to this deep history and well-established, experienced
accurate baseline vegetation data, often from satellite-derived volunteer community makes GLOBE Land Cover unique.
global LCLU data products (Frey and Smith, 2007). Satellite- This paper documents the method used to collect geotagged
based global LCLU products are generated through classification land cover reference photos through citizen science with GLOBE
algorithms and verified through the visual interpretation of Observer, including data collection, the use of a data challenge to
satellite images, detailed regional maps, and ground-based field motivate data collection, and a description and assessment of the
data (Tsendbazar et al., 2015). However, an assessment of such data collected in one such challenge, GO on a Trail, held June 1
LCLU data products found that land cover classifications agreed through October 15, 2019.
with reference data between 67 and 78% of the time (Herold
et al., 2008). Some classes, such as urban land cover, are more
MATERIALS AND EQUIPMENT
challenging to accurately identify. At high latitudes, where land
cover change has the potential to generate several positive All GLOBE Observer Land Cover data, including the data
feedback loops enhancing CO2 and methane emissions, field resulting from the GO on a Trail challenge, were collected
observations agreed with global LCLU data as little as 11% of through the NASA GLOBE Observer app. Data collection is
the time (Frey and Smith, 2007). The high volume of reference contained entirely within the app to ensure that data are uniform
data needed to refine global LCLU products can be impractical to following the defined land cover protocol. No external equipment
obtain, but geotagged photographs may have potential to inform is required. The app automatically collects date, time, and
multiple global LCLU products at relatively low cost (Tsendbazar location when a user begins an observation. Location is recorded
et al., 2015). in latitude and longitude coordinates determined through
Citizen science can be a tool for collecting widespread the mobile device’s location services [cellular, Wi-Fi, Global
reference data in support of studies of land cover and land use Positioning System (GPS)]. The accuracy of these coordinates is
change, particularly if multiple people document the same site shown on-screen, providing the user the opportunity to improve
(Foody, 2015a). For example, both the Geo-Wiki Project (Fritz the location coordinate accuracy, with a maximum accuracy of
et al., 2012) and the Virtual Interpretation of Earth Web-Interface 3-meters, or the option to manually adjust the location using
Tool (VIEW-IT) generated early citizen science-based land cover a map.
and land use reference datasets by asking volunteers to provide The collection of geotagged photographs also builds on
a visual interpretation of high-resolution satellite imagery and embedded phone technology. The GLOBE Observer app
maps (Clark and Aide, 2011; Fritz et al., 2017). Other citizen integrates the phone’s native compass sensor with the camera
science efforts, such as the Degree Confluence Project (Iwao sensor to help users center the photographs in each cardinal
et al., 2006), GeoWiki Project (Antoniou et al., 2016), Global direction. The direction is superimposed on the camera view;
Geo-Referenced Field Photo Library (Xiao et al., 2011), and the user then taps the screen to capture a photograph when the
PicturePost (Earth Observation Modeling Facility, 2020), have camera is centered on North, South, East, or West. To collect
built libraries of geotagged photographs that may also serve as uniform up and down photos, the phone’s gyroscope sensor
reference data. In this paper, we present a subset of GLOBE detects when the phone is pointed straight up and straight down
Observer Land Cover citizen science data as another potential and automatically takes a photo when the camera is appropriately
LCLU reference dataset of geotagged photographs collected oriented. Users may also upload photos directly from their device,
following a uniform protocol. a measure put in place to allow participation on devices that do
GLOBE Observer (GO) is a mobile application compatible not have compass or gyroscope (Manually uploaded photos are
with Android and Apple devices used to collect environmental flagged in the database.). Direction indicators on the bottom of
data in support of Earth science (Amos et al., 2020). GLOBE the screen turn green when a photo exists so that the user can
Observer includes four observation protocols, one of which is clearly see if more photos are needed to complete the observation.
called GLOBE Observer Land Cover. The land cover protocol The end user may review all photos and retake them as needed.
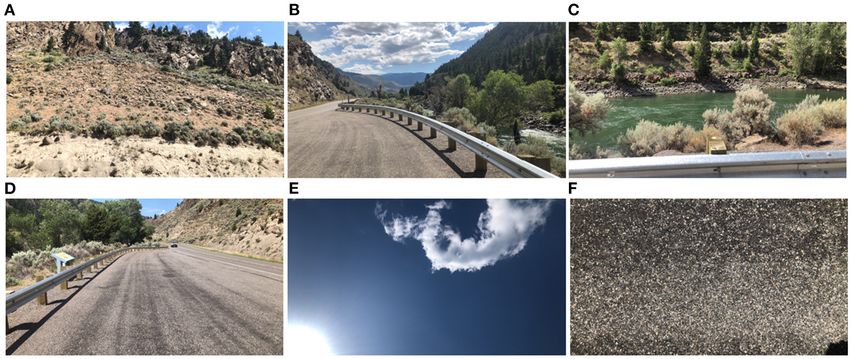
first trains citizen scientists and then facilitates recording Both the location and photography tools are shown in Figure 1.
land cover with georeferenced photographs and classifications.
GLOBE Observer is a component of the Global Learning and
METHODS
Observations to Benefit the Environment (GLOBE) Program
(https://www.globe.gov), an international science and education GO Land Cover Protocol
program in operation since 1995 (GLOBE, 2019). As such, Volunteer-collected geotagged photographs have been shown to
GLOBE Observer Land Cover data is submitted and stored provide useful reference data if a protocol is followed (Foody
in the GLOBE Program database with the GLOBE Land et al., 2017). At minimum, photos should include date, location,
Cover measurement protocol data, in addition to 25 years of and standardized tags; ideally, a photograph should be taken in
student-collected environmental data (biosphere, atmospheric, each cardinal direction to fairly sample the land cover at that
Frontiers in Climate | www.frontiersin.org 2 April 2021 | Volume 3 | Article 620497
Kohl et al.                                                                                                                                         GO on a Trail Data

  FIGURE 1 | Screenshot of the location accuracy interface (A) and the photo collection tool (B) in the GLOBE Observer app. These tools integrate the phone’s
  functions (GPS, compass, and gyroscope) to ensure land cover photographs are collected uniformly.

  FIGURE 2 | Task flow for a GLOBE Observer Land Cover observation. Users review all data submitted, including metadata.

location (Antoniou et al., 2016). The GLOBE Observer Land                             in-app tutorial to unlock the protocol tools. Training includes
Cover protocol meets these requirements. The protocol contains                        definitions of land cover, animations demonstrating how to
two components: definition of the observation site and definition                     photograph the landscape, and an interactive labeling exercise.
of the attributes of the site.                                                        The animation screens cannot be advanced until the animation
    Data collection begins with the definition of the observation                     finishes, preventing the user from skipping the training. The
site, a 100-square meter area centered on the observer. The date,                     tutorial and a simple land cover classification guide with photo
time, and location derived from carrier and phone settings are                        examples are accessible from any screen during data collection
autofilled and verified by the user.                                                  and classification. After collecting data, the volunteer sees a
    Site attributes identified in the second phase of the                             summary of the observation and has the opportunity to correct
data-collection protocol include ephemeral surface conditions                         errors before final submission. The data collection process is
(snow/ice on the ground, standing water, muddy or dry ground,                         documented in Figure 2.
leaves on trees, raining/snowing), site photos, and optionally,
land cover classification labels. Up to six photographs are taken at                  Method of Managing Data Storage and End
each location: horizontal landscape views focused on the nearest                      User Privacy
50 meters and centered on each cardinal direction, up to show                         Upon submission, all data are stored in the GLOBE Program
canopy and cloud conditions, and down to show ground cover                            database. Before storage, data, including metadata, are lightly
at the center of the site. Volunteers may label each N-S-E-W                          sanitized for privacy. Quality assessment/quality control
photo with the primary land cover types visible in the image and                      measures are performed on subsets of data and published
estimate the percentage of the 50-meter area includes that land                       separately, Figure 3.
cover type. The classification step is optional, and an observation                      Photos are manually reviewed by GLOBE Observer staff
may be submitted without classifications.                                             daily. If a staff member sees a photo with an identifiable
    To collect high quality data, users are trained before data                       person, identifying text (primarily car license plate numbers),
collection and are required to review data before submission.                         violence, or nudity, the photo is moved to a non-public
Before data collection begins, users complete an interactive                          database. During the GO on a Trail challenge, 1% of

Frontiers in Climate | www.frontiersin.org                                        3                                              April 2021 | Volume 3 | Article 620497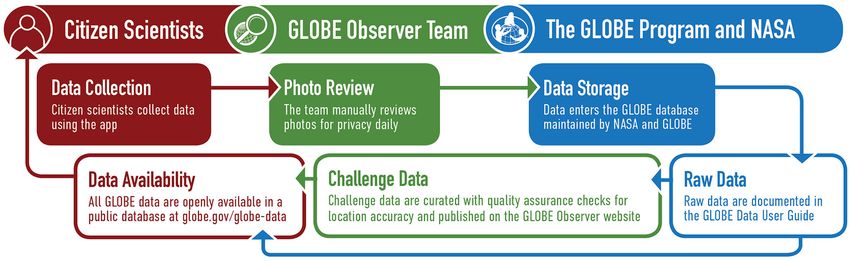
Kohl et al.                                                                                                                                        GO on a Trail Data

  FIGURE 3 | Data collection and data management workflow. Raw data are sanitized to ensure volunteer privacy, and are entirely user-inputted data. Challenge data
  and other curated datasets include quality assessments done after data submission.

photos (234 photos) were rejected. All remaining photos are                           data and data access are documented in the GLOBE Data User
entered into the public database. Photos taken with the app’s                         Guide (GLOBE, 2020a).
camera plugin are compressed to a standard size (1920 by
1,080 pixels), while manually uploaded images maintain their                          Method of Motivating Data Collection
original size.                                                                        While GLOBE Observer Land Cover data collection began in
    Camera Exchangeable Image File Format (EXIF) metadata                             September 2018 and continues through the present, this paper
is stripped from the photos to maintain user privacy before                           focuses on applications of the method to generate data during
images are stored in the system. Relevant metadata (date, time,                       a citizen science challenge called GO on a Trail and held June
location) are contained in the user-reviewed data entry. The app’s                    1 through October 15, 2019. The challenge was modeled on
location accuracy estimate is also stored with the location data.                     other successful challenges conducted through GLOBE Observer,
The app requests location from the phone up to 10 times or until                      particularly the Spring Clouds Challenge held March-April
repeat measurements are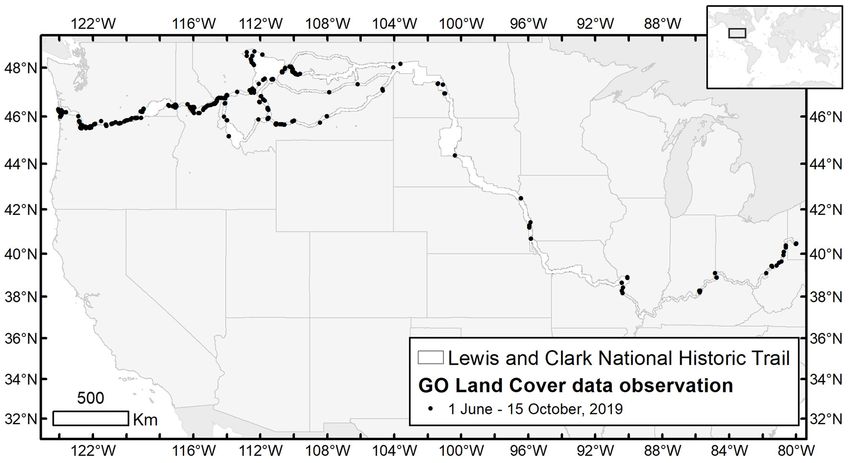
Kohl et al. GO on a Trail Data
crosses eight ecoregions, encompassing a variety of land cover error > 100 meters were removed as were submissions that lacked
types, and consists of 173 independently operated partner visitor photographs. Ninety percent of the observations submitted
centers and museums that could support volunteer recruitment passed screening. QA fields include location accuracy error,
and training. image count (0–6), number of images rejected (0–6), image
Interested visitor centers and museums were trained on null (0–6), classification for each direction (0–4), completeness
the land cover protocol and given challenge support material (image count + classification direction count/10, range of 0–1),
including data collection instructions and a large cement sticker presence/absence for each directional photo (1 is present, 0 is
to be placed at a training site near the building. Called blank), and the sequence of values for image presence/absence
Observation Stations, the stickers were designed to be locations to indicate which directions are absent in the observation.
where on-site educators could train new citizen scientists how As an initial assessment of user classification labeling, the
to collect data. Observation Stations were intended to generate MODIS/Terra + Aqua Land Cover Type Yearly L3 Global
repeat observations to gauge the variability in data collection and 500-meter classification data are included in the final data
classification across citizen scientists. More than 150 Observation file for each GO observation site. A mismatch between user
Station stickers were distributed, but it is unclear how many classification and MODIS data does not necessarily indicate that
were placed. the volunteer incorrectly labeled the land cover. Differences can
Acknowledging that many successful citizen science projects also result from LCLU change, differences in scale, or errors in the
use game theory to improve volunteer retention and to increase satellite data product. Discussion of additional planned quality
data creation (Bayas et al., 2016; National Academies of assessment of user classifications follows.
Sciences Engineering, and Medicine, 2018) and to encourage GLOBE Observer Land Cover GO on a Trail challenge
data collection at Observation Stations, a point system was data are in the supplemental data and are archived on the
implemented to award the most points (4) for observations GLOBE Observer website, https://observer.globe.gov/get-data/
collected at an Observation Station. Participants could earn land-cover-data, as a CSV file. An accompanying folder of GO
2 points per observation taken at designated historic sites on a Trail photos is provided on the website.
(United States Code, 2011) along the Trail, and 1 point per
observation taken anywhere else along the Trail. While the single RESULTS
point was meant to enable opportunistic data collection, we also
awarded a single point to data collected at the center points GO on a Trail Data Description
of Moderate Resolution Imaging Spectroradiometer (MODIS) GO on a Trail data were collected opportunistically between
pixels to encourage observations that could be matched to the June 1 and October 15, 2019, by a group of 473 citizen
global 500-meter MODIS Land Cover Type (MCD12Q1) version scientists that created 3,748 (3,352 after QA/QC) LCLU point
6 data product. The participants with the most points were observations consisting of 18,836 photos and 906 classification
recognized as the challenge top observers and received a Trail labels using the GLOBE Observer mobile app with the Land
patch and poster. Cover protocol. Observations were submitted from 37 countries
Concentrated data collection in Australia resulted from a in North and South America, Africa, Europe, Asia, and Australia
land cover data collection competition for youth participating in with concentrations in the United States (70% of all data) and
Scouts, an organization for children and youth (male and female) Australia, Figure 4. Other top contributors included Poland,
aged 5–26, and associated adults. John Pring, Geosciences United Kingdom, and Thailand. Participation varied throughout
Australia, hosted the competition, which ran June 15–October the period, with a peak in late June when the challenge was heavily
15, timed to coincide with both state-based school holidays and promoted, as shown in Figure 5. Most of the data were collected
cooler weather. The competition incorporated a points system by experienced volunteers. As is typical in many citizen science
intended to encourage observations in non-metropolitan settings projects, 6% of the participants (super users) collected 75% of the
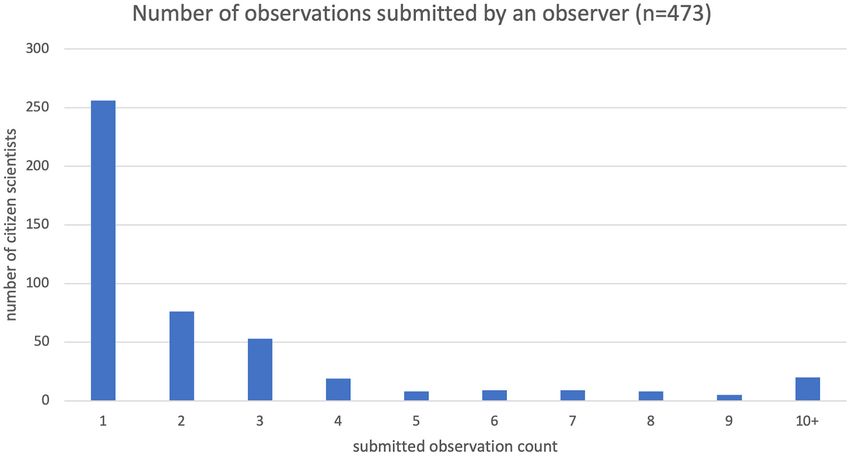
and with value increasing with distance from built up areas. data, while 54% of users submitted just one observation, Figure 6.
While 23 scouting-based teams registered through the GLOBE Twenty-seven percent (902) of the total observations were
Teams function and contributed data, two were extremely active, within the focus area of the LCNHT, defined as an area five
adding nearly 200 observations across 5 Australian states and kilometers on either side of the Trail, as shown in Figure 7.
territories. The winning team of three [aged 10, 11 (Team Ten percent of the LCNHT observations came from visitor
Captain) and 15] collected 111 LCLU observations. They also centers (potential Observation Stations), resulting in 578 images
ranked among the top GO on a Trail observers in the Asia collected within 500 meters of the visitor centers. Too few repeat
and Pacific region, contributing just over a quarter of all data observations were submitted from Observation Stations to do
submitted from the region during the challenge. the intended assessment of variability in data collection and
classification across citizen scientists.
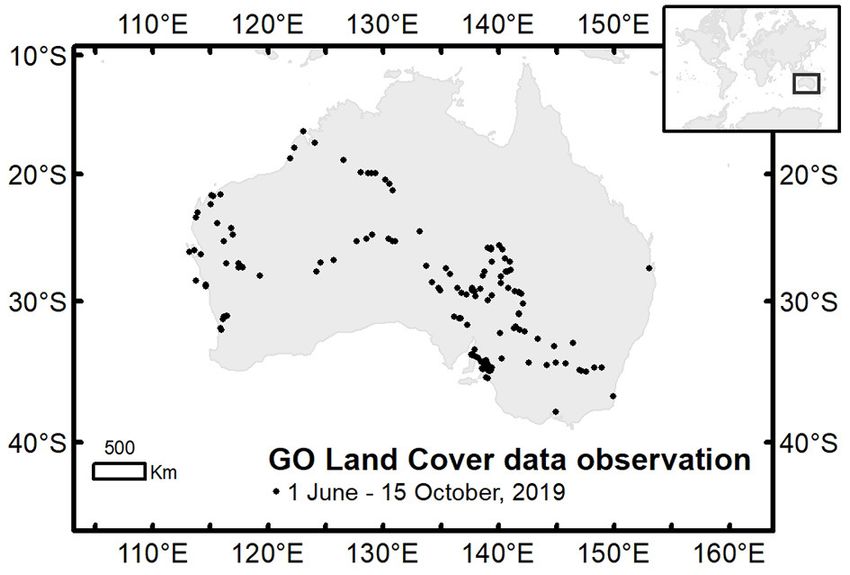
In Australia, the challenge resulted in 183 new land cover
Method for Conducting Quality Assurance observations with 1,028 photos. Teams traveled more than 20,000
on Challenge Data kilometers between them based on known home locations and
To prepare data for scientific use, challenge data were assessed the farthest data point from home collected by each team. New
for quality assurance focusing on location, data completeness, data includes contributions from extremely remote locations
and classification completeness. All data with location accuracy where other LCLU reference data are scarce, Figure 8.
Frontiers in Climate | www.frontiersin.org 5 April 2021 | Volume 3 | Article 620497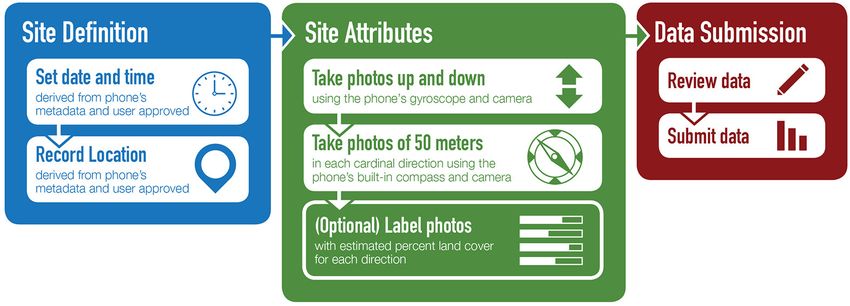
Kohl et al.                                                                                                                                            GO on a Trail Data

  FIGURE 4 | Distribution of ground reference images collected globally using the GLOBE Observer mobile app with the Land Cover protocol during the GO on a Trail
  data campaign that occurred from June 1 to October 15, 2019. Observations were reported from every continent except Antarctica, but are most concentrated in
  North America and Australia where partner-led challenges drove data collection.

  FIGURE 5 | Participation of citizen scientists in data collection varied but was consistent throughout the time period of 1 June−15 October, 2019.

   Most observations were collected in dry conditions when                              all observations with classification labels submitted during
leaves were on the trees, Table 1. Twenty-five percent of the                           this data challenge, the most common LCLU type mapped
observations include optional classification data, Table 2. For                         was herbaceous land (grasses and forbs, 387 sites) followed

Frontiers in Climate | www.frontiersin.org                                          6                                              April 2021 | Volume 3 | Article 620497
Kohl et al.                                                                                                                                         GO on a Trail Data

  FIGURE 6 | The overall challenge engaged 473 citizen scientists who primarily submitted between 1 and 9 observations while there were 20 highly-engaged
  participants who each contributed >10 observations.

  FIGURE 7 | This map shows the results of a geographically-focused portion of the data challenge with partner Lewis and Clark National Historic Trail (LCNHT) under
  the U.S. National Park Service.

by urban/developed land (197 sites). The high number                                  were also primarily herbaceous, followed by open water
of urban/developed land likely reflects opportunistic data                            and urban. Considering that grassland is the dominant land
collection, meaning participants received “credit” for data                           cover type (78%: MODIS IGBP) and that the Trail itself is
collected anywhere and these land cover types are most                                defined by roadways along rivers, these LCLU class results are
accessible to volunteers. Along the LCNHT, classified sites                           not surprising.

Frontiers in Climate | www.frontiersin.org                                        7                                              April 2021 | Volume 3 | Article 620497
Kohl et al.                                                                                                                                          GO on a Trail Data

                                                                                             direction. By the nature of the project, the spatial density of the
                                                                                             photographs is limited (Fonte et al., 2015) to 24,482 potential
                                                                                             points on land (Iwao et al., 2006). The Geo-Wiki Project also
                                                                                             accepts geotagged photos of specific, pre-defined locations for
                                                                                             brief project periods during which users upload a single photo
                                                                                             from a requested location or land cover type (Fonte et al., 2015).
                                                                                                 GLOBE data offers photographs of the four cardinal directions
                                                                                             and adds up and down photos for additional context. Figure 9
                                                                                             and Table 3 show the raw data from a single user-submitted
                                                                                             observation. While this paper focuses on data collected during
                                                                                             the GO on Trail challenge in 2019, GLOBE data collection is
                                                                                             ongoing with data reported at more than 17,000 locations in
                                                                                             123 countries.
                                                                                                 Since the primary data are geotagged photos, location
                                                                                             accuracy is the most significant data quality check done on the
  FIGURE 8 | Distribution of GLOBE Observer Land Cover observation sites                     GO on a Trail data to facilitate mapping the photos to other
  during the geographically-focused Australian data challenge June 15–October                LCLU data. Further, a published quality assessment of all GLOBE
  15, 2019.
                                                                                             Observer land cover data collected between 2016 and 2019,
                                                                                             including GO on a Trail data, found that location errors are the
TABLE 1 | Surface conditions are recorded with each GLOBE Observer Land                      most common errors (Amos et al., 2020). The GLOBE Observer
Cover observation.                                                                           app reports location accuracy estimates based on repeated queries
                                                                                             of the phone’s GPS receiver. The minimum accuracy error is 3
Type                                      True                              False
                                                                                             meters and the maximum is 100 meters with an average error
Snow/ice                                 87 (3%)                         3,265 (97%)         of 14.7 meters, Table 4. Data with location accuracy errors >
Standing water                          481 (14%)                        2,871 (86%)         100 meters (242 observations, 6%) have been eliminated from
Muddy                                   328 (10%)                        3,024 (90%)         the dataset.
Dry ground                            2,718 (81%)                         634 (19%)
                                                                                                 The dataset may include a degree of LCLU bias introduced by
Leaves on trees                        3230 (96%)                         122 (4%)
                                                                                             citizen observers. Foody (2015a) notes that a weakness of citizen-
Rain/snow                               141 (4%)                         3,211 (96%)
                                                                                             collected geotagged photos, such as GLOBE Observer photos,
                                                                                             is that certain types of land cover may be over-represented.
Most citizen scientists made observations during “dry ground” periods.                       People are known to show preferences for visiting particular land
                                                                                             cover types. Han (2007) highlighted a preference for coniferous
                                                                                             forest landscapes compared to grassland/savanna biomes. Buxton
TABLE 2 | GLOBE Observer volunteer classifications.
                                                                                             et al. (2019) noted preferences for greener landscapes in urban
MUC description                              Count                        % of total         neighborhoods. White et al. (2010) observed preferences for
                                                                                             water landscapes. Kisilevich et al. (2010) highlighted a trend
Barren                                        48                              5%             to visit and document scenic locations. Understanding these
Cultivated                                    73                              8%             potential biases, LCNHT staff used the GO on a Trail challenge to
Herbaceous                                    387                            43%             identify particularly scenic locations along the trail. Also, because
Shrubs                                        34                              4%             the data collection was more directed in this area, this sample of
Trees                                         112                            12%             land cover types observed by citizen scientists along the LCNHT
Urban                                         197                            22%             have more heterogeneity than in the global GO on a Trail data.
Wetlands                                      13                              1%             This bias will be mitigated in future challenges by encouraging
                                                                                             data collection at pre-selected sites within the app in addition to
Nine hundred six of 3,352 observations include optional classifications. Eight hundred
eighty-five records have classifications in all N-E-S-W directions and 21 have
                                                                                             allowing user-driven opportunistic data collection.
classifications in three directions.                                                             The third area to assess is the quality of volunteer-
                                                                                             assigned land cover classification labels. The optional land
                                                                                             cover labels are adapted from a hierarchical global land cover
DISCUSSION                                                                                   classification system (UNESCO, 1973) developed for the GLOBE
                                                                                             Program’s 1996 land cover protocol, on which GLOBE Observer
Data Quality Analysis                                                                        Land Cover is based, and named the Modified UNESCO
The data that results from the GO Land Cover protocol is                                     Classification (MUC) system (Becker et al., 1998; GLOBE,
a series of six photographs tagged with date, time, location,                                2020b). The subsequent GLOBE Observer land cover data labels
and, in some cases, land cover classification estimates. Other                               were required to be consistent with historic GLOBE data to
projects create collections of similar geotagged photographs.                                maintain continuity.
The Degree Confluence Project encourages users to photograph                                     As stated in the GLOBE MUC Field Guide, the original
integer latitude-longitude confluence points in each cardinal                                goal of the GLOBE Land Cover measurement protocol was

Frontiers in Climate | www.frontiersin.org                                               8                                        April 2021 | Volume 3 | Article 620497
Kohl et al. GO on a Trail Data FIGURE 9 | Sample GLOBE Observer land cover photos: (A) North, (B) East, (C) South, (D) West, (E) Up, and (F) Down. TABLE 3 | GLOBE Observer sample summary data table for a single raw data TABLE 4 | Location accuracy estimates are derived by pinging the phone’s GPS point. location service up to 10 times or until the accuracy error is
Kohl et al.                                                                                                                                                      GO on a Trail Data

TABLE 5 | Confusion matrix for GLOBE Observer Land Cover classes based on comparison with IGBP classification.

GO MUC classification                                                                   MCD12Q1_006 IGBP classification

                                Forests        Shrublands         Herbaceous         Croplands and mosaics               Seasonally or permanently inundated         Unvegetated

Forests                            65                0                 11                          4                                     3                                 29
Shrublands                         14                0                  9                          1                                     1                                 10
Herbaceous                         96                0                 118                        78                                     7                                 88
Cultivated                          8                0                  5                         31                                     0                                 11
Wetlands                            6                0                  1                          3                                     0                                  3
Unvegetated                        44                3                 67                         22                                     13                               155
Not labeled                        840              82                 431                        224                                    63                               806

Fifty-three percent of user classifications directly match IGBP classifications with an additional 10% that may match.

differences in scale (GO-classified barren vs. IGBP sparse                                      data accuracy by identifying classification success or
herbaceous). An additional 10% of volunteer classifications may                                 offering correction.
match such as a volunteer classification of herbaceous land cover                                   Bayas et al. (2020) report significant improvement in the
being assigned to a location classified as savanna or open forest                               quality of volunteers’ land cover classifications when users were
in the MODIS product. In this case, grasses may cover a greater                                 provided with timely feedback. As documented in Amos et al.
percentage of the 100-m area mapped with GO than trees. Of the                                  (2020), GLOBE Observer provides such feedback for volunteers
observations that are classified, it’s unclear how well volunteers                              who submit clouds data. Volunteers are encouraged to take
are estimating percent cover. Dodson et al. (2019) reported                                     cloud observations when a satellite is overhead through an alert
that GLOBE citizen scientists estimating percent cloud cover in                                 that appears 15 min before the overpass. Data concurrent with
the GLOBE Observer Clouds tool tend to overestimate percent                                     an overpass are matched to the satellite-derived cloud product
cover compared to concurrent satellite data. This means that                                    from that overpass, and the user is sent an email that compares
GLOBE Observer Land Cover percent estimates, which are done                                     their observation to the satellite classification. Daily cloud data
following a similar protocol, may also be high and should be                                    submissions peak during satellite overpass times, indicating that
viewed not as quantitative data, but as a means to gauge general                                the alert combined with feedback motivate data collection. We
land cover representation in the area.                                                          are exploring mechanisms to provide a similar satellite match
    GLOBE Observer is implementing two initiatives to further                                   email for land cover data. Such a system would not only provide
assess and remove errors in classification. First, GLOBE Observer                               feedback, but also flag observations that report land cover
is exploring the potential use of artificial intelligence/machine                               that differs from the matched data product. These sites could
learning (AIML) to identify land cover in the photos. The                                       be reviewed by experts to identify volunteer errors and offer
second initiative is a secondary classification of the photos by                                feedback or to identify change or errors in the satellite-based land
other citizen science volunteers, an approach such as those                                     cover product.
employed by Geo-Wiki Project’s Picture Pile (Danyo et al.,                                          Since a desire to contribute meaningfully to science motivates
2018) or classification projects on the Zooniverse platform                                     GLOBE Observer users, data completeness may also improve if
(Rosenthal et al., 2018). Further analysis is required to compare                               volunteers are asked to collect specific types of data to meet a
the accuracy of AIML classification and secondary classification                                particular science objective. To that end, an in-app mechanism
to primary classification.                                                                      is under development to enable scientists to request observations
    AIML and secondary classification will also expand the                                      at designated observation sites. By communicating the scientific
number of geotagged photos that include classification                                          need for data and making it simple for volunteers to identify
labels. GLOBE Observer is additionally pursuing incentives                                      where to collect the most useful data, we will provide motivation
to encourage volunteers to submit complete and accurate                                         for complete and accurate data collection.
observations by completing phase two of data collection.
While recognition for “winning” does motivate people                                            Data Applications
to participate in challenges, feedback may provide a                                            The GLOBE Observer Land Cover dataset is a relatively new
more powerful mechanism for encouraging routine data                                            but growing data set and the authors suggest some potential
completeness and accuracy. A survey of GLOBE Observer                                           data applications. First, the photos could be used on their own
users found that the majority of active participants                                            in a standard photo monitoring approach (e.g., Sparrow et al.,
contribute because they are interested in contributing to                                       2020) to estimate current conditions or for tracking LCLU
NASA science and that some that stop participating do so                                        changes over time. Second, if a photo was not classified by a
because they feel that a lack of feedback from the project                                      GO citizen scientist, there are improvements in computer vision
indicates that their contributions aren’t useful (Fischer                                       processing to automatically identify land cover (Xu et al., 2017)
et al., 2021). Clear feedback will help users understand                                        or elements like woody vegetation (Bayr and Puschmann, 2019)
the value of complete and accurate data and will improve                                        and thus be incorporated in a variety of software workflows.

Frontiers in Climate | www.frontiersin.org                                                 10                                                 April 2021 | Volume 3 | Article 620497
Kohl et al. GO on a Trail Data
Third, the ground reference photos could support remote sensing AUTHOR CONTRIBUTIONS
activities that rely on human cognition (White, 2019) and readily-
accessible datasets to accurately label satellite imagery such as HK and KW manage GLOBE Observer and conceived of the GO
developing datasets for LCLU mapping and monitoring with on a Trail data challenge. HK, PN, and DO designed the GLOBE
tools such as TimeSync (Cohen et al., 2010) and Collect Earth Observer Land Cover protocol, and DO led the development
(Bey et al., 2016; Saah et al., 2019) or in the attribution of of the app data collection tool. AD, RC, and DW planned and
land cover change (e.g., Kennedy et al., 2015). The growing implemented the LCNHT portion of the GO on a Trail challenge,
dataset could support both of these examples via the provision contributed to communications, and supported trail partners.
of landscape level observations across widely dispersed areas. A ML did the secondary classification of trail data. JP led the
deep review is underway to assess how well the GO photos map Australia Scouts challenge. PN, AD, and ST collected the most
to satellite data which of these applications are most viable. GLOBE Observer land cover data along the LCNHT. MH, SH,
Foody (2015b) and Stehman et al. (2018) both note and JL were the Scouts who collected the most data in the
the potential large impact on statistical or area estimation Australia data challenge. AB managed communication to recruit
in LCLU mapping if reference data is not collected in citizen scientists to participate in the challenge. PN did much of
a specific manner. The increasing temporal and spatial the data analysis presented in this paper. HK wrote most of the
breadth of the GO Land Cover dataset should support the manuscript, and PN contributed significantly, particularly to the
verification of remote sensing Land Cover mapping and discussion. JP and KW also contributed to the text. HM designed
the determination of “error-adjustment[s]” suggested by both challenge graphics and Figures 2, 3. All authors contributed to
Foody and Stehman. Indeed, use of geotagged photos as a the final manuscript.
supporting data source to inform land cover maps is not
without precedent, and LCLU data could be “radically improved” FUNDING
with the introduction of more quality volunteer-produced data
(Fonte et al., 2015). Iwao et al. (2006) established that photos GLOBE Observer was funded by the NASA Science Activation
collected in the Degree Confluence Project provided useful award number NNX16AE28A for the NASA Earth Science
validation information for three global land cover maps. The Education Collaborative (NESEC; Theresa Schwerin, PI). The
Geo-Wiki Project also demonstrated the potential value of GLOBE Program was sponsored by the National Aeronautics
geotagged photos in a handful of case studies (Antoniou et al., and Space Administration (NASA); supported by the National
2016). Science Foundation (NSF), National Oceanic and Atmospheric
The GLOBE Land Cover photo library similarly has the Administration (NOAA), and U.S. Department of State; and
potential to contribute quality reference data to the land cover implemented by the University Corporation for Atmospheric
and land use research community. The location accuracy of Research. The GLOBE Data Information Systems Team
GLOBE Observer georeferenced photos is 100 meters or better developed and supports the GLOBE Observer app.
for 80% of the data and 10 meters or better for 60% of the data.
This is sufficient to place the photos within a single pixel of ACKNOWLEDGMENTS
moderate-resolution satellite-based LCLU products, such as the
MODIS Land Cover Map. Up to 63% of volunteer classification The authors express appreciation for the citizen scientists who
labels align with the MODIS Land Cover product. Cases of volunteer their time to collect GLOBE Observer data. The
mismatched labeling require deeper investigation, but ongoing authors acknowledge the contribution of the broader GLOBE
assessment of volunteer and expert classification labels will add Observer team to implementing the GO on a Trail challenge.
value to GO on a Trail data. Finally, the authors thank the three reviewers for their thoughtful
and constructive feedback.
DATA AVAILABILITY STATEMENT
SUPPLEMENTARY MATERIAL
The datasets presented in this study can be found in online
repositories. The names of the repository/repositories and The Supplementary Material for this article can be found
accession number(s) can be found below: https://observer.globe. online at: https://www.frontiersin.org/articles/10.3389/fclim.
gov/get-data/land-cover-data. 2021.620497/full#supplementary-material
REFERENCES Bayas, J. C. L., See, L., Bartl, H., Sturn, T., Karner, M., et al. (2020). Crowdsourcing
LUCAS: citizens generating reference land cover and land use data with a
Amos, H. M., Starke, M. J., Rogerson, T. M., Colón Robles, M., Andersen, T., et al. mobile app. Land 9:446. doi: 10.3390/land9110446
(2020). GLOBE Observer Data: 2016–2019. Earth Space Sci. 7:e2020EA001175. Bayas, J. C. L., See, L., Fritz, S., Sturn, T., Preger, C., Durauer, M., et al. (2016).
doi: 10.1029/2020EA001175 Crowdsourcing in-situ data on land cover and land use gamification and mobile
Antoniou, V., Fonte, C. C., See, L., Estima, J., Arsanjani, J. J., Lupia, F., et al. (2016). technology. Remote Sens. 8:905. doi: 10.3390/rs8110905
Investigating the feasibility of geo-tagged photographs as sources of land cover Bayr, U., and Puschmann, O. (2019). Automatic detection of woody
input data. Int. J. Geo Inform. 5:64. doi: 10.3390/ijgi5050064 vegetation in repeat landscape photographs using a conventional
Frontiers in Climate | www.frontiersin.org 11 April 2021 | Volume 3 | Article 620497Kohl et al. GO on a Trail Data neural network. Ecol. Inform. 50, 220–233. doi: 10.1016/j.ecoinf.2019. Fritz, S., McCallum, I., Schill, C., Perger, C., See, L., Schepaschenko, D., et al. (2012). 01.012 Geo-Wiki: an online platform for improving global land cover. Environ. Model. Becker, M. L., Congalton, R. G., Budd, R., and Fried, A. (1998). A GLOBE Software 31, 110–123. doi: 10.1016/j.envsoft.2011.11.015 collaboration to develop land cover data collection and analysis protocols. J. Fritz, S., See, L., Perger, C., McCallum, I., Schill, C., Schepaschenko, D., et al. (2017). Sci. Educ. Technol. 7, 85–96. doi: 10.1023/A:1022540300914 A global dataset of crowdsourced land cover and land use reference data. Sci. Bey, A., Sánchez-Paus Díaz, A., Maniatis, D., Marchi, G., Mollicone, D., Ricci, Data 4:170075. doi: 10.1038/sdata.2017.75 S., et al. (2016). Collect earth: land use and land cover assessment through GLOBE (2019). About GLOBE. Global Learning and Observations to Benefit augmented visual interpretation. Remote Sens. 8:807. doi: 10.3390/rs8100807 the Environment. Available online at: https://www.globe.gov/about/overview Boger, R., LeMone, P., McLaughlin, J., Sikora, S., and Henderson, S. (2006). (accessed October 21, 2020). “GLOBE ONE: a community-based environmental field campaign,” in GLOBE (2020a). GLOBE Data User Guide. Global Learning and Observations Monitoring Science and Technology Symposium: Unifying Knowledge for to Benefit the Environment. Available online at: https://www.globe.gov/globe- Sustainability in the Western Hemisphere Proceedings RMRS-P-42CD, eds C. data/globe-data-user-guide (accessed October 21, 2020). Aguirre-Bravo, J. P. Pellicane, D. P. Burns, and S. Draggan (Fort Collins, CO: GLOBE (2020b). MUC Field Guide, A Key to Land Cover Classification. Global U.S. Department of Agriculture, Forest Service, Rocky Mountain Research Learning and Observations to Benefit the Environment. Available online Station), 500–504. at: https://www.globe.gov/documents/355050/355097/MUC+Field+Guide/ Bourgeault, J. L., Congalton, R. G., and Becker, M. L. (2000). “GLOBE MUC-A- 5a2ab7cc-2fdc-41dc-b7a3-59e3b110e25f (accessed October 20, 2020). THON: a method for effective student land cover data collection,” in IGARSS Han, K-T. (2007). Responses to six major terrestrial biomes in terms of 2000. IEEE 2000 International Geoscience and Remote Sensing Symposium. scenic beauty, preference, and restorativeness. Environ. Behav. 39, 529–556. Taking the Pulse of the Planet: The Role of Remote Sensing in Managing the doi: 10.1177/0013916506292016 Environment. Proceedings Cat. No.00CH37120 (Honolulu, HI: IEEE), 551–553. Herold, M., Mayaux, P., Woodcock, C. E., Baccii, A., and Scmullius, A. (2008). Buxton, J. A., Ryan, R. L., and Wells, N. M. (2019). Exploring preferences for urban Some challenges in global land cover mapping: an assessment of agreement greening. Cities Environ. 12:3. Available online at: https://digitalcommons.lmu. and accuracy in existing 1 km datasets. Remote Sens. Environ. 112, 2538–2556. edu/cate/vol12/iss1/3 doi: 10.1016/j.rse.2007.11.013 Clark, M. L., and Aide, T. M. (2011). Virtual Interpretation of Earth Web-Interface Iwao, K., Nishida, K., Kinoshita, T., and Yamagata, Y. (2006). Validating land Tool (VIEW-IT) for collecting land-use/land-cover reference data. Remote cover maps with degree confluence project information. Geophys. Res. Lett. Sens. 3, 601–620. doi: 10.3390/rs3030601 33:L23404. doi: 10.1029/2006GL027768 Cohen, W. B., Yang, Z., and Kennedy, R. (2010). Detecting trends in forest Kennedy, R.E, Yang, Z., Braaten, J., Copass, C., Antonova, N., Jordan, C., and disturbance and recovery using yearly Landsat time series: 2. TimeSync - Nelson, P. (2015). Attribution of disturbance change agent from Landsat time- Tools for calibration and validation. Rem. Sens. Environ. 114, 2911–2924. series in support of habitat monitoring in the Puget Sound region, USA. Remote doi: 10.1016/j.rse.2010.07.010 Sens. Environ. 166, 271–285. doi: 10.1016/j.rse.2015.05.005 Colón Robles, M., Amos, H. M., Dodson, J. B., Bowman, J., Rogerson, T., Kisilevich, S., Krstajic, M., Keim, D., Andrienko, N., and Andrienko, G. Bombosch, A., et al. (2020). Clouds around the world: how a simple citizen (2010). “Event-based analysis of people’s activities and behavior using Flickr science data challenge became a worldwide success. Bull. Amer. Meteor. Soc. and Panoramio geotagged photo collections,” in Proceedings of the 14th 101, E1201–E1213. doi: 10.1175/BAMS-D-19-0295.1 International Conference on Information Visualisation (IV), London, UK, 26–29 Danyo, O., Moorthy, I., Sturn, T., See, L., Laso Bayas, J.-C., Domian, D., et al. July 2010, 289–296. (2018). “The picture pile tool for rapid image assessment: a demonstration Li, Z., White, J. C., Wulder, M., Hermosilla, T., Davidson, A. M., and Comber, A. using hurricane matthew,” in ISPRS Annals of the Photogrammetry, Remote J. (2020). Land cover harmonization using Latent Dirichlet allocation. Int. J. Sensing and Spatial Information Sciences. IV-4, 2018. Geograph. Inform. Sci. 35, 348–374. doi: 10.1080/13658816.2020.1796131 Dodson, J. B., Colón Robles, M., Taylor, J. E., DeFontes, C. C., and Weaver, Loveland, T. R., and Belward, A. S. (1997). The IGBP-DIS global 1km land K. L. (2019). Eclipse across America: citizen science observations of the 21 cover data set, DISCover: first results. Int. J. Remote Sens. 18, 3289–3295. August 2017 total solar eclipse. J. Appl. Meteorol. Climatol. 58, 2363–2385. doi: 10.1080/014311697217099 doi: 10.1175/JAMC-D-18-0297.1 National Academies of Sciences Engineering, and Medicine (2018). Learning Earth Observation and Modeling Facility, University of Oklahoma (2020). Picture Through Citizen Science: Enhancing Opportunities by Design. Washington, DC: Post. Available online at: https://picturepost.ou.edu/ (accessed October 21, The National Academies Press. 2020). Rosenthal, I. S., Byrnes, J. E.K, Cavanaugh, K. C., Bell, T. W., Harder, B., Haupt, A. Fischer, H. A., Cho, H., and Storksdieck, M. (2021). Going beyond hooked J., et al. (2018). Floating forests: quantitative validation of citizen science data participants: the nibble and drop framework for classifying citizen science generated from consensus classifications. Phys. Soc. arXiv. arXiv:1801.08522 participation. Citizen Sci. Theory Pract. 6, 1–18. doi: 10.5334/cstp.350 Saah, D., Johnson, G., Ashmall, B., Tondapu, G., Tenneson, K., Patterson, M., et al. Fonte, C. C., Bastin, L., See, L., Foody, G., and Lupia, F. (2015). Usability of VGI (2019). Collect Earth: An online tool for systematic reference data collection for validation of land cover maps. Int. J. Geograph. Inform. Sci. 29, 1269–1291. in land cover and use applications. Environ. Model. Softw. 118, 166–171. doi: 10.1080/13658816.2015.1018266 doi: 10.1016/j.envsoft.2019.05.004 Foody, G., Fritz, S., Fonte, C. C., Bastin, L., Olteanu-Raimond, A.-M., Mooney, Saah, D., Tenneson, K., Poortinga, A., Nguyen, Q., Chishtie, F., Aung, K. S., et al. P., et al. (2017). “Mapping and the citizen sensor,” in Mapping and the Citizen (2020). Primitives as building blocks for constructing land cover maps. Int. J. Sensor, eds G. Foody, L. See, S. Fritz, P. Mooney, A. M. Olteanu-Raimond, C. Appl. Earth Observ. Geoinform. 85:101979. doi: 10.1016/j.jag.2019.101979 C. Fonte, and V. Antoniou (London: Ubiquity Press), 1–12. Sleeter, B. M. T., Loveland, T., Domke, G., Herold, N., Wickham, J., et al. Foody, G. M. (2015a). “An assessment of citizen contributed ground reference (2018). “Land Cover and Land-Use Change,” in Impacts, Risks, and Adaptation data for land cover map accuracy assessment,” in ISPRS Annals of the in the United States: Fourth National Climate Assessment, Vol II, eds D. R. Photogrammetry, Remote Sensing and Spatial Information Sciences, II-3/W5, Reidmiller, C. W. Avery, D. R. Easterling, K. E. Kunkel, K. L.M. Lewis, T. K. 219–225. doi: 10.5194/isprsannals-II-3-W5-219-2015 Maycock, and B. C. Stewart (Washington, DC: U.S. Global Change Research Foody, G. M. (2015b). Valuing map validation: the need for rigorous Program), 202–231. land cover map accuracy assessment in economic valuation of Sparrow, B., Foulkes, J., Wardle, G., Leitch, E., Caddy-Retalic, S., van Leeuwen, S., ecosystem services. Ecol. Econ. 111, 23–28. doi: 10.1016/j.ecolecon.2015. et al. (2020). A vegetation and soil survey method for surveillance monitoring of 01.003 rangeland environments. Front. Ecol. Evol. 8:157. doi: 10.3389/fevo.2020.00157 Frey, K. E., and Smith, L. C. (2007). How well do we know northern land Stehman, S. V., Fonte, C. C., Foody, G. M., and Linda See, L. (2018). Using cover? Comparison of four global vegetation and wetland products with a volunteered geographic information (VGI) in design-based statistical inference new ground-truth database for West Siberia. Glob. Biogeochem. Cycles 21:1. for area estimation and accuracy assessment of land cover. Remote Sens doi: 10.1029/2006GB002706 Environ. 212, 47–59. doi: 10.1016/j.rse.2018.04.014 Frontiers in Climate | www.frontiersin.org 12 April 2021 | Volume 3 | Article 620497
Kohl et al.                                                                                                                                                 GO on a Trail Data

Sulla-Menashe, D., and Friedl, M. A. (2018). User Guide to Collection 6 MODIS              Xu, G., Zhu, X., Fu, D., Dong, J., and Xiao, X. (2017). Automatic land
   Land Cover (MCD12Q1 and MCD12C1) Product. Land Processes Distributed                       cover classification of geo-tagged field photos by deep learning.
   Active Archive Center. Available online at: https://lpdaac.usgs.gov/documents/             Environ. Model. Software 91, 127–134. doi: 10.1016/j.envsoft.2017.
   101/MCD12_User_Guide_V6.pdf                                                                02.004
Tsendbazar, N. E., de Bruin, S., and Herold, M. (2015). Assessing global land cover        Yang, H., Li, S., Chen, J., Zhang, X., and Xu, S. (2017). The Standardization and
   reference datasets for different user communities. ISPRS J. Photogram. Remote              harmonization of land cover classification systems towards harmonized
   Sens. 103, 93–114. doi: 10.1016/j.isprsjprs.2014.02.008                                    datasets: a review. ISPRS Int. J. Geo Inf. 6:5. doi: 10.3390/ijgi60
UNESCO (1973). International Classification and Mapping of Vegetation, Series 6,              50154
   Ecology and Conservation. Paris, France: United Nations Educational, Scientific
   and Cultural Organization.                                                              Conflict of Interest: HK, KW, HM, DO, and AB were employed by the company
United States Code, 2006 Edition, Supplement 5 (2011). “Chapter 27 - National              Science Systems and Applications, Inc.
   Trails System” in Title 16 - Conservation. U.S. Government Publishing
   Office. Available online at: https://www.govinfo.gov/app/details/USCODE-                The remaining authors declare that the research was conducted in the absence of
   2011-title16/USCODE-2011-title16-chap27 (accessed April 7, 2021).                       any commercial or financial relationships that could be construed as a potential
White, A. R. (2019). Human expertise in the interpretation of remote sensing data:         conflict of interest.
   A cognitive task analysis of forest disturbance attribution. Int. J. Appl. Earth
   Observ. Geoinform. 74, 37–44. doi: 10.1016/j.jag.2018.08.026                            Copyright © 2021 Kohl, Nelson, Pring, Weaver, Wiley, Danielson, Cooper, Mortimer,
White, M., Smith, A., Humphryes, K., Pahl, S., Snelling, D., et al. (2010). Blue           Overoye, Burdick, Taylor, Haley, Haley, Lange and Lindblad. This is an open-access
   space: The importance of water for preference, affect, and restorativeness              article distributed under the terms of the Creative Commons Attribution License (CC
   ratings of natural and built scenes. J. Environ. Psychol. 30, 482–493.                  BY). The use, distribution or reproduction in other forums is permitted, provided
   doi: 10.1016/j.jenvp.2010.04.004                                                        the original author(s) and the copyright owner(s) are credited and that the original
Xiao, X., Dorovskoy, P., Biradar, C., and Bridge, E. (2011). A library                     publication in this journal is cited, in accordance with accepted academic practice.
   of georeferenced photos from the field. Eos Trans. AGU 92:453.                          No use, distribution or reproduction is permitted which does not comply with these
   doi: 10.1029/2011EO490002                                                               terms.

Frontiers in Climate | www.frontiersin.org                                            13                                                April 2021 | Volume 3 | Article 620497
You can also read