Reconstructing three decades of total international trawling effort in the North Sea
←
→
Page content transcription
If your browser does not render page correctly, please read the page content below
Earth Syst. Sci. Data, 12, 373–386, 2020
https://doi.org/10.5194/essd-12-373-2020
© Author(s) 2020. This work is distributed under
the Creative Commons Attribution 4.0 License.

             Reconstructing three decades of total international
                      trawling effort in the North Sea
                           Elena Couce1 , Michaela Schratzberger1,2 , and Georg H. Engelhard1,2
       1 Centre   for Environment, Fisheries & Aquaculture Science (Cefas), Pakefield Road, Lowestoft NR33 0HT, UK
                   2 Collaborative Centre for Sustainable Use of the Seas (CCSUS), University of East Anglia,

                                                      Norwich NR4 7TJ, UK
                                  Correspondence: Elena Couce (elena.couce@cefas.co.uk)

                                       Received: 31 May 2019 – Discussion started: 18 July 2019
                         Revised: 20 January 2020 – Accepted: 21 January 2020 – Published: 17 February 2020

       Abstract. Fishing – especially trawling – is one of the most ubiquitous anthropogenic pressures on marine
       ecosystems worldwide, yet very few long-term, spatially explicit datasets on trawling effort exist; this greatly
       hampers our understanding of the medium- to long-term impact of trawling. This important gap is addressed
       here for the North Sea, a highly productive shelf sea which is also subject to many anthropogenic pressures. For
       a 31-year time span (1985–2015), we provide a gridded dataset of the spatial distribution of total international
       otter and beam trawling effort, with a resolution of 0.5◦ latitude by 1◦ longitude, over the North Sea. The dataset
       was largely reconstructed using compiled effort data from seven fishing effort time series, each covering shorter
       time spans and only some of the countries fishing the North Sea. For the years where effort data for particular
       countries were missing, the series was complemented using estimated (modelled) effort data. This new, long-
       term and large-scale trawling dataset may serve the wider scientific community, as well as those involved with
       policy and management, as a valuable information source on fishing pressure in a large marine ecosystem which
       is heavily impacted but which simultaneously provides a wealth of ecosystem services to society. The dataset is
       available on the Cefas Data Hub at: https://doi.org/10.14466/CefasDataHub.61, version 2 (Couce et al., 2019).

1   Introduction                                                    explicit datasets on trawling effort, and this has hampered
                                                                    our understanding of the direct and indirect effects of trawl-
                                                                    ing pressure on the marine environment (Collie et al., 2017;
Coastal and shelf seas are of great value to human soci-            Jennings et al., 2001).
eties and, being more productive than open oceans, provide             The North Sea is one of the world’s most important shelf
some 80 % of the world’s wild-capture fisheries (Watson et          seas in terms of fishery production – and has been so for cen-
al., 2016). Yet the process of fishing that is required to ob-      turies, “feeding” some of the world’s most densely populated
tain these benefits and services also exerts a major anthro-        areas (e.g. Capuzzo et al., 2018). Yet it is also subject to ex-
pogenic pressure on shelf seas worldwide – along with cli-          tensive anthropogenic pressures due to its geographical loca-
mate change, pollution, eutrophication, and habitat loss (Hid-      tion in central Europe surrounded by seven countries, with
dink et al., 2006; Jennings et al., 2016). Trawling is consid-      concerns about pollution, habitat degradation, major ecosys-
ered one of the more invasive fishing methods, as it does           tem changes, and overfishing (Emeis et al., 2015; Kenny et
not only impact target fish populations (through removal            al., 2018). Trawling, in particular, is seen as one of the most
of fish and size-selective harvesting) but also has wider-          significant impacts on not only fish but also marine benthos
ranging ecosystem effects, including on benthic organisms           in the North Sea (Kenny et al., 2018).
and habitats and other non-target species (Hiddink et al.,             Two trawl fishing methods predominate in the North Sea,
2017; Jennings et al., 2001; Schratzberger et al., 2002). Un-       and generally in shelf seas worldwide: beam trawlers (de-
fortunately, there is a lack of available long-term, spatially

Published by Copernicus Publications.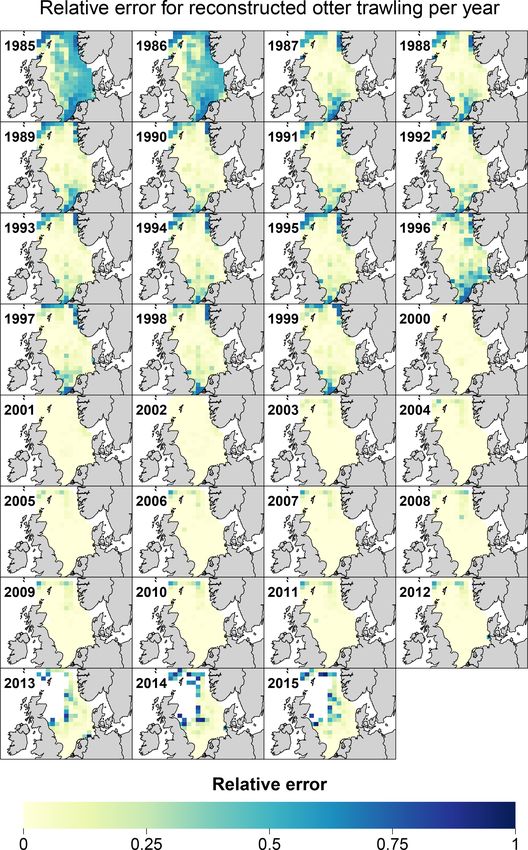
374                                       E. Couce et al.: Reconstructing three decades of total international trawling effort

fined as any vessels towing nets supported by a rigid beam,       gium, Denmark, England, France, Germany, the Netherlands,
usually one lowered from each side of the vessel) and otter       Norway, Scotland, and Sweden (in the case of Sweden, otter
trawlers (defined as any vessels towing bottom-fishing nets       trawling only, since its contribution to beam trawling effort
held open by trawl doors; Engelhard, 2008; Jennings et al.,       is absent or negligible; see STECF, 2017). These countries
2001). Both fishing methods impact the seabed and marine          are the most significant contributors to trawling effort in the
life, although in subtly different ways: with beam trawlers in    North Sea region, together comprising >99 % of the total ef-
particular catching flatfish and the gear having particularly     fort (García-Carreras et al., 2015; Greenstreet et al., 2007;
close and invasive contact with the seabed and benthos, and       STECF, 2017). The effort was quantified as number of hours
otter trawlers in particular catching roundfish and the gear      fishing in a year per ICES rectangle, recorded separately for
having less close contact with the ground but often over a        beam and otter trawling (Couce et al., 2019).
much larger area and fish being caught over a higher “verti-
cal area” within the water column (Jennings et al., 2001).        2.1   Compilation of existing datasets on trawling effort
   The North Sea has been extensively studied in terms of
ecology and oceanography, with historical datasets dating         Seven datasets on trawling effort were included, covering
back to the late 19th or early 20th centuries (e.g. Engel-        different intervals within our 1985–2015 study period (see
hard et al., 2014; Morris et al., 2018; Rijnsdorp and Millner,    Fig. 1a for an overview), with only one of these, trawling
1996; Sguotti et al., 2016). This facilitates studies of long-    by vessels landing into England, covering the full time span
term change which are rare in marine research. However,           examined. Each of these datasets included either one or mul-
the availability of historical fishing effort data is very lim-   tiple countries, and in the latter case two datasets provided
ited, because time spent fishing and location choices are of-     only the aggregated total for multiple countries combined
ten linked to commercial interests of the fishing industry. Re-   and not for each country separately (but disaggregated by
luctance to share such data has resulted in a scarcity of long-   rectangle). In the following paragraphs, we briefly describe
term spatially explicit temporal data on fishing pressure. This   all datasets used.
paper aims at addressing this gap by presenting a 31-year-           For the earliest period until 1995, data were collated from
long, spatially detailed dataset of total international trawl-    Jennings et al. (1999), who assembled two different trawling
ing effort for the North Sea, distinguishing between otter and    pressure datasets from the North Sea, differing in time span
beam trawlers. There have been various previous attempts at       covered and countries included. The first of these (here re-
putting together spatio-temporal datasets on trawling effort      ferred to as “Jennings et al. dataset 1”; see Fig. 1a) compiled
for the North Sea region, which have provided partial snap-       effort data for 1977–1995 by English, German, Norwegian,
shots of the fishing in what is one of the most intensively ex-   Scottish, and Welsh vessels. The second of these (here re-
ploited regions of the world (Callaway et al., 2002; Jennings     ferred to as “Jennings et al. dataset 2”; see Fig. 1a) covered a
et al., 1999). Unfortunately, while such evidence is available    shorter time span (1990–1995) but included effort by Danish
for distinct periods (e.g. see STECF, 2017, for the more re-      and Dutch vessels in addition to those in the first dataset. For
cent period and Jennings et al., 1999, for the early 1990s), it   both of these datasets, only the data aggregated over all coun-
is not available for longer, multidecadal time spans. Here we     tries included were available, with no information on sepa-
compile existing datasets, and “fill in the gaps” by estimating   rate countries’ contributions to the total (as had been agreed
likely country-level fishing effort in periods for which “nom-    a priori by the different countries’ institutions participating
inal” data were lacking, in order to reconstruct as complete a    in the study). More details on the data and their sources can
picture as possible for the period from 1985 to 2015.             be found in Jennings et al. (1999).
   We envisage that the trawling effort data reconstructed           The MAFCONS project (“Managing Fisheries to Con-
here will be of great use for researchers who seek to under-      serve Groundfish and Benthic Invertebrate Species Di-
stand the impacts of commercial fisheries on marine organ-        versity”, http://www.vliz.be/projects/mafcons/, last access:
isms, making use of the plethora of other historical datasets     March 2018) assembled data on demersal trawling and sein-
available in this region.                                         ing effort in the North Sea for the period 1997–2002 for
                                                                  Dutch, German, Norwegian, and UK vessels (Greenstreet et
                                                                  al., 2007). As in Jennings et al. (1999), data were aggre-
2   Methods                                                       gated as hours fishing by ICES rectangle. For Dutch and
                                                                  Scottish vessels this had to be estimated, since the data were
For the 31-year period from 1985 to 2015, we collated or esti-    provided as “days absent from port” rather than number of
mated data on total (demersal) otter and beam trawling effort     hours fishing (for the method followed, see Greenstreet et
per year for the North Sea, defined as ICES (International        al., 2007, 2009). Unlike for Jennings et al. (1999), total ef-
Council for the Exploration of the Sea) Subarea IV. Specif-       fort was broken down into individual country contributions.
ically, the data were spatially separated to the level of ICES    Data for the effort of beam trawling for the German fleet in
statistical rectangles (0.5◦ latitude by 1◦ longitude). We did    the MAFCONS dataset do not include shrimp trawls. This,
so for the demersal trawling effort by vessels landing in Bel-    however, is included in the other compiled datasets and rep-

Earth Syst. Sci. Data, 12, 373–386, 2020                                           www.earth-syst-sci-data.net/12/373/2020/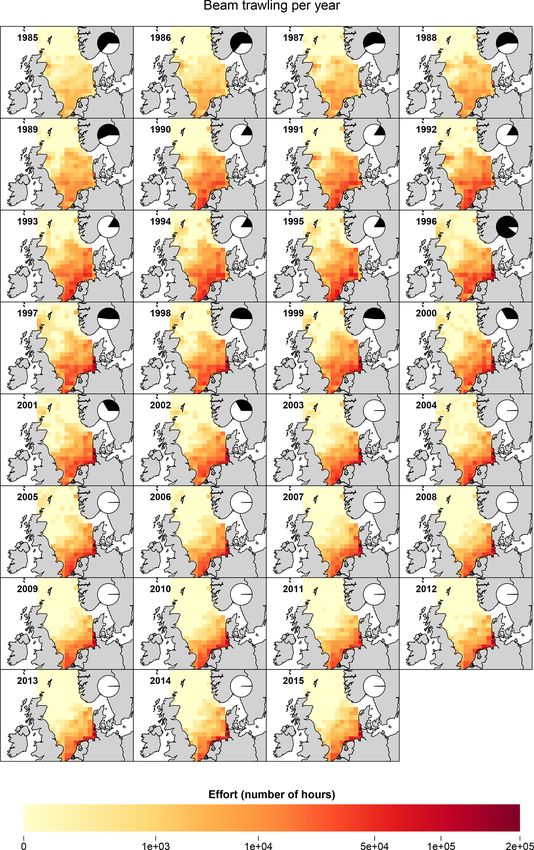
E. Couce et al.: Reconstructing three decades of total international trawling effort                                                 375

                                                                          Economic Committee for Fisheries (STECF) of the Euro-
                                                                          pean Commission. Member states are required to submit fish-
                                                                          ing effort data to STECF, in response to the Data Collection
                                                                          Framework (DCF) Fishing Effort Regimes Data Call in 2013
                                                                          (Martinsohn, 2014). STECF spatial effort data are available
                                                                          as annual fishing hours per ICES rectangle, for different
                                                                          gear types and vessel size classes. For the present study, an-
                                                                          nual data for Belgian, Danish, Dutch, English, French, Ger-
                                                                          man, Scottish, and Swedish vessels over 15 m were down-
                                                                          loaded on 23 February 2017 from https://stecf.jrc.ec.europa.
                                                                          eu/dd/effort/graphs-quarter. For two countries – Belgium and
                                                                          France – effort data were available from 2000 onwards, and
                                                                          for the other countries from 2002 onwards. The classification
                                                                          of gear types in STECF data follows definitions outlined in
                                                                          Annex I of Regulation 1342/2008 (Council of the European
                                                                          Union, 2008). For the present study, gears defined by STECF
                                                                          as “BEAM”, “BT1”, and “BT2” were included in our “Beam
                                                                          trawling” category, whereas “OTTER”, “TR1”, “TR2”, and
                                                                          “TR3” were included as “Otter trawling” (in line with Engel-
                                                                          hard et al., 2015; García-Carreras et al., 2015).
                                                                             Three additional effort datasets were also collated to com-
                                                                          plement our study (see Fig. 1a). For the period 1985–2012,
                                                                          data on otter trawling effort by vessels landing into Scotland
                                                                          were obtained from the Fisheries Management Database of
                                                                          Marine Scotland. For the full study period 1985–2015, data
                                                                          on beam and otter trawling effort by vessels landing into Eng-
                                                                          land and Wales were obtained from the Fisheries Activity
                                                                          Database of the Department for Environment, Food & Rural
Figure 1. (a) The timelines for seven sources of compiled (nomi-          Affairs (Defra, UK). For the period 1987–2015, data on beam
nal) fishing effort data, included in the present study; see methods      and otter trawling effort by vessels landing in Denmark (held
section for full details of each dataset. (b) Reconstructed total fish-   at the Ministry of Food, Agriculture and Fisheries, Denmark)
ing hours in the North Sea by beam (red) and otter trawlers (blue),       were kindly provided by Ole Ritzau Eigaard (personal com-
from 1985 to 2015. White-shaded areas show the proportions of the
                                                                          munication, 2017; National Institute of Aquatic Resources
reconstructed total based on compiled (nominal) fishing effort data,
                                                                          [DTU-Aqua], Denmark).
and dashed areas show the proportions based on estimated (mod-
elled) data. (c) The timelines, by country, for which nominal effort
data were available and compiled for this study. The periods shown        2.2   Estimating missing data
in grey indicate years for which country data were available but only
as part of a compiled set, and the individual country contribution to     In the years for which trawling effort data were lacking for
the total was unknown (this is data which therefore could not be          certain countries, estimates of trawling effort by rectangle
used to estimate missing periods). The periods shown in red indi-         were reconstructed, based on two assumptions: (1) that the
cate years for which only part of the data were available, or there       relative contributions of each country to the total trawling
was an issue with the compiled data.                                      effort change slowly and gradually and (2) that the spatial
                                                                          distribution of trawling over time changes slowly and grad-
                                                                          ually. Assumption (1) is tightly linked to the Common Fish-
resents a significant contribution to the total beam trawling             ery Policy’s rule of “relative stability,” whereby the quotas
pressure in the North Sea. Therefore, for consistency we did              of all commercial fish stocks in the North Sea are allocated
not use the MAFCONS beam trawling data for Germany and                    between countries according to a fixed allocation key, so that
instead estimated them for this period. Although the MAF-                 the distribution of fishing effort between countries will also
CONS dataset also included seining effort, only data on de-               be fairly constant; this is illustrated in Fig. 2 for a subset
mersal otter trawl and beam trawl effort were considered                  of all data included here (i.e. the STECF data). Assumption
for the present study (referred to as “MAFCONS dataset”                   (2) partly relates to fishing vessels being based at particu-
in Fig. 1a).                                                              lar ports, having traditional fishing grounds and fishing pref-
   From 2002 onwards, compilation of data on trawling effort              erences, and having quotas associated with particular areas;
by European Union countries in the North Sea and adjacent                 these constraints imply that spatial distribution of fishing ag-
waters has been carried out by the Scientific, Technical and              gregated at fleet level will only change gradually from year to

www.earth-syst-sci-data.net/12/373/2020/                                                    Earth Syst. Sci. Data, 12, 373–386, 2020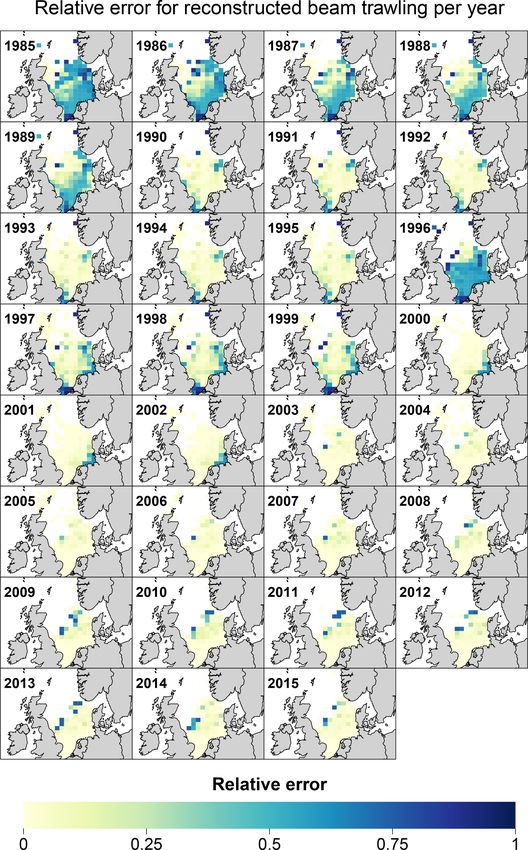
376                                            E. Couce et al.: Reconstructing three decades of total international trawling effort

                                                                                  age ratio between trawling by the target country and
                                                                                  the aggregated trawling by as many other countries
                                                                                  as possible with compiled data in the missing pe-
                                                                                  riod, and normalise so that this ratio is maintained.
                                                                               b. When the missing period is covered by an aggre-
                                                                                  gated dataset it is possible that no interval exists
                                                                                  with data for both the target and all the countries
                                                                                  in the aggregated dataset; in that case, use an inter-
                                                                                  val with data for the target country and the majority
                                                                                  of the other countries in the dataset, and estimate
                                                                                  the contribution of the countries lacking data in that
                                                                                  interval, following the procedure in step (2a).
                                                                         Table 1 summarises the missing periods that had to be esti-
                                                                         mated for all countries and details how the estimation was
                                                                         carried out in each case (i.e. the periods and source data used
                                                                         when following steps 1 and 2 listed above). One exception to
                                                                         this procedure was the reconstruction of otter trawling effort
                                                                         for Scotland for 2013–2015. These data are actually included
                                                                         in the STECF dataset, but there was a significant mismatch
                                                                         between our Scotland dataset and that in STECF. Therefore,
Figure 2. Percentage contribution of individual countries over time      for 2013–2015 we normalised Scotland otter trawling effort
to (a) total beam trawl effort and (b) total otter trawl effort in the   in STECF by a correction factor which was the average of the
North Sea, based on the STECF dataset.                                   annual total number of hours reported for Scotland in STECF
                                                                         versus our country dataset in 2003–2012.
                                                                            In order to quantify the errors of the estimation of trawling
year (for examples of gradual change only in spatial distribu-
                                                                         pressure data in cases of missing values, for each country
tion of fishing, see Engelhard, 2005; Greenstreet et al., 2007;
                                                                         we calculated trawling effort by rectangle, using the same
Jennings et al., 1999). We acknowledge that over longer time
                                                                         approach outlined above, but now for additional periods for
spans or under particular circumstances, major changes may
                                                                         which compiled data for that country were actually available.
occur. The outbreak of World War II in 1939, for example,
                                                                         In that way, the differences between our estimates and the
brought fishing in the North Sea to a near standstill (Engel-
                                                                         compiled data could be quantified. In each case, and when
hard, 2008). However, we are not aware of any such abrupt
                                                                         data allowed, the period that was estimated was chosen to be
change taking place over our study period. Thus, in cases
                                                                         close in time and similar in duration to the “real” missing
where a country was lacking effort data for a particular year,
                                                                         periods. Additionally, the estimation rules listed above were
effort was estimated based on the same country’s average
                                                                         adjusted so that, whenever possible, the procedure matched
spatial distribution of effort over a close time period with
                                                                         the one that had been followed for the estimation of the real
available data, normalised so that the relative contribution of
                                                                         missing periods. A median relative error between estimated
effort by the country compared to other countries was main-
                                                                         and compiled data among all ICES rectangles and over the
tained.
                                                                         entire period was then computed and applied to the estimated
   The precise procedure followed to estimate the trawling
                                                                         national trawling pressure data to produce a measurement of
effort for a period of n consecutive years (“the missing pe-
                                                                         total absolute error of our estimations. Details on the periods
riod”) for which a country (“the target country”) lacks data
                                                                         that were estimated for each country and the data used in the
was as follows.
                                                                         estimation together with the relevant median relative errors
  1. Estimate the spatial distribution of effort.                        are listed in Table 2.
       a. Average the spatial distribution of trawling effort
          for the target country in the 0.5n years before and            3   Results
          0.5n years after the missing period.
                                                                         We were able to estimate the total international beam trawl
       b. When 1.a is not possible, use n adjacent years (if             effort by rectangle in the North Sea for all years from 1985
          less than n years are available, use them all).                to 2015 (Fig. 3) and, likewise, the total international otter
  2. Scale the contribution.                                             trawling effort for the same period (Fig. 4). For the majority
                                                                         of years, but especially after 2000–2002, the reconstructed
       a. Using the longest time interval for which data are             trawling effort by rectangle could be directly sourced from
          available for the target country, compute the aver-            compiled data on nominal trawling effort (see white sections

Earth Syst. Sci. Data, 12, 373–386, 2020                                                  www.earth-syst-sci-data.net/12/373/2020/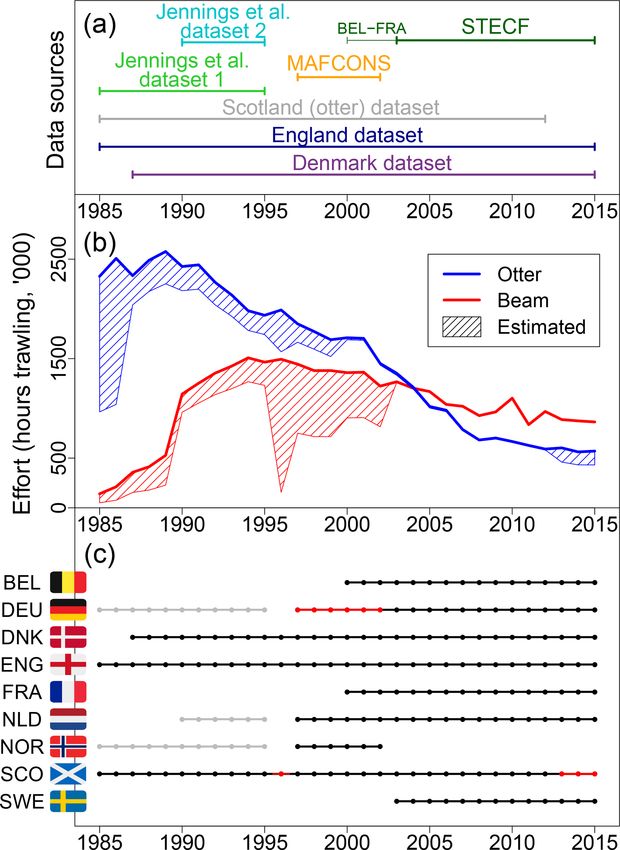
E. Couce et al.: Reconstructing three decades of total international trawling effort                                                         377

Table 1. Data used in the estimation of periods of missing data for each of the countries. An average spatial distribution of effort is calculated
from the data in the “Source data for spatial distribution” column, and scaled to maintain the ratio of trawling by the target country with
respect to the countries listed in the “Method for estimating total trawling” column.

 Country       Missing period    Gear              Source data for spatial          Method for estimating total trawling
                                                   distribution
 Germany       1996              Otter             1997 MAFCONS data                Comparing with DNK + ENG + SCO in 1997–2012.
 Germany       1996–2002         Beam              2003–2009 STECF data             – For 1996 comparing with DNK + ENG in 2003–2015.
                                                                                    – For 1997–1999 comparing with DNK + ENG + NLD + SCO
                                                                                    in 2003–2015.
                                                                                    – For 2000–2002 comparing with DNK + ENG + NLD + SCO
                                                                                    + BEL + FRA in 2003–2015.
 Belgium &     1985–1999         Beam, otter       2000–2014 STECF data             – For 1985–1986 comparing with ENG + SCO + DEU + NOR
 France                                                                             in 2000–2002.
                                                                                    – For 1987–1989 comparing with ENG + SCO + DEU + NOR
                                                                                    + DNK in 2000–2002.
                                                                                    – For 1990–1995 beam trawling comparing with ENG + SCO
                                                                                    + DEU + NOR + NLD + DNK, and for otter trawling compar-
                                                                                    ing with ENG + SCO + DEU + NOR + NLD, in 2000–2002.
                                                                                    – For 1996 beam trawling comparing with ENG + DNK in
                                                                                    2000–2015, and for otter trawling comparing with ENG + DNK
                                                                                    + SCO in 2000–2012.
                                                                                    – For 1997–1999 comparing with ENG + SCO + DNK + DEU
                                                                                    + NLD + NOR in 2000–2002.
 Denmark       1985–1986         Beam, otter       1987–1988 DNK data               Comparing with ENG + SCO + DEU + NOR in 1997–2002.
 Scotland      1996              Beam              1997 MAFCONS data                Comparing with ENG + DNK in 1997–2015.
 Scotland      2013–2015         Otter & 2013–     STECF SCO otter data scaled
                                 2015 STECF        by the average ratio between
                                 data              Scotland (otter) dataset and
                                                   STECF otter data in 2003–
                                                   2012.
 Norway        1996              Beam, otter       1997 MAFCONS data                For beam trawling comparing with ENG + DNK and for otter
                                                                                    trawling with ENG + DNK + SCO in 1997–2002.
 Norway        2003–2015         Beam, otter       1997–2002 MAFCONS data           For beam trawling comparing with ENG + DNK+ SCO +
                                                                                    NLD and for otter trawling with ENG + DNK + SCO + NLD
                                                                                    + DEU in 1997–2002.
 Sweden        1985–2002         Otter             2003–2015 STECF data             – For 1985–1986 comparing with ENG + SCO + DEU + NOR
                                                                                    in 2003–2012 (using estimated NOR data).
                                                                                    – For 1987–1989 comparing with ENG + SCO + DEU + NOR
                                                                                    + DNK in 2003–2012 (using estimated NOR data).
                                                                                    – For 1990–1995 comparing with ENG + SCO + DEU + NOR
                                                                                    + NLD in 2003–2012 (using estimated NOR data).
                                                                                    – For 1996 comparing with ENG + DNK + SCO in 2003–
                                                                                    2012.
                                                                                    – For 1997–1999 comparing with ENG + SCO + DNK + DEU
                                                                                    + NLD in 2003–2012.
                                                                                    – For 2000–2002 comparing with ENG + SCO + DNK + DEU
                                                                                    + NLD + BEL + FRA in 2003–2012.
 Netherlands   1985–1989         Beam, otter       1997–2001 MAFCONS data           – For 1985–1986 comparing with ENG + SCO + DEU + NOR
                                                                                    in 2003–2015 (for beam trawling, using reconstructed NOR
                                                                                    data) and in 1997–2002 (for otter trawling).
                                                                                    – For 1987–1989 comparing with ENG + SCO + DEU + NOR
                                                                                    + DNK in 2003–2015 (for beam trawling, using reconstructed
                                                                                    NOR data) and in 1997–2002 (for otter trawling).
 Netherlands   1996              Beam, otter       1997 MAFCONS data                For beam trawling comparing with ENG + DNK in 1997–2015,
                                                                                    and for otter trawling with ENG + DNK + SCO in 1997–2012.

www.earth-syst-sci-data.net/12/373/2020/                                                       Earth Syst. Sci. Data, 12, 373–386, 2020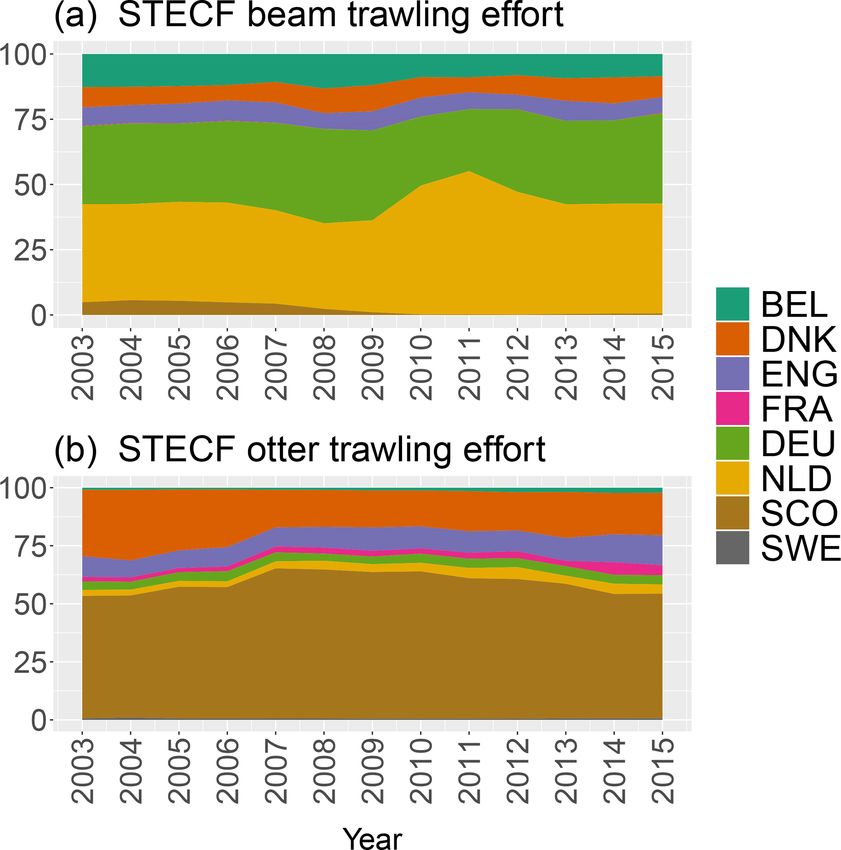
378                                            E. Couce et al.: Reconstructing three decades of total international trawling effort

Table 2. Periods for which trawling effort was estimated for the quantification of errors for each of the countries, and the data used for each
of the estimations. The last column shows the median error, where errors were calculated as of the absolute values of the relative differences
between estimated and compiled data for all ICES rectangles and all years.

  Country        Estimated       Gear                Source data for          Method for estimating total             Median error:
                                                                                                                      |estimated−compiled|
                 period                              spatial distribution     trawling                                      estimated
  Germany        1997            Otter               1998                     Comparing with DNK + ENG +              0.71
                                                     MAFCONS data             SCO in 2000–2012.
  Germany        2003–2008       Beam                2009–2014                Comparing with DNK + ENG +              0.62
                                                     STECF data               NLD + SCO in 2009–2015.
  Belgium &      2000–2007       Beam, otter         2008–2015                Comparing with DNK + ENG +              BEL beam: 0.89; BEL
  France                                             STECF data               NLD + BEL/FRA (BEL when es-             otter: 0.75; FRA beam:
                                                                              timating data for France, and vice      1.82; FRA otter: 0.70
                                                                              versa) in 2008–2015.
  Denmark        1987–1988       Beam, otter         1989–1990                Comparing with ENG + SCO +              Beam: 0.68; otter: 0.49
                                                     DNK data                 DEU + NOR in 1997–2002.
  Scotland       1997            Beam                1998                     Comparing with ENG + DNK in             1.05
                                                     MAFCONS data             1998–2015.
  Scotland       2013–2015       Otter               2013–2015                Error was estimated looking at          2.86
                                                     STECF data               the relative differences between
                                                                              STECF otter data for Scotland and
                                                                              the Scotland (otter) dataset in 2003–
                                                                              2012.
  Norway         1997–1999       Beam, otter         2000–2002                For beam trawling comparing with        Beam: 0.74; otter: 0.56
                                                     MAFCONS data             ENG + DNK+ SCO + NLD and
                                                                              for otter trawling with ENG +
                                                                              DNK + SCO + NLD + DEU in
                                                                              2000–2002.
  Sweden         2003–2008       Otter               2009–2015                Comparing with ENG + SCO +              0.67
                                                     STECF data               DNK + DEU + NLD + BEL +
                                                                              FRA in 2009–2015.
  Netherlands    1997–2002       Beam, otter         1997–2001                For beam trawling comparing with        Beam: 0.52; otter: 0.70
                                                     STECF data               ENG + DNK+ SCO in 2003–2015
                                                                              and for otter trawling with ENG +
                                                                              DNK + SCO + NLD + DEU in
                                                                              2003–2012.

of pie charts in Figs. 3 and 4) as opposed to estimated ef-                 for most years, the relative errors (Figs. 5 and 6) remain at
fort (black sections of pie charts). For some of the earlier                very low levels for the majority of the North Sea during the
years, there was less availability of compiled data, and hence              study period. Exceptions to this are the earliest period until
larger proportions of the reconstructed effort data had to be               1989 together with 1996 for beam trawling, and 1985–1986
estimated. For beam trawl effort, >50 % of reconstructed ef-                for otter trawling, where a significant part of the study region
fort data were estimated in case of the years 1985–1989 and                 reached relative error values around 0.5.
1996, and for 1997–2002 the proportion was also close to                       The spatial distribution of beam trawl effort in the North
50 %. For otter trawl effort, >50 % of reconstructed effort                 Sea (Fig. 3), based on our reconstructions, has generally
data were estimated in the case of the years 1985 and 1986                  remained fairly constant during 1985–2015, with a clear
only. The greater scarcity of beam trawl effort data in the                 northwest–southeast gradient. Absolute levels of beam trawl-
1980s was related to a lack of nominal effort data for the                  ing were highest in the 1990s; since 2000, total beam trawl
Netherlands, which is the country that generally predomi-                   effort has declined and gradually become more concentrated
nates beam trawling in the North Sea. Since the proportion                  in the shallower, eastern and southeastern parts of the North
of estimated data does not dominate the reconstructed total                 Sea. Whilst our results indicate that in the 1980s–1990s there

Earth Syst. Sci. Data, 12, 373–386, 2020                                                      www.earth-syst-sci-data.net/12/373/2020/
E. Couce et al.: Reconstructing three decades of total international trawling effort 379 Figure 3. Spatial distribution of beam trawling effort (number of hours trawling per ICES rectangle) in the North Sea in 1985–2015. Pie charts in the top right corners of each plot show the proportions of reconstructed trawling effort sourced from compiled (nominal) data (white) and estimated data (black). www.earth-syst-sci-data.net/12/373/2020/ Earth Syst. Sci. Data, 12, 373–386, 2020
380 E. Couce et al.: Reconstructing three decades of total international trawling effort
were appreciable levels of beam trawling off eastern and from negligence) are excluded to the fullest extent permitted
northeastern Scotland, beam trawling in these areas has very by law.
much declined since then. The use of data from the Cefas Data Hub requires that the
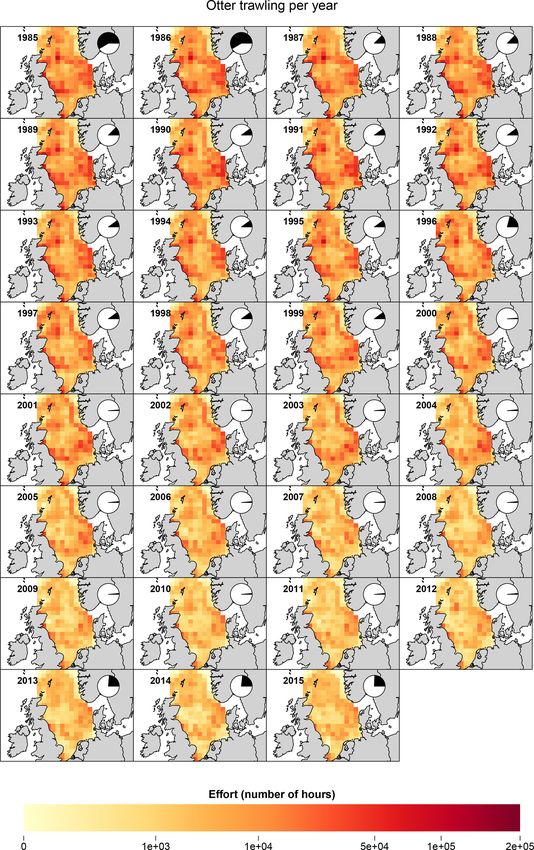
No clear spatial gradient was evident for the distribution correct and appropriate interpretation is solely the responsi-
of otter trawl effort in the North Sea, which over the years bility of the data users; that results, conclusions, and/or rec-
1985–2015 was generally spread more evenly throughout the ommendations derived from the data do not imply endorse-
region (Fig. 4). The overall levels of otter trawling have de- ment from Cefas; that data sources must be acknowledged,
clined, especially since 2000. Within the North Sea, some preferably using a formal citation; that data users must re-
localised areas stood out as undergoing greater otter trawl ef- spect all restrictions on the use of data such as for commer-
fort. These include areas off eastern Scotland (Moray Firth cial purposes; and that data may only be redistributed, i.e.
Ground, Wee Bankie), off northeast England (Farn Deeps, made available in other data collections or data portals, with
western Dogger Bank), west of Denmark (Little Fisher Bank, the prior written consent of Cefas.
Jutland Bank), and the southernmost rectangles within the
North Sea (between the Thames estuary and Belgium). In
many years, otter trawl effort was also high along the western 5 Discussion
slopes of the Norwegian Trench. The deeper parts of the Nor-
wegian Trench received low otter trawl effort (Fig. 4). The This study represents the first reconstruction of total inter-
shallower parts of the Southern Bight and German Bight, es- national trawling effort in the North Sea, spatially detailed
pecially in recent years, received very little otter trawl effort by ICES rectangle, over a multi-decadal time span. The re-
(but the highest levels of beam trawl effort; compare Figs. 3 constructions were, as much as possible, based on compiled
and 4). (nominal) effort data. Where such data were not available,
Although there have been changes in the total levels of efforts were made to fill in any gaps by modelling effort es-
otter trawling in the North Sea, there was evidence of fairly timations and so provide a holistic picture of the total trawl-
persistent spatial patterns; however, the relative contribution ing pressure in the North Sea over the past 31 years. Earlier
of trawling in the western North Sea off northeastern England studies that have attempted to compile international trawl-
and Scotland was higher in the 1980s–1990s than in more ing effort in the North Sea have covered considerably shorter
recent years (Fig. 4). time spans (e.g. Jennings et al., 1999: period 1990–1995;
Callaway et al., 2002: year 1998; Greenstreet et al., 2007:
period 1997–2004; STECF 2017: 2002–2015; Engelhard et
al., 2015: periods 1990–1995 and 2003–2012). Those stud-
4 Data availability ies moreover did not attempt to reconstruct data in cases
where country-specific effort data were lacking for certain
Reconstructed, nominal, estimated, and estimation error years (with the exception of Greenstreet et al., 2007).
trawling effort data are available from the Cefas Data Reconstruction of missing data may in some cases have
Hub (https://doi.org/10.14466/CefasDataHub.61, Couce et led to erroneous estimations. In all cases, for the spatial dis-
al., 2019). tribution of the effort we attempted to use the most relevant
The contents of the Cefas Data Hub website are provided country-specific data available, from a period close in time.
as part of the Cefas role as a Defra agency under the Defra Moreover, we have been transparent in keeping the com-
Open Data Strategy. piled (nominal) and modelled (estimated) data separate, and
Cefas requires users to make their own decisions regarding when displaying totals we have indicated the proportion of
the accuracy, reliability, and applicability of information pro- the data that was estimated (e.g. see black and white pie
vided. The data provided by the Cefas Data Hub are believed charts in Figs. 3 and 4). Likewise, Greenstreet et al. (2007),
by Cefas to be reliable for their original purposes and are ac- who attempted to reconstruct total international trawling in
companied by discovery metadata that provide a copy of the the North Sea for the 1997–2004 period, also had to model
information available to Cefas scientists, describing the orig- effort for some countries, which in their case was lacking for
inal purposes of data collection. It is the responsibility of the Belgium, Sweden, France, and Denmark. They used a differ-
data user to take this information into account when reusing ent approach to tackle this problem, based on a combination
data. Regardless of any quality control processes, Cefas does of landing, catch per unit of effort, and fleet size data. En-
not accept any liability for the use of the data provided; use couragingly, in spite of the different approaches, their recon-
is at the users’ own risk. Cefas does not give any warranty as structions of total international otter and beam trawl effort by
to the quality or accuracy of the information or the medium rectangle are in broad agreement with those presented here
on which it is provided or its suitability for any use. All im- (compare our Figs. 3 and 4 with pages 118–119 in Green-
plied conditions relating to the quality or suitability of the street et al., 2007).
information and the medium and all liabilities arising from We acknowledge discrepancies between our otter trawl ef-
the supply of the information (including any liability arising fort data for England and Scotland (based on the national
Earth Syst. Sci. Data, 12, 373–386, 2020 www.earth-syst-sci-data.net/12/373/2020/E. Couce et al.: Reconstructing three decades of total international trawling effort 381 Figure 4. Spatial distribution of otter trawling effort (number of hours trawling per ICES rectangle) in the North Sea in 1985–2015. Pie charts in the top right corners of each plot show the proportions of reconstructed trawling effort sourced from compiled (nominal) data (white) and estimated data (black). www.earth-syst-sci-data.net/12/373/2020/ Earth Syst. Sci. Data, 12, 373–386, 2020
382                                         E. Couce et al.: Reconstructing three decades of total international trawling effort

databases of England and Scotland) and the data collated by
STECF since 2002 for these two countries. Effort data dif-
fer by roughly a factor of 2 in each case (our otter trawling
effort data for Scotland are half that of STECF and twice
as much in the case of England). Although we cannot fully
explain this discrepancy, we believe it relates to the conver-
sion factor 24 assumed in the STECF compilation to convert
from days at sea to number of hours fishing; but a consider-
able portion of time that fishing vessels are away from port is
spent either steaming or handling the catch, with a variable
portion spent in the actual fishing operations (see discussion,
and supplementary materials in Engelhard et al., 2015). This
might, to some extent, have affected our estimations on spa-
tial distribution of trawling. Given that Scotland has exten-
sive otter trawl fisheries in particular in its close waters, our
maps might underestimate otter trawling effort in areas near
Scottish coastlines (see Greenstreet et al., 1999, for a review
and spatio-temporal patterns of Scottish trawl fisheries). No
significant discrepancy was found between the Danish na-
tional dataset and the STECF-collated data over the period
they overlap.
   When the present study’s effort distribution maps for spe-
cific years are compared with earlier studies, some differ-
ences may be noted. For example, for the period 1990–
1995 our trawling reconstructions, compared to Jennings et
al. (1999), indicate higher levels of otter trawl effort in the
area northwest of Denmark. This difference relates to the
inclusion of Danish otter trawling in our study, which was
likely omitted in Jennings et al. (1999), and suggests that the
benthic environment in this particular area was subjected to
greater anthropogenic pressure than previously assumed. For
the year 1998, however, a very close spatial match of our
trawling reconstruction was noted, compared with that col-
lated by Callaway et al. (2002) assessing links between trawl-
                                                                    Figure 5. Spatial distribution of relative error of the reconstructed
ing distribution and the diversity and community structure of       beam trawling effort (i.e. the ratio between the error of the estimated
epibenthic invertebrates and fish in the North Sea.                 effort and the total reconstructed effort) per ICES rectangle in the
   The broad-scale, long-term patterns in trawling effort dis-      North Sea in 1985–2015.
tribution presented here confirmed spatial patterns described
by shorter-term studies on trawling effort – such as the spa-
tial gradient in beam trawl effort (Fig. 3), closely match-         provide a powerful tool for monitoring, analysing, and de-
ing the depth gradient in the North Sea, and the associated         scribing fishing effort distribution, no such data are available
distributions of the key target species, sole Solea solea and       prior to the start of the 21st century. By contrast, the logbook-
plaice Pleuronectes platessa (e.g. Engelhard et al., 2011; van      based dataset presented here – albeit less spatially detailed
Keeken et al., 2007; Rijnsdorp et al., 1998). It is worth not-      than VMS data – does go back to the 1980s, allowing sys-
ing that, if analysed at a much finer spatial scale than ICES       tematic, long-term comparisons of trawling impacts on fish,
rectangles, the spatial distribution of beam trawling is much       benthic invertebrates, and other organisms living on or near
more patchy and localised, again reflecting local distributions     the seabed of the North Sea (Collie et al., 2017; Hiddink et
of flatfish and competitive interactions between fishing ves-       al., 2006).
sels (Rijnsdorp et al., 1998, 2000). Likewise, the distribution        The long-term reduction in both beam and otter trawling
of otter trawling across the North Sea, when analysed at the        fishing hours in the North Sea, which is evident from our
scale of ICES rectangles (Fig. 4), appears smooth and broad.        reconstructed time series, is closely associated with the Eu-
It is found to be much more patchy when analysed at finer           ropean Union fleet reduction scheme, adopted since the turn
spatial scales, as has been made possible by the introduction       of the millennium (Villasante, 2010). This scheme, in which
of a VMS (vessel monitoring system) on EU fishing vessels           decommissioning of fishing vessels was paramount, was in-
in the early 2000s (e.g. Lee et al., 2010). While VMS data          stigated specifically to address overcapacity in the European

Earth Syst. Sci. Data, 12, 373–386, 2020                                               www.earth-syst-sci-data.net/12/373/2020/
E. Couce et al.: Reconstructing three decades of total international trawling effort 383
duction of hours of otter trawl fishing since the 1990s would
be partially – or even fully – offset in many cases by increases
in vessel size, engine power, gear size, and other technolog-
ical developments that have taken place over these decades
(e.g. see Eigaard et al., 2014). Consequently, fishing pres-
sure and impacts on target stocks, seabed habitats, or by-
catch species are unlikely to have declined to the same extent
that fishing hours have been reduced. Kilowatt-hours of fish-
ing may be a more useful metric to study trawling impact.
However, the relevant data are not available for all countries
over the time period of the study. Attempts have been made
to model the impact of these technological developments on
fisheries (e.g. see Eigaard et al., 2011) and could be consid-
ered for some applications of the trawling hours dataset pro-
duced in the present study.
We have previously argued that a lack of multidecadal,
spatially detailed data on trawling effort has hampered at-
tempts to study the long-term environmental footprint of
trawling. The present dataset – mostly based on compiled
(nominal) effort data, and for a smaller part on estimated
(modelled) data – may help overcome this. For the North
Sea, long-term datasets on a range of biotic and abiotic
variables already exist. These include time series of sea
surface and sea bottom temperature (e.g. MacKenzie and
Schiedek, 2007; Morris et al., 2018), on phytoplankton abun-
dance and primary production (Capuzzo et al., 2018; Reid
et al., 2003); on water turbidity (Capuzzo et al., 2015), and
on hydrodynamics (van Leeuwen et al., 2015). Long-term
data on the North Sea fish fauna, collected through Inter-
national Bottom Trawl Surveys (IBTS) and Beam Trawl
Surveys (BTS), are held in the “DATRAS” database of
ICES (e.g. ter Hofstede and Daan, 2008; http://www.ices.
dk/marine-data/data-portals/Pages/DATRAS.aspx, last ac-
cess: February 2020), and ICES also holds data on
Figure 6. Spatial distribution of relative error of the reconstructed
otter trawling effort (i.e. the ratio between the error of the estimated international fishery landings dating back to the year
effort and the total reconstructed effort) per ICES rectangle in the 1903 (https://www.ices.dk/marine-data/dataset-collections/
North Sea in 1985–2015. Pages/Fish-catch-and-stock-assessment.aspx, last access:
February 2020). The Continuous Plankton Recorder (CPR)
data provide an excellent source on zooplankton, phy-
fishing fleet and significant concerns of overfishing of key toplankton, and ichthyoplankton (Lynam et al., 2013;
commercial fish stocks including sole, plaice, cod, and sand McQuatters-Gollop et al., 2017). These sources are now
eel (Bannister, 2004; Villasante, 2010). Since then, with the complemented by our long-term trawling effort dataset.
reduction in total trawling effort, strict quota regulations, Two papers, based on the present data in combination
and the introduction of long-term management plans, sev- with ecological data, have already been submitted – one on
eral North Sea fish stocks have indeed recovered, most no- “threshold” impacts of trawling pressure on North Sea ben-
tably North Sea plaice (ICES, 2017). There is also evidence thos (Couce et al., 2020) and one on feeding guilds within
of recovery in the large fish indicator (LFI), an OSPAR in- the fish community of the North Sea, in relation to fishing
dicator of good environmental status in marine food webs, pressure, climate change, and other drivers (Thompson et al.,
in response to reduced trawling pressure (Engelhard et al., 2020). We encourage the use of the spatio-temporal dataset
2015). on trawling effort provided here to all those working in the
With these positive signs, it is worth noting that trawling fields of marine science, management, and policy, who have
remains one of the most pervasive anthropogenic pressures in ecosystem conservation and sustainability of marine living
the North Sea (Kenny et al., 2018), and it will continue to be resources at heart, both of which are aided by a better under-
important to monitor and assess its impacts on marine fauna standing of the long-term impact from this major, widespread
and habitats. Moreover, it is very likely that the observed re- anthropogenic pressure.
www.earth-syst-sci-data.net/12/373/2020/ Earth Syst. Sci. Data, 12, 373–386, 2020384 E. Couce et al.: Reconstructing three decades of total international trawling effort
Author contributions. EC conceived the research idea, EC and zooplankton abundance and fish stock recruitment, Glob. Chang.
GHE compiled the effort data and designed the methodology to re- Biol., 24, e352–e364, https://doi.org/10.1111/gcb.13916, 2018.
construct missing data, and EC carried out the reconstruction. All Collie, J., Hiddink, J. G., van Kooten, T., Rijnsdorp, A. D., Kaiser,
authors participated in the interpretation of results and the writing M. J., Jennings, S., and Hilborn, R.: Indirect effects of bottom
of the manuscript and gave final approval for publication. fishing on the productivity of marine fish, Fish Fish., 18, 619–
637, https://doi.org/10.1111/faf.12193, 2017.
Couce, E., Schratzberger, M., and Engelhard, G. H.: Re-
Competing interests. The authors declare that they have no con- construction of North Sea trawling effort, 1985–2015,
flict of interest. https://doi.org/10.14466/CefasDataHub.61, Cefas, UK, 2019.
Couce, E., Engelhard, G. H., and Schratzberger, M.: Capturing
threshold responses of marine benthos along gradients of natu-
Acknowledgements. We are grateful to Ole Ritzau Eigaard (Na- ral and anthropogenic change, J. Appl. Ecol., in press, 2020.
tional Institute of Aquatic Resources [DTU-Aqua], Denmark), Si- Council of the European Union: Council Regulation (EC) No
mon Jennings (International Council for the Exploration of the 1342/2008 of 18 December 2008 establishing a long-term plan
Sea), and Leonie Robinson (University of Liverpool) for provid- for cod stocks and the fisheries exploiting those stocks and re-
ing datasets on North Sea trawling effort that have contributed to pealing Regulation (EC) No 423/2004, Off. J. Eur. Union, L348,
the reconstructed dataset. Ole Ritzau Eigaard additionally provided 20–33, 2008.
useful feedback regarding the effects of technological developments Eigaard, O. R., Rihan, D., Graham, N., Sala, A., and Zachariassen,
on trawling’s ecological impacts. For the period post-2000, we also K.: Improving fishing effort descriptors?: Modelling engine
acknowledge our international STECF colleagues for compiling and power and gear-size relations of five European trawl fleets, Fish.
quality-assuring European fishing effort data. The authors also wish Res., 110, 39–46, https://doi.org/10.1016/j.fishres.2011.03.010,
to thank Oliver Williams and Suzy Angelus for their help in prepar- 2011.
ing and publishing the reconstructed trawling effort data. The study Eigaard, O. R., Marchal, P., Gislason, H., and Rijnsdorp, A.
benefited from feedback from Christopher Lynam, Angela Muench, D.: Technological Development and Fisheries Management, 22,
and two anonymous reviewers. 156–174, https://doi.org/10.1080/23308249.2014.899557, 2014.
Emeis, K. C., van Beusekom, J., Callies, U., Ebinghaus, R.,
Kannen, A., Kraus, G., Kröncke, I., Lenhart, H., Lorkowski,
I., Matthias, V., Möllmann, C., Pätsch, J., Scharfe, M.,
Financial support. This research has been supported by the De-
Thomas, H., Weisse, R., and Zorita, E.: The North Sea –
partment for Environment, Food and Rural Affairs of the UK (De-
A shelf sea in the Anthropocene, J. Mar. Syst., 141, 18–33,
fra) via project SLA44 (Marine Biodiversity Advice) and jointly
https://doi.org/10.1016/j.jmarsys.2014.03.012, 2015.
by Defra and by the Natural Environment Research Council
Engelhard, G. H.: Catalogue of Defra historical catch and effort
(NERC) via grant NE/L003279/1 (Marine Ecosystems Research
charts: six decades of detailed spatial statistics for British fish-
Programme).
eries, Sci. Ser. Tech. Rep., 128, 1–42, 2005.
Engelhard, G. H.: One hundred and twenty years of change in fish-
ing power of English North Sea trawlers, in: Advances in Fish-
Review statement. This paper was edited by Giuseppe eries Science: 50 Years on from Beverton and Holt, edited by:
M. R. Manzella and reviewed by two anonymous referees. Payne, A., Cotter, J., and Potter, T., 1–25, Blackwell Publishing,
2008.
Engelhard, G. H., Pinnegar, J. K., Kell, L. T., and Ri-
jnsdorp, A. D.: Nine decades of North Sea sole and
References plaice distribution, ICES J. Mar. Sci., 68, 1090–1104,
https://doi.org/10.1093/icesjms/fsr031, 2011.
Bannister, R. C. A.: The Rise and Fall of Cod (Gadus morhua L.) Engelhard, G. H., Righton, D. A., and Pinnegar, J. K.: Cli-
in the North Sea, in: Management of Shared Fish Stocks, edited mate change and fishing: A century of shifting distribu-
by: Payne, A. I. L., O’Brien, C. M., and Rogers, S. I., 316–338, tion in North Sea cod, Glob. Chang. Biol., 20, 2473–2483,
Blackwell Publishing Ltd, Oxford, UK., 2004. https://doi.org/10.1111/gcb.12513, 2014.
Callaway, R., Alsvåg, J., De Boois, I., Cotter, J., Ford, A., Hinz, Engelhard, G. H., Lynam, C. P., García-Carreras, B., Dolder, P.
H., Jennings, S., Kröncke, I., Lancaster, J., Piet, G., Prince, P., J., and Mackinson, S.: Effort reduction and the large fish in-
and Ehrich, S.: Diversity and community structure of epibenthic dicator: spatial trends reveal positive impacts of recent Euro-
invertebrates and fish in the North Sea, ICES J. Mar. Sci., 59, pean fleet reduction schemes, Environ. Conserv., 42, 227–236,
1199–1214, https://doi.org/10.1006/jmsc.2002.1288, 2002. https://doi.org/10.1017/S0376892915000077, 2015.
Capuzzo, E., Stephens, D., Silva, T., Barry, J., and Forster, R. M.: García-Carreras, B., Dolder, P., Engelhard, G. H., Lynam,
Decrease in water clarity of the southern and central North Sea C. P., Bayliss-Brown, G. A., and Mackinson, S.: Re-
during the 20th century, Glob. Chang. Biol., 21, 2206–2214, cent experience with effort management in Europe: Im-
https://doi.org/10.1111/gcb.12854, 2015. plications for mixed fisheries, Fish. Res., 169, 52–59,
Capuzzo, E., Lynam, C. P., Barry, J., Stephens, D., Forster, R. M., https://doi.org/10.1016/j.fishres.2015.04.010, 2015.
Greenwood, N., McQuatters-Gollop, A., Silva, T., van Leeuwen, Greenstreet, S., Robinson, L., Piet, G. J., Craeymeersch, J., Call-
S. M., and Engelhard, G. H.: A decline in primary production away, R., Reiss, H., and Ehrich, S.: The ecological disturbance
in the North Sea over 25 years, associated with reductions in
Earth Syst. Sci. Data, 12, 373–386, 2020 www.earth-syst-sci-data.net/12/373/2020/E. Couce et al.: Reconstructing three decades of total international trawling effort 385 caused by fishing in the North Sea, FRS Collab. Report, 04/07, estimates of fishing-effort distributions from vessel monitor- 169, 2007. ing system (VMS) data, ICES J. Mar. Sci., 67, 1260–1271, Greenstreet, S. P. R., Spence, F. E., and McMillan, J. A.: Fishing https://doi.org/10.1093/icesjms/fsq010, 2010. effects in northeast Atlantic shelf seas: Patterns in fishing effort, Lynam, C. P., Halliday, N. C., Höffle, H., Wright, P. J., van diversity and community structure. V. Changes in structure of Damme, C. J. G., Edwards, M., and Pitois, S. G.: Spa- the North Sea groundfish species assemblage between 1925 and tial patterns and trends in abundance of larval sandeels in 1996, Fish. Res., 40, 153–183, https://doi.org/10.1016/S0165- the North Sea: 1950–2005, ICES J. Mar. Sci., 70, 540–553, 7836(98)00210-0, 1999. https://doi.org/10.1093/icesjms/fst006, 2013. Greenstreet, S. P. R., Holland, G. J., Fraser, T. W. K., and Allen, V. MacKenzie, B. R. and Schiedek, D.: Long-term sea surface tem- J.: Modelling demersal fishing effort based on landings and days perature baselines-time series, spatial covariation and impli- absence from port, to generate indicators of “activity”, ICES J. cations for biological processes, J. Mar. Syst., 68, 405–420, Mar. Sci., 66, 886–901, https://doi.org/10.1093/icesjms/fsp068, https://doi.org/10.1016/j.jmarsys.2007.01.003, 2007. 2009. Martinsohn, J.: DCF Fishing Effort Regimes Data Call 2013: Cov- Hiddink, J. G., Jennings, S., Kaiser, M. J., Queirós, A. M., Du- erage Report, Publications Office of the European Union, Lux- plisea, D. E., and Piet, G. J.: Cumulative impacts of seabed trawl embourg, https://doi.org/10.2788/68470, 2014. disturbance on benthic biomass, production, and species rich- McQuatters-Gollop, A., Johns, D. G., Bresnan, E., Skinner, J., ness in different habitats, Can. J. Fish. Aquat. Sci., 63, 721–736, Rombouts, I., Stern, R., Aubert, A., Johansen, M., Bed- https://doi.org/10.1139/f05-266, 2006. ford, J., and Knights, A.: From microscope to manage- Hiddink, J. G., Jennings, S., Sciberras, M., Szostek, C. L., Hughes, ment: The critical value of plankton taxonomy to marine K. M., Ellis, N., Rijnsdorp, A. D., McConnaughey, R. A., Ma- policy and biodiversity conservation, Mar. Policy, 83, 1–10, zor, T., Hilborn, R., Collie, J. S., Pitcher, C. R., Amoroso, https://doi.org/10.1016/j.marpol.2017.05.022, 2017. R. O., Parma, A. M., Suuronen, P., and Kaiser, M. J.: Global Morris, D. J., Pinnegar, J. K., Maxwell, D. L., Dye, S. R., Fer- analysis of depletion and recovery of seabed biota after bot- nand, L. J., Flatman, S., Williams, O. J., and Rogers, S. I.: Over tom trawling disturbance, P. Natl. Acad. Sci., 114, 8301–8306, 10 million seawater temperature records for the United King- https://doi.org/10.1073/pnas.1618858114, 2017. dom Continental Shelf between 1880 and 2014 from 17 Cefas ICES: Report of the Working Group on Assessment of De- (United Kingdom government) marine data systems, Earth Syst. mersal Stocks in the North Sea and Skagerrak, ICES CM Sci. Data, 10, 27–51, https://doi.org/10.5194/essd-10-27-2018, 2017/ACOM:21, Copenhagen, Denmark, available at: http:// 2018. www.ices.dk/sites/pub/PublicationReports/ExpertGroupReport/ Reid, P. C., Edwards, M., Beaugrand, G., Skogen, M., and Stevens, acom/2017/WGNSSK/01WGNSSKReport2017.pdf (last access: D.: Periodic changes in the zooplankton of the North Sea during February 2019), 2017. the twentieth century linked to oceanic inflow, Fish. Oceanogr., Jennings, S., Alvsvåg, J., Cotter, A. J. R., Ehrich, S., Greenstreet, 12, 260–269, https://doi.org/10.1046/j.1365-2419.2003.00252.x, S. P. R., Jarre-Teichmann, A., Mergardt, N., Rijnsdorp, A. D., 2003. and Smedstad, O.: Fishing effects in northeast Atlantic shelf Rijnsdorp, A. D. and Millner, R. S.: Trends in population dynamics seas: patterns in fishing effort, diversity and community struc- and explotaition of North Sea plaice (Pleuronectes platessa L.) ture. III. International trawling effort in the North Sea: An anal- since the late 1800s, ICES J. Mar. Sci., 53, 1170–1184, 1996. ysis of spatial and temporal trends, Fish. Res., 40, 125–134, Rijnsdorp, A. D., Buys, A. M., Storbeck, F., and Visser, https://doi.org/10.1016/S0165-7836(98)00208-2, 1999. E. G.: Micro-scale distribution of beam trawl effort in Jennings, S., Kaiser, M. J., and Reynolds, J. D.: Marine Fisheries the southern North Sea between 1993 and 1996 in rela- Ecology, Blackwell Science Ltd, Oxford, 2001. tion to the trawling frequency of the sea bed and the im- Jennings, S., Stentiford, G. D., Leocadio, A. M., Jeffery, K. R., pact on benthic organisms, ICES J. Mar. Sci., 55, 403–419, Metcalfe, J. D., Katsiadaki, I., Mangi, S. C., Auchterlonie, N. https://doi.org/10.1006/jmsc.1997.0326, 1998. A., Pinnegar, J. K., Ellis, T., Peeler, E. J., Luisetti, T., Baker- Rijnsdorp, A. D., Dol, W., Hoyer, M., and Pastoors, M. A.: Austin, C., Brown, M., Catchpole, T. L., Clyne, F. J., Dye, S. Effects of fishing power and competitive interactions among R., Edmonds, N. J., Hyder, K., Lee, J., Lees, D. N., Morgan, vessels on the effort allocation on the trip level of the O. C., O’Brien, C. M., Oidtmann, B., Posen, P. E., Ribeiro San- Dutch beam trawl fleet, ICES J. Mar. Sci., 57, 927–937, tos, A., Taylor, N. G. H., Turner, A. D., Townhill, B. L., and https://doi.org/10.1006/jmsc.2000.0580, 2000. Verner-Jeffreys, D. W.: Aquatic food security: insights into chal- Schratzberger, M., Dinmore, T. A., and Jennings, S.: Im- lenges and solutions from an analysis of interactions between pacts of trawling on the diversity, biomass and struc- fisheries, aquaculture, food safety, human health, fish and hu- ture of meiofauna assemblages, Mar. Biol., 140, 83–93, man welfare, economy and environment, Fish Fish., 17, 893– https://doi.org/10.1007/s002270100688, 2002. 938, https://doi.org/10.1111/faf.12152, 2016. Sguotti, C., Lynam, C. P., García-Carreras, B., Ellis, J. R., and En- Kenny, A. J., Jenkins, C., Wood, D., Bolam, S. G., Mitchell, P., gelhard, G. H.: Distribution of skates and sharks in the North Scougal, C., and Judd, A.: Assessing cumulative human activi- Sea: 112 years of change, Glob. Chang. Biol., 22, 2729–2743, ties, pressures, and impacts on North Sea benthic habitats using https://doi.org/10.1111/gcb.13316, 2016. a biological traits approach, ICES J. Mar. Sci., 75, 1080–1092, STECF: Fisheries Dependent Information (STECF-17-09), https://doi.org/10.1093/icesjms/fsx205, 2018. Publications Office of the European Union, Luxembourg, Lee, J., South, A. B., and Jennings, S.: Developing reliable, re- https://doi.org/10.2760/561459, 2017. peatable, and accessible methods to provide high-resolution www.earth-syst-sci-data.net/12/373/2020/ Earth Syst. Sci. Data, 12, 373–386, 2020
386                                           E. Couce et al.: Reconstructing three decades of total international trawling effort

ter Hofstede, R. and Daan, N.: A proposal for a consistent use         van Leeuwen, S., Tett, P., Mills, D., and van der Molen, J.: Stratified
   of the North Sea IBTS data, ICES CM 2008/R:25, ICES,                   and nonstratified areas in the North Sea: Long-term variability
   Copenhagen, Denmark, available at: http://www.ices.dk/sites/           and biological and policy implications, J. Geophys. Res.-Ocean.,
   pub/CMDoccuments/CM-2008/R/R2508.pdf (last access: May                 120, 4670–4686, https://doi.org/10.1002/2014JC010485, 2015.
   2019), 2008.                                                        Villasante, S.: Global assessment of the European Union
Thompson, M. S., Pontalier, H., Spence, M. A., Pinnegar, J. K.,           fishing fleet: An update, Mar. Policy, 34, 663–670,
   Greenstreet, S., Moriarty, M., Hélaouët, P., and Lynam, C. P.: A       https://doi.org/10.1016/j.marpol.2009.12.007, 2010.
   feeding guild indicator to assess environmental change impacts      Watson, R. A., Green, B. S., Tracey, S. R., Farmery, A., and Pitcher,
   on marine ecosystem structure and functioning, J. Appl. Ecol., in      T. J.: Provenance of global seafood, Fish Fish., 17, 585–595,
   review, 2020.                                                          https://doi.org/10.1111/faf.12129, 2016.
van Keeken, O. A., van Hoppe, M., Grift, R. E., and Ri-
   jnsdorp, A. D.: Changes in the spatial distribution of
   North Sea plaice (Pleuronectes platessa) and implica-
   tions for fisheries management, J. Sea Res., 57, 187–197,
   https://doi.org/10.1016/j.seares.2006.09.002, 2007.

Earth Syst. Sci. Data, 12, 373–386, 2020                                                  www.earth-syst-sci-data.net/12/373/2020/
You can also read