The influence of surficial features in lava flow modelling - Journal of Applied Volcanology
←
→
Page content transcription
If your browser does not render page correctly, please read the page content below
Tsang et al. Journal of Applied Volcanology           (2020) 9:6
https://doi.org/10.1186/s13617-020-00095-z

 RESEARCH                                                                                                                                          Open Access

The influence of surficial features in lava
flow modelling
Sophia W. R. Tsang1* , Jan M. Lindsay1, Giovanni Coco1 and Natalia I. Deligne2

  Abstract
  Lava flows can cause substantial and immediate damage to the built environment and affect the economy and
  society over days through to decades. Lava flow modelling can be undertaken to help stakeholders prepare for and
  respond to lava flow crises. Traditionally, lava flow modelling is conducted on a digital elevation model, but this
  type of representation of the surface may not be appropriate for all settings. Indeed, we suggest that in urban areas
  a digital surface model may more accurately capture all of the obstacles a lava flow would encounter. We use three
  effusive eruption scenarios in the well-studied Auckland Volcanic Field (New Zealand) to demonstrate the difference
  between modelling on an elevation model versus on a surface model. The influence of surficial features on lava
  flow modelling results is quantified using a modified Jaccard coefficient. For the scenario in the most urbanised
  environment, the Jaccard coefficient is 40%, indicating less than half of the footprints overlap, while for the scenario
  in the least urbanised environment, the Jaccard coefficient is 90%, indicating substantial overlap. We find that
  manmade surficial features can influence the hazard posed by lava flows and that a digital surface model may be
  more applicable in highly modified environments.
  Keywords: DEM, DSM, Auckland volcanic field, Lava flow hazard modelling, Birkenhead, Mt. Eden, Ōtāhuhu

Introduction                                                                          southern flank (Villa 2002; Bonaccorsco et al. 2016;
Recent effusive volcanic eruptions such as the 2018                                   Rongo et al. 2016). In yet another example, over the
Kīlauea eruption in Hawaii, USA, have reminded the                                    course of 3 months in 2018, the development of the
global community how disruptive lava flows can be.                                    lava flow field on Kīlauea’s Lower East Rift Zone (Ha-
Although few deaths are attributed to lava flows                                      waii, USA) destroyed over 700 houses (Neal et al.
(Harris 2015; Brown et al. 2017), they can have se-                                   2019) and the local government has reported small
vere, immediate impacts to the built environment and                                  business closures over a year later (County of Hawai‘i
prolonged economic and societal consequences. For                                     2019). These consequences have been recognised for
example, the 1973 Vestmannaeyjar Volcanic Field                                       decades. In fact, Thomas Jaggar devised ways to pro-
eruption on the Icelandic island of Heimaey threat-                                   tect Hilo Harbour (Hawaii, USA) in future eruptions
ened the local fishing harbour (e.g. Williams and                                     in the 1940s (Jaggar 1945). Such planning continues
Moore 1983; McPhee 1989) and had lasting financial                                    to this day (CDEM 2015). As with all hazards, pre-
impacts on the Icelandic economy (Morgan 2000).                                       crisis planning can minimise the psychological and
More recently, lava flows during the 2002–2003                                        physical impacts and recovery costs for communities
eruption of Mt. Etna (Sicily, Italy) partially inundated                              affected by lava flows (UNDDR 2019). Preparation
tourist facilities and road networks on the volcano’s                                 and mitigation actions can take many forms, such as
                                                                                      the development of plans and policies (e.g. the cre-
* Correspondence: s.tsang@auckland.ac.nz                                              ation of the Auckland Volcanic Field contingency and
1
 School of Environment, University of Auckland, Auckland, New Zealand                 evacuation plans (CDEM 2015; Wild et al. 2019)),
Full list of author information is available at the end of the article

                                       © The Author(s). 2020 Open Access This article is licensed under a Creative Commons Attribution 4.0 International License,
                                       which permits use, sharing, adaptation, distribution and reproduction in any medium or format, as long as you give
                                       appropriate credit to the original author(s) and the source, provide a link to the Creative Commons licence, and indicate if
                                       changes were made. The images or other third party material in this article are included in the article's Creative Commons
                                       licence, unless indicated otherwise in a credit line to the material. If material is not included in the article's Creative Commons
                                       licence and your intended use is not permitted by statutory regulation or exceeds the permitted use, you will need to obtain
                                       permission directly from the copyright holder. To view a copy of this licence, visit http://creativecommons.org/licenses/by/4.0/.
                                       The Creative Commons Public Domain Dedication waiver (http://creativecommons.org/publicdomain/zero/1.0/) applies to the
                                       data made available in this article, unless otherwise stated in a credit line to the data.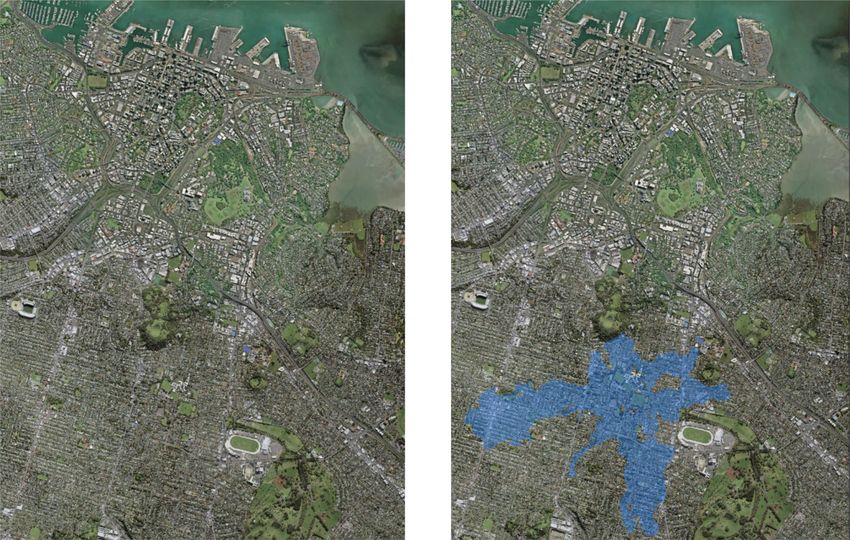
Tsang et al. Journal of Applied Volcanology   (2020) 9:6                                                         Page 2 of 12

lava flow modelling (e.g. the DOWNFLOW modelling                 (e.g. Wagner et al. 2006), with each return providing dif-
undertaken by Favalli et al. (2006, 2009a) and Chirico           ferent information about the ground below. The returns
et al. (2009) in Goma, Democratic Republic of                    are numbered based on the order in which they are
Congo), volunteer and professional trainings (e.g. the           sensed (e.g. Heidemann 2018). The number of returns
electricity utility on Hawai’i Island creating trainings         measured depends on the system being used, but the
about how to strengthen their networks to withstand              early returns detail surficial features while later returns
the high temperatures of lava flows (Tsang et al.                describe lower features (e.g. the bare ground; Axelsson
2019)), and exercises (e.g. Exercise Ruamoko, a New              1999). The first return is commonly used to create a
Zealand all-of-nation desktop exercise focused on un-            digital surface model (DSM), which includes the bare
rest in the Auckland Volcanic Field (Brunsdon and                ground and surficial features including trees, buildings,
Park 2009; Lindsay et al. 2010)). All these activities           etc. (e.g. Wagner et al. 2006; Heidemann 2018). One of
rely on understanding the potential hazard(s), in this           the later returns is used to create a DEM. In-between
case when and where lava flows can occur.                        returns can be used to create hybrid surface models (e.g.
  Assessing the potential lava flow hazard to a com-             a DSM that does not include trees) through the process
munity can be difficult for a variety of reasons. Many           of classification or filtration (e.g. Axelsson 1999; Wagner
volcanoes have not been studied in detail, and even              et al. 2006). A second modern method to create a DEM
well-studied volcanoes commonly lack extensive re-               is using Structure-from-Motion photogrammetry (e.g.
search on specific characteristics of previous individ-          Westoby et al. 2012; Ouedraogo et al. 2014). In this
ual eruptions; metrics such as recurrence interval or            method, a set of overlapping but offset photographs is
average lava flow episode volume are often unknown               taken (e.g. Westoby et al. 2012; Dietrich 2015). Algo-
(e.g. Mt. Cameroon, Cameroon; Bonne et al. 2008;                 rithms can then identify features from multiple images
Favalli et al. 2012). Additionally, predicting the loca-         at different angles to create a three-dimensional surface.
tion of the next volcanic vent is critical to predicting         Sufficient images are taken to blanket an area with im-
lava flow inundation areas (Connor et al. 2012; Bilotta          ages, enabling a DEM (or DSM) to be created (e.g. Wes-
et al. 2019); this can be especially challenging in vol-         toby et al. 2012; Ouedraogo et al. 2014; Dietrich 2015).
canic fields where the area under consideration for                 Here, we present lava flow hazard modelling for three
vent opening may be particularly large with few                  effusive eruption scenarios in the Auckland Volcanic
spatio-temporal trends (e.g. Allen and Smith 1994;               Field (AVF), which underlies the city of Auckland, New
Gallant et al. 2018).                                            Zealand, to highlight the effects of using different eleva-
  In some volcanic regions the natural topography has            tion models, namely DEMs and DSMs. In Section 2, we
been anthropologically altered during urbanisation (e.g.         provide an overview of the AVF and the scenarios used,
Al-Madinah, Saudi Arabia (Runge 2015), Auckland, New             which were created in the context of the Determining
Zealand (von Hochstetter 1859; Searle 1964)). In these           Volcanic Risk in Auckland (DEVORA) research
cases, the increasing number of obstacles (i.e. elements         programme. In Section 3, we describe our methods, in-
in the built environment) a lava flow may encounter              cluding how we selected the MOLASSES lava flow
may be increased; in other words, lava flows will not            model and how we compared our modelling results. In
simply follow the natural topography (Tsang et al. 2019).        Section 4, we present the MOLASSES results from mod-
Despite substantial anthropogenic alteration to some             elling the DEVORA Scenarios on both a DEM and a
natural topographies, lava flow modelling is still nor-          DSM. Finally, in Section 5, we detail some of the impli-
mally conducted on digital elevation models (DEMs)               cations of modelling lava flows on a DEM versus a DSM
that do not consider such alterations (e.g. Kereszturi           and compare our modelling results to the lava flow haz-
et al. 2014).                                                    ard footprints developed in an earlier version of the
  Digital elevation models are commonly used when                DEVORA scenarios.
modelling volcanic hazards. One modern method to cre-
ate a DEM is using a LAS dataset, which is created using         Auckland volcanic field, North Island, New
a Light (intensity) Detection and Ranging (LiDAR) sys-           Zealand
tem (e.g. White and Wang 2003; Favalli et al. 2009b). To         The AVF is a monogenetic, basaltic volcanic field situ-
create the dataset, a LiDAR system is flown over the area        ated on the North Island of New Zealand (Fig. 1). It has
of interest while a laser in ultraviolet, visible, or infrared   been active for approximately 190kyr with the most re-
wavelengths is directed at the ground (e.g. Wagner et al.        cent eruption 550 yr BP (Leonard et al. 2017). Since the
2006; Heidemann 2018). As the LiDAR system flies over            last eruption, New Zealand’s largest city, Auckland, has
the area of interest, it measures the reflectance of the         been built on top of the volcanic field, and consequently,
original wave emitted (e.g. Axelsson 1999; Wagner et al.         Auckland could be severely impacted by a future AVF
2006; Favalli et al. 2009b). Several returns are measured        eruption (Deligne et al. 2015; Hayes et al. 2017). There
Tsang et al. Journal of Applied Volcanology   (2020) 9:6   Page 3 of 12

 Fig. 1 (See legend on next page.)
Tsang et al. Journal of Applied Volcanology (2020) 9:6 Page 4 of 12
(See figure on previous page.)
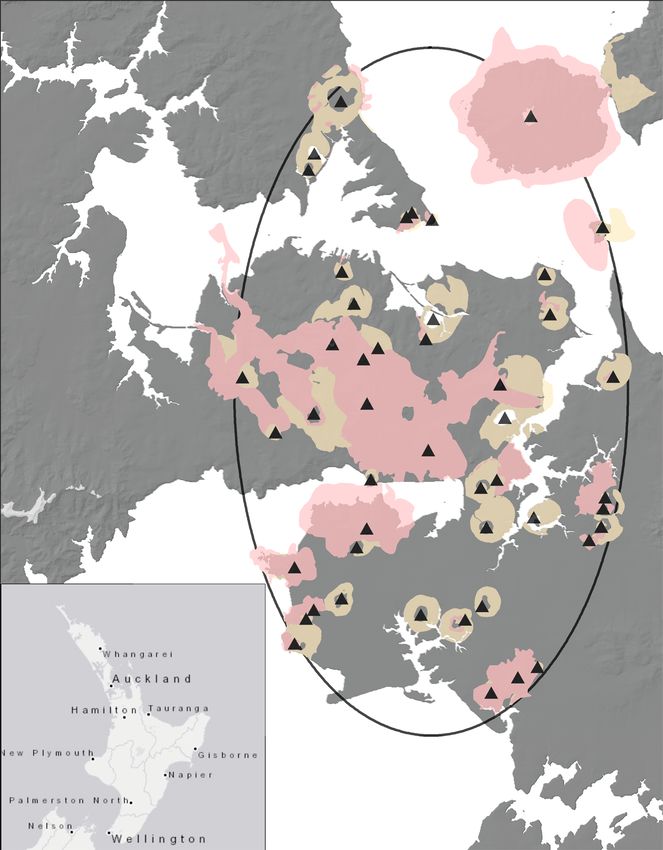
Fig. 1 Map showing Auckland with the volcanic centres of the AVF. The black oval shows the possible boundary of the AVF based on the known
eruptive centres, shown as black triangles (Runge 2015; Kereszturi et al. 2014). The DEVORA scenario vents that we use as case studies are denoted
with solid, red triangles; the letters in each triangle indicate the scenario. B is for Birkenhead; the Birkenhead scenario has two vents, both of which fall
within the northernmost red triangle. M is for Mount Eden; O is for Ōtāhuhu. Inset shows the North Island of New Zealand and major cities; Auckland
is boxed. Figure modified from Bebbington (2015) and Hayes et al. (2018). Data from Kermode (1992) and Land Information New Zealand
are neither strong spatial-temporal nor spatial- eruption scenario in the Auckland region of New Zea-
volumetric trends in the AVF (Bebbington and Cronin land, submitted).
2011; Bebbington 2015), although there are trends cor- Four of the DEVORA scenarios in Hayes et al. (2018)
relating bulk rock chemistry with distance to neighbour- include lava flows: Mt. Eden, Birkenhead, Ōtāhuhu, and
ing vents, volume, and time (Le Corvec et al. 2013; Rangitoto Island. In these scenarios, lava flow hazard
McGee et al. 2015). Without clear spatial-temporal or was represented by a temporal series of hand-drawn
spatial-volumetric trends (Bebbington and Cronin 2011; areal lava flow footprints, following the precedent of
Bebbington 2015), it is difficult to assess probabilistic hand-drawing an areal footprint set by Deligne et al.
hazard for the city, including location and probability of (2015). In Hayes et al. (2018), topography maps were
the next vent opening (Lindsay et al. 2010; Sandri et al. used to estimate the steepest gradient at the flow front’s
2012; Hayes et al. 2018). The Determining Volcanic Risk location. The flow front was then drawn to advance a
in Auckland (DEVORA) research programme (http:// short direction in the direction of the steepest gradient.
www.devora.org.nz/) was established in 2008 to study Once the footprint had been drawn, the volume repre-
the volcanic risk in the city from local and distal volca- sented on the map was calculated using the area of the
noes. To aid stakeholders in preparing for an eruption, flow’s footprint and an average (i.e. mean) thickness
the DEVORA research team developed eight hypothet- based on analogue lava flows. This process was used
ical AVF eruption scenarios (Hayes et al. 2018, 2020), until the total volume prescribed by the scenario had
four of which include lava flows (Fig. 1). been distributed. One of the motivations of our study
was to update the hand-drawn lava flow hazard foot-
DEVORA scenarios prints in these scenarios using numerical modelling.
The DEVORA scenarios are hypothetical eruption se-
quences, incorporating multi-hazard modelling (Hayes Methods
et al. 2018, 2020). The hazards were modelled to repre- To analyse the influence of the built environment on
sent the full range of possible eruptive phenomena and lava flow modelling, we quantitatively model the lava
hazard intensities (Hayes et al. 2018, 2020). Not all haz- flow hazard for three of the DEVORA Scenarios (Mt
ards are included in every scenario; rather, hazards are Eden, Birkenhead, and Ōtāhuhu; Table 1) on both a
included based on how frequently they have occurred in DEM and a DSM. Lava flow modelling of the Rangitoto
past AVF eruptions, and the local environmental condi- Island scenario was not undertaken because the scenario
tions at the scenario vent area (e.g. onshore/offshore; vent is within 25 m of the Hauraki Gulf, minimising the
depth to water table). The resulting DEVORA scenarios possibility of built environment impacts. Although the
have been or will be used in a variety of projects con- vent in the Ōtāhuhu scenario also lies at the edge of a
ducted by DEVORA researchers and their stakeholders, tidal area, the closest body of water is very shallow.
including calculating the impact of an AVF eruption on
electricity transmission networks (Tsang SWR, Lindsay Lava flow hazard model selection
JM, Kennedy B, Deligne: Thermal impacts of basaltic As our modelling results are intended to replace the
lava flows to buried infrastructure: workflow to deter- hand-drawn hazard footprints presented in Hayes et al.
mine the hazard, submitted), reviewing the local govern- (2018), our model selection was guided by the lava flow
ment volcanic contingency plan (A. Doherty, pers. characteristics included in the original scenarios together
comm.), assessing waste disposal during the recovery with DEVORA stakeholder and research programme
phase of an AVF eruption (Hayes 2019), considering guidelines in place for selecting volcanic hazard models
how long it will take roads to clear during an evacuation for the Auckland Volcanic Field.
(e.g. Wild et al. 2019; Wild A: Quantitative hazard and The selection of the most appropriate lava flow
risk modelling approaches for volcanic crisis manage- model(s) is vital to ensure the necessary outputs for the
ment, in preparation), and modelling multi-year eco- intended application. Hayes et al. (2018) includes quanti-
nomic impacts to the area (Cardwell RJ, McDonald GW, tative descriptions of the lava flow’s presence (areal foot-
Wotherspoon LM: Simulation of post eruption time print) and thickness. Seven published and peer-reviewed
variant land use and economic impacts of a volcanic models produce both of these outputs: LAVASIM,Tsang et al. Journal of Applied Volcanology (2020) 9:6 Page 5 of 12
Table 1 Table summarising the rationale and scenario storyline for the three DEVORA scenarios being used here as case studies,
after Hayes et al. (2018)
Scenario Rationale Precursory Eruption Duration Eruption Description Number of
Sequence Lava flows
Duration
Mt Eden Large volume eruption in a residential area, 1.5 months 10.5 months Magmatic eruption 1
requiring a large-scale evacuation
Birkenhead Eruption on North Shore of Auckland, near the 2 weeks 5 months Phreatomagmatic eruption 2
Auckland Harbour Bridge (a major transport link) transitioning to a magmatic eruption
Ōtāhuhu Eruption near major infrastructure hub 2 weeks 1 month Phreatomagmatic eruption 1
transitioning to a magmatic eruption
MAGFLOW, MOLASSES, MULTIFLOW, SCIARA, and by Auckland Council during the second half of 2013.
VOLCFLOW. Additionally, the DEVORA research team They both have a resolution of 1 m and a vertical accur-
use the following criteria to select hazard models used acy of ±0.2 m and a horizontal accuracy of ±0.6 m (both
for the AVF: at a 95% confidence level). The same source DEM and
DSM were used for all model runs although the DEM
Ideally hazard models should be explored that can and DSM were cropped to the area of interest in each
be run in-house in a reasonably short timeframe scenario. No special processing was applied to either
should an eruption begin. product; thus, the DSM includes all surficial features, in-
Codes should ideally be open access, i.e. not cluding trees. In our DSM, many of the buildings in the
dependent on a paid software license. If necessary, localised areas of interest are used as housing and gener-
models that are dependent on proprietary software ally vary from approximately the lava flow’s mean thick-
(e.g. ArcGIS) can be considered if the software is ness to many metres above the lava flow’s upper crust.
widely available to researchers and stakeholders. The input parameters for the MOLASSES modelling are
Since we are modelling processes in a highly included in Table 2. Since the lava flow modelling re-
topographically modified and densely populated sults presented in this paper effectively update the quali-
area, codes that can handle data with high spatial tative footprints in Hayes et al. (2018), the lava flow
resolutions are preferred. hazard outputs presented should be referred to as the
Preference is given to codes that do not need to be DEVORA scenarios, version 1.1.
significantly modified to be applied to Auckland
context. Quantifying the influence of surficial features on lava flow
The code(s) (with minimal or no modification) must modelling results
be executable on a desktop computer. We are unaware of published work presenting lava flow
Finally, there is a preference for codes that have modelling using a DSM. The closest equivalent is Char-
already been validated on natural case studies. bonnier et al. (2018)‘s study that models lahars. Char-
bonnier et al. (2018) found that when the lahar model
Based on these guidelines, we selected the MOLASSES FLO-2D is calibrated with geological data, a modelled
lava flow simulation code (Gallant et al. 2018). MOLAS- lahar can be highly sensitive to sub-meter obstacles. We
SES determines an areal footprint and the thickness of present lava flow modelling in an urban area and pro-
the lava flow at given locations, yielding the required vide a quantitative measure of how the built environ-
outputs for our case studies, and can be run locally on ment alters the lava flow model results. There are
both a DSM and DEM without requiring a proprietary locations where a DSM is unnecessary, and indeed its in-
license. For a more detailed explanation of how and why clusion could needlessly increase processing times. For
MOLASSES was selected, see Tsang (2020). example, a DSM is unlikely to be required if the area
modelled coincides with a park; indeed, a DSM of a for-
Lava flow hazard modelling ested park would include combustible trees which would
We have run MOLASSES six times here to illustrate be treated as permanent barriers, which likely does not
how results can differ if a surface model is used instead reflect reality. In order to determine whether the results
of an elevation model. All three scenarios were run twice from a DSM or DEM are more appropriate to use given
in MOLASSES, once on a DEM and once on a DSM. the wider hazard assessment context of the modelling,
The DEM and DSM used in this project are publicly we propose using two measures to compare the DEM
available from Land Information New Zealand (LINZ) and DSM results. The first measure is a modified version
and were created using the same LAS dataset captured of the Jaccard coefficient:Tsang et al. Journal of Applied Volcanology (2020) 9:6 Page 6 of 12
Table 2 Input parameters for the MOLASSES lava flow modelling for three DEVORA scenarios. Coordinates are provided in New
Zealand Transverse Mercator (2000)
Parameter Scenario Value Source/Justification
Easting (M) Mt Eden 1,757,370 Hayes et al. (2018)
Ōtāhuhu 1,765,010
Birkenhead Lava Flow 1 1,755,916
Birkenhead Lava Flow 2 1,755,914
Northing (M) Mt Eden 5,916,250
Ōtāhuhu 5,909,090
Birkenhead Lava Flow 1 5,923,738
Birkenhead Lava Flow 2 5,923,767
3
Volume (M ) Mt Eden 59,871,290
Ōtāhuhu 450,970
Birkenhead Lava Flow 1 960,810
Birkenhead Lava Flow 2 8,647,290
Modal thickness (M) all 17.5 Hayes et al. (2018)
Pulse Volume (M3) Mt Eden 1000 Based on authors’ available computational memory
Ōtāhuhu 10
Birkenhead Lava Flow 1 10
Birkenhead Lava Flow 2 100
Results
ADEM ∩ADSM The lava flow model inputs are arranged by scenario in
Overlap ð%Þ ¼ 100 ð1Þ
ADEM ∪ADSM Table 2 while the model outputs are visually shown in
Fig. 2 and compared in Table 3.
where ADEM is the area covered by the lava flow when
Discussion
modelled on the DEM and ADSM is the area covered by
Lava flow hazard models and computing power have
the lava flow when modelled on the DSM. When the
greatly improved over recent decades, allowing for more
resulting overlap is high, then the DSM is not adding
detailed lava flow hazard assessments to be conducted
value to the simulations run on the DEM. Conversely,
on a variety of surface models.
when the overlap is low, the implication is that human
modifications to the land are resulting in a difference in
Importance and implications of surface model selection
the modelled lava flow areal footprint. Thus, the lower
Although the selection of a lava flow method is import-
the percent overlap, the more important it is to consider
ant, choosing the correct elevation model for the project
what is causing the difference between the two foot-
also greatly influences the accuracy of the model’s out-
prints. If structures included in the DSM are likely to be-
puts. When modelling hazards, it is standard to use a
have as barriers (e.g. concrete buildings), then the
DEM (e.g. Barca et al. 1993; Scifoni et al. 2010; Favalli
modeller should critically consider if modelling on a
et al. 2012). Occasionally, the DEM may be modified to
DSM is possible. The second measure compares the
incorporate a manmade barrier to determine if the bar-
maximum run out lengths of the footprints:
rier could protect an area of significance (Fujita et al.
2008; Scifoni et al. 2010). Although using a modified
LDSM DEM is not common practice, the topography in some
Length ð%Þ ¼ 100 ð2Þ
LDEM volcanic areas has been extensively modified (e.g. Char-
bonnier et al. 2018; Hayes et al. 2018). Thus, DEMs may
where LDSM is the runout length of the DSM results in not be the most accurate representation of the obstacles
the direction of the maximum runout length of the a lava flow may encounter (Kereszturi et al. 2012), and a
DEM results and LDEM is the maximum runout length DSM may be more appropriate.
of the DEM results. The lower the percentage is, the less In our AVF case studies, we presented lava flow
overlap of the results there is in that direction. hazard footprints on both DEMs and DSMs. In each
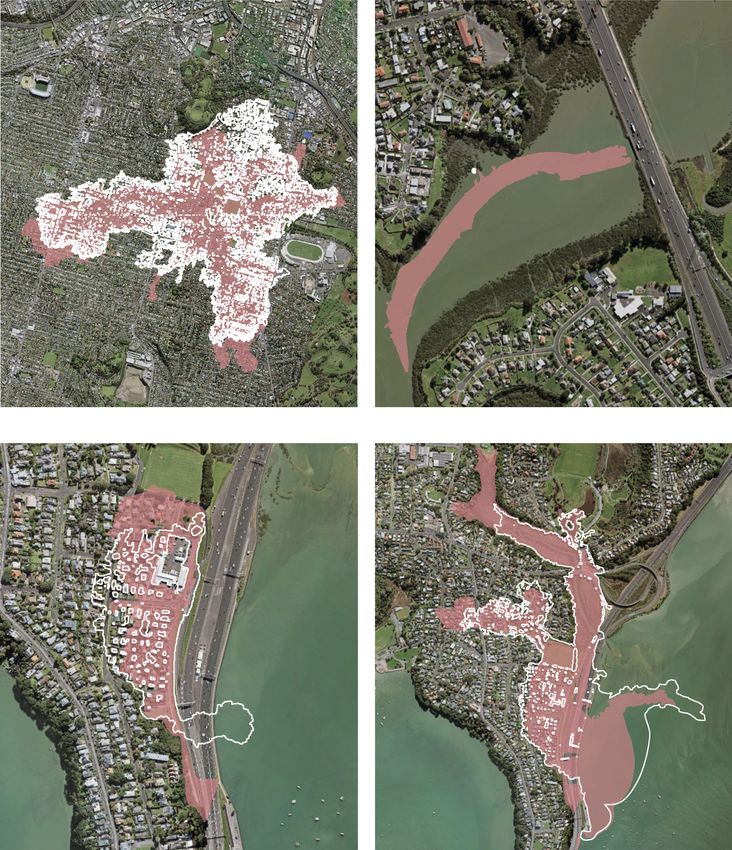
case, the hazard footprint generated on the DEM hadTsang et al. Journal of Applied Volcanology (2020) 9:6 Page 7 of 12 Fig. 2 Results of lava flow modelling using MOLASSES on a DEM (results shown in pink) and a DSM (results outlined in white) with scenario vent indicated with a red triangle for a) the Mt Eden scenario. b the Ōtāhuhu scenario. c the first lava flow in the Birkenhead scenario and d) the second lava flow in the Birkenhead scenario. Note different scales in each figure. Percentages refer to the modified Jaccard coefficient calculated for each scenario a longer runout length (≥2% to 24% longer) than the shorter runout length and thinner footprints in the corresponding DSM results (Fig. 2). The DSM results DSM results both have implications for evacuation also frequently had a corresponding equal or thinner zones and expected building damage. Shorter runout lava flow thicknesses the DEM results (Table 3). The lengths may necessitate smaller evacuation or
Tsang et al. Journal of Applied Volcanology (2020) 9:6 Page 8 of 12
Table 3 Comparison of the DEM and DSM modelling results, including median and thicknesses in metres, the Jaccard coefficient,
and the runout length. Thicknesses have been rounded to the nearest quarter metre
Scenario Median thickness (m) Mean thickness (m) Jaccard Coefficient (%) Runout length (%)
DEM DSM DEM DSM
Mt Eden 17.75 17.5 17.5 16.75 63 89
Ōtāhuhu 17.5 17.5 16.75 16.75 90 98
Birkenhead Lava Flow 1 17.0 17.5 16.5 16.75 40 76
Birkenhead Lava Flow 2 17.75 17.5 17.5 17.5 65 79
exclusions zones. However, thicker lava flows are would be needed to develop such a hybrid DSM, and the
more likely to overtop single or double storied build- endeavour is likely to be time consuming and to require
ings, increasing expected damage. Additionally, thicker familiarity with local construction practices. Ideally, lava
lava flows would have a larger surface area in contact flow models would allow for changes of the surface
with large structures, which in turn would increase model from one iteration to the next to represent pro-
the pressure exerted on the structure by the lava flow gressive damage to the built environment. This will re-
(likely increasing expected damage) and potentially in- quire further research about lava flow impacts. Thus, we
crease combustion rates. suggest that DSMs should be strongly considered when
However, lava flows frequently damage the built envir- simulating lava flows advancing through heavily modi-
onment they encounter (e.g. Harris 2015; Neal et al. fied areas. In lightly modified areas and in areas where
2019), so obstacles such as timber-framed buildings, rep- the dominant construction material has a low combus-
resented in the DSM (Fig. 3), may be destroyed during tion point (i.e. timber-framed buildings), a DEM could
the eruption and no longer affect the lava flow path (e.g. still be more appropriate, especially if the final areal
Williams and Moore 1983; Jenkins et al. 2017). Con- footprint is important.
versely, natural, topographic obstacles are unlikely to Using a DSM can have important planning implica-
disappear during an eruption. Therefore, for lava flow tions, but using a DSM also comes with a computational
modelling, a surface model that combines a DEM with cost. DSMs are frequently produced using much higher
aspects of a DSM (i.e. a DSM that does not include trees, resolution data than DEMS as surficial features tend to
or buildings where the primary building material has a be on metre scales. Most lava flow models were not cre-
low combustion point) may be the most accurate repre- ated with metre scale surface models in mind (Mossoux
sentation of a modified terrain. The original LAS dataset et al. 2016). Thus, processing times are often
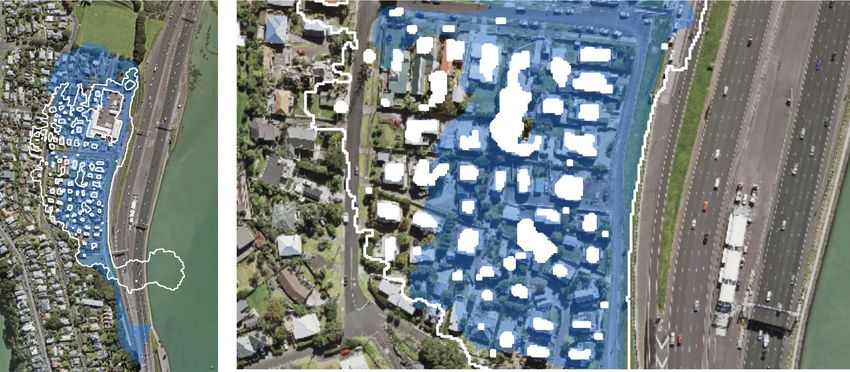
Fig. 3 A closer look at MOLASSES lava flow modelling results from a portion of the Birkenhead flow 1 from Fig. 2c, illustrating how the DSM
results differ from the DEM results (in blue). White filled in areas indicate obstacles that the lava would potentially flow around, according to the
MOLASSES run on the DSM. It is important to note that not all of the buildings would necessarily survive the eruption as many are residential
timber-framed structures that have relatively low combustion pointsTsang et al. Journal of Applied Volcanology (2020) 9:6 Page 9 of 12
substantially longer when modelling on a high spatial implications. In some instances such as evacuation
resolution surface model than the low-resolution surface planning, the outer perimeter of the areal footprint is
models traditionally used. Depending on the model used of more interest than the entire footprint.
and computing power available, rapidly generating lava
flow model outputs, as is required during a crisis, may Comparison of results with qualitative lava flow hazard
not be possible on a DSM due to the higher resolution footprints in Hayes et al. (2018)
required of the topography model (or a DEM with Most of the input parameters used by Hayes et al. (2018)
equivalent spatial resolution). Despite these drawbacks, are the same as those used here. In fact, Hayes et al.
DSMs may be more appropriate input data in certain (2018) used a surface model, rather than an elevation
circumstances, such as when planning exercises. model, to draw their qualitative lava flow footprints. The
volume pulse is the only input parameter that is not
Quantitative evaluation of surface model selection shared between Hayes et al. (2018) and this paper. Des-
Previous applications of the Jaccard coefficient in the pite very similar starting points, the resulting areal ex-
context of hazard modelling has been used to assess tents of the lava flows in Hayes et al. (2018) and this
how accurately a hazard model’s output matches the paper are quite different. First, the extents in Hayes et al.
scenario the model is attempting to replicate (Cor- (2018) are notably longer (Fig. 4). This is likely because
donnier et al. 2016; Mossoux et al. 2016; Favalli et al. effusion rates, represented by the pulse volume param-
2012). We have adapted it to analyse the overlap be- eter in MOLASSES, are not directly considered in Hayes
tween the DEM areal footprint and the DSM areal et al. (2018). Discontinuous lava effusion was considered
footprint. Following the lead of Cordonnier et al. in Hayes et al. (2018) and represented by the stalling of
(2016) and Dietterich et al. (2017), we do not provide the lava flow fronts; variations in effusion rates were,
guideline Jaccard coefficient percentages to determine otherwise, not considered. In order to create MOLAS-
when to use a DSM versus a DEM, as the appropriate SES footprints with similar extents to Hayes et al.
cut-off percentage undoubtedly varies from one pro- (2018), a lower pulse volume would be necessary. Sec-
ject to the next. ond, the surface models used in this paper had a higher
The Jaccard coefficient indiscriminately calculates spatial resolution than the surface model used by Hayes
the overlap between two areas. If one is modelling on et al. (2018) enabling more precise topographic gradient
a DSM, it is important to note that the size of the calculations than were used in Hayes et al. (2018). As-
kipuka (any area that is not inundated but is sur- suming accurate representation of the physical process,
rounded by a lava flow) in the results. If a building the paths lava followed in our case studies (Fig. 2; Fig.
survives an eruption (forming an anthropogenic 4b) are more realistic than those drawn in Hayes et al.
kipuka (e.g. the kipuka formed by a church during (2018; Fig. 4a). Although both the effusion rate and
the eruption that began at Paricutin in 1943 (Luhr spatial resolution discrepancies suggest that the areal ex-
and Simkin 1993))) but is surrounded by lava, it will tents presented here consider more nuanced data than
be difficult to access. Thus, some may consider such those in Hayes et al. (2018), inputs to the MOLASSES
buildings to be useless. A kipuka can also be large modelling undertaken here could be improved. For ex-
enough to enclose multiple buildings, though (Neal ample, we used the AVF lava flows’ mean thickness, ra-
et al. 2019). In such cases, the buildings may not sus- ther than the requested modal thickness, due to
tain any damage although would still be difficult to availability of data, but this assumes the AVF lava flow
access during and after the crisis. Both natural and thickness distribution is Gaussian, which we deem un-
man-made diversion structures could likely create likely. Thus, the lava flow modelling in this paper can be
such kipuka. Additionally, buildings surrounded by further updated as we learn more about AVF lava flows.
lava that survive an eruption and can still be entered The case studies presented here provide more infor-
may preserve smaller assets that can be evacuated mation (i.e. thickness maps on a metre scale) on the
when the lava flow is safe to cross. No matter the lava flows in the DEVORA scenarios than previously
kipuka size, the kipuka will influence the Jaccard co- existed, so our model results can be used in a variety
efficient results (e.g. Fig. 2). For the aforementioned of preparedness activities including stakeholder work-
reasons, we feel that the Jaccard coefficient calcula- shops and evacuation and contingency modelling. The
tion should include the DSM areal footprint as is, i.e. results of modelling conducted in this paper are
with the kipuka created by the buildings. While in- aligned with Hayes et al. (2018)‘s goal of using quan-
cluding the diversion structure and building kipuka titative models for all of the considered hazards, al-
will decrease the total overlap compared to using only though we acknowledge that qualitative methods may
the perimeter of the areal footprints to calculate the be more appropriate depending on the required
Jaccard coefficient, the kipuka have planning outputs.Tsang et al. Journal of Applied Volcanology (2020) 9:6 Page 10 of 12
Fig. 4 Comparison of the Mt Eden lava flows created a) for Hayes et al. (2018) where the lava flow effuses from the bottom of the cone (a large
area represented by the brown circle) and b) using MOLASSES where the lava flow effuses from a point source vent (orange star)
Conclusion recommend using the DSM results in these cases. A
As settlements continue to encroach upon volcanoes, it similar decision would likely be made in most of the ter-
is important to start or continue to prepare for future restrial Auckland Volcanic Field.
eruptions. Lava flow modelling has become increasingly
sophisticated over the past few decades, but with the Abbreviations
AVF: Auckland Volcanic Field; DEM: Digital Elevation Model;
proliferation of models, selection of the most suitable DEVORA: Determining Volcanic Risk in Auckland; DSM: Digital Surface Model;
model for a specific purpose becomes more difficult. Al- LiDAR: Light intensity detection and ranging
though most lava flow models have been developed to
run on DEMs, DSMs capture all obstacles (irrespective Acknowledgements
of their physical properties) the flow may encounter. We would like to thank Laura Connor for her help setting up MOLASSES and
Dr. Graham Leonard for discussions of this work. We are grateful to Prof.
Thus, when lava flow hazard models are run on a DSM, Chuck Connor and an anonymous reviewer for helpful comments on this
the results will have considered the obstacles encoun- manuscript.
tered by the flow. We illustrate the difference a DSM
can make in three case studies in the AVF. In our case Authors’ contributions
Authors SWRT and JML conceived this study. SWRT undertook the lava flow
study scenarios, we found that lava flows modelled on a modelling. GC advised SWRT on the lava flow modelling. All authors
DEM generally have a longer runout length compared to contributed to the preparation and editing of the manuscript. The author(s)
lava flows modelled on a DSM. We use a modified Jac- read and approved the final manuscript.
card coefficient to quantify the difference between using
Funding
a DEM and using a DSM. The most overlap (90%) oc- We are grateful for funding from the Determining Volcanic Risk in Auckland
curred in the Ōtāhuhu scenario which is located in an (DEVORA) research programme, the New Zealand Earthquake Commission
area with minimal anthropogenic modifications. Thus, a (EQC), and the GNS Science Strategic Investment Fund.
DEM adequately portrays the topography in this sce-
nario. Since there is much less overlap in terrestrial areas Availability of data and materials
The dataset supporting the conclusions of this article is available in the
with generally high levels of urban development (e.g. the University of Auckland’s Figshare repository, doi: https://doi.org/10.17608/k6.
Birkenhead and Mt Eden scenarios), we would auckland.9962021 in https://auckland.figshare.com/.Tsang et al. Journal of Applied Volcanology (2020) 9:6 Page 11 of 12
Ethics approval and consent to participate assessment, forecasting, and risk management. J Appl Volcanol 6. https://doi.
Not applicable. org/10.1186/s13617-017-0061-x
Favalli M, Chirico GD, Papale P, Pareschi MT, Boschi E (2009a) Lava flow hazard at
Consent for publication Nyiragongo volcano, D.R.C. 1. Model calibration and hazard mapping. Bull
Not applicable. Volcanol 71:363–374. https://doi.org/10.1007/s00445-008-0233-y
Favalli M, Chirico GD, Papale P, Pareschi MT, Coltelli M, Lucana N, Boschi E (2006)
Competing interests Computer simulations of lava flow paths in the town of Goma, Nyiragongo
We declare we do not have any competing interests. volcano, −Democratic Republic of Congo. J Geophys Res Solid Earth 111.
https://doi.org/10.1029/2004JB003527
Author details Favalli M, Fornaiciai A, Pareschi MT (2009b) LIDAR strip adjustment: application to
1
School of Environment, University of Auckland, Auckland, New Zealand. volcanic areas. Geomorph 111:123–135. https://doi.org/10.1016/j.geomorph.
2
GNS Science, Avalon, Lower Hutt, New Zealand. 2009.04.010
Favalli M, Tarquini S, Papale P, Fornaciai A, Boschi E (2012) Lava flow hazard and
Received: 15 October 2019 Accepted: 20 April 2020 risk at Mt. Cameroon volcano. Bull Volcanol 74:423–439. https://doi.org/10.
1007/s00445-011-0540-6
Fujita E, Hidaka M, Goto A, Umino S (2008) Simulations of measures to control
lava flows. Bull Volcanol 71:401–408. https://doi.org/10.1007/s00445-008-
References
0229-7
Allen SR, Smith IEM (1994) Eruption styles and volcanic hazard in the Auckland
Gallant E, Richardson J, Connor C, Wetmore P, Connor L (2018) A new approach
volcanic field, New Zealand. Geosci Reports Shizuoka Uni 20:5–14
to probabilistic lava flow hazard assessments, applied to the Idaho National
Axelsson P (1999) Processing of laser scanner data- algorithms and applications. J
Laboratory, eastern Snake River. Geol 46:895–898. https://doi.org/10.1130/
Photogrammetry Remote Sens 54:138–147. https://doi.org/10.1016/S0924-
G45123.1
2716(99)00008-8
Harris AJL (2015) Volcanic hazards, risks and disasters. In: Shroder JF, Papale P
Barca D, Crisci GM, Di Gregorio S, Nicoletta F (1993) Cellular automata methods
(eds) Volcanic hazards, risks and disasters. Elsevier, Waltham
for modelling lava flows: simulation of the 1986-1987 eruption, Mount Etna,
Hayes J, Wilson TM, Deligne NI, Cole J, Hughes M (2017) A model to assess
Sicily. In: Kilburn CRJ, Luongo G (eds) Active lavas: monitoring and Modelling.
tephra clean-up requirements in urban environments. J App Volcanol 6.
Routledge, New York
https://doi.org/10.1186/s13617-016-0052-3
Bebbington MS (2015) Spatio-volumetric hazard estimation in the Auckland
volcanic field. Bull Volcanol 77. https://doi.org/10.1007/s00445-015-0921-3 Hayes JL (2019) Clean-up and restoration of urban environments after volcanic
Bebbington MS, Cronin SJ (2011) Spatio-temporal hazard estimation in the eruption. Dissertation. University of Canterbury, Christchurch
Auckland volcanic field, New Zealand, with a new event-order model. Bull Hayes JL, Tsang SW, Blake DM, Lindsay JM et al (2018) The DEVORA scenarios:
Volcanol 73:55–72 multi-hazard eruption scenarios for the Auckland volcanic field. GNS Science,
Bilotta G, Cappello A, Herault A, del Negro C (2019) Influence of topographic Avalon, p 138. https://doi.org/10.21420/G20652
data uncertainties and model resolution on the numerical simulation of lava Hayes JL, Wilson TM, Deligne NI, Lindsay JM, Leonard GS, Tsang SWR, Fitzgerald
flows. Environ Model Softw 112:1–15 RH (2020) Developing a multi-hazard eruption scenario suite using an
Bonaccorsco A, Calvari S, Boschi E (2016) Hazard mitigation and crisis interdisciplinary approach. J Volcanol Geotherm Res 392. https://doi.org/10.
management during major flank eruptions at Etna volcano: reporting on real 1016/j.jvolgeores.2019.106763
experience. https://doi.org/10.1144/SP426.4 Heidemann HK (2018) Lidar base specification (ver. 1.3). In: U.S. Geological Survey
Bonne K, Kervyn M, Cascone L, Njome S, Van Ranst E, Suh E et al (2008) A new techniques and methods. USGS, Reston. https://doi.org/10.3133/tm11b4
approach to assess long-term lava flow hazard and risk using GIS and low- Jaggar TA (1945) Protection of harbors from lava flow. Am J Sci 243-A:333–351
cost remote sensing: the case of Mount Cameroon, West Africa. Int J Remote Jenkins SF, Day SJ, Faria BE, Fonseca JFBD (2017) Damage from lava flows:
Sens 29:6539–6564. https://doi.org/10.1080/01431160802167873 insights from the 2014-2015 eruption of Fogo, Cape Verde. J App Volcanol 6.
Brown SK, Jenkins SF, Sparks RSJ, Odbert H, Auker MR (2017) Volcanic fatalities https://doi.org/10.1186/s13617-017-0057-6
database: analysis of volcanic threat with distance and victim classification. J Kereszturi G, Cappello A, Ganci G, Procter J, Németh K, del Negro C, Cronin SJ
App Volcanol 6. https://doi.org/10.1186/s13617-017-0067-4 (2014) Numerical simulation of basaltic lava flows in the Auckland volcanic
Brunsdon D, Park B (2009) Lifeline vulnerability to volcanic eruption: Learnings field, New Zealand- Implication for volcanic hazard assessment. Bull Volcanol
from a national simulation exercise. Technical council on lifeline earthquake 76. https://doi.org/10.1007/s00445-014-0879-6
engineering conference, Oakland, p 2009 Kereszturi G, Procter J, Cronin SJ, Nemeth K, Bebbington M, Lindsay J (2012)
CDEM (2015) Auckland volcanic field contingency plan. Auckland Emergency LiDAR-based quantification of lava flow susceptibility in the City of Auckland
Management. (New Zealand). Remote Sens Environ 125:198–213. https://doi.org/10.1016/j.
Charbonnier SJ, Connor CB, Connor LJ, Sheridan MF, Oliva Hernández JP, rse.2012.07.015
Richardson JA (2018) Modeling the October 2005 lahars at Panabaj Kermode LO (1992) Geology of the Auckland urban area 1: 50 000. GNS Science
(Guatemala). Bull Volcanol 80. https://doi.org/10.1007/s00445-017-1169-x geological map 2(1). 1 sheet + 63p
Chirico GD, Favalli M, Papale P, Boschi E, Pareschi MT (2009) Lava flow Hazard at Le Corvec N, Bebbington MS, Lindsay JM, McGee LE (2013) Age, distance, and
Nyiragongo volcano, D.R.C. 2. Hazard reduction in urban areas. Bull Volcanol geochemical evolution within a monogenetic volcanic field: analyzing
71:375–387. https://doi.org/10.1007/s00445-008-0232-z patterns in the Auckland volcanic field eruption sequence. Geochem
Connor JL, Connor CB, Meliksetian K, Savov I (2012) Probabilistic approach to Geophys Geosys 14:3648–3665. https://doi.org/10.1002/ggge.20223
modelling lava flow inundation: a lava flow hazard assessment for a nuclear Leonard GS, Calvert AT, Hopkins JL, Wilson CJN, Smid ER, Lindsay JM et al (2017)
facility in Armenia. J App Volcanol 1:3 High-precision40Ar/39Ar dating of quaternary basalts from Auckland volcanic
Cordonnier B, Lev E, Garel F (2016) Benchmarking lava-flow models. In: Harris AJL, field, New Zealand, with implications for eruption rates and paleomagnetic
De Groeve T, Garel F, Carn SA (eds) Detecting, Modelling, and responding to correlations. J Volcanol Geotherm Res 343:60–74. https://doi.org/10.1016/j.
effusive eruptions. Geological Society of London, London jvolgeores.2017.05.033
County of Hawai’i (2019) Kīlauea Eruption Recovery. https://recovery. Lindsay J, Marzocchi W, Jolly G, Constantinescu R, Selva J, Sandri L (2010) Towards
hawaiicounty.gov/home-recovery. Accessed 25 Sept 2019 real-time eruption forecasting in the Auckland volcanic field: application of BET_
Deligne NI, Blake DM, Davies AJ, Grace ES, Hayes JL, Potter S et al (2015) EF during the new Zealand National Disaster Exercise ‘Ruaumoko’. Bull Volcanol
Economics of resilient infrastructure Auckland volcanic scenario. ERI research 72:185–204. https://doi.org/10.1007/s00445-009-0311-9
report 2015/03, p 153 Luhr JF, Simkin T (1993) Paricutin: the volcano born in a Mexican cornfield.
Dietrich JT (2015) Riverscape mapping with helicopter-based structure-from- Geoscience Press, Inc, Phoenix
motion photogrammetry. Geomorph 252:144–157. https://doi.org/10.1016/j. McGee LE, Millet M-A, Beier C, Smith IE, Lindsay JM (2015) Mantle heterogeneity
geomorph.2015.05.008 controls on small-volume basaltic volcanism. Geology 43(6):551–554. https://
Dietterich HR, Lev E, Chen J, Richardson JA, Cashman KV (2017) Benchmarking doi.org/10.1130/G36590.1
computational fluid dynamics models of lava flow simulation for hazard McPhee J (1989) The control of nature. Farrar, Straus and Giroux, New YorkTsang et al. Journal of Applied Volcanology (2020) 9:6 Page 12 of 12
Morgan AV (2000) The Eldfell eruption, Heimaey, Iceland: a 25-year retrospective.
Geosci Canada 27:11–18
Mossoux S, Bartolini S, Poppe S, Canters F, Kervyn M (2016) Q-LavHA : a flexible
GIS plugin to simulate lava flows. Comput Geosci 97:98–109. https://doi.org/
10.1016/j.cageo.2016.09.003
Neal CA, Brantley SR, Antolik L, Babb JL, Burgess M, Calles K et al (2019) The 2018
rift eruption and summit collapse of Kīlauea volcano. Science 363:367–374.
https://doi.org/10.1126/science.aav7046
Ouedraogo MM, Degre A, Debouche C, Lisein J (2014) The evaluation of
unmanned aerial system-based photogrammetry and terrestrial laser
scanning to generate DEMs of agricultural watersheds. Geomorph 214:339–
355. https://doi.org/10.1016/j.geomorph.2014.02.016
Rongo R, Lupiano V, Spataro W, D’ambrosio D, Iovine G, Crisci GM (2016) SCIARA:
cellular automata lava flow modelling and applications in hazard prediction
and mitigation. In: Harris AJL, De Groeve T, Garel F, Carn SA (eds) Detecting,
Modelling, and responding to effusive eruptions. Geological Society of
London, London
Runge MG (2015) Improving probabilistic hazard forecasts in volcanic fields
Application to Harrat Rahat, Kingdom of Saudi Arabia. Dissertation. University
of Auckland, Auckland
Sandri L, Jolly G, Lindsay J, Howe T, Marzocchi W (2012) Combining long- and
short-term probabilistic volcanic hazard assessment with cost-benefit analysis
to support decision making in a volcanic crisis from the Auckland volcanic
field, New Zealand. Bull Volcanol 74:705–723. https://doi.org/10.1007/s00445-
011-0556-y
Scifoni S, Coltelli M, Marsella M, Proietti C, Napoleoni Q, Vicari A, Del Negro C
(2010) Mitigation of lava flow invasion hazard through optimized barrier
configuration aided by numerical simulation: the case of the 2001 Etna
eruption. J Volcanol Geotherm Res 192:16–26. https://doi.org/10.1016/j.
jvolgeores.2010.02.002
Searle EJ (1964) City of volcanoes: a geology of Auckland. Paul Longman,
Auckland
Tsang SW, Lindsay JM, Deligne NI (2019) Short-term preparation for and response
to an impending lava flow: lessons from the June 27th lava flow (2014-2015),
Hawaii, USA. GNS Science, Avalon, p 87. https://doi.org/10.21420/XPT9-XG94
Tsang SWR (2020) Modelling the hazard footprint and consequences of lava
flows in an urban environment. Dissertation. University of Auckland,
Auckland
UNDDR (2019) Global assessment report on disaster risk reduction. United
Nations Office for Disaster Risk Reduction, Geneva
Villa F (2002) Mount Etna huffs, puffs, but causes no injuries; lava flow is far from
settlements. The Record, Bergen County New Jersey
von Hochstetter F (1859) The isthmus of Auckland with its extinct volcanoes. T.
Delattre, Auckland
Wagner W, Ullrich A, Ducic V, Melzer T, Studnicka N (2006) Gaussian
decomposition and calibration of a novel small-footprint full-waveform
digitising airborne laser scanner. J Photogrammetry Remote Sens 60:100–
112. https://doi.org/10.1016/j.isprsjprs.2005.12.001
Westoby MJ, Brasington J, Glasser NF, Hambrey MJ, Reynolds JM (2012)
‘Structure-from-motion’ photogrammetry: a low-cost, effective tool for
geoscience applications. Geomorph 179:300–314. https://doi.org/10.1016/j.
geomorph.2012.08.021
White SA, Wang Y (2003) Utilizing DEMs derived from LIDAR data to analyse
morphologic change in the North Carolina coastline. Remote Sens Env 85:
39–47 10.1016.S0034-4257(02)00185-2
Wild A, Lindsay JM, Costello SB, Deligne NI, Doherty A, Leonard GS, Maxwell K,
Rollin J, Wilson TM (2019) Auckland volcanic field eruption crisis
management decision-making pilot workshop, vol 44. GNS Science, Avalon.
https://doi.org/10.21420/V1B6-NC43
Williams RS, Moore JG (1983) Man against volcano: the eruption on Heimaey,
Vestmennaeyjar, Iceland. US Geological Survey, Reston
Publisher’s Note
Springer Nature remains neutral with regard to jurisdictional claims in
published maps and institutional affiliations.You can also read