Personnel Assessment and Decisions - ScholarWorks ...
←
→
Page content transcription
If your browser does not render page correctly, please read the page content below
Personnel Assessment and
                                                                              Decisions
Volume 7
Issue 1 Special Issue: Understanding Effects of                                                  Article 3
Impression Management on Assessment
Outcomes

2021

Faking and the Validity of Personality Tests: An Experimental
Investigation Using Modern Forced Choice Measures
Christopher R. Huber
Human Resources Research Organization

Nathan R. Kuncel
University of Minnesota-Twin Cities

Katie B. Huber
University of Wisconsin-River Falls

Anthony S. Boyce
Amazon
Follow this and additional works at: https://scholarworks.bgsu.edu/pad

   Part of the Human Resources Management Commons, Industrial and Organizational Psychology
Commons, and the Other Psychology Commons

Recommended Citation
Huber, Christopher R.; Kuncel, Nathan R.; Huber, Katie B.; and Boyce, Anthony S. (2021) "Faking and the
Validity of Personality Tests: An Experimental Investigation Using Modern Forced Choice Measures,"
Personnel Assessment and Decisions: Vol. 7 : Iss. 1 , Article 3.
DOI: https://doi.org/10.25035/pad.2021.01.003
Available at: https://scholarworks.bgsu.edu/pad/vol7/iss1/3

This work is licensed under a Creative Commons
Attribution 4.0 International License.
This Main Article is brought to you for free and open
access by the Journals at ScholarWorks@BGSU. It has
been accepted for inclusion in Personnel Assessment
and Decisions by an authorized editor of
ScholarWorks@BGSU.
Research Articles                                                                Personnel Assessment and Decisions

                                    Faking and the Validity of
                                    Personality Tests:
                                    An Experimental Investigation Using
                                    Modern Forced Choice Measures
                                    Christopher R. Huber1, Nathan R. Kuncel2, Katie B. Huber3,
                                    and Anthony S. Boyce4
                                    1. Human Resources Research Organization
                                    2. University of Minnesota-Twin Cities
                                    3. University of Wisconsin-River Falls
                                    4. Amazon

                                                                                                                    ABSTRACT
                                       Despite the established validity of personality measures for personnel selection, their
                                       susceptibility to faking has been a persistent concern. However, the lack of studies that
                                       combine generalizability with experimental control makes it difficult to determine the effects
          KEYWORDS                     of applicant faking. This study addressed this deficit in two ways. First, we compared a subtle
                                       incentive to fake with the explicit “fake-good” instructions used in most faking experiments.
                                       Second, we compared standard Likert scales to multidimensional forced choice (MFC) scales
        faking, personality            designed to resist deception, including more and less fakable versions of the same MFC
          testing, validity,           inventory. MFC scales substantially reduced motivated score elevation but also appeared to
        personnel selection            elicit selective faking on work-relevant dimensions. Despite reducing the effectiveness of
                                       impression management attempts, MFC scales did not retain more validity than Likert scales
                                       when participants faked. However, results suggested that faking artificially bolstered the
                                       criterion-related validity of Likert scales while diminishing their construct validity.

     Concerns about the fakability of personality measures           if they so choose. A meta-analysis by Viswesvaran and
gained traction soon after the emergence of personality              Ones (1999) found large differences between faked and
testing itself and persist to this day (Meehl & Hathaway,            honest responses on the Big Five traits, especially in stud-
1946; Rosse et al., 1998; Zickar, 2000). Substantial distor-         ies that used within-subjects designs. In these studies, par-
tion and outright lying have been documented on a variety            ticipants elevated their scores (on average) by .47 standard
of predictors, including interviews, biographical informa-           deviations on agreeableness, .54 on extraversion, .76 on
tion, and personality questionnaires (Anderson et al., 1984;         openness, .89 on conscientiousness, and .93 on emotional
Cascio, 1975; Pannone, 1984; Weiss & Feldman, 2006).                 stability.
Despite such findings, meta-analytic syntheses suggest that               Although directed faking studies show what fakers
personality traits such as conscientiousness and emotional           could do in theory, comparisons between applicant and
stability retain substantial criterion-related validity in em-       non-applicant samples are commonly used to estimate the
ployment settings (Barrick & Mount, 1991; Barrick et al.,            typical degree of response distortion in operational testing.
2001). This evidence has led some researchers to argue that          A meta-analysis by Birkeland et al. (2006) found that ap-
the negative effects of faking are largely exaggerated (e.g.,        plicants scored somewhat higher than non-applicants on
Ones et al., 1996), whereas others remain concerned. The             extraversion (Cohen’s d = .13), openness (.15), and agree-
purpose of this study is to advance our understanding of             ableness (.19), and much higher on emotional stability (.50)
the faking–validity relationship using a novel experimental
methodology.
     Directed faking studies, in which participants are ex-
                                                                         Corresponding author:
plicitly instructed to “fake good” by posing as ideal job                Chris Huber
candidates, demonstrate that applicants can fake effectively             Email: huber195@umn.edu

                                 2021 • Issue 1 • 20-30                                        http://scholarworks.bgsu.edu/pad/
  20
Personnel Assessment and Decisions Faking and the Validity of Personality Tests
and conscientiousness (.52). The larger effect sizes for emo- extreme faking all but eliminated true personality variance
tional stability and conscientiousness mirror the findings from faked scores, the inability to recover true personality
from directed faking and validity generalization research, variance via a correction was almost a foregone conclusion.
suggesting applicants selectively fake on the most univer- The tension between experimental control and general-
sally job-relevant traits. On the other hand, the lack of ex- izability to typical applicant behavior has been a persistent
perimental control in applicant/non-applicant comparisons issue in the faking literature, limiting our ability to draw
limits their ability to isolate the effects of faking. A variety nuanced conclusions about the effects of applicant faking.
of other factors—including selection, attrition, and differ- The present study was designed to address the limitations
ential motivation to take a personality test seriously—may of previous research in order to provide a better under-
influence group differences in personality scores (as well as standing of the faking–validity relationship. Specifically,
validity coefficients). we employed more nuanced manipulations of motivation
As previously mentioned, validity generalization re- and ability to fake to elicit a gradient of faking behavior,
search shows that applicant faking has not destroyed the allowing for a more comprehensive analysis of the effects
predictive potential of personality measures. On the other of faking. To better approximate typical faking behavior,
hand, evidence for validity retained in spite of faking does we manipulated faking motivation using a subtle incentive
not tell us much about the amount of potential validity lost. to fake. We also tested the effects of explicit fake-good in-
This loss is difficult to measure directly due to the tradeoff structions, allowing us to directly compare two methods to
between experimental control and generalizability to op- induce faking in experimental research. This produced three
erational testing, but there is reason to suspect that there is levels of the faking motivation variable: honest instructions,
room for improvement. For example, recent meta-analyses fake-good instructions, and fake-good incentive.
have found substantially higher validity coefficients when In addition to comparing MFC and SS scales, we ma-
other-reports are used instead of self-reports (Connelly & nipulated the fakability of the same MFC measure to elimi-
Ones, 2010; Oh et al., 2011), which may be partially attrib- nate confounding differences between the two measurement
utable to differences in response distortion. formats. This was accomplished using a computer adaptive
Meta-analytic research has also found higher validi- test (CAT) that allowed for varying restrictions on the social
ties for a category of faking-resistant personality measure desirability matching (SDM) of statements that were paired
known as quasi-ipsative multidimensional forced choice to form a single item. Imposing stricter matching rules on
(MFC) scales (Salgado et al., 2014). Whereas single stimu- the CAT algorithm has been shown to reduce fakability by
lus (SS) measures (e.g., Likert scales) have test takers rate increasing the perceived similarity of paired statements
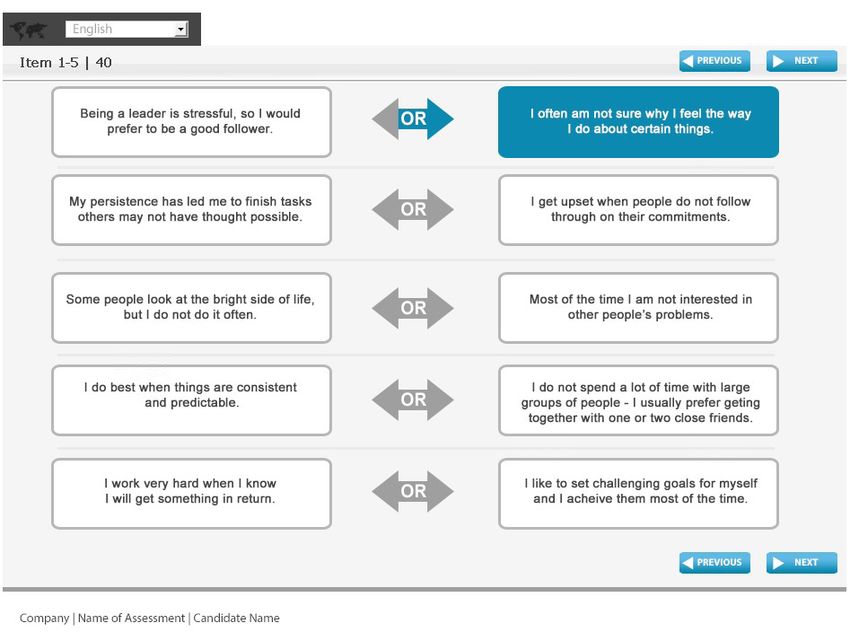
one personality statement at a time, MFC items present (Boyce & Capman, 2017).
choices between two or more statements representing dif- The faking motivation and ability manipulations pro-
ferent personality dimensions (see Figure 1). The statements duced a 3x3 design that allowed us to test several method-
can be paired based on estimates of their social desirability, ological and theoretical hypotheses. In keeping with past
making it difficult for test takers to discern which option research (Boyce & Capman, 2017; Drasgow et al., 2012),
will produce the most desirable personality profile. we hypothesized that:
Although the findings are promising, it is unclear
whether any validity advantage of MFC scales can be Hypothesis 1: MFC scales will show smaller mean dif-
attributed to their faking resistance. A few experimental ferences between honest and faked responses than SS
studies have supported this connection by comparing MFC measures of the same dimensions.
and SS scales while simultaneously manipulating the moti-
vation to fake (Christiansen et al., 2005; Hirsh & Peterson, Hypothesis 2: Using a stricter SDM rule will reduce
2008; Mueller-Hanson et al., 2003). However, comparisons mean differences between honest and faked responses.
of MFC and SS measures cannot control for differences
between the two formats other than faking resistance. In ad- Our next set of hypotheses concerned the relationship be-
dition, all but one of these studies used fake-good instruc- tween faking and validity. Assuming faking reduces validi-
tions, which may exaggerate or otherwise distort the effects ty, factors that mitigate faking are likely to improve validity
of faking—and therefore the effects of reducing faking— when there is motivation to fake. Therefore, we predicted
due to the artificial extremity of directed faking. For ex- that:
ample, Ellingson et al. (1999) found that faked personality
scores showed only modest correlations with honest scores, Hypothesis 3: MFC scales will produce higher cri-
and a correction for socially desirable responding did not terion-related validity than SS measures of the same
significantly improve convergence. However, as the authors dimensions but only when respondents are instructed to
noted, their conclusions about social desirability corrections fake.
could reflect the artificial nature of directed faking. Because
Published By ScholarWorks@BGSU, 2021 2021 • Issue 1 • 20-30
21Research Articles Personnel Assessment and Decisions
Hypothesis 4: Using a stricter SDM rule will produce In order to ensure the internal and external validity
higher criterion-related validity but only when respon- of results, participants were screened using a few criteria.
dents are instructed to fake. First, we limited our participant pool to American MTurk
workers over the age of 18. Second, we required partici-
Finally, our research design allowed for a novel method- pants to have at least 100 approved tasks on MTurk and an
ological comparison between directed and incentivized fak- approval rate of 90% or higher. Third, participants had to
ing. Incentivized faking studies still show faking effects, but be employed for at least 3 months within the past year in a
the effect sizes are more likely to resemble those found in position where they interacted with coworkers at least 1–2
applicant samples (e.g., Mueller-Hanson et al., 2003). Va- days per week. This requirement was intended to ensure
lidity may be reduced but not obliterated, and mean scores participants could complete our self-reported job perfor-
may be moderately rather than severely inflated. Therefore, mance measures (discussed below). All participants were
we proposed that: paid $3 for their voluntary participation, and 10 were ran-
domly selected to receive $10 bonuses.
Hypothesis 5: Directed faking results will replicate us- Participants were included in the final sample if they
ing an incentivized faking manipulation. passed two embedded attention checks, a manipulation
check to ensure they had attended to their faking instruc-
METHOD tions, and a repetitive responding check. Of the 855 partic-
ipants who completed the study, 652 passed these checks.
Participants The final sample was predominantly White (73%), female
Participants were recruited through Amazon Mechani- (57%), and currently employed (96%); see Table 1 for a
cal Turk (MTurk). Research has found that personality data breakdown of participants’ occupations and educational
from MTurk workers has comparable or superior reliability status. Participants ranged from 19 to 70 years of age with
to traditional samples (Buhrmester et al., 2011). MTurk a median age of 33. Participants were randomly assigned to
workers also appear to behave similarly to participants in one of six conditions that crossed two three-level indepen-
traditional laboratory and field experiments (Casler et al., dent variables—measurement format and faking instruc-
2013; Horton et al., 2011). tions. See Table 2 for sample sizes by condition.
FIGURE 1.
Screenshot of Example Items From the MFC Inventory Used in This Study
Note. Copied with permission from Conway et al. (2015).
2021 • Issue 1 • 20-30 http://scholarworks.bgsu.edu/pad/
22Personnel Assessment and Decisions Faking and the Validity of Personality Tests
TABLE 1.
Occupational and Educational Breakdown of the Final Analysis Sample
Occupation/highest degree N
Agricultural, forestry, fishing, and related 13
Clerical and administrative support 99
Production, construction, operating maintenance, and material handling 39
Professional, paraprofessional and technical 275
Sales and related 98
Service 96
Not currently employed/full-time student 27
High school 52
Vocational/technical 13
Some college/university 151
Associate’s degree 74
Bachelor’s degree 254
Master’s degree 91
Doctorate degree 17
TABLE 2.
Summary of the Experimental Conditions
Conditiona Measurement format Faking instructions Nall Nfiltered
1 SS Honest and fake good 141 99
2 MFC–relaxed Honest and fake good 135 104
3 MFC–strict Honest and fake good 126 87
4 SS Incentivized fake good 138 110
5 MFC–relaxed Incentivized fake good 167 132
6 MFC–strict Incentivized fake good 148 120
Note. Nall = sample size before applying the attention check filter; Nfiltered = final sample size after checks for low-effort
responding; SS = single stimulus; MFC–relaxed = multidimensional forced choice with relaxed social desirability
matching constraint; MFC–strict = multidimensional forced choice with strict social desirability matching constraint.
a
Honest and faked responses from Conditions 1–3 are treated as separate conditions for data analysis purposes. Thus, the
results refer to a total of nine conditions.
Materials et al., 2007; DeYoung et al., 2009; Kaufman et al., 2016;
MFC Personality Inventory. Participants assigned to Quilty et al., 2014). The remaining five dimensions of the
MFC conditions completed a proprietary multistage CAT MFC inventory capture work-relevant traits beyond the
developed for personnel selection and development, which five-factor model. See Table 3 for the dimensions and their
measures 15 personality dimensions related to workplace theoretical mappings.
outcomes (Boyce & Capman, 2017). Ten of these dimen- The MFC inventory is scored using Stark’s multi-uni-
sions are based on DeYoung et al.’s (2007) Big Five Aspect dimensional pairwise preference model, an item response
Scales (BFAS), which measure two distinct aspects of each theory (IRT) model for scoring binary MFC items (Stark,
Big Five trait. DeYoung et al. (2007) validated the aspect 2002; Stark et al., 2005). In this study, each MFC adminis-
structure through factor analysis and demonstrated conver- tration included 100 items. Each item consists of two per-
gent validity with established Big Five inventories. In addi- sonality statements selected by the CAT algorithm, resulting
tion, the individual aspects within each Big Five trait have in approximately 13 statements per personality dimension.
demonstrated divergent validity with one another, including In addition to IRT parameters, each statement has an
distinct relationships with other personality traits, mental associated social desirability parameter ranging from 0 to 1
abilities, neurobiological substrates, and job-related out- (established based on a directed faking study). In the strict
comes (Allen et al., 2017; DeYoung et al., 2016; DeYoung SDM conditions, the CAT algorithm was only allowed to
Published By ScholarWorks@BGSU, 2021 2021 • Issue 1 • 20-30
23Research Articles Personnel Assessment and Decisions
pair statements whose social desirability parameters were item counterproductive work behavior checklist (CWB-C;
within .10 of one another. In the relaxed SDM conditions, Spector et al., 2010) as criterion measures. Fox et al. (2012)
the social desirability parameters of paired statements could reported coefficient alphas of .89 and .94 for the OCB-C in
differ by up to .20. two samples; Spector et al. (2010) reported an alpha of .79
SS Personality Scales. Participants in the SS conditions for the CWB-C.
completed Likert-type measures of the 15 constructs as- Self-Reported Academic Performance. Participants
sessed by the MFC inventory. To minimize differences with completed three criterion items assessing academic perfor-
the MFC dimensions, we constructed the SS scales using mance and achievement. First, they reported their highest
items from the MFC CAT’s statement pool. First, we used academic degree completed, which ranged from high school
existing calibration data from a sample of MTurk workers to doctoral degrees. Second, participants reported their GPA
(N = 6,333), as well as previously estimated item location at that degree level on an 11-point scale ranging from A+
parameters, to select 12 items per dimension for pilot test- to E or F (Freeberg et al., 1989). Finally, they reported their
ing. Next, we administered the chosen items using a four- high school GPA using the same scale.
point response format, followed by the MFC inventory, to A meta-analysis by Kuncel et al. (2005) found an aver-
a pilot sample of 269 MTurk workers. Finally, we used the age correlation of .84 between self-reported and school-re-
pilot data to construct reliable six-item scales that had good ported GPA. However, self-reported GPAs were also higher
convergent validity with their MFC counterparts. than actual GPAs on average, and individuals with lower
All 15 scales showed acceptable reliability, with coef- GPAs provided far less valid self-reports. Thus, it appears
ficient alpha reliability estimates ranging from .74 to .90. that self-reported GPA is a valid indicator of academic
In addition, the scales demonstrated convergent and dis- performance but is also susceptible to nontrivial response
criminant validity with their MFC counterparts. Monotrait– distortion.
heteromethod correlations ranged from .42 to .74 with a Emotion Management Task. To address the possibility
mean of .58, whereas the average heterotrait–heteromethod of common method bias arising from self-report criteria,
correlation was only .18. See Table S1 in the supplemental we included an objective performance task as an additional
materials for reliability and convergent validity results by criterion measure. Specifically, we administered the 18-item
dimension. Situational Test of Emotional Management–Brief (STEM-B;
Self-Reported Job Performance. Participants com- Allen et al., 2015), a performance-based emotional intel-
pleted Spector and Fox’s 20-item organizational citizen- ligence scale that requires examinees to identify the most
ship behavior checklist (OCB-C; Fox et al., 2012) and 10- effective response to a variety of emotional situations.
TABLE 3.
Theoretical Mappings of Personality Dimensions From the MFC Inventory
Five-factor model MFC dimension Theoretical mapping
Conceptual BFAS-Intellect
Openness to Experience
Flexibility BFAS-Opennessa
Structure BFAS-Orderliness
Conscientiousness
Drive BFAS-Industriousness
Assertiveness BFAS-Assertiveness
Extraversion
Liveliness BFAS-Enthusiasm
Sensitivity BFAS-Compassion
Agreeableness
Cooperativeness BFAS-Politeness
Composure BFAS-Volatilityb
Emotional Stability
Positivity BFAS-Withdrawalb
Ambition Need for Achievement
Power Need for Power
N/A Humility HEXACO-Humility
Mastery Learning Goal Orientation
Awareness Social Effectiveness / Emotional Intelligence
Note. MFC = multidimensional forced choice; BFAS = Big Five Aspect Scales (DeYoung et al., 2007). a The MFC
Flexibility dimension is narrower in scope than BFAS–Openness, in that it focuses largely on openness to change and
excludes aesthetic interests. b This BFAS scale reflects high neuroticism; the corresponding MFC dimension is scored to
reflect low neuroticism (i.e., emotional stability).
2021 • Issue 1 • 20-30 http://scholarworks.bgsu.edu/pad/
24Personnel Assessment and Decisions Faking and the Validity of Personality Tests
Risky Choice Framing. We administered Tversky and RESULTS
Kahneman’s (1981) Asian disease problem as a final crite-
rion measure. This problem requires participants to choose Motivated Score Elevation
between two programs to combat a disease that threatens to Our first two hypotheses predicted that the degree of
kill 600 people. Preferences for safer or riskier options have score elevation due to directed faking would be inversely
been shown to vary depending on whether the potential out- related to the faking resistance of the measurement format.
comes are presented in positive or negative terms (i.e., lives To test these hypotheses, we first transformed all person-
saved vs. lives lost). ality scores to z-scores (using honest means and SDs) to
Risky choice problems can be scored to assess two dis- create a common metric across measurement formats. Next,
tinct constructs. First, susceptibility to framing is quantified we conducted a mixed-model MANOVA to assess the com-
as a difference score between the negative and positive item bined effects of faking instructions (honest and fake-good)
scores. Second, general risk-taking tendency is assessed by and measurement format (SS, MFC–relaxed, and MFC–
combining the two scores. strict) across all 15 personality traits. The main effect of
Faking Instructions. Participants received one of three instructions was significant, F(1, 273) = 16.92, p < .001,
instruction sets before completing a personality inventory. indicating participants generally increased their scores
The honest instructions, which we borrowed from Muel- when directed to fake. Furthermore, we found a significant
ler-Hanson et al. (2003), asked participants to respond as interaction between instructions and measurement format,
honestly as possible and emphasized their anonymity. The F(2, 548) = 2.73, p < .001, suggesting the degree of score
fake-good instructions asked participants to pretend they elevation varied by format.
were applying for a job and make the best impression pos- To test Hypothesis 1, we conducted follow-up 2x2
sible, responding as an ideal employee would. The incentiv- MANOVAs comparing the SS format to each MFC format.
ized fake-good instructions, adapted from Mueller-Hanson These revealed significant instruction–format interactions
et al. (2003), explained that participants would automatical- for both the SS/MFC–relaxed comparison, F(1, 187) = 4.05,
ly have a chance to receive one of ten $10 bonuses if they p < .001, and the SS/MFC–strict comparison, F(1, 170) =
qualified for a fictitious “second part” of the study, which 4.37, p < .001. We also computed standardized mean dif-
required participants with personality traits that were de- ferences (Glass’s Δ) between honest and faked personality
sired by employers. However, the instructions also warned scores for all three measurement formats (see Tables S2, S3,
that providing false responses could disqualify them from and S4 in the supplemental materials for associated means
the study. and standard deviations). As shown in Table 4, directed
faking produced large gains on the SS personality scales
Procedure (mean Δ = .81). In support of Hypothesis 1, the degree of
As shown in Table 2, participants in Conditions 1–3 faking was much smaller on both MFC formats compared
completed the same personality inventory (SS, MFC– to the SS format, with a mean Δ of .28 for the MFC–relaxed
relaxed, or MFC–strict) under both honest and fake-good inventory and .27 for the MFC–strict inventory.
instructions with the order of instructions counterbalanced. Hypothesis 2 predicted that using a stricter SDM rule
Thus, these conditions represented six levels of the 3x3 ma- would also reduce faking gains. However, the difference be-
nipulation. Conversely, participants in Conditions 4–6 only tween the two MFC formats was minimal, and the format–
completed a personality inventory once with incentivized instructions interaction was nonsignificant in a follow-up
fake-good instructions, and their results were compared to 2x2 MANOVA. Thus, Hypothesis 2 was not supported.
honest results from Conditions 1–3. The purpose of this On the other hand, comparing mean effect sizes across
between-person comparison was to avoid anchoring effects. dimensions may not fully capture the behavior of directed
Unlike directed fakers, incentivized fakers were instructed fakers. At the item level, SS scales allow respondents to
to provide honest responses. Asking them to respond hon- fake on one dimension without affecting their scores on
estly once and then immediately asking them to respond other dimensions. By contrast, each MFC item requires
honestly a second time with an incentive to distort (or vice examinees to choose between two personality dimensions.
versa) would likely elicit suspicion and reluctance to devi- As a result, fakers may focus their self-presentation on the
ate from their initial responses. dimensions they perceive to be more work relevant (e.g.,
All participants began by reading the consent form and drive) at the expense of others. A stricter SDM rule could
indicating their informed consent. They then completed have a similar effect by reducing the salience of an alternate
screening and optional demographic questions, followed by cue—that is, social desirability—for determining the “ideal”
the criterion measures. Finally, they completed one of three response.
personality inventories under their assigned faking instruc- To investigate this possibility, we calculated the stan-
tions. The purpose of administering the criterion measures dard deviation of Δ values across dimensions for each mea-
before the predictors was to ensure that criterion responses surement format (see Table 4); a higher standard deviation
were not contaminated by subsequent faking instructions. indicates greater variation in faking across dimensions.
Published By ScholarWorks@BGSU, 2021 2021 • Issue 1 • 20-30
25Research Articles Personnel Assessment and Decisions
Both MFC formats—especially the MFC–strict format— Thus, the results failed to support Hypothesis 3, which
had higher standard deviations than the SS format. This predicted that MFC scales would perform better than their
suggests that the MFC format, and perhaps stricter SDM, SS counterparts when participants were directed to fake.
promoted a selective faking strategy. An alternate version of Hypothesis 3 might predict that the
Hypothesis 5 predicted that directed faking results relative advantage of SS scales would diminish when par-
would replicate using an incentivized faking manipulation. ticipants faked, thereby accounting for the possibility that
As shown in Table 4, incentivized faking produced small the SS scales could be more valid to begin with but lose
changes on the SS scales (mean Δ = .13) and even smaller some of that advantage due to faking. However, even this
changes on the MFC–relaxed (.08) and MFC–strict (.04) qualified Hypothesis 3 was not supported.
scales. A two-way MANOVA revealed a significant main Hypothesis 4 predicted that MFC–strict scales would be
effect of faking instructions, F(1, 632) = 2.17, p = .006. more valid than MFC–relaxed scales but only under faking
However, neither the main effect of measurement format instructions. On average, MFC–strict validity coefficients
nor the format–instructions interaction reached statistical were .05 higher than MFC–relaxed ones when participants
significance. As such, the score elevation results did not faked, but the difference was not statistically significant.
support Hypothesis 5. More broadly, the average faking Therefore, Hypothesis 4 was not supported.
effect sizes suggested that the monetary incentive was only Once again, Hypothesis 5 predicted that directed faking
modestly successful at inducing faking. Without a strong results would replicate using an incentivized faking manip-
incentive to fake in the first place, the relative advantage of ulation. Because the directed faking manipulation did not
the faking-resistant MFC format was greatly diminished. produce the expected outcomes (or other significant results
to replicate), we did not formally evaluate Hypothesis 5
Criterion-Related Validity with respect to the validity results. Regardless, it is worth
Due to the combination of predictors, criteria, and noting that the SS scales produced the highest validity co-
experimental conditions, it was necessary to summarize a efficients among incentivized fakers, although the SS–MFC
total of 1,080 validity coefficients to test Hypotheses 3 and differences in the incentivized group did not reach statisti-
4. One option would be to simply calculate a mean valid- cal significance.
ity coefficient for each experimental condition. However,
this incorrectly assumes that the true correlations between DISCUSSION
all predictors and criteria are positive. In fact, a negative
predictor–criterion correlation can be equally useful for se- Motivated Score Elevation
lection if it represents the true direction of the relationship. Our directed faking results showed substantial differ-
Therefore, we developed a universal set of keys to indicate ences between measurement formats in both the magnitude
the appropriate signs for all 120 predictor–criterion rela- and pattern of faking. As expected, fakers were far less
tionships. successful at raising their scores on the MFC scales. In
To do so, we first calculated an unweighted mean of addition, it appears that fakers selectively distorted on spe-
validity coefficients for every predictor–criterion pair across cific traits to a greater extent when responding to an MFC
all conditions. To minimize the effects of sampling error on inventory. A closer examination of the distortion patterns
keying decisions, we discarded any pair whose mean valid- suggests they favored traits with higher face validity for
ity coefficient was less than .10 in absolute value. For each employee selection, including drive, cooperativeness, com-
of the remaining 23 predictor–criterion pairs, we counted posure, ambition, and mastery.
the sign of the grand mean validity coefficient as the true Furthermore, except for openness, selective faking pro-
direction of the relationship and penalized conditions that duced notable discrepancies between aspects of the same
produced a relationship in the opposite direction. Validity Big Five traits. Although the SS scales showed strong dis-
coefficients for these 23 pairs are summarized in Table S5, tortion on both aspects of conscientiousness, MFC fakers
and validity coefficients for all 120 predictor–criterion pairs focused primarily on drive and had only modest score ele-
are available in Tables S6-S14. vation on structure. Extraversion showed a similar pattern,
Mean validity coefficients by condition are presented in with fakers elevating their scores by nearly half a standard
Table 5. Under honest instructions, all three measurement deviation on MFC–Liveliness but barely at all on MFC–
formats had a mean validity of .15. Thus, as predicted in Assertiveness. Fakers consistently elevated their scores
Hypotheses 3 and 4, no format was more valid than the oth- on both aspects of emotional stability. However, whereas
ers in the absence of faking. Contrary to our expectations, faking produced almost identical (very large) increases on
however, the SS scales had the highest overall validity both SS scales, participants faked more on composure than
under fake-good instructions (although z-tests contrasting positivity in the MFC conditions. The difference between
the overall SS and MFC–strict/MFC–relaxed validity coef- aspects was the most pronounced for agreeableness: Par-
ficients did not reach significance). This pattern held for ev- ticipants raised their MFC–Cooperativeness scores by an
ery breakout category of criterion, including academic per- average of .67 standard deviations, whereas faked MFC–
formance/achievement, job performance, and the STEM-B. Sensitivity scores were .20 standard deviations lower than
2021 • Issue 1 • 20-30 http://scholarworks.bgsu.edu/pad/
26Personnel Assessment and Decisions Faking and the Validity of Personality Tests
TABLE 4.
Standardized Mean Differences Between Faked/Incentivized and Honest Predictor Scores
Directed Faking vs. honest Incentivized vs. honest
MFC– MFC– MFC– MFC–
Big Five trait Dimension SS SS
relaxed strict relaxed strict
Conceptual 0.61*** 0.19 0.12 0.16 -0.05 0.11
Openness to experience
Flexibility 0.80*** 0.18 0.20 0.15 0.15 0.17
Drive 0.98*** 0.61*** 0.56*** 0.25 0.19 0.06
Conscientiousness
Structure 0.71*** 0.20* 0.20 -0.13 0.04 -0.17
Assertiveness 0.74*** 0.05 -0.02 -0.02 -0.03 -0.19
Extraversion
Liveliness 1.02*** 0.49*** 0.46*** 0.12 0.22 0.03
Cooperativeness 0.97*** 0.59*** 0.76*** 0.28* 0.22 0.27
Agreeableness
Sensitivity 0.52*** -0.19 -0.21 0.34** -0.06 -0.07
Composure 0.99*** 0.48*** 0.42** 0.21 0.14 0.06
Emotional stability
Positivity 1.00*** 0.23* 0.29** 0.23 -0.04 0.05
Ambition 1.00*** 0.60*** 0.69*** 0.25 0.12 0.04
Awareness 0.64*** -0.04 -0.22 -0.07 0.09 -0.12
N/A Humility 0.37*** -0.03 0.04 0.03 -0.24 0.10
Mastery 0.98*** 0.62*** 0.48*** 0.18 0.31* 0.24
Power 0.82*** 0.28** 0.22 0.00 0.11 0.05
Mean 0.81 0.28 0.27 0.13 0.08 0.04
SD 0.21 0.27 0.30 0.13 0.09 0.04
Note. SS = single stimulus; MFC–relaxed = multidimensional forced choice with relaxed social desirability matching constraint;
MFC–strict = multidimensional forced choice with strict social desirability matching constraint. Directed faking comparisons are
within person; incentivized faking comparisons are between person. *p < .05, **p < .01, ***p < .001.
TABLE 5.
Mean Validity by Condition for Empirically Keyed Predictor–Criterion Relationships
Criterion type
General factor All Job
Instructions Predictor format All Educationc STEM-B
variance (%)a (semipartial)b Performanced
SS 36 .15 .06 .14 .15 .16
Honest MFC–relaxed 16 .15 .08 .11 .18 .07
MFC–strict 16 .15 .10 .16 .15 .15
SS 48 .19 .09 .05 .27 .02
Incentive MFC–relaxed 20 .12 .08 .18 .10 .09
MFC–strict 12 .11 .08 .10 .12 .06
SS 61 .15 .01 .15 .14 .27
Fake MFC–relaxed 19 .09 .05 .13 .07 .10
MFC–strict 22 .14 .07 .13 .13 .20
Predictor–criterion pairs – 23 23 6 15 2
Note. SS = single stimulus; MFC–relaxed = multidimensional forced choice with relaxed social desirability matching constraint; MFC–
strict = multidimensional forced choice with strict social desirability matching constraint. STEM-B = Situational Test of Emotional
Management–Brief. a Percentage of variance in the predictor scales attributable to a general factor. b Semipartial correlations controlling
for general factor variance in the predictor scores. c Educational criteria include highest degree achieved, GPA at highest degree level,
and high school GPA. d Job performance criteria include self-reported counterproductive work behaviors and organizational citizenship
behaviors.
honest scores, on average. The subtle faking incentive gen- fects may be obscured by examining the Big Five at the do-
erally elicited the same patterns of differential faking across main level, especially if there are tradeoffs between faking
aspects, albeit far less dramatically than directed faking. on different dimensions. Future faking research may benefit
Taken together, these findings suggest that faking ef- from measuring the Big Five at the aspect or facet level and
Published By ScholarWorks@BGSU, 2021 2021 • Issue 1 • 20-30
27Research Articles Personnel Assessment and Decisions
focusing on specific traits that are attractive to fakers. The Ryan, 1993), which may capture predictively useful implic-
latter suggestion may be especially helpful for producing it theories about how to be a good employee. Although the
clearer results with incentivized faking designs, given the present study was not designed to address this question, we
modest strength of these manipulations compared to direct- did conduct supplemental analyses to explore the possibil-
ed faking. ity. First, we computed an average correlation of only .32
Our results also suggest that practitioners should con- between participants’ honest and faked scores on the same
sider potential tradeoffs between face validity and reducing SS scales, suggesting the faked scores no longer assessed
impression management when designing selection systems. the intended constructs. Next, we used confirmatory factor
When response distortion is a concern, there may be sub- analysis to determine if faking introduced a general method
stantial benefits to selecting on predictively valid traits that factor. As shown in Table 5, faking strengthened an already
are less attractive to fakers. If an MFC inventory is used for substantial general factor in the SS (but not the MFC)
selection, the inclusion of unscored “distractor” scales may scales.
reduce impression management on target dimensions while To determine whether this general factor impacted
also increasing the assessment’s face validity. validity, we calculated new validity coefficients with the
general factor partialled out from the predictor scores (see
Criterion-Related Validity Table 5). Removing general factor variance substantially
Our validation results failed to replicate Salgado et al.’s reduced average validity coefficients for all conditions.
(2014) meta-analytic findings, which suggested quasi-ipsa- This suggests that shared variance between personality di-
tive MFC scales should outperform their SS counterparts. mensions, whether real or artifactual, did contribute to the
As such, it is possible that quasi-ipsative MFC scales do predictive validity of the dimension scores. The SS scales
not provide a robust validity advantage. In keeping with showed the most precipitous decline in validity—especially
this possibility, Lee et al. (2018) compared three sets of in the directed faking condition, where the average validity
personality scores obtained from an MFC measure (using coefficient dropped from .15 to .01. This indicates that (a)
one quasi-ipsative and two ipsative scoring methods) to directed faking decimated the validity of the individual SS
scores from a Likert-type version of the measure. Although dimensions and (b) the SS scales retained their validity in
all four methods showed a similar pattern of correlations the presence of faking by measuring a new construct. In
with criterion measures, the Likert-type measure generally other words, faking eroded the SS scales’ construct validity
produced larger validity coefficients. Although the reason while simultaneously preserving their criterion-related va-
for this difference was unclear, the authors speculated that lidity. This is problematic to the extent that employers are
it could be due to common method bias because the criteri- interested in selecting for specific personality traits, as op-
on measures were also Likert scales. posed to simply achieving predictive validity. On the other
Regardless, it is interesting that even the presence of hand, it is unclear to what extent this phenomenon occurs
extreme response distortion did not cause a large decre- given typical levels of distortion in preemployment testing.
ment in the validity of SS scales or improve the relative
advantage of faking-resistant alternatives. Furthermore, we Future Directions
observed a similar trend across criteria that varied in terms A key feature of this study was that it manipulated both
of potential common method variance with SS scales. On motivation and ability to fake in multiple ways. However,
one end of this spectrum, our self-reported job performance the observed patterns of faking suggested that the faking in-
measures shared a Likert-type response format with the SS centive and SDM manipulations were fairly weak, making
scales, giving the SS scales a potential edge in predicting it difficult to fully parse their effects. This limited our abil-
these criteria. Our measures of GPA and degree attainment ity to make nuanced inferences about the effects of typical
requested objective information rather than self-assess- applicant faking or the merits of directed faking manipula-
ments and did not use a Likert-type response scale, but they tions. Future research could remedy this issue with stronger
were still likely prone to some degree of socially desirable incentives to fake and larger discrepancies between strict
distortion (Kuncel et al., 2005). Finally, the STEM-B re- and relaxed SDM rules.
quired participants to correctly identify the most effective To the extent that quasi-ipsative MFC scales are gen-
responses to specific emotional situations, making it re- erally better predictors of performance, it remains unclear
sistant to impression management (i.e., a test taker cannot why this is the case. The magnitude and causes of their
“fake” knowing the correct response). predictive advantage remain important questions for the
One reasonable explanation for our validity results future of personality testing. Further experimental research
is that faking fundamentally changed what the SS scales using finely tuned faking manipulations, coupled with an
measured, adding a new source of variance that contributed increased focus on underlying constructs, should provide
to the prediction of various external criteria. Past factor valuable insights and could substantially improve the accu-
analytic research has found evidence of a general “ideal racy of high-stakes personality assessment.
employee” factor in applicant samples (e.g., Schmit &
2021 • Issue 1 • 20-30 http://scholarworks.bgsu.edu/pad/
28Personnel Assessment and Decisions Faking and the Validity of Personality Tests
REFERENCES ment, 7(2), 113-123. https://doi.org/10.1037/per0000170
DeYoung, C. G., Quilty, L. C., & Peterson, J. B. (2007). Between
Allen, V., Rahman, N., Weissman, A., MacCann, C., Lewis, C., & facets and domains: 10 aspects of the Big Five. Journal of
Roberts, R. D. (2015). The Situational Test of Emotional Man- Personality and Social Psychology, 93(5), 880-896. https://
agement–Brief (STEM-B): Development and validation us- dx.doi.org/10.1037/0022-3514.93.5.880
ing item response theory and latent class analysis. Person- DeYoung, C. G., Shamosh, N. A., Green, A. E., Braver, T. S., & Gray,
ality and Individual Differences, 81, 195-200. https://dx.doi. J. R. (2009). Intellect as distinct from openness: Differences
org/10.1016/j.paid.2015.01.053 revealed by fMRI of working memory. Journal of Person-
Allen, T. A., Rueter, A. R., Abram, S. V., Brown, J. S., & DeYoung, C. ality and Social Psychology, 97(5), 883-892. https://doi.
G. (2017). Personality and neural correlates of mentalizing org/10.1037/a0016615
ability. European Journal of Personality, 31, 599-613. https:// Drasgow, F., Stark, S., Chernyshenko, O. S., Nye, C. D., Hulin, C. L.,
doi.org/10.1002/per.2133 & White, L. A. (2012). Development of the Tailored Adaptive
Anderson, C. D., Warner, J. L., & Spencer, C. C. (1984). Inflation Personality Assessment System (TAPAS) to support army
bias in self-assessment examinations: Implications for valid personnel selection and classification decisions. U.S. Army
employee selection. Journal of Applied Psychology, 69(4), Research Institute for the Behavioral and Social Sciences.
574-580. https://dx.doi.org/10.1037/0021-9010.69.4.574 Ellingson, J. E., Sackett, P. R., & Hough, L. M. (1999). Social de-
Barrick, M. R., & Mount, M. K. (1991). The Big Five personality di- sirability corrections in personality measurement: Issues
mensions and job performance: A meta-analysis. Personnel of applicant comparison and construct validity. Jour-
Psychology, 44, 1-26. https://dx.doi.org/10.1111/j.1744- nal of Applied Psychology, 84(2), 155-166. https://doi.
6570.1991.tb00688.x org/10.1037/0021-9010.84.2.155
Barrick, M. R., Mount, M., & Judge, T. (2001). The FFM personality Freeberg, N. E., Rock, D. A., & Pollack, J. (1989). Analysis of the Re-
dimensions and job performance: Meta-analysis of me- vised Student Descriptive Questionnaire: Phase II. Predictive
ta-analyses. International Journal of Selection and Assess- validity of academic self-report. College Board Report No.
ment, 9, 9-30. 89-8. College Entrance Examination Board.
Birkeland, S. A., Manson, T. M., Kisamore, J. L., Brannick, M. T., & Fox, S., Spector, P. E., Goh, A., Bruursema, K., & Kessler, S. R. (2012).
Smith, M. A. (2006). A meta-analytic investigation of job ap- The deviant citizen: Measuring potential positive relations
plicant faking on personality measures. International Jour- between counterproductive work behaviour and organiza-
nal of Selection and Assessment, 14(4), 317-335. https:// tional citizenship behaviour. Journal of Occupational and
dx.doi.org/10.1111/j.1468-2389.2006.00354.x Organizational Psychology, 85(1), 199-220. https://dx.doi.
Boyce, A. S., & Capman, J. F. (2017). ADEPT-15® technical docu- org/10.1111/j.2044-8325.2011.02032.x
mentation (2nd Ed.). Aon Hewitt Consulting. Hirsh, J. B., & Peterson, J. B. (2008). Predicting creativity and aca-
Buhrmester, M., Kwang, T., & Gosling, S. D. (2011). Amazon’s Me- demic success with a “fake-proof” measure of the Big Five.
chanical Turk: A new source of inexpensive, yet high-quality, Journal of Research in Personality, 42(5), 1323-1333. https://
data? Perspectives on Psychological Science, 6, 3-5. https:// dx.doi.org/10.1016/j.jrp.2008.04.006
dx.doi.org/10.1177/1745691610393980 Horton, J. J., Rand, D. G., & Zeckhauser, R. J. (2011). The online
Cascio, W. F. (1975). Accuracy of verifiable biographical informa- laboratory: Conducting experiments in a real labor mar-
tion blank responses. Journal of Applied Psychology, 60, ket. Experimental Economics, 14, 399-425. https://dx.doi.
767-769. https://dx.doi.org/10.1037/0021-9010.60.6.767 org/10.1007/s10683-011-9273-9
Casler, K., Bickel, L., & Hackett, E. (2013). Separate but equal? A Kaufman, S. B., Quilty, L. C., Grazioplene, R. G., Hirsh, J. B., Gray,
comparison of participants and data gathered via Amazon’s J. R., Peterson, J. B., & DeYoung, C. G. (2016). Openness
MTurk, social media, and face-to-face behavioral testing. to experience and intellect differentially predict creative
Computers in Human Behavior, 29, 2156-2160. https://dx. achievement in the arts and sciences. Journal of Personality,
doi.org/10.1016/j.chb.2013.05.009 84(2), 247-258. https://doi.org/ 10.1111/jopy.12156
Christiansen, N. D., Burns, G. N., & Montgomery, G. E. (2005). Kuncel, N. R., Credé, M., & Thomas, L. L. (2005). The validity of
Reconsidering forced-choice item formats for applicant self-reported grade point averages, class ranks, and test
personality assessment. Human Performance, 18, 267-307. scores: A meta-analysis and review of the literature. Re-
https://dx.doi.org/10.1207/s15327043hup1803_4 view of Educational Research, 75(1), 63-82. https://doi.
Connelly, B. S., & Ones, D. S. (2010). An other perspective on per- org/10.3102/00346543075001063
sonality: Meta-analytic integration of observers’ accuracy Lee, P., Lee, S., & Stark, S. (2018). Examining validity evidence for
and predictive validity. Psychological Bulletin, 136(6), 1092- multidimensional forced choice measures with different
1122. https://dx.doi.org/10.1037/a0021212 scoring approaches. Personality and Individual Differences,
Conway, J., Boyce, A., Caputo, P. & Huber, C. (2015, April). Devel- 123, 229-235. https://dx.doi.org/10.1016/j.paid.2017.11.031
opment of a computer adaptive forced-choice personality Meehl, P. E., & Hathaway, S. R. (1946). The K factor as a suppressor
test. Paper presented at the 30th Annual Conference of the variable in the Minnesota Multiphasic Personality Inventory.
Society for Industrial and Organizational Psychology, Phila- Journal of Applied Psychology, 30(5), 525-564. https://dx.
delphia, PA. doi.org/10.1037/h0053634
DeYoung, C. G., Carey, B. E., Krueger, R. F., & Ross, S. R. (2016). Mueller-Hanson, R., Heggestad, E. D., & Thornton III, G. C. (2003).
Ten aspects of the Big Five in the Personality Inventory for Faking and selection: Considering the use of personal-
DSM–5. Personality Disorders: Theory, Research, and Treat- ity from select-in and select-out perspectives. Journal
Published By ScholarWorks@BGSU, 2021 2021 • Issue 1 • 20-30
29Research Articles Personnel Assessment and Decisions
of Applied Psychology, 88(2), 348-355. https://dx.doi. do it: Deception as an impression management strategy
org/10.1037/0021-9010.88.2.348 in job interviews. Journal of Applied Social Psycholo-
Oh, I., Wang, G., & Mount, M. K. (2011). Validity of observer gy, 36(4), 1070-1086. https://dx.doi.org/10.1111/j.0021-
ratings of the five-factor model of personality traits: A me- 9029.2006.00055.x
ta-analysis. Journal of Applied Psychology, 96(4), 762-773. Zickar, M. J. (2000). Modeling faking on personality tests. In D. R.
https://dx.doi.org/10.1037/a0021832 Ilgen & C. L. Hulin (Eds.), Computational modeling of behav-
Ones, D. S., Viswesvaran, C., & Reiss, A. D. (1996). Role of social ior in organizations: The third scientific discipline (pp. 95-
desirability in personality testing for personnel selection: 113). American Psychological Association. https://dx.doi.
The red herring. Journal of Applied Psychology, 81(6), 660- org/10.1037/10375-005
679. https://dx.doi.org/10.1037/0021-9010.81.6.660
Pannone, R. D. (1984). Predicting test performance: A content
valid approach to screening applicants. Personnel Psy- RECEIVED 10/01/20 ACCEPTED 03/04/21
chology, 37(3), 507-514. https://dx.doi.org/10.1111/j.1744-
6570.1984.tb00526.x
Quilty, L. C., DeYoung, C. G., Oakman, J. M., & Bagby, R. M. (2014).
Extraversion and behavioral activation: Integrating the
components of approach. Journal of Personality Assess-
ment, 96(1), 87-94. https://doi.org/10.1080/00223891.2013.
834440
Rosse, J. G., Stecher, M. D., Miller, J. L., & Levin, R. A. (1998). The
impact of response distortion on preemployment person-
ality testing and hiring decisions. Journal of Applied Psy-
chology, 83(4), 634-644. https://dx.doi.org/10.1037/0021-
9010.83.4.634
Salgado, J. F., Anderson, N., & Tauriz, G. (2014). The validity of
ipsative and quasi-ipsative forced-choice personality inven-
tories for different occupational groups: A comprehensive
meta-analysis. Journal of Occupational and Organiza-
tional Psychology, 4, 797-834. https://dx.doi.org/10.1111/
joop.12098
Schmit, M. J., & Ryan, A. M. (1993). The Big Five in personnel
selection: Factor structure in applicant and nonapplicant
populations. Journal of Applied Psychology, 78(6), 966-974.
https://dx.doi.org/10.1037/0021-9010.78.6.966
Spector, P. E., Bauer, J. A., & Fox, S. (2010). Measurement artifacts
in the assessment of counterproductive work behavior and
organizational citizenship behavior: Do we know what we
think we know? Journal of Applied Psychology, 95(4), 781-
790. https://dx.doi.org/10.1037/a0019477
Stark, S. (2002). A new IRT approach to test construction and
scoring designed to reduce the effects of faking in person-
ality assessment: The Generalized Graded Unfolding Model
for multi-unidimensional paired comparison responses
[Doctoral dissertation]. University of Illinois at Urba-
na-Champaign.
Stark, S., Chernyshenko, O. S., & Drasgow, F. (2005). An IRT
approach to constructing and scoring pairwise prefer-
ence items involving stimuli on different dimensions: The
multi-unidimensional pairwise-preference model. Applied
Psychological Measurement, 29(3), 184-203. https://doi.
org/10.1177/0146621604273988
Tversky, A., & Kahneman, D. (1981). The framing of decisions and
the psychology of choice. Science, 211, 453-458. https://
dx.doi.org/10.1126/science.7455683
Viswesvaran, C., & Ones, D. S. (1999). Meta-analyses of fakability
estimates: Implications for personality measurement. Ed-
ucational and Psychological Measurement, 59(2), 197-210.
https://dx.doi.org/10.1177/00131649921969802
Weiss, B., & Feldman, R. S. (2006). Looking good and lying to
2021 • Issue 1 • 20-30 http://scholarworks.bgsu.edu/pad/
30You can also read