GraphCovidNet: A graph neural network based model for detecting COVID 19 from CT scans and X rays of chest
←
→
Page content transcription
If your browser does not render page correctly, please read the page content below
www.nature.com/scientificreports
OPEN GraphCovidNet: A graph neural
network based model for detecting
COVID‑19 from CT scans and X‑rays
of chest
Pritam Saha 1,7, Debadyuti Mukherjee 2,7, Pawan Kumar Singh 3
, Ali Ahmadian 4,5*
,
Massimiliano Ferrara 6 & Ram Sarkar 2
COVID-19, a viral infection originated from Wuhan, China has spread across the world and it has
currently affected over 115 million people. Although vaccination process has already started, reaching
sufficient availability will take time. Considering the impact of this widespread disease, many research
attempts have been made by the computer scientists to screen the COVID-19 from Chest X-Rays
(CXRs) or Computed Tomography (CT) scans. To this end, we have proposed GraphCovidNet, a Graph
Isomorphic Network (GIN) based model which is used to detect COVID-19 from CT-scans and CXRs of
the affected patients. Our proposed model only accepts input data in the form of graph as we follow
a GIN based architecture. Initially, pre-processing is performed to convert an image data into an
undirected graph to consider only the edges instead of the whole image. Our proposed GraphCovidNet
model is evaluated on four standard datasets: SARS-COV-2 Ct-Scan dataset, COVID-CT dataset,
combination of covid-chestxray-dataset, Chest X-Ray Images (Pneumonia) dataset and CMSC-678-ML-
Project dataset. The model shows an impressive accuracy of 99% for all the datasets and its prediction
capability becomes 100% accurate for the binary classification problem of detecting COVID-19 scans.
Source code of this work can be found at GitHub-link.
Recently, Coronavirus (COVID-19) disease has created an unprecedented situation across the world. Severe
Acute Respiratory Syndrome coronavirus 2 (SARS-CoV-2), a novel virus enveloped with large single stranded
RNA genome1 is the root cause for this d isease2. Although this virus is originated from Wuhan in China, in
December 2019, later America and several other countries of Europe have severely affected in early days of the
year 20203. According to recent statistics, both America and India have more number of confirmed cases than
other affected countries. World Health Organization (WHO)4 announced COVID-19 as a global health emer-
gency on January 30, 2020 considering the adverse effects of this situation.
To diagnose the SARS-CoV-2, it has been observed that both CXRs as well as CT-scans are found to be
beneficial5,6. CXR images are more appreciated by the medical practitioners, since it can be obtained easily from
the radiology departments. According to radiologists, CXR images help to understand the chest pathology
clearly1. However, CT scans provide high sensitivity, for example, 97% of the positive CT scans are confirmed in
a case study in W uhan7. Due to the exponential growth in cases, it is required to develop a automated and fast
paced system which can identify COVID-19 from chest CT-scans or CXR images. Figure 1 shows some samples
of these CT-scan and CXR images.
SARS-CoV-2 generally affects the lungs and turbid formation of cough around lungs can be detected from
CT-scans and CXRs. The usual symptoms of COVID-19 are related to fever, dry cough and tiredness. The severity
of COVID-19 symptoms can range from very mild to critical. Some people may show only a few symptoms, and
sometimes no symptoms can be observed at all. In some cases, symptoms start worsen mere after a week and
1
Department of Electrical Engineering, Jadavpur University, Kolkata 700032, India. 2Department of Computer
Science and Engineering, Jadavpur University, Kolkata 700032, India. 3Department of Information Technology,
Jadavpur University, Kolkata 700106, India. 4Institute of IR 4.0, The National University of Malaysia, Bangi 43600
UKM, Selangor, Malaysia. 5School of Mathematical Sciences, College of Science and Technology, Wenzhou-Kean
University, Wenzhou, China. 6ICRIOS‑The Invernizzi Centre for Research in Innovation, Organization, Strategy
and Entrepreneurship, Department of Management and Technology, Bocconi University, Via Sarfatti, 25,
20136 Milan (MI), Italy. 7These authors contributed equally: Pritam Saha and Debadyuti Mukherjee. *email:
ahmadian.hosseini@gmail.com
Scientific Reports | (2021) 11:8304 | https://doi.org/10.1038/s41598-021-87523-1 1
Vol.:(0123456789)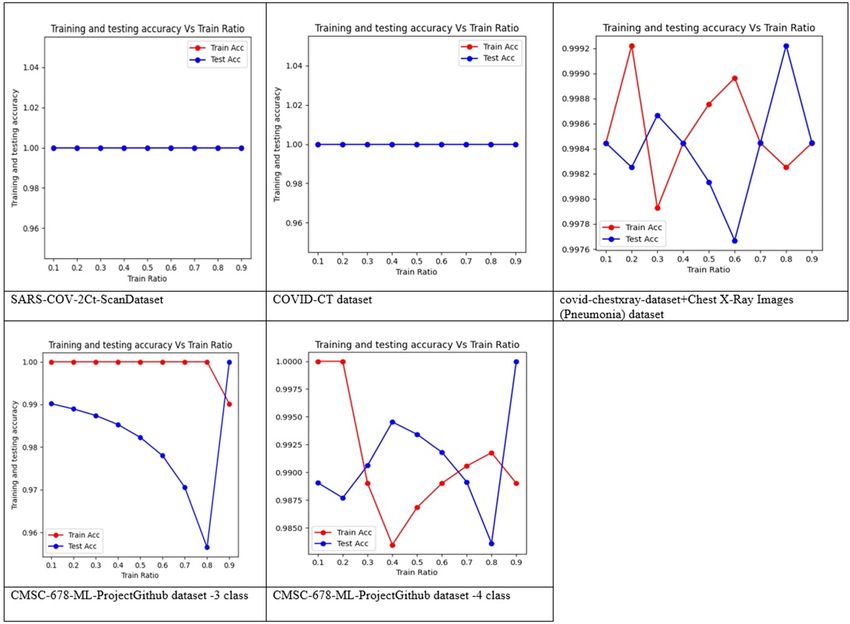
www.nature.com/scientificreports/
Figure 1. Sample CT scans and CXRs of some patients (source: (i) CT-scan—SARS-COV-2 Ct-Scan D
ataset8,
(ii) CXR—CMSC-678-ML-Project9).
frequent shortness of breath and Pneumonia may happen. Elders and people with chronic medical conditions
may possess a higher risk of serious illness from COVID-19. Now in case of mild COVID-19, CT-scans and
CXR images may be inefficient as the cough clouds may not be prominent. Another failed case for CT-scan and
CXR diagnosis may be any other kind of Pneumonia because of the presence of turbid lungs. So, an advanced
classification model is needed to classify these CT-scans and CXR properly.
Due to this pandemic, a lot of people have been affected around the world and rapid tests are required
with proper treatment and quarantine. Though Real Time Reverse Transcription Polymerase Chain Reaction
(RT-PCR) test is the most common way to detect the virus, but the time required to get the results is around
1–2 days10. So, an automatic and accurate classification method, where CT-scans or CXRs are used, can be consid-
ered as an alternative approach in order to deal with this pandemic whose turn around time is significantly less.
Although spread of COVID-19 has started recently, many research works have already been performed by
the researchers during this short time span. Since the current problem consists of classifying COVID-19 images,
various machine learning as well as deep learning methods have been proposed. In this section, a few works
have been mentioned in brief.
Soares et al.8 have used an explainable deep learning model called xDNN on the SARS-CoV-2 CT-scan
dataset8 and have achieved 97.31% accuracy in the binary classification of scans between COVID and Non-
COVID. Yang et al.11 have introduced the COVID-CT dataset in their work. Since the total number of images
are approximately 700 in the original dataset, they have used segmentation masks for lungs and lesion region
to gain additional information from the original images. In their work, Contrastive Self-Supervised Learning
(CSSL), an unsupervised learning approach12 has been implemented to fine-tune the ImageNet pretrained models
DenseNet-16913 and ResNet-5014. Overall, they have achieved best accuracy as 89.1%. Pedro et al.15 have utilized
the EfficientNet16 model along with transfer learning citetranferlearning and have achieved accuracies 87.60%
and 98.99% for COVID-CT dataset11 and SARS-CoV-2 CT-scan dataset8 respectively. Sharma et al.17 have applied
ResNet14 on the database consisting of datasets: (i) GitHub COVID-CT d ataset11, (ii) COVID dataset provided
18
by Italian Society of Medical and Interventional R adiology , (iii) dataset provided by hospitals of Moscow,
Russia19, (iv) dataset provided by SAL Hospital, Ahmedabad, India20 and have obtained almost 91% accuracy.
Elaziz et al.21 have used a modified version of Manta-Ray Foraging Optimization (MRFO) for feature selection
and later have used K-Nearest neighbor (KNN)22 for classification. They have considered two COVID datasets:
(i) combined database of: covid-chestxray-dataset23 and ChestX-Ray Images (Pneumonia) dataset24, (ii) dataset
provided by Chowdhury et al.25. They have achieved 96.09% and 98.09% accuracies on those two datasets respec-
tively. Turkoglu et al.26 have proposed an COVIDetectioNet model where they have used transfer learning on
a pre-trained Convolutional Neural Network (CNN)27 called AlexNet. They have used Relief feature selection
algorithm from all the layers of the architecture, and for the classification they have used Support Vector Machine
(SVM)28. They have conducted their experiments on the combined dataset of: (i) dataset provided by Chowdhury
et al.25, (ii) Chest X-RayImages (Pneumonia) dataset24 and (iii) COVID-19 Radiography Database29. Their pro-
posed model has predicted 99.18%. accurate results on the combined dataset. Oh et al.30 have performed semantic
segmentation by using an extended fully convolutional (FC)-DenseNet10313 and later have used ResNet-1814 on
the combined database of: (i) JSRT dataset31, (ii) SCR dataset32, (iii) NLM(MC) dataset33, (iv) covid-chestxray-
dataset23, (v) CoronaHack d ataset34. In their work, 88.9% accurate results have been achieved.
Scientific Reports | (2021) 11:8304 | https://doi.org/10.1038/s41598-021-87523-1 2
Vol:.(1234567890)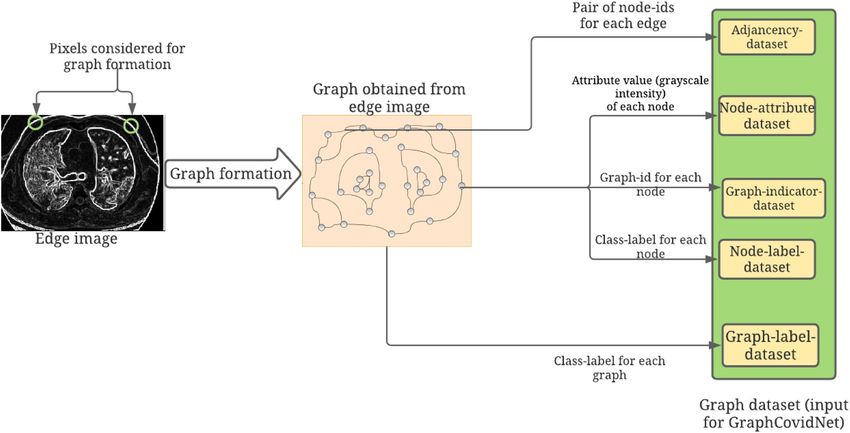
www.nature.com/scientificreports/
Nour et al.3 have proposed a five-layer CNN model on the COVID-19 radiology d atabase25. This dataset is
composed of different benchmark d atasets18,23,35. After extracting features from the proposed CNN model, basic
machine learning algorithms KNN22, SVM28 and Decision Tree (DT)36 are applied on the extracted features.
State-of-the-art result is achieved using SVM with accuracy 98.97%. Chandra et al.37 have used majority vot-
ing based ensemble of five classifiers—SVM28, KNN22, DT36, Artificial Neural Network (ANN)38, Naive Bayes
(NB)39 on the database consisting of three publicly available CXR image datasets: covid-chestxray dataset23,
Montgomery dataset40, and NIH ChestX-ray14 dataset41. Among the total 8196 features extracted from all the
pre-processed images, 8 are First Order Statistical Features (FOSF)42, 88 are Grey Level Co-occurrence Matrix
(GLCM)43 based features and the rest 8100 are Histogram of Oriented Gradients (HOG)44 features. The proposed
classifier ensemble has predicted with 98.06% and 93.41% accuracy for 2 class (normal and abnormal) and 3 class
(i.e., normal, COVID-19 and Pneumonia) classification problems respectively.Hemdam et al.45 have used seven
benchmark image classifier models: VGG1946, DenseNet20147, InceptionV348, ResNetV214, Inception-ResNet-
V249, Xception50, MobileNetV251 on the dataset combined from covid-chestxray-dataset23 and dataset provided
by Dr. R osebrock52. VGG19 and DenseNet201 have provided results with best accuracy as 90%.
Makris et al.53 have used various existing CNN models along with transfer learning on the CXR images
collected from sources: covid-chestxray dataset23 and Chest X-Ray Images dataset by Mooney et al.24. Among
all the used models, VGG16 and VGG1946 have provided the best accuracy as 95%. Zhong et al.54 have used a
CNN model based on V GG1646 architecture on the database consisted of- covid-chestxray-dataset23, ChestX-
RayImages (Pneumonia) dataset24, Figure 1 COVID-19 Chest X-ray Dataset Initiative dataset55 and ActualMed
COVID-19 Chest X-ray Dataset Initiative d ataset56. Finally, they have obtained 87.3 % accurate results on their
6
work. Sun et al. have proposed an Adaptive Feature Selection guided Deep Forest (AFS-DF) algorithm and have
achieved 91.79% accurate results on the CT scan database collected from the Third Hospital of Jilin University,
Ruijin Hospital of Shanghai Jiao Tong University, Tongji Hospital of Huazhong University of Science and Technol-
ogy, Shanghai Public Health Clinical Center of Fudan University, Hangzhou First People’s Hospital of Zhejiang
University, and Sichuan University West China Hospital.
Chattopadhyay et al.57 have contributed in two-ways in their work in this domain. After extracting deep
features from the original image dataset, they have applied a completely novel meta-heuristic feature selection
approach named Clustering-based Golden Ratio Optimizer (CGRO). They have conducted the necessary experi-
ments on the SARS-COV-2 Ct-Scan D ataset8, COVID-CT d ataset11 and Chest X-Ray d
ataset24 and have achieved
the state-of-the-art accuracies of 99.31%, 98.65%, 99.44% respectively.
Sen et al.58 have proposed a CNN architecture and bi-stage Feature Selection (FS) approach to extract the
most relevant features from the chest CT-scan images. Initially, they have applied a guided FS methodology by
employing two filter procedures: (i) Mutual Information (MI), (ii)Relief-F. In the second stage, Dragonfly algo-
rithm (DA) has been used for the further selection of the most relevant features. Finally, SVM has been applied
to the overall feature set. The proposed model has been tested on two open-access datasets: SARS-CoV-28 CT
images and COVID-CT11 datasets and has got 98.39% and 90.0% accuracies on the said datasets respectively.
Besides classification of CT-scans and CXRs, there are other research fields related to COVID-19. One such
field is mask detection. Loey et al.59 have used first R esNet5014 and then an ensemble of DT and SVM for the final
classification. They have achieved best results for the SVM classifier with 99.64%, 99.49% and 100% accuracies for
the three datasets: e Real-World Masked Face Dataset (RMFD)60, the Simulated Masked Face Dataset (SMFD)61,
and the Labeled Faces in the Wild (LFW)62 respectively.
From the above mentioned works, it is clear that in most of the cases pre-existing or novel CNN27 models are
used as a classifier since this is basically an image classification problem. However, CNN has some limitations,
for example, it can be overfitted when there is some class imbalance in the dataset63. On the other hand, Graph
Neural Network (GNN)64 based models can overcome the problems like: overfitting and class imbalance. From
the experimental results found in other fields, it is evident that a GNN based model generally works fast65. GNN,
a relatively new approach in the field of deep learning domain, is applied for graph classification problems. So,
GNN requires input data represented in the form of graph data structure. Whereas, any 2D-CNN model directly
accepts a 2D image matrix as input. Therefore, we need a proper technique for mapping an image classification
problem to a graph classification one. We have resolved this issue with the help of an appropriate pre-processing
technique to convert an image into a graph data. Considering all the advantages and novelties of GNN approach,
we have implemented our proposed GraphCovidNet, a Graph Isomorphism Network (GIN)66 based model (a
special category of GNN) called GraphCovidNet.
The experimental results show that our proposed model performs very well with respect to time-requirement
by the model. Our architecture has also performed well for highly class imbalanced dataset due to the injective
nature of the aggregation function. The architecture is able to map different graphs into different representations
in the embedding space properly. Hence, the proposed model is able to identify the class with a lesser image
count perfectly. We have used four publicly available datasets: (i) SARS-COV-2 Ct-Scan D ataset8, (ii) COVID-
11 9
CT dataset , (iii) 3-class and 4-class datasets under CMSC-678-ML-Project , (iv) combination of two datasets:
(1) covid-chestxray-dataset available on GitHub23, (2) Chest X-Ray Images (Pneumonia) dataset available on
Kaggle24. The main contributions of our work can be summarized as follows:
• In our work, we have introduced a new classification model, called GraphCovidNet, for screening COVID-
19 CT-scan and CXR images.
• In the proposed model, we have used GIN as its backbone architecture which falls under a specialized cat-
egory of GNN. Based on authors’ knowledge, any GNN based architecture has not been used previously in
this domain.
Scientific Reports | (2021) 11:8304 | https://doi.org/10.1038/s41598-021-87523-1 3
Vol.:(0123456789)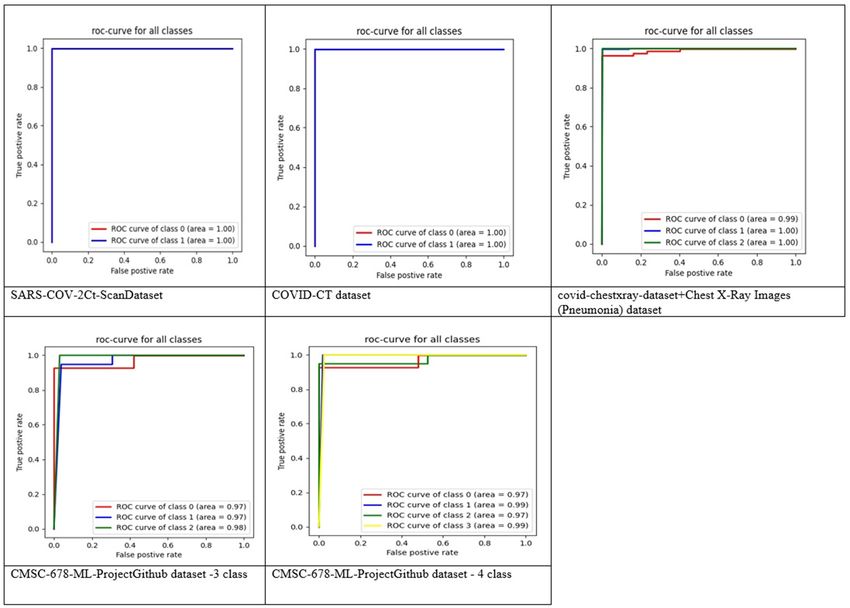
www.nature.com/scientificreports/
Figure 2. Generic framework of our proposed GraphCovidNet model for COVID-19 detection from CT-scan
or CXR images (Sample CT-scan image source: CT-scan—SARS-COV-2 Ct-Scan D ataset8).
Dataset Category Accuracy (%) Precision (%) Recall (%) F1 Score (%) Training time (s) Testing time (s)
SARS-COV-2 Ct-Scan Dataset – 100 100 100 100 342.586 2.328
COVID-CT dataset – 100 100 100 100 146.365 1.151
covid-chestxray-dataset + Chest X-Ray Images (Pneumonia)
– 99.84 99.84 99.84 99.84 1071.296 7.138
dataset
3-class 99.11 99.11 99.11 99.11 66.923 0.6
CMSC-678-ML-Project GitHub
4-class 99 99 99 99 73.697 0.612
Table 1. Detailed results of the proposed GraphCovidNet model for all the four datasets in terms of some
standard evaluation metrics.
• We have mapped image classification problem into a graph classification problem with proper pre-processing
technique.
• We have also reduced the space complexity of our model by considering only the edges of an image instead
of the whole image which, in turn, makes our approach computationally inexpensive.
• Our approach is not limited to a particular type of input as we have considered both CT-scan and CXR images
and we have also worked binary to multi-class classification problem.
• Our model has also surpassed the existing state-of-the-art approaches.
Our proposed method is diagrammatically represented in Fig. 2.
Our entire work has several sections that include: (1) Introduction, (2) Results and discussion, (3) Methodol-
ogy, (4) Conclusion, (5) Data availability and finally, (6) Code availability.
Results and discussion
In our experiments, we have used 5-fold cross-validation for evaluating the model. During each fold, the train-
ing is done for 10 epochs. We have used Adam optimizer and stochastic gradient descent (SGD) approach with
a learning rate of 0.001 to train our model.
Here we have used five standard evaluation metrics such as Accuracy, Precision, Recall, F1 Score and Receiver
Operating Characteristic (ROC) curve to assess our model performance. Table 1 shows the performance results as
well as the average time taken for both training and testing in each fold given by our proposed GraphCovidNet
model for all the four datasets.
From Table 1, it is clear that the GraphCovidNet model has achieved at least 99% accuracy for all the
datasets, whereas it gives 100% accuracy for the 2-class datasets. Generally, with increase in number of classes,
our proposed model’s prediction capability drops from 100 to 99%. One notable point is that our proposed
model provides nearly perfect (99.84%) accuracy for the heavily class imbalanced combined database of- covid-
chestxray-dataset, Chest X-Ray Images (Pneumonia) dataset. Intuitively it can be said that a powerful GNN maps
two nodes to the same location only if they have identical sub-trees with identical features on the corresponding
nodes. Sub-tree structures are defined recursively via node neighborhoods. Thus, we can reduce our analysis to
the question whether a GNN maps two neighborhoods (i.e., two multi-sets) to the same embedding or repre-
sentation. A maximally powerful GNN would never map two different neighborhoods, i.e., multi-sets of feature
vectors to the same representation. This means its aggregation scheme must be injective. Thus, it can be said that
a powerful GNN’s aggregation scheme is able to represent injective multi-set functions.
Theorem Let A : G → Rd be a GNN. With a sufficient number of GNN layers, A maps any graphs, say, G1 and
G2 such that the Weisfeiler–Lehman test of isomorphism decides as non-isomorphic, to different embeddings if the
following conditions hold:
Scientific Reports | (2021) 11:8304 | https://doi.org/10.1038/s41598-021-87523-1 4
Vol:.(1234567890)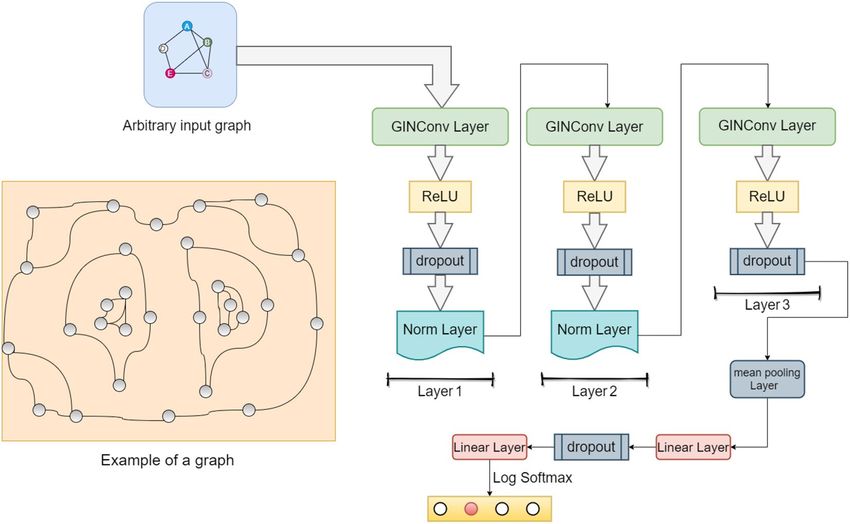
www.nature.com/scientificreports/
Figure 3. Graphical representation of training loss and training accuracy vs epoch for each of the chosen
datasets.
• A aggregates and updates node features iteratively with h(k) v = φ(hv
(k−1) (k−1)
, f (hu : u ∈ N(v)), where the
function,f, which operates on multi-sets, and φ are injective.
• A′ s graph-level readout, which operates on the multi-set of node features, is injective.
The mathematical proof of the above theorem is already reported i n66. The GIN follows this theorem. As this
network is able to map any two different graphs into different embeddings, which helps to solve the challenging
graph isomorphism problem. That is, isomorphic graphs are required to be mapped to the same representation,
whereas the non-isomorphic ones to different representations. Due to these reasons, the proposed model even
works well on heavily class imbalanced datasets. Based on the data from Table 1, it is also notable that our pro-
posed model takes considerably less time both in training (1–18 min) and testing (0.6–7 s) phases. Less number
of epochs is also responsible for such low training time. But again, training loss becomes very less from the very
beginning. So, there is no need to consider a large number of epochs for training purpose. We can visualize this
low training loss from Fig. 3.
In Fig. 3, it is evident that at the first epoch, accuracy is at least 99%, whereas the loss is barely 0.4 for each
of the datasets. Further, training reduces the loss value to almost 0, whereas the classification accuracy remains
either almost the same or slightly increases with increasing epoch size. Since the change in loss is more prominent
as compared to the change in overall accuracy, however, the accuracy seems constant as seen from Fig. 3. Due to
proper pre-processing, the proposed architecture is able to understand the input graphs properly. Thus the loss
becomes very low from beginning and training gets completed in at most 10 epochs. To verify more about the
goodness of our classification model, we have generated Receiver Operating Characteristic (ROC) curves for each
of the datasets which are shown in Fig. 4. Additionally, we have conducted experiments by varying the training to
testing ratio from 10% to 90% with an interval of 10%. To have a better visualization, we have generated graphs
of training and testing accuracies vs training to testing ratio for each of the datasets which are shown in Fig. 5.
So, from Fig. 4, it is evident that for all kind of training to testing ratios, the GraphCovidNet model predicts
at least 95% samples correctly, which is a sign of its robustness. Figure 5 further proves its success as a classifier
because the Area Under the Curve (AUC) for each of the ROC curves is 0.97 units at worst. the AUC for both
2-class datasets is 1 unit and ROC is also perfect. In short, the GraphCovidNet model is able to deal with both
of the 2-class datasets regardless of the training to testing ratio. We have also conducted experiments on different
Scientific Reports | (2021) 11:8304 | https://doi.org/10.1038/s41598-021-87523-1 5
Vol.:(0123456789)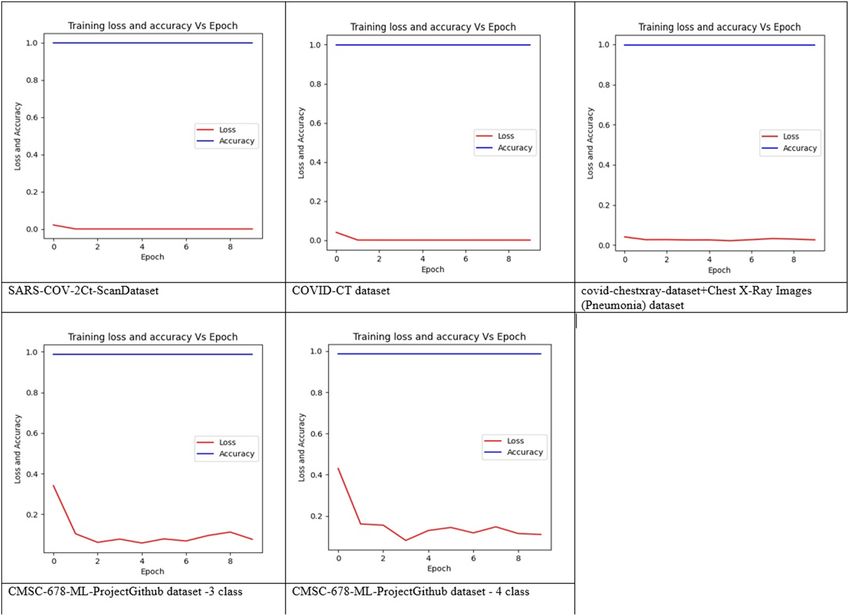
www.nature.com/scientificreports/
Figure 4. ROC curves generated by our proposed GraphCovidNet model for each of the datasets.
datasets having equal number of classes for both training and testing purposes. The results of all such training-
testing combinations are enlisted in Table 2.
Table 2 shows that proposed model ensures accuracy above 98% even when training and testing data are from
two different sources. Such highly accurate results further confirm the validity of GraphCovidNet.
To further ensure the superiority of our proposed model, we have also compared its performance against some
pretrained CNN models such as Inception-ResNet-V249, VGG1946, ResNet15214, DenseNet20147, Xception50,
MobileNetV251 for both raw and edge-mapped images. Table 3 shows the accuracies (%) obtained in all the
experiments considering the mentioned CNN models.
Comparison between Tables 1 and 3 validates that GraphCovidNet outperforms all these conventional CNN
models which gives a more clear view about the robustness of our proposed model.
We have also compared the results of our proposed GraphCovidNet model with some past works done on
the chosen datasets. Table 4 demonstrates such comparative results.
From Table 4, it is clear that our proposed approach surpasses all the previous works considered here for
comparison in terms of accuracy. Although some of the listed previous works are done on database different
or even larger than ours, the GraphCovidNet model still outperforms the ones on the same dataset. Based on
our knowledge, there are no previous works performed on the CMSC-678-ML-Project GitHub dataset9. Still
there are very few works previously done on a 4-class database in the domain of COVID-19 classification. So,
we have considered to note down the results of CMSC-678-ML-Project GitHub d ataset9. Not only that, any deep
learning network generally is unable to achieve high accuracy for very less number of input samples such as
CMSC-678-ML-Project GitHub dataset9. But GraphCovidNet is able to predict with 99% and 99.11% accuracy
for its 3-class and 4-class cases respectively as shown in Table 1. So, our proposed model is able to perform very
well even in case of datasets having very small number of samples.
In a nutshell, we can say that our proposed model is very accurate, and robust with respect to other existing
models.
Methodology
In this section, we have discussed our proposed work along with the proper pre-processing required for COVID-
19 image classification. We have also described the benchmark datasets briefly. This section consists of three
subsections: (i) Datasets used, (ii) Pre-processing, and (iii) Proposed model.
Scientific Reports | (2021) 11:8304 | https://doi.org/10.1038/s41598-021-87523-1 6
Vol:.(1234567890)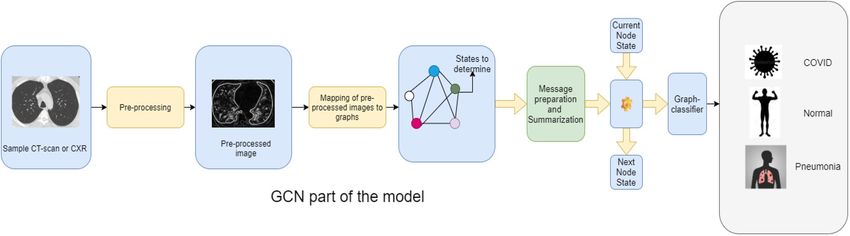
www.nature.com/scientificreports/
Figure 5. Graphical representation of training and testing accuracies vs training ratio for each of the chosen
datasets.
Train data Test data Number of classes Accuracy (%) Precision (%) Recall (%) F1 Score (%)
SARS-COV-2 Ct-Scan Dataset COVID-CT dataset 2 100 100 100 100
COVID-CT dataset SARS-COV-2 Ct-Scan Dataset 2 100 100 100 100
covid-chestxray-dataset + Chest X-Ray
CMSC-678-ML-Project GitHub (3-class) 3 98.78 99.02 97.98 98.54
Images (Pneumonia) dataset
covid-chestxray-dataset + Chest X-Ray
CMSC-678-ML-Project GitHub (3-class) 3 99.32 99.23 99.45 99.30
Images (Pneumonia) dataset
Table 2. Detailed results of the proposed GraphCovidNet model for all combination of different train-test
datasets having same number of classes.
Datasets used. In our work, we have selected the following four datasets to conduct the experiments indi-
vidually-
1. SARS-COV-2 Ct-Scan D ataset8, a 2-class CT scan dataset collected by Plamen et al. available on Kaggle.
2. COVID-CT dataset11, a 2-class CT scan dataset introduced by Yang et al. available on GitHub.
3. 3-class dataset which is consisted of CXR from the two sources-
• covid-chestxray-dataset23 collected by Cohen et al. available on GitHub.
• Chest X-Ray Images (Pneumonia) d ataset24 collected by Mooney et al. available on Kaggle.
For combining these two datasets, we have considered COVID-19 patients’ scans from the covid-
chestxray-dataset and normal, Pneumonia patients’ scans from the Chest X-Ray Images (Pneumonia) dataset.
4. Finally, 3-class and 4-class CXR datasets under the CMSC-678-ML-Project available on G itHub9
Scientific Reports | (2021) 11:8304 | https://doi.org/10.1038/s41598-021-87523-1 7
Vol.:(0123456789)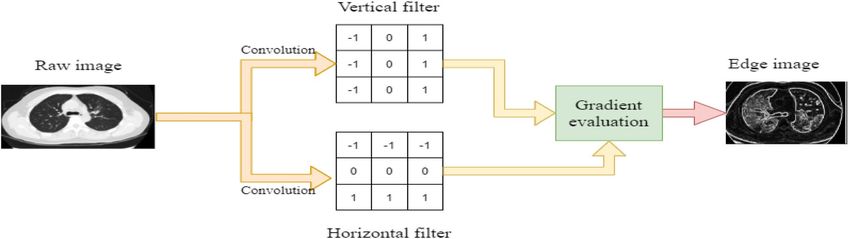
www.nature.com/scientificreports/
covid-chestxray-dataset
SARS-COV-2 Ct-Scan + Chest X-Ray Images CMSC-678-ML-Project CMSC-678-ML-Project
Dataset COVID-CT dataset (Pneumonia) dataset GitHub (3-class) GitHub (4-class)
Edge
Model Raw image Edge image Raw image Edge image Raw image Edge image Raw image Edge image Raw image image
Inception-ResNet-V2 77.85 80.08 74.35 78.95 98.22 98.05 82.61 91.3 77.56 86.45
VGG19 78.27 82.55 79.60 84.27 98.45 96.50 86.96 97.83 79.65 92.2
ResNet152 77.87 84.58 86.65 87.97 98.68 97.82 91.31 91.40 86.13 85.88
DenseNet201 75.86 85.69 89.11 90.21 99.07 97.35 95.65 96.13 88.65 90.44
Xception 83.30 81.79 82.01 87.58 96.74 99.22 82.61 86.96 82.15 83.97
MobileNetV2 77.46 80.48 78.18 76.97 98.76 98.52 93.48 84.74 81.45 82.25
Table 3. Accuracies(%) obtained by applying Inception-ResNet-V2, VGG19, ResNet152, DenseNet201,
Xception, MobileNetV2 models for both raw and edge-mapped images.
Dataset Authors Methodology Accuracy (%) Precision (%) Recall (%) F1-score (%)
Soares et al.8 xDNN 97.38 99.16 95.53 97.31
SARS-COV-2 Ct-Scan EfficientNet with transfer
Pedro et al.15 98.99 99.20 98.80 99
Dataset8 learning
Proposed GraphCovidNet 100 100 100 100
EfficientNet with transfer
Pedro et al.15 87.68 93.98 79.59 86.19
learning
COVID-CT dataset11 Segmentation masks with
Yang et al.11 89.1 – – 89.6
CSSL
Proposed GraphCovidNet 100 100 100 100
53 VGG16 and VGG19 with COVID-96 normal-95 COVID-96 normal-100 COVID-98 normal-98
Makris et al. 95.88
transfer learning Pneumonia-95 Pneumonia-91 Pneumonia-98
Elaziz et al.21 MRFO + KNN 96.09 98.75 98.75 98.75
Zhong et al.54 VGG16 based CNN model 87.3 89.67 84.4 86.96
DenseNet103 for segmen-
Oh et al.30 88.9 83.4 85.9 84.4
tation + ResNet-18
covid-chestxray-
Majority voting of SVM,
dataset23+Chest X-Ray Chandra et al.37 93.41 – – –
KNN, DT, ANN, NB
Images (Pneumonia)
dataset24 CNN for feature extraction
Nour et al.3 98.97 – 89.39 96.72 (F-score)
+ SVM
45
Hemdam et al. VGG19 or DenseNet201 90 COVID-83 Normal-100 COVID-100 Normal-80 COVID-91 Normal-89
AlexNet+ Relief feature
Turkoglu et al.26 selection algorithm and 99.18 99.48 99.13 99.30
SVM
Proposed GraphCovidNet 99.84 99.84 99.84 99.84
Table 4. Comparison of our proposed GraphCovidNet model with some previous works on all the datasets
(Oh et al.30, Chandra et al.37, Nour et al.3, Hemdam et al.45, Turkoglu et al.26 have combined other dataset; Oh
et al.30, Chandra et al.37, Hemdam et al.45 have considered the first dataset only; Nour et al.3, Turkoglu et al.26
have considered the second dataset only).
In this section, at first we look at the datasets used in the present work than training constraints alongside the
detailed results of the experiments.
Basically, all the 2-class datasets contain classes of COVID and Non-COVID whereas the 3-class datasets
contain: Normal, COVID, and Pneumonia. For the 4-class dataset of CMSC-678-ML Project, there are two
separate classes of Pneumonia, which are: Bacterial Pneumonia and Viral Pneumonia. Table 5 illustrates the
details of these datasets.
Pre‑processing. As mentioned earlier, the CT scans or CXRs are first pre-processed in order to apply our
proposed GraphCovidNet model. We have considered two stages for pre-processing, which are illustrated as
follows:
lter67.
1. Edge detection: First, the edges of the raw images are estimated using Prewitt fi
2. Graph preparation: Next, these edge maps are converted into graph dataset by proper means.
Now these two stages are explained to have a better understanding of the whole pre-processing part.
Scientific Reports | (2021) 11:8304 | https://doi.org/10.1038/s41598-021-87523-1 8
Vol:.(1234567890)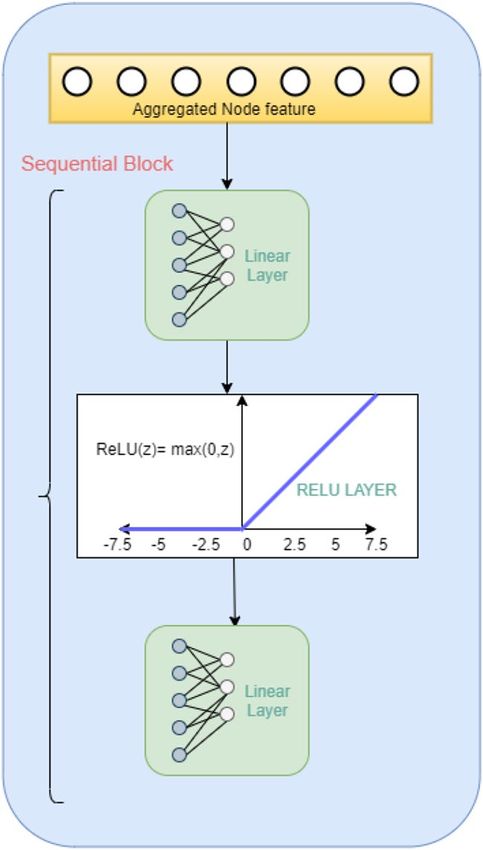
www.nature.com/scientificreports/
Total number of images
Dataset Number of classes Scan-type Normal COVID-19 Pneumonia
SARS-COV-2 Ct-Scan Dataset8 2 CT 1229 1252 –
COVID-CT dataset11 2 CT 407 349 –
covid-chestxray-dataset23+Chest X-Ray Images
3 CXR 1592 504 4343
(Pneumonia) dataset24
3 CXR 79 69 79
CMSC-678-ML-Project GitHub dataset9
4 CXR 79 69 Bacterial: 79, Viral: 79
Table 5. Statistical description of all the datasets used for experimentation.
Figure 6. Comparison between original COVID-CT image and edge image after applying—Prewitt, Canny and
Sobel filters respectively (raw image source: COVID-CT dataset11).
Edge detection. Basically, an edge is a region denoting a local change of intensity in an image which means that
a local maxima or minima will occur for the change of intensity in the edge region. By applying proper filter on
the original image, the edges can be prominent. In our work, we have convoluted the original
image matrix
with
−1 − 1 − 1
3*3 Prewitt filter67 for both horizontal and vertical edge detection which are defined as: 0 0 0 and
1 1 1
−1 0 1
−1 0 1 respectively. We have selected Prewitt operator for this experiment because it is easy to implement
−1 0 1
and it detects the edges quite efficiently68. Comparison among the three most popular edge filters: Canny, Sobel
and Prewitt applied on a COVID-CT image is shown in Fig. 6. Figure 6 reveals that Sobel filter is the most noisy
one, whereas Canny filter produces the least noisy image. Although image produced by Prewitt filter is more
noisy than Canny, all edges have different pixel intensity in the case of Prewitt unlike Canny. So choosing pixel
value as feature would be wiser for Prewitt filter.
After applying convolution on each 3 × 3 sub-matrix by both of the horizontal and vertical filters, gradient for
each sub-matrix has been evaluated. Since all the images are in grayscale, we have considered that a pixel would
be situated in an edge if the magnitude of the gradient crosses halfway i.e., the gradient value is greater than or
equal to 128. We can get a more clear view of the edge-detection step from Fig. 7.
Graph preparation. After the Prewitt filter67 is applied on an image, each image is converted to graph. The
graph preparation is done using a 3-step procedure which is discussed below:
1. Each pixel having grayscale intensity value greater than or equal to 128 is qualified as a node or a graph vertex.
This implies that nodes reside only on the prominent edges of the edge image. Feature of a node consists of
the grayscale intensity of the corresponding pixel.
2. Edge exists between the two nodes which represent neighboring pixels in the original image.
3. For each image, one graph is formed. This means that all the nodes as well as the edges constructed from a
single image belongs to the same graph. The node attributes, which are simply grayscale values, are normal-
ized graph-wise. Finally, normalization is done by subtracting the mean of all attributes under a graph from
the original value and then dividing it by the standard deviation.
Since nodes are formed only from edges present in an image instead of the whole image, so less memory is
consumed to prepare such data. Since COVID-19 and any kind of Pneumonia scans contain cloudy region for
coughs, detected edges would be different as well as the nature of the graph. This difference might be useful later
for classification. Overall five kind of datasets are formed to represent the graph data of all the scans, which are-
Scientific Reports | (2021) 11:8304 | https://doi.org/10.1038/s41598-021-87523-1 9
Vol.:(0123456789)www.nature.com/scientificreports/
Figure 7. Diagram representing flow of edge-detection method (raw image source: CT-scan—SARS-COV-2
Ct-Scan Dataset8).
1. Node-attribute-dataset: Here the attribute value (in this case the normalized grayscale value) of each node
is stored.
2. Graph-indicator-dataset: Here the graph-id for each node is stored.
3. Node-label-dataset: Here the class-label for each node is stored. Since this is a graph level classification, each
node under same graph would have same label which is actually the class-label for the corresponding graph.
4. Graph-label-dataset: Here the class-label for each graph is stored.
5. Adjacency-dataset: Here the adjacency sparse matrix for all the graphs is stored.
Figure 8 summarizes the whole edge-preparation process.
Proposed model. We have introduced our novel approach named as GraphCovidNet, where we have
implemented GIN for classification and prediction tasks. So, before we move deeper into the architecture we will
briefly discuss about the graphs, GNN and GIN.
Graph neural network. A graph g can be described by set of components, nodes (V) and edges (E) as g = (V , E),
where V is the set of vertices and E is the set of edges. The GNN can be used to classify an unlabelled node in a
graph, where some nodes in the graph are labeled using a supervised learning technique. Also, it can do graph
classification tasks where each graph has its corresponding labels. Now here, we have formed one graph from
each labelled image and have used supervised learning to classify these graphs.
Embeddings and graph isomorphism network. In GNN, the nodes of a graph are embedded into a d-dimen-
sional embedded space denoted as hv . These nodes are encoded in such a way that the connected nodes or the
nodes which have same neighbors are close to each other in embedded space and vice versa. Every node uses
its own feature vector fv and its neighborhood embedding vector hnev to find out it own embedding vector hv.
GNNs uses the graph structure and node features to learn a representation vector of a node, fv , where each
node contains the feature vectors, fv ∀ v ∈ V and each edge contains the feature vectors, fe , ∀ e ∈ E or the entire
graph, hg , where hg = Readout(hv , ∀v ∈ V ) , where hv is the final embeddings of the node V is set of all nodes
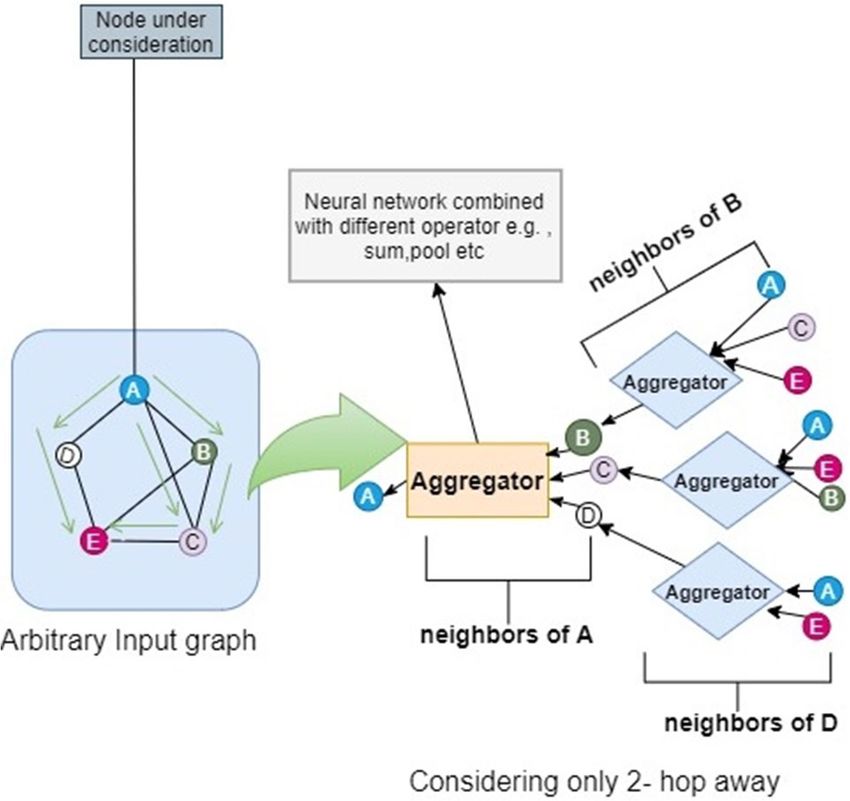
in the graph g. Now every node defines a computation graph based on its neighborhood i.e., every node has its
own neural network a rchitecture64. This is shown in Fig. 9.
The model for each node can be of arbitrary length. GNN follows a neighborhood aggregation strategy, where
we iteratively update the representation of a node by aggregating representations of its neighbors. Nodes have
embeddings at each layer. First layer of node is the input feature of that node and after k iterations of aggregation,
a node’s representation captures the structural information within its k-hop network neighborhood. Let xv be
the feature vector of the node and h0v be the initial layer embedding. Now, h0v = xv , initial layer embeddings are
equal to feature vectors. Formally, the k-th layer of a GNN is
(k−1) (k−1) k (k)
avk = Aggregate(k) (hu : u ∈ N(v)), Combine(k) (hv , av ) where, hv is the feature vector of node v at the
(k)
k-th layer and hav is the aggregated message from its neighborhoods. N(v) is a set of nodes adjacent to v. The
choice of Aggregate(k) ( · ) and Combine(k) ( · ) in GNNs are crucial.
Different architectures for Aggregate function have been proposed. In the pooling variant of G raphSAGE69,
(k−1)
Aggregate has been calculated as avk = Max(ReLU(b(k) ∗ hu ) : u ∈ N(v)) where b(k) is a parameter metrics,
and Max represents an element-wise max-pooling. The Combine step could be a concatenation of its neighbor-
hood aggregation and its previous layer’s embedding · h(k)
v =w
(k) ∗ Concat(h(k) , ak ) as in GraphSAGE, here w (k) is
v v
a parameter metrics. In Graph Convolutional Networks (GCN)70, the element-wise mean pooling is used instead,
and the Aggregate and Combine steps are integrated as follows: hv = ReLU(W ∗ mean(h(k−1)
(k) (k)
u ), ∀u ∈ N(v)) .
Mean and max-pooling aggregators are still well-defined multi-set (contains the feature vectors of adjacent
nodes of a particular node) functions because they are permutation invariant. But, they are not injective. When
performing neighborhood aggregation, the mean(GCN) or max(GraphSage) pooling always obtains the same
node representation everywhere. Thus, in this case mean and max pooling aggregators fail to capture any struc-
tural information of the graph66. GNNs and the Weisfeiler–Lehman (WL) graph isomorphism test71, a powerful
test known to distinguish a broad class of g raphs72, are very closely connected.
Scientific Reports | (2021) 11:8304 | https://doi.org/10.1038/s41598-021-87523-1 10
Vol:.(1234567890)www.nature.com/scientificreports/
Figure 8. Diagram representing the flow of edge-preparation stage.
Figure 9. Diagram representing the computation graph of a node in an arbitrary graph.
Scientific Reports | (2021) 11:8304 | https://doi.org/10.1038/s41598-021-87523-1 11
Vol.:(0123456789)www.nature.com/scientificreports/
The WL test has aggregated the labels of nodes and their neighborhoods iteratively and then it hashed the
aggregated labels into unique new labels. The algorithm decides that two graphs are non-isomorphic if at some
iteration the labels of the nodes between the two graphs differ.Each iteration of WL test has been described as
follows: FOR ALL vertices v ∈ g
1. Compute a hash of (hv , hv1 , . . . , hvn ) where hvi are the attributes of the neighbors of vertex v.
2. Use the computed hash as vertex attribute for v in the next iteration.
The algorithm will terminate when this iteration has converged in terms of unique assignments of hashes to
vertices.
The WL test is so powerful due to its injective aggregation update that maps different node neighbor-
hoods to different feature vectors. Our key insight is that a GNN can have as large distinguishable power as
the WL test if the GNN’s aggregation scheme is highly expressive and can model injective functions. This
task to map any two different graphs to different embedding have implied solving graph isomorphism prob-
lem. That is, we want isomorphic graphs to be mapped to the same representation and non-isomorphic ones
to different representations. Now, the GIN that satisfies the conditions for WL test and generalizes it and
hence achieves maximum discriminative power among GNNs. The k-th layer embedding of GIN is given by:
(k) (k) (k−1)
hv = MLP (k) ((1 + ǫ (k) ) ∗ hv + u∈N(v) hu ), where MLP stands for Multi Layer Perception and ǫ (k) is a
floating point value.
(k)
Now for node classification, the node representation hv of the kth layer is used for prediction. For graph
classification, the Readout function aggregates node features from the final iteration to obtain the entire graph’s
embedding hg that is given by the following equation :
(k
hg = Readout(hv , ∀v ∈ V ). After we have got the embedding of the final layer, a supervised learning for node
or graph classification (in our case) needs to be performed.
Architecture of our proposed GraphCovidNet model. Our architecture consists of a block of GINConv layer
which uses MLP66 in its subsequent layers for the neighborhood aggregation. In MLP, we have used a block
of sequential layers which consist of a linear layer, then a Rectangular Linear Unit (ReLU) layer, followed by
another linear layer. It is shown in Fig. 10.
GINConv layer basically takes two different inputs:
1. x which is the feature matrix of each node with dimension v*d, where V is the total number of nodes in the
graph and d is embedded dimension.
2. The edge index E has a dimension of 2*L consisting of all edges present in the entire graph in the form of
pair (v1, v2), where v1 and v2 are two nodes connected by an edge and L is the total number of edges in the
entire graph.
The output of the GINConv layer is passed through ReLU activation function to introduce non-linearity and then
we apply a dropout of 0.5 and it is followed by a normalization (norm) layer, which applies layer normalization
over a mini-batch of inputs. This output (out1) is passed on to another block of the same GINConv-ReLU-drop-
out-norm layers whose output is out2. Now, this out2 is passed onto a block which consists of GINConv-ReLU-
dropout layers and then it is followed by a global mean pooling layer. After that, a linear layer followed by a
dropout layer with dropout rate is equal to 0.5, and then a linear layer with dimension is equal to that of the
number of classes of the problem under consideration. Finally, we have used a Log Softmax as the activation
function that is used to produce the final probability vector, z. The whole architecture is shown in Fig. 11
e zi
logsoftmax(zi ) = log
c zj (1)
j=1 e
where, zi is the probability of the ith element in the last linear layer vector and cj=1 ezj is the sum of all probability
values of all the elements including in the vector for the number of classes. We have used negative log likelihood
(nll) function as the objective function for classification which needs to be minimized and can be represented as
follows: nll(z) = − ci=1 (yi ∗ logsoftmax(zi )) where, yi is the ground truth label of the ith graph.
Conclusion
For the past one year, COVID-19 has affected our social and economical lives greatly. In this situation, researchers
are focusing on CT scan and CXR images for screening COVID-19 cases of the affected persons. In this paper, we
have proposed a novel model, named as GraphCovidNet, which basically deals with classification of COVID-19
or any kind of Pneumonia patients from healthy people. Prewitt fi lter67 has been used in the pre-processing stage
which produces the edges of an image. Thus our proposed approach utilizes the memory more optimally than
the typical CNN based models. Proposed model performs impressively well over different dataset considered in
the present work. For some cases, its prediction accuracy even reaches to 100% and it can easily overcome the
problems like overfitting and class imbalance. The proposed model has also outperformed many past models in
terms of accuracy, precision, recall and f1-score. In future, we can apply the proposed GraphCovidNet in other
COVID-19 or other medical datasets having CT-scans or CXRs. To be precise, GNN based models are applicable
in any kind of image classification problems. We have conducted the present experiments using only 10 epochs
Scientific Reports | (2021) 11:8304 | https://doi.org/10.1038/s41598-021-87523-1 12
Vol:.(1234567890)www.nature.com/scientificreports/
Figure 10. Diagram representing the MLP architecture of GINConv Layer.
Figure 11. Overall architecture of our proposed GraphCovidNet model.
to build the training model. So in future, we shall try to improve our model’s speed so that it can be trained in
very less time even for larger number of samples.
Data availability
No datasets are generated during the current study. The datasets analyzed during this work are made publicly
available in this published article.
Scientific Reports | (2021) 11:8304 | https://doi.org/10.1038/s41598-021-87523-1 13
Vol.:(0123456789)www.nature.com/scientificreports/
Code availability
The codes used for this research work are made publicly available in the GitHub repository: https://github.com/
debadyuti23/GraphCovidNet.
Received: 15 December 2020; Accepted: 29 March 2021
References
1. Goel, T., Murugan, R., Mirjalili, S. & Chakrabartty, D. K. Optconet: An optimized convolutional neural network for an automatic
diagnosis of covid-19. Appl. Intell., 1–16 (2020).
2. https://covid19.who.int (2020).
3. Nour, M., Cömert, Z. & Polat, K. A novel medical diagnosis model for covid-19 infection detection based on deep features and
bayesian optimization. Appl. Soft Comput. 106580. https://doi.org/10.1016/j.asoc.2020.106580 (2020).
4. https://www.who.int/ (2020).
5. Wu, J. et al. Chest CT findings in patients with coronavirus disease 2019 and its relationship with clinical features. Investig. Radiol.
55, 257 (2020).
6. Liang, S., Zhanghao, M. & Fuhua, Y. Adaptive Feature Selection Guided Deep Forest for COVID-19 Classification With Chest CT
(IEEE, 2020).
7. Hope, M. D. et al. A role for CT in COVID-19? What data really tell us so far. Lancet (London, England) 395, 1189–1190 (2020).
8. Soares, E., Angelov, P., Biaso, S., Higa Froes, M. & Kanda Abe, D. SARS-CoV-2 CT-scan dataset: A large dataset of real patients
CT scans for SARS-CoV-2 identification. medRxiv. https://doi.org/10.1101/2020.04.24.20078584 (2020). https://www.medrxiv.
org/content/early/2020/05/14/2020.04.24.20078584.full.pdf.
9. Jamdade, V. CMSC-678-ML-Project. https://github.com/vj2050/Transfer-Learning-COVID-19 (2020).
10. Perumal, V., Narayanan, V. & Rajasekar, S. J. S. Detection of COVID-19 using CXR and CT images using transfer learning and
Haralick features. Appl. Intell. 51, 341–358 (2021).
11. Yang, X. et al. Covid-CT-dataset: A CT scan dataset about COVID-19. ArXiv e-prints arXiv-2003 (2020).
12. He, K., Fan, H., Wu, Y., Xie, S. & Girshick, R. Momentum contrast for unsupervised visual representation learning. Proceedings of
the IEEE/CVF Conference on Computer Vision and Pattern Recognition, 9729–9738 (2020).
13. Jégou, S., Drozdzal, M., Vazquez, D., Romero, A. & Bengio, Y. The one hundred layers tiramisu: Fully convolutional DenseNets
for semantic segmentation. In Proceedings of the IEEE Conference on Computer Vision and Pattern Recognition Workshops, 11–19
(2017).
14. He, K., Zhang, X., Ren, S. & Sun, J. Deep residual learning for image recognition. In Proceedings of the IEEE Conference on Computer
Vision and Pattern Recognition, 770–778 (2016).
15. Silva, P. et al. COVID-19 detection in CT images with deep learning: A voting-based scheme and cross-datasets analysis. Inf. Med.
Unlocked 20, 100427 (2020).
16. Tan, M. & Le, Q. V. Efficientnet: Improving accuracy and efficiency through AutoML and model scaling. arXiv preprint arXiv:
1905.11946 (2019).
17. Sharma, S. Drawing insights from COVID-19-infected patients using CT scan images and machine learning techniques: A study
on 200 patients. Environ. Sci. Pollut. Res. 27, 37155–37163 (2020).
18. Radiology IS of M and I. Italian society of medical and interventional radiology. https://www.sirm.org/category/senza-categoria/
covid-19/ (2020).
19. https://mosmed.ai/en/ (2020).
20. http://www.salhospital.com/ (2020).
21. Elaziz, M. A. et al. New machine learning method for image-based diagnosis of COVID-19. PLoS ONE 15, 1–18. https://doi.org/
10.1371/journal.pone.0235187 (2020).
22. Guo, G., Wang, H., Bell, D., Bi, Y. & Greer, K. KNN model-based approach in classification. In OTM Confederated International
Conferences ”On the Move to Meaningful Internet Systems”, 986–996 (Springer, 2003).
23. Cohen, J. P. et al. COVID-19 image data collection: Prospective predictions are the future (2020). arXiv:2006.11988.
24. Mooney, P. Chest X-ray images (pneumonia) [Online]. https://www.kaggle.com/paultimothymooney/chest-xray-pneumonia,
tanggal akses (2018).
25. Chowdhury, M. E. H. et al. Can AI help in screening viral and COVID-19 pneumonia?. IEEE Access 8, 132665–132676. https://
doi.org/10.1109/access.2020.3010287 (2020).
26. Turkoglu, M. Covidetectionet: COVID-19 diagnosis system based on X-ray images using features selected from pre-learned deep
features ensemble. Appl. Intell., 1–14 (2020).
27. O’Shea, K. & Nash, R. An introduction to convolutional neural networks (2015). arXiv:1511.08458
28. Cortes, C. & Vapnik, V. Support-vector networks. Mach. Learn. 20, 273–297 (1995).
29. Rahman, T. COVID-19 Radiography Database. https://www.kaggle.com/tawsifurrahman/covid19-radiography-database (2020).
30. Oh, Y., Park, S. & Ye, J. C. Deep learning COVID-19 features on CXR using limited training data sets. IEEE Trans. Med. Imaging
(2020).
31. Shiraishi, J. et al. Development of a digital image database for chest radiographs with and without a lung nodule: Receiver operating
characteristic analysis of radiologists’ detection of pulmonary nodules. Am. J. Roentgenol. 174, 71–74 (2000).
32. Van Ginneken, B., Stegmann, M. B. & Loog, M. Segmentation of anatomical structures in chest radiographs using supervised
methods: A comparative study on a public database. Med. Image Anal. 10, 19–40 (2006).
33. Jaeger, S. et al. Two public chest X-ray datasets for computer-aided screening of pulmonary diseases. Quant. Imaging Med. Surg.
4, 475 (2014).
34. Praveen. CoronaHack—Chest X-ray-dataset. https://www.kaggle.com/praveengovi/coronahack-chest-xraydataset (2020).
35. Kermany, D. S. et al. Identifying medical diagnoses and treatable diseases by image-based deep learning. Cell 172, 1122–1131
(2018).
36. Rokach, L. & Maimon, O. Decision trees. In Data Mining and Knowledge Discovery Handbook, 165–192 (Springer, 2005).
37. Chandra, T. B., Verma, K., Singh, B. K., Jain, D. & Netam, S. S. Coronavirus disease (COVID-19) detection in chest X-ray images
using majority voting based classifier ensemble. Expert Syst. Appl. 165, 113909 (2020).
38. Mishra, M. & Srivastava, M. A view of artificial neural network. In 2014 International Conference on Advances in Engineering
Technology Research (ICAETR-2014), 1–3. https://doi.org/10.1109/ICAETR.2014.7012785 (2014).
39. Webb, G. I. Naïve bayes. Encycl. Mach. Learn. 15, 713–714 (2010).
40. Candemir, S. et al. Lung segmentation in chest radiographs using anatomical atlases with nonrigid registration. IEEE Trans. Med.
Imaging 33, 577–590 (2013).
41. Wang, X. et al. Chestx-ray8: Hospital-scale chest X-ray database and benchmarks on weakly-supervised classification and localiza-
tion of common thorax diseases. In Proceedings of the IEEE Conference on Computer Vision and Pattern Recognition, 2097–2106
(2017).
Scientific Reports | (2021) 11:8304 | https://doi.org/10.1038/s41598-021-87523-1 14
Vol:.(1234567890)www.nature.com/scientificreports/
42. Srinivasan, G. & Shobha, G. Statistical texture analysis. Proc. World Acad. Sci. Eng. Technol. 36, 1264–1269 (2008).
43. Gómez, W., Pereira, W. C. A. & Infantosi, A. F. C. Analysis of co-occurrence texture statistics as a function of gray-level quantiza-
tion for classifying breast ultrasound. IEEE Trans. Med. Imaging 31, 1889–1899 (2012).
44. Dalal, N. & Triggs, B. Histograms of oriented gradients for human detection. In 2005 IEEE Computer Society Conference on Com-
puter Vision and Pattern Recognition (CVPR’05), Vol. 1, 886–893. https://doi.org/10.1109/CVPR.2005.177 (2005).
45. Hemdan, E. E.-D., Shouman, M. A. & Karar, M. E. Covidx-net: A framework of deep learning classifiers to diagnose COVID-19
in X-ray images. arXiv preprint arXiv:2003.11055 (2020).
46. Simonyan, K. & Zisserman, A. Very deep convolutional networks for large-scale image recognition. arXiv preprint arXiv:1409.
1556 (2014).
47. Huang, G., Liu, Z., Van Der Maaten, L. & Weinberger, K. Q. Densely connected convolutional networks. In Proceedings of the IEEE
Conference on Computer Vision and Pattern Recognition, 4700–4708 (2017).
48. Szegedy, C., Vanhoucke, V., Ioffe, S., Shlens, J. & Wojna, Z. Rethinking the inception architecture for computer vision. In Proceed-
ings of the IEEE Conference on Computer Vision and Pattern Recognition, 2818–2826 (2016).
49. Too, E. C., Yujian, L., Njuki, S. & Yingchun, L. A comparative study of fine-tuning deep learning models for plant disease identi-
fication. Comput. Electron. Agric. 161, 272–279 (2019).
50. Szegedy, C., Ioffe, S., Vanhoucke, V. & Alemi, A. Inception-v4, inception-resnet and the impact of residual connections on learning.
arXiv preprint arXiv:1602.07261 (2016).
51. Chollet, F. Xception: Deep learning with depthwise separable convolutions. In Proceedings of the IEEE Conference on Computer
Vision and Pattern Recognition, 1251–1258 (2017).
52. Rosebrock, A. https://www.pyimagesearch.com/category/medical/ (2020).
53. Makris, A., Kontopoulos, I. & Tserpes, K. Covid-19 detection from chest X-ray images using deep learning and convolutional
neural networks. In 11th Hellenic Conference on Artificial Intelligence, 60–66 (2020).
54. Zhong, Y. Using deep convolutional neural networks to diagnose COVID-19 from chest X-ray images. arXiv preprint arXiv:2007.
09695 (2020).
55. Chung, A. Figure 1 COVID-19 chest X-ray data initiative. https://github.com/agchung/Figure1-COVID-chestxray-dataset (2020).
56. Chung, A. Actualmed COVID-19 chest X-ray data initiative. https://github.com/agchung/Actualmed-COVID-chestxray-dataset
(2020).
57. Chattopadhyay, S., Dey, A., Singh, P. K., Geem, Z. W. & Sarkar, R. COVID-19 detection by optimizing deep residual features with
improved clustering-based golden ratio optimizer. Diagnostics 11, 315 (2021).
58. Sen, S., Saha, S., Chatterjee, S., Mirjalili, S. & Sarkar, R. A bi-stage feature selection approach for COVID-19 prediction using chest
CT images. Appl. Intell. (2021).
59. Loey, M., Manogaran, G., Taha, M. H. N. & Khalifa, N. E. M. A hybrid deep transfer learning model with machine learning methods
for face mask detection in the era of the COVID-19 pandemic. Measurement 167, 108288 (2020).
60. Wang, Z. et al. Masked face recognition dataset and application. arXiv preprint arXiv:2003.09093 (2020).
61. prajnasb, “observations,” observations. https://github.com/prajnasb/observations (2020).
62. Learned-Miller, E., Huang, G. B., RoyChowdhury, A., Li, H. & Hua, G. Labeled faces in the wild: A survey. In Advances in Face
Detection and Facial Image Analysis, 189–248 (Springer, 2016).
63. Joshi, S., Verma, D. K., Saxena, G. & Paraye, A. Issues in training a convolutional neural network model for image classification.
Springer 1046, 282–293 (2019).
64. Scarselli, F., Gori, M., Tsoi, A. C., Hagenbuchner, M. & Monfardini, G. The graph neural network model. IEEE Trans. Neural Netw.
20, 61–80. https://doi.org/10.1109/TNN.2008.2005605 (2009).
65. Mondal, R., Mukherjee, D., Singh, P. K., Bhateja, V. & Sarkar, R. A new framework for smartphone sensor based human activity
recognition using graph neural network. IEEE Sens. J. (2020).
66. Xu, K., Hu, W., Leskovec, J. & Jegelka, S. How powerful are graph neural networks? arXiv preprint arXiv:1810.00826 (2018).
67. Prewitt, J. M. S. Picture Processing and Psychopictorics (Academic Press, New York, 1970).
68. Priyam, P., Dey, D. & Shreya, D. P. Edge detection by using canny and Prewitt. Int. J. Sci. Eng. Res. 7 (2016).
69. Hamilton, W., Ying, Z. & Leskovec, J. Inductive representation learning on large graphs. Adv. Neural Inf. Process. Syst., 1024–1034
(2017).
70. Berg, R. V. D., Kipf, T. N. & Welling, M. Graph convolutional matrix completion. arXiv preprint arXiv:1706.02263 (2017).
71. Weisfeiler, B. & Lehman, A. A. A reduction of a graph to a canonical form and an algebra arising during this reduction. Nauchno-
Technicheskaya Informatsia 2, 12–16 (1968).
72. Babai, L. & Kucera, L. Canonical labelling of graphs in linear average time. In 20th Annual Symposium on Foundations of Computer
Science (SFCS 1979), 39–46 (IEEE, 1979).
Acknowledgements
We would like to thank the CMATER research laboratory of the Computer Science and Engineering Department,
Jadavpur University, India for providing us the infrastructural support.
Author contributions
P.K.S. and R.S. conceived the experiment(s); P.S. and D. M. conducted the experiment(s); A.A. and M.F. provided
the funding acquisition, supervision and validation of the data; P.S., D.M., P.K.S. and R.S. analysed the results.
All authors reviewed the manuscript.
Competing interests
The authors declare no competing interests.
Additional information
Correspondence and requests for materials should be addressed to A.A.
Reprints and permissions information is available at www.nature.com/reprints.
Publisher’s note Springer Nature remains neutral with regard to jurisdictional claims in published maps and
institutional affiliations.
Scientific Reports | (2021) 11:8304 | https://doi.org/10.1038/s41598-021-87523-1 15
Vol.:(0123456789)You can also read


