Retinal Thickness Changes Over Time in a Murine AD Model - Frontiers
←
→
Page content transcription
If your browser does not render page correctly, please read the page content below
ORIGINAL RESEARCH
                                                                                                                                           published: 15 January 2021
                                                                                                                                      doi: 10.3389/fnagi.2020.625642

                                             Retinal Thickness Changes Over
                                             Time in a Murine AD Model
                                             APPNL-F/NL-F
                                             Elena Salobrar-García 1,2† , Inés López-Cuenca 1† , Lídia Sánchez-Puebla 1 , Rosa de Hoz 1,2 ,
                                             José A. Fernández-Albarral 1 , Ana I. Ramírez 1,2 , Isabel Bravo-Ferrer 3,4 , Violeta Medina 5 ,
                                             María A. Moro 5 , Takaomi C. Saido 6 , Takashi Saito 7 , Juan J. Salazar 1,2* and
                                             José M. Ramírez 1,8*
                                             1
                                              Ramon Castroviejo Ophthalmological Research Institute, Complutense University of Madrid, Madrid, Spain, 2 Department of
                                             Immunology, Ophthalmology and Ear, Nose, and Throat, Faculty of Optics and Optometry, Complutense University of
                                             Madrid, Madrid, Spain, 3 Department of Pharmacology and Toxicology, Faculty of Medicine, Complutense University of
                                             Madrid, Madrid, Spain, 4 Edinburgh Medical School, UK Dementia Research Institute, University of Edinburgh, Edinburgh,
                                             United Kingdom, 5 Centro Nacional de Investigaciones Cardiovasculares (CNIC), Madrid, Spain, 6 Laboratory for Proteolytic
                                             Neuroscience, Brain Science Institute, RIKEN, Wako, Japan, 7 Department of Neurocognitive Science, Institute of Brain
                                             Science, Nagoya City University Graduate School of Medical Sciences, Nagoya, Japan, 8 Department of Immunology,
                                             Ophthalmology and ENT, School of Medicine, Complutense University of Madrid, Madrid, Spain

                                             Background: Alzheimer’s disease (AD) may present retinal changes before brain
                                             pathology, suggesting the retina as an accessible biomarker of AD. The present work
                           Edited by:
                                             is a diachronic study using spectral domain optical coherence tomography (SD-OCT) to
                          Rong Chen,         determine the total retinal thickness and retinal nerve fiber layer (RNFL) thickness in an
    University of Maryland, Baltimore,
                                             APPNL−F/NL−F mouse model of AD at 6, 9, 12, 15, 17, and 20 months old compared to
                        United States
                                             wild type (WT) animals.
                        Reviewed by:
                 Sachchida Nand Rai,         Methods: Total retinal thickness and RNFL thickness were determined. The mean total
         University of Allahabad, India
                       Henri Leinonen,
                                             retinal thickness was analyzed following the Early Treatment Diabetic Retinopathy Study
         University of California, Irvine,   sectors. RNFL was measured in six sectors of axonal ring scans around the optic nerve.
                          United States
                                             Results: In the APPNL−F/NL−F group compared to WT animals, the total retinal thickness
                   *Correspondence:
                       José M. Ramírez       changes observed were the following: (i) At 6-months-old, a significant thinning in the
                 ramirezs@med.ucm.es         outer temporal sector was observed; (ii) at 15-months-old a significant thinning in the
                         Juan J. Salazar
                       jjsalaza@ucm.es
                                             inner temporal and in the inner and outer inferior retinal sectors was noticed; (iii) at
                                             17-months-old, a significant thickening in the inferior and nasal sectors was found in
     † These   authors have contributed
                    equally to this work
                                             both inner and outer rings; and (iv) at 20-months-old, a significant thinning in the inner
                                             ring of nasal, temporal, and inferior retina and in the outer ring of superior and temporal
       Received: 03 November 2020            retina was seen. In RNFL thickness, there was significant thinning in the global analysis
       Accepted: 15 December 2020
                                             and in nasal and inner-temporal sectors at 6 months old. Thinning was also found in the
        Published: 15 January 2021
                                             supero-temporal and nasal sectors and global value at 20 months old.
                            Citation:
  Salobrar-García E, López-Cuenca I,         Conclusions: In the APPNL−F/NL−F AD model, the retinal thickness showed thinning,
        Sánchez-Puebla L, de Hoz R,
   Fernández-Albarral JA, Ramírez AI,
                                             possibly produced by neurodegeneration alternating with thickening caused by deposits
  Bravo-Ferrer I, Medina V, Moro MA,         and neuroinflammation in some areas of the retina. These changes over time are
    Saido TC, Saito T, Salazar JJ and
                                             similar to those observed in the human retina and could be a biomarker for AD. The
 Ramírez JM (2021) Retinal Thickness
  Changes Over Time in a Murine AD           APPNL−F/NL−F AD model may help us better understand the different retinal changes
               Model APPNL-F/NL-F .          during the progression of AD.
   Front. Aging Neurosci. 12:625642.
     doi: 10.3389/fnagi.2020.625642          Keywords: Alzheimer, retina, OCT, mouse model of AD, APPNL-F/NL-F

Frontiers in Aging Neuroscience | www.frontiersin.org                              1                                        January 2021 | Volume 12 | Article 625642
Salobrar-García et al.                                                                                  Retinal Changes in the APPNL−F/NL−F AD Model

INTRODUCTION                                                                is no transgenic mouse model that presents all AD features.
                                                                            Most transgenic mice were made to overexpress mutant forms of
Alzheimer’s disease (AD) is a neurodegenerative brain pathology             APP and/or PS1 and show the onset of Aβ age-dependent brain
characterized by a loss of neurons and their synapses, after                deposition, gliosis, synaptic dysfunction, and memory deficits
which an atrophy of the cerebral cortex develops (Sharma and                (Duyckaerts et al., 2008). Transgenic mice that overexpress
Singh, 2016). The main features of AD are extracellular deposits            APP have artificial phenotypes because, in addition to the Aβ,
of the protein amyloid-β (Aβ), the formation of plaques, and                they overproduce other APP fragments that can interfere with
intraneuronal hyper-phosphorylated tau (pTau) in the form                   intrinsic biological functions. In addition, these models use
of neurofibrillary tangles (Ghiso et al., 2013) leading to a                artificial promoters that produce transgenic expression in cells
neuroinflammatory process (Pan et al., 2011).                               that are not always identical to those that express endogenous
    One important tissue to focus on in search of                           APP. Another feature of APP overexpression models is the
neurodegenerative disease biomarkers is the eye. It is widely               sudden death that reflects a physiological alteration (Nilsson
known that patients with AD have visual problems, such as                   et al., 2014; Saito et al., 2014). A second generation of AD mouse
decreased visual acuity, contrast sensitivity, color perception, and        models was developed to have both less artificial phenotypes
visual integration (Salobrar-García et al., 2015a, 2016, 2019a,b).          and less altered physiology (Sakakibara et al., 2018). This
Retinal changes have also been documented in vivo using optical             alternative AD mouse models have been generated via knock-
coherence tomography (OCT) both in humans (Iseri et al., 2006;              in (KI) of a humanized Aβ sequences harboring familial AD
Garcia-Martin et al., 2014; Salobrar-García et al., 2015b, 2016,            mutations [Swedish (NL), Beyreuther/Iberian (F), and Arctic
2019a,b; Polo et al., 2017; Ko et al., 2018; Lad et al., 2018) and in       (G)] (Sakakibara et al., 2019). One of these second generation
different AD animal models (Chiquita et al., 2019; Georgevsky               AD mouse models is the APPNL−F/NL−F that harbors the Swedish
et al., 2019; Harper et al., 2020). The retinal changes observed            mutation (NL) and the Iberian mutation (F). This model, unlike
in the OCT results of AD patients showed macular thinning                   the models that overexpress APP, has normal levels of full-
when the disease is in an early stage, followed by thinning of              length APP, and its cleavage products produce a significantly
the peripapillary area when AD progresses (Garcia-Martin et al.,            higher level of Aβ42 compared to wild type (WT) mice and
2014; Salobrar-García et al., 2015b, 2019a,b; Jáñez-Escalada et al.,        APP overexpression models, as well as exhibits a significantly
2019). Retinal areas with an increased thickness were found in              higher Aβ42 /Aβ40 ratio (Saito et al., 2014). Increased Aβ42
AD patients, specifically in the macular area (Jáñez-Escalada               levels in this model cause pathological deposits of Aβ in the
et al., 2019; Salobrar-García et al., 2019a), revealing areas of            cerebral cortex and hippocampus, leading to infiltration of the
possible gliosis prior to neurodegeneration. These changes could            microglia and astrocytes surrounding the Aβ plaques starting at
be correlated with those found in the retinas of AD transgenic              6 months old (Sasaguri et al., 2017). The APPNL−F/NL−F model
models, where marked neurodegeneration and a loss of optic                  reproduces several key pathologies found in AD patients. It has
nerve axons were observed (Gupta et al., 2016; Chiquita et al.,             been suggested that this model may be useful as a preclinical AD
2019; Georgevsky et al., 2019), alongside retinal thickening                mouse model to research the pathological role of amyloidosis
and increased microglial activation in the early stages of the              and amyloids related to neuroinflammation (Saito and Saido,
disease (Perez et al., 2009; Yang et al., 2013; Gao et al., 2015;           2018). In addition, this model presents a number of neurological
Salobrar-García et al., 2020). In addition to the retinal structural        disturbances in an age-dependent manner, such as synaptic
changes, several functional changes have been observed by                   disorders and memory impairment, in a Y-maze test (Saito et al.,
means of electroretinogram (ERG) in the APPswe/PS1 transgenic               2014).
mouse model of AD finding a significant reduction of the a and                  For retinal tissue, Aβ deposits have been found in several AD
b wave amplitudes between 12 and 16 months of age (Perez                    models that overexpress APP (Ning et al., 2008; Shimazawa et al.,
et al., 2009). Other authors observed in this model, already                2008; Dutescu et al., 2009; Perez et al., 2009; Koronyo-Hamaoui
at 3 months a significant reduction of the b-wave coinciding                et al., 2011; Gupta et al., 2016). These Aβ deposits were located in
with the Aβ deposits in the hippocampus (Georgevsky et al.,                 the retinal nerve fiber layer (RNFL), ganglion cell layer (GCL),
2019). In addition, findings, such as a slightly shortened ERG              inner plexiform layer (IPL), outer plexiform layer (OPL), and
latency in dark adapted conditions and the increased frequency              inner nuclear layer (INL) (Ning et al., 2008; Dutescu et al., 2009;
of oscillatory potentials in the old APPswe/PS1 , could be related          Perez et al., 2009; Koronyo-Hamaoui et al., 2011).
to inadequate cholinergic innervation (Leinonen et al., 2016).                  Recently, the retina has been studied by OCT in transgenic
However, in this model, late-stage photopic ERG measurements                mouse models that overexpress APP, but these studies are scarce
revealed that the cone mediated retinal response was preserved              and controversial. In an APP/PS1 model analyzing the retina
in the APPswe/PS1 mice (Joly et al., 2017). Therefore, the retina           from 3 to 12 months of age, a significant decrease in retinal
has been postulated as an accessible biomarker of AD.                       thickness in the inner layers was found at 9 months of age and
    Most cases of AD in humans are sporadic, and only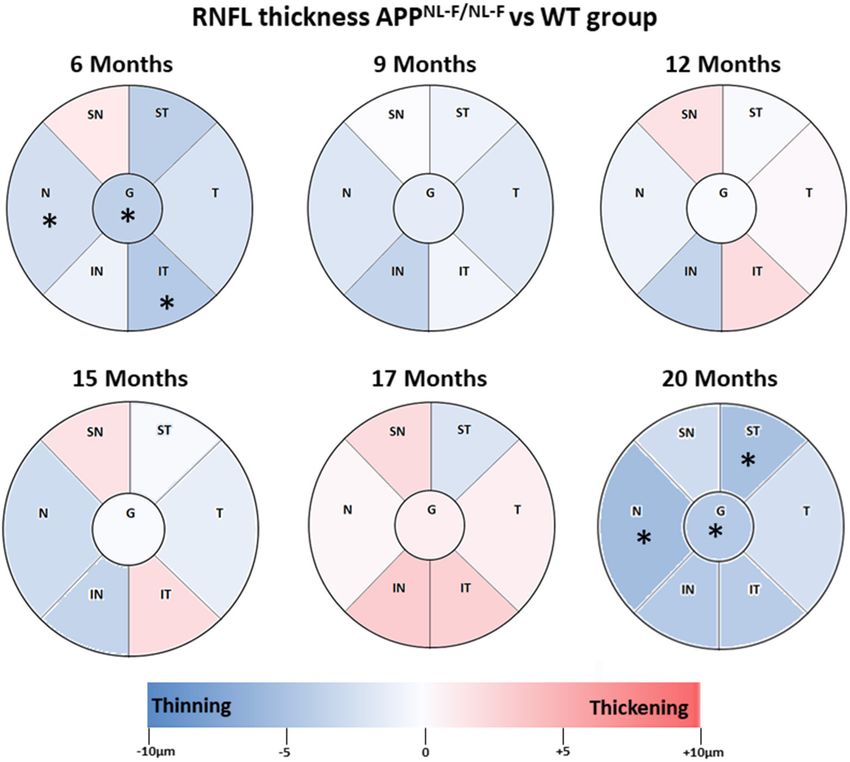
Salobrar-García et al.                                                                                    Retinal Changes in the APPNL−F/NL−F AD Model

significant thinning of the RNFL in AD mouse retinas compared               All procedures were performed in accordance with the
to the WT controls (Song et al., 2020).                                  European Parliament, the Council Directive 2010/63/EU, and
    Despite the loss of neurons that occurs at ∼17 months-age,           Spanish legislation (Real Decreto 53/ 2013). The procedures
for most transgenic models of AD (APP/PS1 model) (Harper                 were approved by the Ethics Committee on Animal Welfare
et al., 2020), diachronic studies that analyze the retinal changes       of the University Complutense (PROEX No. 047/16) and
observed by OCT in AD transgenic models from early stages                reported according to the Association for Research in Vision and
to late stages of the disease could help us better understand            Ophthalmology (ARVO) statement of animal use. All procedures
the retinal observations. To the best of our knowledge, there            minimized the number of animals used and their suffering.
is no study that analyzes the retina using SD-OCT in the
APPNL−F/NL−F model. Given the aforementioned advantages of               Experimental Groups
this model, the aim of this study was to analyze the changes             Two groups of mice were used for this study: an APPNL−F/NL−F
in retinal thickness (total retinal thickness and RNFL thickness)        group (n = 55) and an age-matched control (WT, n = 41) group,
over time (at 6, 9, 12, 15, 17, and 20 months of age) in a               as indicated in Table 1. Only the left eyes of the animals were used
well-validated mouse model of AD (APPNL−F/NL−F ).                        in our study. This control-case study was performed at 6, 9, 12,
                                                                         15, 17, and 20 months of age.

                                                                         OCT Analysis
MATERIALS AND METHODS                                                    The retinal structures were evaluated using SD-OCT Spectralis
Animals and Ethics                                                       with the Heidelberg Eye Explorer software v6.13 (Heidelberg
The experiments were performed on male APPNL−F/NL−F mice                 Engineering, Heidelberg, Germany) after pupil dilation
produced by manipulating the mouse APP gene using a knock-in             (tropicamide 10 mg/ml; colircusi tropicamide, Alcon Healthcare,
strategy with Swedish (KM670/671NL) and Beyreuther/Iberian               Barcelona, Spain).
(I716F) mutations, as described previously (Saito et al., 2014).            The cornea was kept moisturized using artificial tear eye
The experiments were also performed on age-matched WT                    drops. To prevent a reduction in body temperature, heating pads
animals (C57BL/6J). The animals were obtained from the                   were placed underneath the mice.
research group led by Dr. Takaomi C. Saito at the laboratory                An addition, a 25 diopter mouse lens (Heidelberg, Germany)
for Proteolytic Neuroscience, RIKEN Brain Science Institute,             was added in front of the OCT camera, and the murine eye was
Saitama, Japan.                                                          covered with a polymethyl methacrylate contact lens (3.2 mm
   The Aβ sequence within the mouse APP gene was humanized               diameter, base curve 1.7; Cantor&Nissel, UK), which served to
and, while the Swedish mutation (NL) elevates the total amount           create a uniform refractive surface.
of Aβ40 and Aβ42, the Beyreuther/Iberian(F) mutation increases              Each mouse eye was aligned with respect to the measurement
the ratio of Aβ42 /Aβ40 (Saito et al., 2014). The great advantage        beam to ensure that the optic nerve head (ONH) was at the center
of this model is that the mouse Aβ sequence is humanized and             of the OCT analysis. To compensate for small eye movements,
the Swedish and Beyreuther/Iberian mutations are introduced by           such as those that occur as a result of respiration, motion
knock-in technology (Saito et al., 2014). In order to accelerate         artifacts were minimized through real-time eye tracking in the
pathology and to remove murine endogenous Aβ, mutant mice                device software.
are bred in homozygosity (Sasaguri et al., 2017) explaining                 As in the Early Treatment Diabetic Retinopathy Study
why control mice are not littermates. However, this should               (ETDRS), retinal thickness data were displayed as three
not be a major problem considering that mutant mice have                 concentric rings 3 mm in total diameter centered in the optic
been backcrossed with genuine wild-type B6J mice for more                nerve. These rings were distributed as follows: a central area
than 10 generations.                                                     with a diameter of 1 mm that was not considered for the
   The retinas of male APPNL−F/NL−F and WT animals were                  measurements, an inner ring with a diameter of 2 mm, and
evaluated in vivo using SD-OCT at 6, 9, 12, 15, 17, and 20 months        an outer ring with a diameter of 3 mm. Both measured rings
of age.                                                                  were divided into four quadrants (superior, inferior, nasal, and
   The animals were housed in light- and temperature-controlled          temporal) (Figures 1A,B). Due to the size of the mouse eye,
rooms with a 12-h light/dark cycle and ad libitum access to food
and water in the Medical School at the University Complutense
of Madrid. Light intensity within the cages ranged from 9 to             TABLE 1 | Number of mice used at different time points.
24 lux. The SD-OCT analysis was performed under general
anesthesia induced with an intraperitoneal (ip) injection of a           Age group                 APPNL-F/NL-F group (n)                 WT group (n)
mixture of ketamine (75 mg/kg; Anesketin R , Dechra Veterinary
                                                                         6 months                             5                                 7
Products SLU, Barcelona, Spain) and medetomidine (0.26 mg/kg;
                                                                         9 months                             14                                6
Medetor R , Virbac España S.A., Barcelona, Spain), which can be
                                                                         12 months                            10                                7
reversed by the antagonist atipamezole (Antisedan, 5 mg/mL;
                                                                         15 months                            6                                 7
Pfizer). During the recovery from anesthesia, the mice were
                                                                         17 months                            8                                 7
placed in their cages with a heat source to maintain their core
                                                                         20 months                            12                                7
body temperature.

Frontiers in Aging Neuroscience | www.frontiersin.org                3                                         January 2021 | Volume 12 | Article 625642
Salobrar-García et al. Retinal Changes in the APPNL−F/NL−F AD Model FIGURE 1 | (A) Concentric rings with 1, 2, and 3 mm diameters. (B) OCT section. Retinal thickness measured between the inner limiting membrane and the retinal pigment epithelium. (C) RNFL sectors (RNFL, Retinal Nerve Fiber Layer; ST, Supero–Temporal; SN, Supero–Nasal; N, Nasal; IN, Infero–Nasal; IT, Infero-Temporal; T, Temporal; G, Global). (D) OCT section. Result of segmentation of the OCT scan. RNFL delimited between the ILM and GCL + IPL. OCT, optical coherence tomography; RNFL, Retinal nerve fiber layer; ILM, inner limiting membrane; GCL + IPL, ganglion cell layer and inner plexiform layer. which differs significantly from that of the human eye, a +25 groups (APPNL−F/NL−F and WT) were analyzed using a non- diopter optical lens was used in addition to a contact lens, so parametric Mann–Whitney U Test. Data are reported as the the lateral distances were not entirely accurate. However, it was mean values ± standard deviation (SD). A P-value
Salobrar-García et al.                                                                                                                 Retinal Changes in the APPNL−F/NL−F AD Model

TABLE 2 | Total retinal thickness between groups.

                                                                                                              Total retinal thickness

                                                                                     Inner ring                                                         Outer ring

                                                               S                I                 N               T                S                I                N          T

6 months            APPNL−F/NL−F            Mean           250.60           244.20            241.40           243.00           254.20           243.80            246.20     244.40
                                            SD               5.73             4.82              4.28             4.53             6.38            4.44              5.63       2.41
                    WT                      Mean           249.43           249.43            246.00           247.43           256.57           253.57            248.86     253.00
                                            SD               6.02             7.30              4.28             7.25             8.28            9.11              6.18       6.11
                               P-value                      0.935            0.255              0.101           0.221            0.684            0.061            0.624      0.028*
9 months            APPNL−F/NL−F            Mean           252.36           247.29            247.43           247.57           257.71           245.36            251.21     246.14
                                            SD               8.42             7.24              5.26             5.56             6.78            9.43              4.51       6.68
                    WT                      Mean           257.17           250.33            250.50           251.83           261.67           249.00            248.17     252.33
                                            SD               7.31             6.12              6.92             7.68            11.38            5.37              7.36       7.12
                               P-value                      0.246            0.342              0.230           0.185            0.282            0.535            0.320      0.063
12 months           APPNL−F/NL−F            Mean           253.00           246.56            245.56           246.33           257.22           246.11            247.67     246.22
                                            SD               8.38             3.17              5.96             5.70            11.29            4.86              4.85       7.07
                    WT                      Mean           255.86           252.86            249.71           250.71           258.14           252.57            250.14     250.57
                                            SD               6.94             7.84              7.04             6.92             6.31            7.61              6.87       5.53
                               P-value                      0.366            0.089              0.202           0.123            0.560            0.100            0.243      0.110
15 months           APPNL−F/NL−F            Mean           253.83           248.00            244.83           249.17           257.50           247.00            248.17     247.67
                                            SD               4.96             7.90              2.48             8.64             9.12            7.75              4.36       9.58
                    WT                      Mean           252.71           254.86            251.00           250.57           257.29           255.29            250.71     251.57
                                            SD               7.11             5.90              6.68             8.48             9.23            6.34              6.05       6.11
                               P-value                      0.429            0.044*             0.031*          0.473            0.617           0.038*            0.418      0.195
17 months           APPNL−F/NL−F            Mean           255.38           250.25            251.63           248.25           257.75           252.88            255.00     248.13
                                            SD               7.48             4.37              5.73             3.37             9.10            5.30              7.48       4.52
                    WT                      Mean           252.29           244.71            243.00           246.71           255.00           245.00            243.71     249.71
                                            SD               4.68             4.57              4.73             3.20             8.50            5.45              3.30       4.68
                               P-value                      0.450            0.036*             0.024*          0.415            0.602           0.023*            0.004**    0.523
20 months           APPNL−F/NL−F            Mean           240.83           241.83            239.08           240.25           245.25           244.91            242.58     241.67
                                            SD               6.86             4.53              5.74             4.75             8.67            7.49              7.14       6.96
                    WT                      Mean           250.67           253.17            251.50           251.50           255.33           252.33            249.50     252.00
                                            SD               9.87             8.38              8.89             8.80             9.54            8.14              6.75       9.61
                               P-value                      0.054           0.007**          0.009**           0.007**           0.039            0.076            0.100      0.031

* in bold: p-value
Salobrar-García et al. Retinal Changes in the APPNL−F/NL−F AD Model
FIGURE 2 | Colorimetric differences of retinal thickness in each age group between the APPNL−F/NL−F and WT animal groups. OCT rings with 1, 2, and 3 mm
diameters. Red: thickening; blue: thinning. APPNL−F/NL−F , Single App Knock-in mouse model of Alzheimer’s disease; WT, Wild type; OCT, optical coherence
tomography; N, nasal; T, temporal.
When we compared the APPNL−F/NL−F group with the WT a significant thickness decrease compared to the WT group in
control group in the oldest animals (20 months), we found a the nasal sector (21.80 ± 1.48 vs. 24.29 ± 1.80, in APPNL−F/NL−F
significant thickness decrease in the inner and outer ring in and WT, respectively), in the infero–temporal sector (21.20 ±
the temporal sector (p < 0.01 and p < 0.05, respectively), in 1.30 vs. 25.57 ± 4.58, in APPNL−F/NL−F and WT, respectively),
the inner ring of both inferior and nasal sectors (p < 0.01 in and in the global value (23.00 ± 1.00 vs. 26.71 ± 4.46, in
both cases) and in the outer ring of the superior sector (p < APPNL−F/NL−F and WT, respectively; p < 0.05 in all cases)
0.05). In the APPNL−F/NL−F mice in comparison with the WT (Table 3, Figure 3).
group: the temporal sectors showed a statistically significant At 9 months-old, the thickness of all sectors in the
decrease in both the inner ring (240.25 ± 4.75 vs. 251.50 ± APPNL−F/NL−F group slightly decreased compared to the WT
8.80, in APPNL−F/NL−F and WT, respectively) and in the outer group without statistical significance (Table 3, Figure 3).
ring (241.67 ± 6.96 vs. 252.00 ± 9.61, in APPNL−F/NL−F and By contrast, at 12 and 15 months of age, in the APPNL−F/NL−F
WT, respectively); both the nasal sectors and inferior sectors group, only four sectors showed a slight non-significant thickness
showed statistically significant thinning in the inner ring (239.08 decrease (in the supero–temporal, temporal, nasal, and infero–
± 5.74 vs. 251.50 ± 8.89 for nasal sector and 241.83 ± 4.53 nasal sectors), and the remaining two sectors were slightly
vs. 253.17 ± 8.38 for inferior sector, in APPNL−F/NL− F and thickened without statistical significance (supero–nasal, and
WT, respectively) and the superior sectors showed statistically infero–temporal) compared to the WT group (Table 3, Figure 3).
significant thinning, in the outer ring (245.25 ± 8.67 vs. When comparing APPNL−F/NL−F and WT mice at 17 months
255.00 ± 9.54, in APPNL−F/NL−F and WT, respectively) (Table 2, old, it was found that the RNFL thickness of all sectors
Figure 2). increased slightly without statistical significance, except in the
supero–temporal sector, where we found a slight non-significant
RNFL Thickness thickness decrease (Table 3, Figure 3).
Overall, in RNFL, there were no statistically significant changes By contrast, at 20 months of age, the highest age in the
over time observed in our study, except at 6 and 12 months of APPNL−F/NL−F group, we found a significant thickness decrease
age. At early time point in the APPNL−F/NL−F group, we found in comparison to WT group in the nasal sector (24.83 ± 2.33
Frontiers in Aging Neuroscience | www.frontiersin.org 6 January 2021 | Volume 12 | Article 625642Salobrar-García et al. Retinal Changes in the APPNL−F/NL−F AD Model
TABLE 3 | Retinal nerve fiber layer thickness between groups.
Retinal nerve fiber layer thickness
N T SN ST IN IT G
6 months APPNL−F/NL−F Mean 21.80 23.60 25.60 25.00 24.80 21.20 23.00
SD 1.48 0.89 4.16 2.12 1.30 1.30 1.00
WT Mean 24.29 25.86 24.00 28.86 25.71 25.57 26.71
SD 1.80 2.19 3.00 4.06 4.46 4.58 4.46
P-value 0.030* 0.062 0.741 0.087 0.868 0.014* 0.039*
9 months APPNL−F/NL−F Mean 24.29 26.36 24.64 27.00 25.57 23.86 25.29
SD 2.73 3.46 4.09 4.71 6.28 3.63 2.61
WT Mean 26.17 28.00 24.50 27.83 29.00 24.50 26.67
SD 2.14 2.37 2.95 2.64 2.37 2.43 1.75
P-value 0.133 0.213 0.708 0.868 0.299 0.617 0.170
12 months APPNL−F/NL−F Mean 25.40 25.90 25.70 27.60 25.00 25.90 26.00
SD 2.07 2.28 3.37 2.59 5.42 3.14 1.70
WT Mean 26.33 25.50 23.83 27.83 28.50 23.67 26.17
SD 1.63 2.17 3.25 2.99 2.95 2.58 1.47
P-value 0.352 0.659 0.414 0.869 0.190 0.272 0.868
15 months APPNL−F/NL−F Mean 24.50 25.67 25.33 26.17 28.17 25.17 25.50
SD 3.62 1.97 3.39 4.07 4.36 2.14 2.43
WT Mean 27.29 26.86 26.14 29.00 29.71 25.29 27.14
SD 3.99 3.72 3.02 5.03 2.87 5.59 2.91
P-value 0.311 0.718 0.829 0.194 0.251 0.665 0.348
17 months APPNL−F/NL−F Mean 26.75 27.25 28.00 26.38 30.00 26.38 27.25
SD 4.30 5.39 3.25 3.85 5.55 3.29 3.06
WT Mean 26.29 26.29 25.71 28.43 26.71 23.43 26.29
SD 1.98 3.99 3.25 7.55 4.46 2.70 2.29
P-value 0.861 0.861 0.244 0.636 0.270 0.077 0.481
20 months APPNL−F/NL−F Mean 24.83 24.58 25.25 26.33 24.83 24.17 24.67
SD 2.33 3.73 3.47 4.08 5.56 4.84 2.06
WT Mean 30.33 27.00 28.00 31.50 29.17 28.33 29.00
SD 1.86 4.52 4.86 2.35 5.42 3.44 1.79
P-value 0.001* 0.257 0.343 0.011* 0.158 0.081 0.002*
* in bold: p-valueSalobrar-García et al. Retinal Changes in the APPNL−F/NL−F AD Model
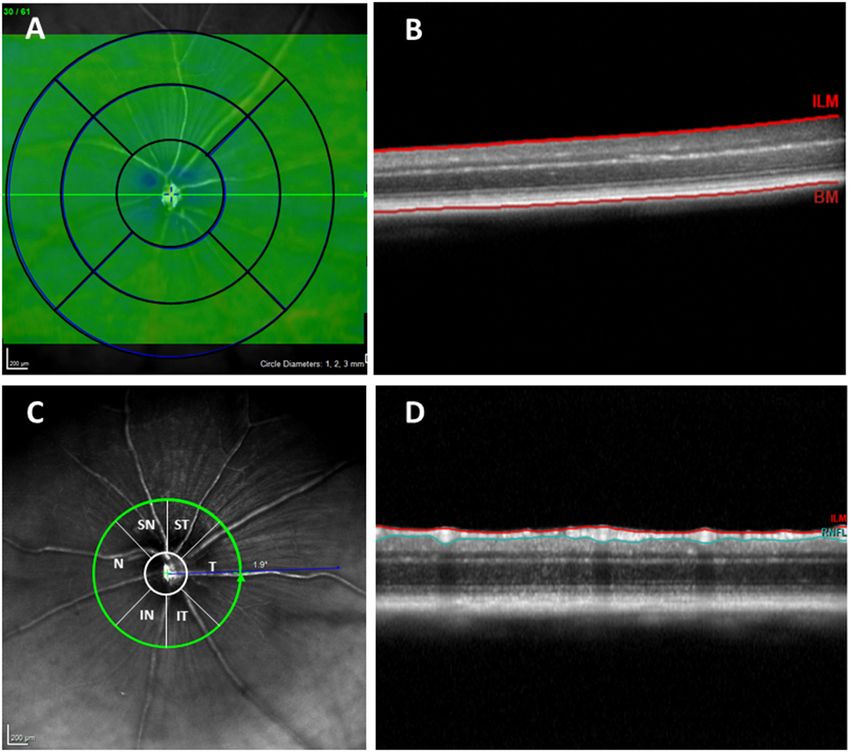
FIGURE 3 | Colorimetric differences of RNFL thickness at each time point between the APPNL−F/NL−F and WT groups. OCT sectors. Red: thickening; blue: thinning.
APPNL−F/NL−F , Single App Knock-in mouse model of Alzheimer’s disease; WT, Wild type; RNFL, Retinal nerve fiber layer; N, nasal; SN, Supero–Nasal; ST,
Supero–Temporal; T, temporal; IT, Infero-Temporal; IN, Infero–Nasal; G, global.
the lower sector the pRNFL thickness is associated with the retina. However, in other transgenic models retinal changes have
volume of the occipital lobes and selectively with the volume been previously reported.
of the lingual gyrus. Therefore, the cerebral changes observed In the retina, the formation of Aβ plaques was described to
in AD may be related to retinal changes and the retina occur at 6 months in the APP/PS1 model (Georgevsky et al.,
may be useful as a biomarker of neurodegenerative diseases 2019), although other authors observed these plaques earlier in
(Shi et al., 2020). the retina at 2.5 months old (Koronyo-Hamaoui et al., 2011).
In APPNL−F/NL−F model, at 3 months old, there was no Using the 3xTg-AD model, it was demonstrated that there is a
presence of Aβ pathology, although there was already an positive correlation between retinal thickness and the volume of
alteration of the proteome in both the hippocampus and the the visual cortex (Chiquita et al., 2019), as well as the behavior
cortex compared to WT mice. The early increase in Tris-soluble of the microglia in the retina, showing activation and migration
Aβ42 levels suggests that the pre-symptomatic stages of AD begin between the different layers of the retina in whole-mount retinas
before amyloidosis Aβ (Schedin-Weiss et al., 2020). In addition, (Salobrar-García et al., 2020). Histological alterations has been
the accumulation of Aβ is age-dependent from 1 to 18 months described in the retina, such as a decrease in the density of retinal
(Petrache et al., 2019). Aβ brain deposits have been reported at 6 ganglion cells and the nerve fiber layer, thinning of the inner
months of age in this AD model (Saito et al., 2014), developing plexiform layer, and the presence of Aβ plaques in the inner
first in the hippocampus and then becoming more significant in nuclear layer in a APP/PS1 model (Gupta et al., 2016).
the cerebral cortex (Schedin-Weiss et al., 2020). At 9 months old, Scarce studies have analyzed retinal changes using OCT in
there was a significant amount of Aβ plaques in the parenchymal transgenic models (APP/PS1 and 3xTg-AD), however, to our
brain, with the Aβ plaque load reaching its maximum at 18 knowledge, there is no study that analyses the retina in the
months (Schedin-Weiss et al., 2020). While the brain changes in APPNL−F/NL−F model. By analyzing two horizontal lines above
this model have been studied, there are not works analyzing the and below the optic nerve, Georgevsky et al. (2019) showed, in
Frontiers in Aging Neuroscience | www.frontiersin.org 8 January 2021 | Volume 12 | Article 625642Salobrar-García et al. Retinal Changes in the APPNL−F/NL−F AD Model
both APP/PS1 mice and WT controls, a significant age-related toward thickening of the retina with alternation of thinned
reduction in the inner retinal thickness from 3 to 12 months, with retinal sectors, which vary over time and present only statistical
a significant difference between the APP/PS1 and WT mice in significance at 15 months in some sectors of the total retinal
both the inner and outer retinal thickness starting at 9 months. thickness (outer and inner rings of inferior sector and inner ring
In contrast, Harper et al. (2020) using multicontrast OCT, more of the temporal sector). These changes could correlate to the
recently found no significant changes in retinal thickness between brain changes seen in this model at 9 months, when neuronal
APP/PS1 mice and control mice in any of the retinal regions death was detected by necrosis in the cerebral cortex (Schedin-
analyzed by scanning an annulus around the ONH divided Weiss et al., 2020). At the same time, the effect of microgliosis
into two sectors. Finally, Song et al. (2020) using a multimodal and astrogliosis are significant in the APPNL−F/NL−F model
imaging system with co-registered OCT and angle-resolved low- in the cortex, hippocampus, and subcortical region compared
coherence interferometry, found a significant thinning of RNFL to the WT mice (Masuda et al., 2016). These mechanisms
in 3xTg-AD mouse retinas compared to the WT controls. could explain why, at 9 months, although there were changes
Although the use of OCT gives us in vivo images at a very in the OCT analysis in the APPNL−F/NL−F group compared
high resolution that allow us to analyze the retinal layers in to WT mice, these changes were not statistically significant
animal model studies, most OCTs designed for animal studies since neuroinflammation could appears at the same time as
have no tracker system. To date, no published studies have been neurodegeneration, masking the changes seen at 6 months of
conducted using this technique (Georgevsky et al., 2019; Harper age (Saito et al., 2014; Masuda et al., 2016). These slow and
et al., 2020). However, our diachronic study in APPNL−F/NL−F minor changes in retinal thickness, which evolve steadily until
model was conducted using SD-OCT with a tracking system that 15 months of age, could be produced by the progressive deposit
allowed us to re-examine the exact same area, thereby avoiding of Aβ plaques (Radde et al., 2006; Ferguson et al., 2013; Nilsson
measurement errors or unintentional movements and giving us et al., 2014; Masuda et al., 2016; Stevanovic et al., 2017; Shah
the ability to analyse areas of the retina that cover almost the et al., 2018; Petrache et al., 2019; Schedin-Weiss et al., 2020)
entire posterior pole instead of a single scan line. and by the mechanisms of inflammation, phagocytosis, and
In APPNL−F/NL−F mice the early retinal thinning observed microglial migration between different retinal layers (Lee et al.,
with SD-OCT at 6 months of age (which was significant in total 2020; Salobrar-García et al., 2020).
retinal thickness only in the outer temporal sector, as well as in While in the APP/PS1 model, at 16 months of age, there was
the nasal, infero–temporal sectors and mean global value of the a heavy plaque burden throughout all cortical regions (Ferguson
RNFL) appeared to develop toward more significant thinning et al., 2013), as well as increased microglial activity (Perez et al.,
by the final time point. It is possible that these initial changes 2009), in the murine model used in our study, this heavy plaque
are the consequence of the progressive accumulation of soluble load peaked at 18 months. At the same time, the mice showed
oligomers of Aβ (in our model Tris-soluble Aβ42 ), inducing early alterations in different proteins of the hippocampus and the
neuronal dysfunction due to their toxicity. These changes are cortex, which are involved in various neuronal maintenance
in line with the observation that the APOE ε4 genotype of AD activities (Schedin-Weiss et al., 2020).
is associated with a decrease in GABAergic interneurons and These findings may be linked to the overall increase in total
glutamatergic signaling in the hippocampus, which is a risk factor retinal thickness at 17 months of age in the APPNL−F/NL−F
for AD (Andrews-Zwilling et al., 2010; Busche and Konnerth, group, with significance in the nasal and inferior sectors,
2016; Shah et al., 2018). In the APP/PS1 model, primary visual the inner and outer sectors, and the RNFL (albeit without
cortex degeneration has also been observed in parallel with an statistical significance); these changes were more noticeable
increase in Aβ plaque with age. This is specific to the hyperactive in the nasal–superior, nasal–inferior, and temporal–inferior
neurons located near plaques, which are also found in the frontal sectors. At this point in our study, where the greatest
cortex in AD (Busche et al., 2008). The hyperactive astrocytes thickening was observed, we precisely observed that Aβ brain
located in the vicinity of the Aβ plaques that are formed may also plaques accumulate at an accelerated rate (Koronyo-Hamaoui
contribute to neuronal protection, which can directly improve et al., 2011), which coincides with the findings of our model
neuronal activity initially. This astrogliosis becomes noticeable (Saito et al., 2014; Schedin-Weiss et al., 2020).
very early and correlates with the slow development of AD in In addition, astrocytes are hyperreactive, surrounding the
the APPNL−F/NL−F mice at 6 months (Saito et al., 2014; Petrache Aβ plaques and releasing proinflammatory factors that induce
et al., 2019). The findings at this early time may also be secondary higher microglial activation (Saito et al., 2014; Busche and
to the astrocyte reduction of glutamate synaptic recapture (Li Konnerth, 2016; Masuda et al., 2016; Shah et al., 2018). In
et al., 2009) and to the excessive amount of Aβ dimers, as the APP/PS1model there was an increase in the microglial
well as the Aβ1−40 monomers and dimers, which increase the marker F4/80, inflammatory cytokine MCP-1, and TUNNEL-
presynaptic release of glutamate (Fogel et al., 2014). Therefore, positive cells in the RGC layer (Ning et al., 2008). In addition,
a combination of both causes could increase residual glutamate the activated microglia may trigger a neuroinflammatory
levels, thereby promoting neuronal hyperactivity, which is a response (Perez et al., 2009) that could contribute to retinal
precursor to plaque formation (Busche and Konnerth, 2016; disorganization, as demonstrated by the functional alterations
Schedin-Weiss et al., 2020). present in the electroretinogram of the APP/PS1 mouse
In the APPNL−F/NL−F mice, the time between 9 and 15 months model (Krasodomska et al., 2010; Ramirez et al., 2017). In
of age was characterized by a slow and progressive tendency APPNL−F/NL−F mice, high levels of Aβ42 cause pathological Aβ
Frontiers in Aging Neuroscience | www.frontiersin.org 9 January 2021 | Volume 12 | Article 625642Salobrar-García et al. Retinal Changes in the APPNL−F/NL−F AD Model
deposits in the cerebral cortex and hippocampus, which are which show dysfunction of the RGCs and cones, as well as a
accompanied by increased neuroinflammation, with activation response from bipolar and other interneuronal cells in the inner
of the astrocytes and microglia surrounding the plaques from 6 retina in the APP/PS1 mice (Gupta et al., 2016), which could
months of age (Saito et al., 2014; Sasaguri et al., 2017; Schedin- support the diminished thickness of the retina detected in our
Weiss et al., 2020). In our study, Iba-1+ cells located in the APPNL−F/NL−F mice.
OPL and IPL were larger, with thicker and larger somas and It must be considered that this data should be corroborate
processes than in the WT group (Supplementary Figures 1D,F). in future works with molecular biological investigations that
In addition, in the GCL-NFL the Iba-1+ cells had a more confirm the findings in this model.
amoeboid appearance with thicker somas and retracted processes In summary, the first changes observed at 6 months of age
(Supplementary Figures 1D,F). In the APPNL−F/NL−F group included a significant thinning of the total retinal thickness in the
there was an increase in GFAP+ immunostaining with astrocytes outer temporal sector, and significant thinning of the RNFL in the
accumulating in areas where Iba-1+ cells also clustered nasal and inferior–temporal sectors, and mean global value. At
(Supplementary Figures 1E,F). When the microglia is activated, the later time points, which correspond to 9 and 12 months of age,
it undergoes morphological changes and it is transformed into there was a slow and progressive evolution toward thickening,
cells with an amoeboid appearance and phagocytic properties, with alternation of the thinned sectors, albeit without statistical
capable of releasing substances that induce an inflammatory significance. At 15 months of age, there was a significant thinning
response (Rowland and Shneider, 2001). These morphological of the total retinal thickness in the inner rings of temporal and
changes are gradual, ranging from the branched resting state inferior sectors and in the outer ring of inferior sector. At 17
to an intermediate, early activated or “primed” state, and months of age there were a widespread thickening of the total
finally reaching the amoeboid phagocytic state (Perry, 2004). retina, which was significant in the inferior and nasal sectors
In the “primed” state, the microglia increases its vigilance state of both the inner and outer ring. This thickening could be due
and shows a thickening of the cell body and its processes. to a neuroinflammatory process produced by astrocytes and
This change in the microglia can occur in response to microglia changes. Finally, at 20 months of age, the SD-OCT
primary factors derived from neurons or astrocytes. Astrogliosis showed generalized non-significant thinning of the RNFL and a
has also been observed in patients with AD in the GCL considerable thinning of the total retinal thickness, with greatest
(Grimaldi et al., 2018, 2019). All microglial and astroglial cell significance in the superior and temporal sectors of both the inner
changes, which may be associated with the neuroinflammatory and outer ring.
process, could result in the increased retinal thickness observed
in APPNL−F/NL−F group.
Finally, at 20 months of age, which is the latest time point CONCLUSIONS
we analyzed, the findings of SD-OCT show significant thinning
In conclusion, this diachronic study of the murine model
of the total retina thickness in the inner ring of nasal, inferior
of APPNL−F/NL−F of AD from 6 to 20 months of age
and temporal sectors and in the outer rings of superior and
provides significant information on the variations in total retinal
temporal sectors, contrary to where the thickening occurred at
thickness and RNFL measured by SD-OCT. In this model,
17 months, which could be the result of the generalized thinning
the retinal thickness showed thinning, possibly produced by
of the retina. It should be noted that the outer temporal sector,
neurodegeneration alternating with thickening that could be
the first sector with a significant change at 6 months, again
caused by deposits and neuroinflammation in some areas of
showed significant thinning being more pronounced than that
the retina.
at earlier time points. The RNFL showed generalized thinning
Retinal changes over time, similar to those observed in the
reaching statistical significance in nasal, supero-temporal sectors
human retina could be a biomarker for AD. The APPNL−F/NL−F
and mean global value. This situation could be a consequence
AD model may help us better understand the different retinal
of the neurodegeneration caused by high levels of Aβ and
changes during the progression of AD.
oligomers, which could be promoting neurotoxicity at this
time point (Schedin-Weiss et al., 2020). At the same time,
a decrease in retinal ganglion cell density due to apoptosis DATA AVAILABILITY STATEMENT
(Ning et al., 2008; Gupta et al., 2016), a decrease in the
axon density of the optic nerve, and a significant thinning of The datasets generated for this study can be found in online
the inner plexiform layer were found in the APP/PS1 model repositories. The names of the repository/repositories and
(Gupta et al., 2016). accession number(s) can be found at: https://figshare.com/s/
Notably, in the SD-OCT analysis from 6 to 20 months of age, b3303423bc9cac47ac09.
in the RNFL, the only sector that did not increase in thickness
was the superior temporal sector, while that with the most
fluctuations was the superio–nasal sector, which correlates with ETHICS STATEMENT
the temporal sectors in total retinal thickness because, again,
the sector that exhibited the least thickness variation was the The animal study was reviewed and approved by
outer temporal sector. These structural changes are consistent Ethics Committee on Animal Welfare of the University
with the functional findings of the electroretinogram (ERG), Complutense (PROEX No. 047/16).
Frontiers in Aging Neuroscience | www.frontiersin.org 10 January 2021 | Volume 12 | Article 625642Salobrar-García et al. Retinal Changes in the APPNL−F/NL−F AD Model
AUTHOR CONTRIBUTIONS and Innovation; and Leducq Foundation for Cardiovascular
Research TNE-19CVD01. IL-C was currently supported by a Pre-
ES-G, IL-C, RdH, and JR: conceptualization. ES-G, IL-C, LS-P, doctoral Fellowship (CT42/18-CT43/18) from the Complutense
JF-A, IB-F, VM, TCS, and TS: methodology. ES-G, IL-C, LS-P, University of Madrid. JF-A was currently supported by a Pre-
and JF-A: investigation. ES-G, IL-C, and LS-P: formal analysis. doctoral Fellowship (FPU17/01023) from the Spanish Ministry
AR and JS: project administration. AR, JS, MM, TCS, TS, RdH, of Science, Innovation, and Universities.
and JR: funding acquisition. ES-G, IL-C, RdH, and JR: writing—
original draft. ES-G, IL-C, AR, TS, JS, MM, RdH, and JR: ACKNOWLEDGMENTS
writing—review and editing. All authors read and approved the
final manuscript. The authors would like to thank Desireé Contreras for
technical assistance and Lucía García del Arco for the English
FUNDING style editing.
This research was funded by the Ophthalmological Network SUPPLEMENTARY MATERIAL
OFTARED (RD16/0008/0005) of the Institute of Health of Carlos
III of the Spanish Ministry of Science and Innovation; and The Supplementary Material for this article can be found
the Research Network RETIBRAIN (RED2018-102499-T) and online at: https://www.frontiersin.org/articles/10.3389/fnagi.
Grant PID2019-106581RB-I00 of the Spanish Ministry of Science 2020.625642/full#supplementary-material
REFERENCES mice and its immunomodulatory mechanisms. Exp. Eye Res. 135, 47–58.
doi: 10.1016/j.exer.2015.04.013
Andrews-Zwilling, Y., Bien-Ly, N., Xu, Q., Li, G., Bernardo, A., Yoon, S. Y., Garcia-Martin, E. S., Rojas, B., Ramirez, A. I., de Hoz, R., Salazar, J. J., Yubero, R.,
et al. (2010). Apolipoprotein E4 causes age- and Tau-dependent impairment et al. (2014). Macular thickness as a potential biomarker of mild Alzheimer’s
of GABAergic interneurons, leading to learning and memory deficits in mice. J. disease. Ophthalmology 121, 1149–1151. doi: 10.1016/j.ophtha.2013.12.023
Neurosci. 30, 13707–13717. doi: 10.1523/JNEUROSCI.4040-10.2010 Georgevsky, D., Retsas, S., Raoufi, N., Shimoni, O., and Golzan, S. M. (2019).
Busche, M. A., Eichhoff, G., Adelsberger, H., Abramowski, D., Wiederhold, K. A longitudinal assessment of retinal function and structure in the APP/PS1
H., Haass, C., et al. (2008). Clusters of hyperactive neurons near amyloid transgenic mouse model of Alzheimer’s disease. Transl. Neurodegener. 8:30.
plaques in a mouse model of Alzheimer’s disease. Science 321, 1686–1689. doi: 10.1186/s40035-019-0170-z
doi: 10.1126/science.1162844 Ghiso, J. A., Doudevski, I., Ritch, R., and Rostagno, A. A. (2013). Alzheimer’s
Busche, M. A., and Konnerth, A. (2016). Impairments of neural circuit disease and glaucoma: mechanistic similarities and differences. J. Glaucoma 22,
function in Alzheimer’s disease. Philos. Trans. R. Soc. B Biol. Sci. 371:1700. S36–S38. doi: 10.1097/IJG.0b013e3182934af6
doi: 10.1098/rstb.2015.0429 Grimaldi, A., Brighi, C., Peruzzi, G., Ragozzino, D., Bonanni, V., Limatola, C., et al.
Cash, D. M., Ridgway, G. R., Liang, Y., Ryan, N. S., Kinnunen, K. M., Yeatman, (2018). Inflammation, neurodegeneration and protein aggregation in the retina
T., et al. (2013). The pattern of atrophy in familial alzheimer disease: as ocular biomarkers for Alzheimer’s disease in the 3xTg-AD mouse model. Cell
volumetric MRI results from the DIAN study. Neurology 81, 1425–1433. Death Dis. 9:685. doi: 10.1038/s41419-018-0740-5
doi: 10.1212/WNL.0b013e3182a841c6 Grimaldi, A., Pediconi, N., Oieni, F., Pizzarelli, R., Rosito, M., Giubettini, M.,
Chiquita, S., Campos, E. J., Castelhano, J., Ribeiro, M., Sereno, J., Moreira, P. I., et al. (2019). Neuroinflammatory processes, A1 astrocyte activation and
et al. (2019). Retinal thinning of inner sub-layers is associated with cortical protein aggregation in the retina of Alzheimer’s disease patients, possible
atrophy in a mouse model of Alzheimer’s disease: a longitudinal multimodal biomarkers for early diagnosis. Front. Neurosci. 13:925. doi: 10.3389/fnins.2019.
in vivo study. Alzheimers Res. Ther. 11:90. doi: 10.1186/s13195-019-0542-8 00925
Dutescu, R. M., Li, Q. X., Crowston, J., Masters, C. L., Baird, P. N., and Culvenor, Gupta, V. K., Chitranshi, N., Gupta, V. B., Golzan, M., Dheer, Y., Wall, R.
J. G. (2009). Amyloid precursor protein processing and retinal pathology in Vander, et al. (2016). Amyloid β accumulation and inner retinal degenerative
mouse models of Alzheimer’s disease. Graefes Arch. Clin. Exp. Ophthalmol. 247, changes in Alzheimer’s disease transgenic mouse. Neurosci. Lett. 623, 52–56.
1213–1221. doi: 10.1007/s00417-009-1060-3 doi: 10.1016/j.neulet.2016.04.059
Duyckaerts, C., Potier, M. C., and Delatour, B. (2008). Alzheimer disease models Harper, D. J., Augustin, M., Lichtenegger, A., Gesperger, J., Himmel, T., Muck,
and human neuropathology: similarities and differences. Acta Neuropathol. M., et al. (2020). Retinal analysis of a mouse model of Alzheimer’s disease
115, 5–38. doi: 10.1007/s00401-007-0312-8 with multicontrast optical coherence tomography. Neurophotonics 7:015006.
Dysli, C., Enzmann, V., Sznitman, R., and Zinkernagel, M. S. (2015). Quantitative doi: 10.1117/1.nph.7.1.015006
analysis of mouse retinal layers using automated segmentation of spectral Iseri, P. K., Altinas, Ö., Tokay, T., and Yüksel, N. (2006). Relationship between
domain optical coherence tomography images. Transl. Vis. Sci. Technol. 4:9. cognitive impairment and retinal morphological and visual functional
doi: 10.1167/tvst.4.4.9 abnormalities in Alzheimer disease. J. Neuroophthalmol. 26, 18–24.
Ferguson, S. A., Sarkar, S., and Schmued, L. C. (2013). Longitudinal behavioral doi: 10.1097/01.wno.0000204645.56873.26
changes in the APP/PS1 transgenic Alzheimer’s disease model. Behav. Brain Res. Jáñez-Escalada, L., Jáñez-García, L., Salobrar-García, E., Santos-Mayo, A., de Hoz,
242, 125–134. doi: 10.1016/j.bbr.2012.12.055 R., Yubero, R., et al. (2019). Spatial analysis of thickness changes in ten retinal
Fogel, H., Frere, S., Segev, O., Bharill, S., Shapira, I., Gazit, N., et al. (2014). APP layers of Alzheimer’s disease patients based on optical coherence tomography.
homodimers transduce an amyloid-β-mediated increase in release probability Sci. Rep. 9:13000. doi: 10.1038/s41598-019-49353-0
at excitatory synapses. Cell Rep. 7, 1560–1576. doi: 10.1016/j.celrep.2014.04.024 Joly, S., Lamoureux, S., and Pernet, V. (2017). Nonamyloidogenic
Foidl, B., and Humpel, C. (2020). Can mouse models mimic sporadic Alzheimer’s processing of amyloid beta precursor protein is associated with
disease? Neural Regen. Res. 15, 401–406. doi: 10.4103/1673-5374.266046 retinal function improvement in aging male APPswe/PS11E9 mice.
Gao, L., Chen, X., Tang, Y., Zhao, J., Li, Q., Fan, X., et al. (2015). Neuroprotective Neurobiol. Aging 53, 181–191. doi: 10.1016/j.neurobiolaging.2017.
effect of memantine on the retinal ganglion cells of APPswe/PS1δE9 02.004
Frontiers in Aging Neuroscience | www.frontiersin.org 11 January 2021 | Volume 12 | Article 625642Salobrar-García et al. Retinal Changes in the APPNL−F/NL−F AD Model
Ko, F., Muthy, Z. A., Gallacher, J., Sudlow, C., Rees, G., Yang, Q., et al. (2018). Saito, T., Matsuba, Y., Mihira, N., Takano, J., Nilsson, P., Itohara, S., et al. (2014).
Association of retinal nerve fiber layer thinning with current and future Single app knock-in mouse models of Alzheimer’s disease. Nat. Neurosci. 17,
cognitive decline: a study using optical coherence tomography. JAMA Neurol. 661–663. doi: 10.1038/nn.3697
75, 1198–1205. doi: 10.1001/jamaneurol.2018.1578 Saito, T., and Saido, T. C. (2018). Neuroinflammation in mouse
Koronyo-Hamaoui, M., Koronyo, Y., Ljubimov, A. V., Miller, C. A., Ko, M. models of Alzheimer’s disease. Clin. Exp. Neuroimmunol. 9, 211–218.
K. H. K., Black, K. L., et al. (2011). Identification of amyloid plaques doi: 10.1111/cen3.12475
in retinas from Alzheimer’s patients and noninvasive in vivo optical Sakakibara, Y., Sekiya, M., Saito, T., Saido, T. C., and Iijima, K. M. (2018).
imaging of retinal plaques in a mouse model. Neuroimage 54, S204–S217. Cognitive and emotional alterations in app knock-in mouse models of Aβ
doi: 10.1016/j.neuroimage.2010.06.020 amyloidosis. BMC Neurosci. 19:46. doi: 10.1186/s12868-018-0446-8
Krasodomska, K., Lubiński, W., Potemkowski, A., and Honczarenko, K. (2010). Sakakibara, Y., Sekiya, M., Saito, T., Saido, T. C., and Iijima, K. M. (2019).
Pattern electroretinogram (PERG) and pattern visual evoked potential (PVEP) Amyloid-β plaque formation and reactive gliosis are required for induction of
in the early stages of Alzheimer’s disease. Doc. Ophthalmol. 121, 111–121. cognitive deficits in app knock-in mouse models of Alzheimer’s disease. BMC
doi: 10.1007/s10633-010-9238-x Neurosci. 20:13. doi: 10.1186/s12868-019-0496-6
Lad, E. M., Mukherjee, D., Stinnett, S. S., Cousins, S. W., Potter, G. G., Burke, Salobrar-García, E., de Hoz, R., Ramírez, A. I., López-Cuenca, I., Rojas,
J. R., et al. (2018). Evaluation of inner retinal layers as biomarkers in mild P., Vazirani, R., et al. (2019a). Changes in visual function and retinal
cognitive impairment to moderate Alzheimer’s disease. PLoS ONE 13:e0192646. structure in the progression of Alzheimer’s disease. PLoS ONE 14:e0220535.
doi: 10.1371/journal.pone.0192646 doi: 10.1371/journal.pone.0220535
Lee, J., Kim, D. E., Griffin, P., Sheehan, P. W., Kim, D. H., Musiek, E. S., et al. Salobrar-García, E., de Hoz, R., Ramírez, A. I., Salazar, J. J., Rojas, P.,
(2020). Inhibition of REV-ERBs stimulates microglial amyloid-beta clearance López- Cuenca, I., et al. (2019b). “Ocular exploration in the diagnosis
and reduces amyloid plaque deposition in the 5XFAD mouse model of and followup of the Alzheimer’s dementia,” in Alzheimer’s Disease,
Alzheimer’s disease. Aging Cell 19:13078. doi: 10.1111/acel.13078 ed T. Wisniewski (Brisbane, QLD: Codon Publications), 159–177.
Leinonen, H., Lipponen, A., Gurevicius, K., and Tanila, H. (2016). Normal doi: 10.15586/alzheimersdisease.2019.ch10
amplitude of electroretinography and visual evoked potential responses in Salobrar-García, E., de Hoz, R., Rojas, B., Ramirez, A. I., Salazar, J. J.,
AβPP/PS1 mice. J. Alzheimers Dis. 51, 21–26. doi: 10.3233/JAD-150798 Yubero, R., et al. (2015a). Ophthalmologic psychophysical tests support
Li, S., Hong, S., Shepardson, N. E., Walsh, D. M., Shankar, G. M., and Selkoe, D. OCT findings in mild Alzheimer’s disease. J. Ophthalmol. 2015:736949.
(2009). Soluble oligomers of amyloid β protein facilitate hippocampal long- doi: 10.1155/2015/736949
term depression by disrupting neuronal glutamate uptake. Neuron 62, 788–801. Salobrar-García, E., Hoyas, I., Leal, M., de Hoz, R., Rojas, B., Ramirez, A. I., et al.
doi: 10.1016/j.neuron.2009.05.012 (2015b). Analysis of retinal peripapillary segmentation in early Alzheimer’s
Masuda, A., Kobayashi, Y., Kogo, N., Saito, T., Saido, T. C., and disease patients. Biomed Res. Int. 2015, 1–8. doi: 10.1155/2015/636548
Itohara, S. (2016). Cognitive deficits in single app knock-in mouse Salobrar-García, E., Ramírez, A. I., de Hoz, R., Rojas, P., Salazar, J. J., Rojas, B., et al.
models. Neurobiol. Learn. Mem. 135, 73–82. doi: 10.1016/j.nlm.2016. (2016). “Chapter 15: The impact of the eye in dementia: the eye and its role
07.001 in diagnosis and follow-up,” in Update on Dementia, ed D. Moretti (London:
Nilsson, P., Saito, T., and Saido, T. C. (2014). New mouse model of Alzheimer’s. IntechOpen). doi: 10.5772/64490
ACS Chem. Neurosci. 5, 499–502. doi: 10.1021/cn500105p Salobrar-García, E., Rodrigues-Neves, A. C., Ramírez, A. I., de Hoz, R., Fernández-
Ning, A., Cui, J., To, E., Ashe, K. H., and Matsubara, J. (2008). Amyloid-β deposits Albarral, J. A., López-Cuenca, I., et al. (2020). Microglial activation in the retina
lead to retinal degeneration in a mouse model of Alzheimer disease. Investig. of a triple-transgenic Alzheimer’s disease mouse model (3xTg-AD). Int. J. Mol.
Opthalmology Vis. Sci. 49:5136. doi: 10.1167/iovs.08-1849 Sci. 21:816. doi: 10.3390/ijms21030816
Pan, X. D., Zhu, Y. G., Lin, N., Zhang, J., Ye, Q. Y., Huang, H. P., et al. Sasaguri, H., Nilsson, P., Hashimoto, S., Nagata, K., Saito, T., De Strooper, B., et al.
(2011). Microglial phagocytosis induced by fibrillar β-amyloid is attenuated by (2017). APP mouse models for Alzheimer’s disease preclinical studies . EMBO
oligomeric β-amyloid: implications for Alzheimer’s disease. Mol. Neurodegener. J. 36, 2473–2487. doi: 10.15252/embj.201797397
6:45. doi: 10.1186/1750-1326-6-45 Schedin-Weiss, S., Nilsson, P., Sandebring-Matton, A., Axenhus, M., Sekiguchi,
Perez, S. E., Lumayag, S., Kovacs, B., Mufson, E. J., and Xu, S. (2009). β-amyloid M., Saito, T., et al. (2020). Proteomics time-course study of app knock-in mice
deposition and functional impairment in the retina of the APPswe/PS11E9 reveals novel presymptomatic Aβ42-induced pathways to Alzheimer’s disease
transgenic mouse model of Alzheimer’s disease. Investig. Opthalmology Vis. Sci. pathology. J. Alzheimers Dis. 75, 1–15. doi: 10.3233/jad-200028
50, 793–800. doi: 10.1167/iovs.08-2384 Selkoe, D. J. (2001). Alzheimer’s disease: genes, proteins, and therapy. Physiol. Rev.
Perry, V. H. (2004). The influence of systemic inflammation on inflammation in 81, 741–766. doi: 10.1152/physrev.2001.81.2.741
the brain: implications for chronic neurodegenerative disease. Brain. Behav. Shah, D., Latif-Hernandez, A., De Strooper, B., Saito, T., Saido, T., Verhoye, M.,
Immun. 18, 407–413. doi: 10.1016/j.bbi.2004.01.004 et al. (2018). Spatial reversal learning defect coincides with hypersynchronous
Petrache, A. L., Rajulawalla, A., Shi, A., Wetzel, A., Saito, T., Saido, T. C., telencephalic BOLD functional connectivity in APPNL-F/NL-F knock-in mice.
et al. (2019). Aberrant excitatory-inhibitory synaptic mechanisms in entorhinal Sci. Rep. 8:6264. doi: 10.1038/s41598-018-24657-9
cortex microcircuits during the pathogenesis of Alzheimer’s disease. Cereb. Sharma, N., and Singh, A. N. (2016). Exploring biomarkers for Alzheimer’s
Cortex 29, 1–17. doi: 10.1093/cercor/bhz016 disease. J. Clin. Diagn. Res. 10, KE01–KE06. doi: 10.7860/JCDR/2016/1882
Polo, V., Rodrigo, M. J., Garcia-Martin, E., Otin, S., Larrosa, J. M., Fuertes, 8.8166
M. I., et al. (2017). Visual dysfunction and its correlation with retinal Shi, Z., Cao, X., Hu, J., Jiang, L., Mei, X., Zheng, H., et al. (2020). Retinal nerve
changes in patients with Alzheimer’s disease. Eye (Lond). 31, 1034–1041. fiber layer thickness is associated with hippocampus and lingual gyrus volumes
doi: 10.1038/eye.2017.23 in nondemented older adults. Prog. Neuropsychopharmacol. Biol. Psychiatry
Radde, R., Bolmont, T., Kaeser, S. A., Coomaraswamy, J., Lindau, D., Stoltze, L., 99:109824. doi: 10.1016/j.pnpbp.2019.109824
et al. (2006). Aβ42-driven cerebral amyloidosis in transgenic mice reveals early Shimazawa, M., Inokuchi, Y., Okuno, T., Nakajima, Y., Sakaguchi, G.,
and robust pathology. EMBO Rep. 7, 940–946. doi: 10.1038/sj.embor.7400784 Kato, A., et al. (2008). Reduced retinal function in amyloid precursor
Ramirez, A. I., de Hoz, R., Salobrar-Garcia, E., Salazar, J. J., Rojas, B., Ajoy, protein-over-expressing transgenic mice via attenuating glutamate-
D., et al. (2017). The role of microglia in retinal neurodegeneration: N-methyl-d-aspartate receptor signaling. J. Neurochem. 107, 279–290.
Alzheimer’s disease, Parkinson, and glaucoma. Front. Aging Neurosci. 9:214. doi: 10.1111/j.1471-4159.2008.05606.x
doi: 10.3389/fnagi.2017.00214 Song, G., Steelman, Z. A., Finkelstein, S., Yang, Z., Martin, L., Chu, K. K., et al.
Rochat, L., Billieux, J., Juillerat Van der Linden, A. C., Annoni, J. M., Zekry, D., (2020). Multimodal coherent imaging of retinal biomarkers of Alzheimer’s
Gold, G., et al. (2013). A multidimensional approach to impulsivity changes in disease in a mouse model. Sci. Rep. 10:7912. doi: 10.1038/s41598-020-6
mild Alzheimer’s disease and control participants: cognitive correlates. Cortex 4827-2
49, 90–100. doi: 10.1016/j.cortex.2011.08.004 Stevanovic, K., Yunus, A., Joly-Amado, A., Gordon, M., Morgan, D., Gulick, D.,
Rowland, L. P., and Shneider, N. A. (2001). Amyotrophic lateral sclerosis. N. Engl. et al. (2017). Disruption of normal circadian clock function in a mouse model
J. Med. 344, 1688–1700. doi: 10.1056/NEJM200105313442207 of tauopathy. Exp. Neurol. 294, 58–67. doi: 10.1016/j.expneurol.2017.04.015
Frontiers in Aging Neuroscience | www.frontiersin.org 12 January 2021 | Volume 12 | Article 625642You can also read