Age-specific survival of male Golden-cheeked Warblers on the Fort Hood Military Reservation, Texas
←
→
Page content transcription
If your browser does not render page correctly, please read the page content below
VOLUME 9, ISSUE 2, ARTICLE 4
Duarte, A., J. E. Hines, J. D. Nichols, J. S. Hatfield, and F. W. Weckerly. 2014. Age-specific survival of male Golden-cheeked Warblers on the Fort
Hood Military Reservation, Texas. Avian Conservation and Ecology 9(2): 4. http://dx.doi.org/10.5751/ACE-00693-090204
Copyright © 2014 by the author(s). Published here under license by the Resilience Alliance.

Research Paper

Age-specific survival of male Golden-cheeked Warblers on the Fort
Hood Military Reservation, Texas
Adam Duarte 1, James E. Hines 2, James D. Nichols 2, Jeff S. Hatfield 2 and Floyd W. Weckerly 1
1
  Department of Biology, Texas State University, 2U.S. Geological Survey Patuxent Wildlife Research Center

ABSTRACT. Population models are essential components of large-scale conservation and management plans for the federally
endangered Golden-cheeked Warbler (Setophaga chrysoparia; hereafter GCWA). However, existing models are based on vital rate
estimates calculated using relatively small data sets that are now more than a decade old. We estimated more current, precise adult and
juvenile apparent survival (Φ) probabilities and their associated variances for male GCWAs. In addition to providing estimates for use
in population modeling, we tested hypotheses about spatial and temporal variation in Φ. We assessed whether a linear trend in Φ or a
change in the overall mean Φ corresponded to an observed increase in GCWA abundance during 1992-2000 and if Φ varied among
study plots. To accomplish these objectives, we analyzed long-term GCWA capture-resight data from 1992 through 2011, collected
across seven study plots on the Fort Hood Military Reservation using a Cormack-Jolly-Seber model structure within program MARK.
We also estimated Φ process and sampling variances using a variance-components approach. Our results did not provide evidence of
site-specific variation in adult Φ on the installation. Because of a lack of data, we could not assess whether juvenile Φ varied spatially.
We did not detect a strong temporal association between GCWA abundance and Φ. Mean estimates of Φ for adult and juvenile male
GCWAs for all years analyzed were 0.47 with a process variance of 0.0120 and a sampling variance of 0.0113 and 0.28 with a process
variance of 0.0076 and a sampling variance of 0.0149, respectively. Although juvenile Φ did not differ greatly from previous estimates,
our adult Φ estimate suggests previous GCWA population models were overly optimistic with respect to adult survival. These updated
Φ probabilities and their associated variances will be incorporated into new population models to assist with GCWA conservation
decision making.

Survie en fonction de l’âge des Parulines à dos noir mâles sur la réserve militaire de Fort Hood, Texas
RÉSUMÉ. Les modèles de population sont des éléments essentiels des plans de gestion et de conservation à grande échelle pour la
Paruline à dos noir (Setophaga chrysoparia; abrégée PADN ci-dessous), désignée « menacée » par le gouvernement fédéral étatsunien.
Toutefois, les modèles existants sont fondés sur des estimations de taux vitaux calculées à partir d’échantillons relativement petits qui
datent maintenant de plus d’une décennie. Nous avons actualisé et précisé la probabilité de survie apparente (Φ) adulte et juvénile et
calculé les variances associées pour les mâles PADN. En plus de ces estimations destinées à la modélisation des populations, nous avons
testé les hypothèses de variations spatiale et temporelle de Φ. Nous avons évalué si une tendance linéaire de Φ ou un changement de Φ
moyen correspondait à une augmentation réelle du nombre de PADN de 1992 à 2000, et si Φ avait varié entre les parcelles échantillonnées.
Pour atteindre nos objectifs, nous avons analysé les données de capture-réobservation de PADN de 1992 à 2011, récoltées dans sept
parcelles situées sur la réserve militaire de Fort Hood, Texas, au moyen d’une structure de modèle de Cormack-Jolly-Seber avec le
programme MARK. Nous avons aussi estimé les composantes de la variance de Φ associées au processus et à l’échantillonnage en les
partitionnant. Nos résultats n’ont pas confirmé qu’il existait une variation du Φ adulte propre au site. À cause du petit échantillon de
données, nous n’avons pas pu déterminer si le Φ juvénile avait varié spatialement. Nous n’avons pas détecté d’association temporelle
forte entre le nombre de PADN et Φ. L’estimation moyenne de Φ s’élevait à 0,47 pour les mâles adultes, avec une variance relative au
processus de 0,0120 et une variance relative à l’échantillonnage de 0,0113, et atteignait 0,28 pour les mâles juvéniles, avec une variance
relative au processus de 0,0076 et une variance relative à l’échantillonnage de 0,0149. Alors que notre estimation de Φ juvénile ne diffère
pas grandement des estimations antérieures, notre estimation de Φ adulte indique que les modèles précédents de population pour la
PADN étaient trop optimistes quant à la survie des adultes. Ces probabilités actualisées de Φ et leurs variances seront incluses dans de
nouveaux modèles de population afin de contribuer à la prise de décision touchant la conservation de la PADN.
Key Words: adult survival; capture-resight; Golden-cheeked Warbler; juvenile survival; MARK; process variance; Setophaga chrysoparia;
variance components

INTRODUCTION                                                                  (Pulich 1976). Motivated by concerns about the GCWA’s
The Golden-cheeked Warbler (Setophaga chrysoparia; hereafter                  restricted breeding range and the perceived ongoing loss of
GCWA) is a neotropical migrant passerine that breeds almost                   breeding habitat, the species was listed as endangered by the U.
exclusively in the mature oak-juniper woodlands of central Texas              S. federal government in 1990 (USFWS 1990; R. Wahl, D. D.

Address of Correspondent: Adam Duarte, Department of Biology, Texas State University, 601 University Drive, San Marcos, TX, 78666 USA,
ad1401@txstate.edu

Avian Conservation and Ecology 9(2): 4
http://www.ace-eco.org/vol9/iss2/art4/
Diamond, and D. Shaw, unpublished manuscript). Following the County 2011). However, return rates do not account for imperfect
species’ federal listing, a recovery plan was produced that detection and are notorious for being negatively biased (Martin
described the species’ basic biology and various threats, separated et al. 1995).
the GCWA’s breeding range into eight regions to manage the
Our aim was to update HY and AHY male GCWA annual Φ
species’ recovery process, and established recovery criteria that
estimates, and their associated variances, using long-term
must be met before the GCWA can be downlisted (USFWS 1992).
capture-resight data collected on seven plots within the Fort Hood
Given that the criteria to downlist the species include “sufficient Military Reservation (hereafter Fort Hood) to use in future
breeding habitat has been protected to ensure the continued population models. Unlike previous studies, we had the
existence of at least one viable, self-sustaining population in each opportunity to test for spatial variability in GCWA Φ on the
of 8 regions outlined in the plan” (USFWS 1992:iv), it is no installation. We hypothesized that GCWA Φ would vary among
surprise that population models are currently being used to assist study plots. Our justification for expecting spatial variability in Φ
in GCWA conservation efforts (USFWS 1996, Alldredge et al. was related to differences in emigration rates because of habitat
2004, Vaillant et al. 2004, Horne et al. 2011). Natural resource structure within each plot, rather than carryover effects of
agencies are currently operating under the population viability breeding habitat on annual mortality. That is, individuals might
analysis (PVA) results of Alldredge et al. (2004). Their model choose to breed in alternate locations in subsequent years if the
suggests that enough good-quality breeding habitat in each of the habitat structure within a given plot was not amenable to
eight regions with the potential to support a carrying capacity of successful territories, i.e., territories that fledge young, which
3000 breeding pairs is required to ensure a low probability of could result in spatial differences in Φ estimates. Furthermore,
extinction for GCWAs over the next 100 years. Fortunately, the long-term point-count data collected on the installation suggest
amount of breeding habitat currently available is well above this a positive trend in GCWA densities from 1992 to 2001, after which
threshold, because it supports an estimated 263,339 (95% the population began to show evidence of stabilization (Fig 3.2
confidence interval = 223,927-302,620) male GCWAs across the in Peak 2011a). However, pairing success, territory success, nest
entire breeding range (Mathewson et al. 2012). However, the survival, and return-rate data do not indicate temporal trends
current amount of breeding habitat on publicly owned property (reviewed in Groce et al. 2010). Golden-cheeked Warbler Φ might
in each region outlined in the species’ recovery plan does not be directly related to the observed population dynamics in at least
support that many male GCWAs (Hatfield et al. 2012a), and two nonmutually exclusive ways. Apparent survival might be
breeding habitat located on privately owned property is not inversely related to abundance because of density dependence.
certain to be protected and available in the future (Groce et al. Also, a larger overall mean Φ during the population increase,
2010, Duarte et al. 2013). followed by a lower mean Φ during the population stabilization
period, might be driving the observed population dynamics. Thus,
Fundamental to projecting population dynamics are up-to-date
we tested two hypotheses concerning temporal variability in
estimates of abundance and vital rates. In the case of territorial
GCWA Φ on the installation: (1) a negative linear trend in Φ
songbirds such as the GCWA, females are more difficult to detect
corresponds to the observed increase in GCWA densities; and (2)
than males. Consequently, population parameters are often
the overall mean Φ during intervals between 1992 and 2001 was
reported for male birds, and population models focus on the male
greater than the overall mean Φ during intervals between 2001
segment of the species. Previous GCWA PVAs used vital rate
and 2011.
estimates that are now more than 10 years old, did not have access
to a robust abundance estimate for the initial starting point of
abundances at year one of the simulations, did not incorporate METHODS
geographic variability in reproductive success, and only modeled
a portion of the species’ breeding range. Thus, a new PVA is
Sampling protocol
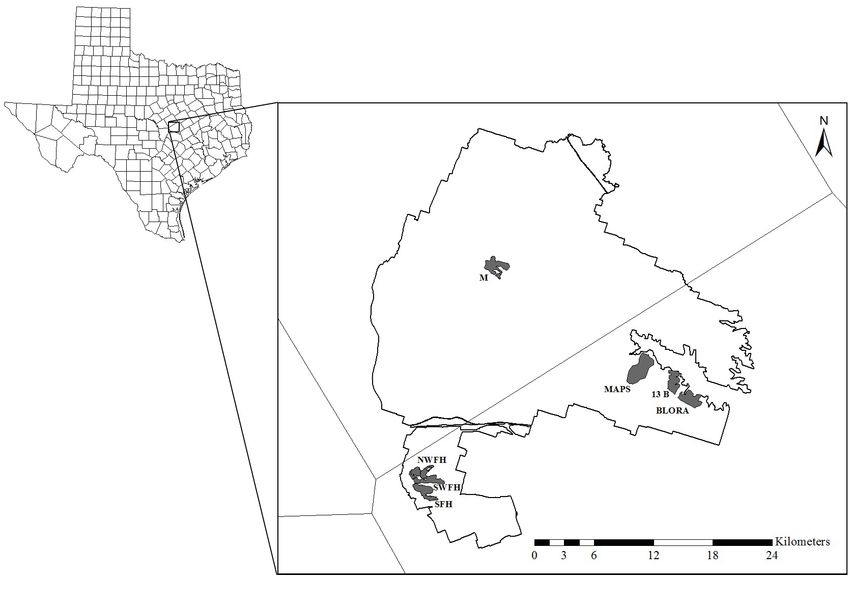
Field work for this study was conducted on Fort Hood, a 87,890-
warranted and might significantly alter our outlook on GCWA
hectare contiguous parcel of land located in Bell and Coryell
viability. In recent years much effort has been expended to update
counties, central Texas (Fig. 1). Approximately 21,422 hectares
our knowledge on GCWA abundance and reproduction both at
of GCWA breeding habitat are within the boundaries of Fort
the local and range-wide scale (e.g., abundance, Hunt et al. 2012,
Hood (Hayden et al. 2001). Baccus et al. (2007) provide a detailed
Mathewson et al. 2012, Collier et al. 2013, Peak and Thompson
description of the environments on Fort Hood and the protocols
2013, Warren et al. 2013; reproduction, Campomizzi et al. 2012,
used to monitor GCWAs. Briefly, from April to June GCWAs
Klassen et al. 2012, Marshall et al. 2013). Apparent survival (Φ)
were captured in mist nets using playback recordings of
has been estimated for juvenile (hatch year, HY) and adult (after
conspecific songs as an attractant. Then age and sex were
hatch year, AHY) male GCWAs while accounting for imperfect
determined for each bird using methods described by Pyle (1997)
detection in the past, where Φ is the probability that an individual
and Peak and Lusk (2011). All birds captured were uniquely
remains alive and returns to the study area from one sampling
marked using both U.S. Geological Survey aluminum bands and
occasion to the next. Still, these estimates were derived from
a distinctive combination of plastic, colored leg bands.
studies consisting of only five years of data collected on a single
Monitoring efforts occurred every five days for at least two hours
study plot, with the 2001 field season being the most recent data
in an effort to resight birds that were marked in previous years,
analyzed (USFWS 1996, Alldredge et al. 2004). In the absence of
calculate density estimates via spot mapping, and collect
up-to-date robust Φ estimates, GCWA return rates, i.e., the
behavioral and reproductive data (Peak 2011b).
proportion of marked individuals from one year that are resighted
in subsequent years, are often used by resource agencies as an From 1991 to 2011, 4035 GCWAs, both male and female birds of
indication of annual survival (Peak and Grigsby 2011, Travis different age classes, were marked by various entities underAvian Conservation and Ecology 9(2): 4
http://www.ace-eco.org/vol9/iss2/art4/
Table 1. Years and study plots where Golden-cheeked Warbler (Setophaga chrysoparia) surveys were conducted by the Nature
Conservancy and Monitoring Avian Productivity and Survivorship programs on the Fort Hood Military Reservation, Texas, USA.
Banding and monitoring efforts were conducted from April through June. Table excludes 1991 because study plots were not delineated
until 1992.
Year
Study Plot 1992 1993 1994 1995 1996 1997 1998 1999 2000 2001 2002 2003 2004 2005 2006 2007 2008 2009 2010 2011
Thirteen B X X X X X X X X X X X X X X X X X X X X
Monitoring Avian X X X X X X X X X X X X X X
Productivity and
Survivorship
North West Fort Hood X X X X X X X X X
South West Fort Hood X X X X X X
Belton Lake Outdoor X X X X X X
Recreation Area
Manning X X X X X X X X X X X X
South Fort Hood X X X
all plots across the entire time series. The Monitoring Avian
Fig. 1. Map of the Fort Hood Military Reservation, Texas, Productivity and Survivorship program was initiated on Fort
USA, and study plots where Golden-cheeked Warbler Hood in 1995 and conducted annual surveys for marked birds in
(Setophaga chrysoparia) capture-resight programs occurred for the same plot through the 2008 breeding season. Thus, we used
at least three years. 13 B is Thirteen B, BLORA is Belton Lake capture-resight data from the seven study plots that were
Outdoor Recreation Area, SFH is South Fort Hood, M is monitored by these two programs for at least three years (Table
Manning, NWFH is North West Fort Hood, SWFH is South 1). Notably, once a study plot was established it was surveyed
West Fort Hood, and MAPS is Monitoring Avian Productivity annually until monitoring ceased on that particular plot; that is,
and Survivorship. sampling intervals were all one year.
Survival analyses
A Cormack-Jolly-Seber model structure was used to estimate Φ
(Cormack 1964, Jolly 1965, Seber 1965) with the age-specific
extension of Pollock (1981) for HY birds. During preliminary
analyses we determined that six of the seven study plots had an
insufficient number of HY captures and subsequent resightings.
The exception was study plot Thirteen B. Consequently, two
separate analyses were conducted to estimate HY and AHY Φ.
The AHY Φ analysis included capture-resight data from 1434
AHY male GCWAs captured from 1992 to 2011 on seven study
plots. These data were insufficient to accommodate interaction
terms when modeling sources of variation. Consequently, we
began by fitting a model where Φ and resight probability (p) both
varied as a function of the additive effects of study plot and time
(model sp+t). We then fit a series of models in which Φ and p
varied among study plots (model sp), over time (model t), or
neither (model .). Further, we used the basic structure of the best-
different programs to achieve several objectives. However, a supported model and constrained Φ to be constant across years
minimum of three years of capture-resight data are needed to for two sets of years; i.e., we included a separate β parameter to
calculate one estimate of Φ using a fully time-specific model test for differences in Φ during intervals between 1992-2001 and
(Pollock et al. 1990), and only the Nature Conservancy, in 2001-2011 (model dif). If there was a difference in mean Φ during
collaboration with Fort Hood, and the Monitoring Avian the two intervals, the separate β parameter would be different than
Productivity and Survivorship programs surveyed the same plots zero. We did not test for linear trends in Φ for this analysis because
for at least three years (R. Peak, U.S. Army Garrison-Fort Hood, of the inconsistencies in years in which study plots were
Directorate of Public Works, personal communication). Although monitored. For all AHY models, resight probabilities were
the Nature Conservancy program initiated GCWA capture- constrained to zero for years in which a particular study plot was
resight efforts on Fort Hood in 1991, the program did not delineate not monitored because there cannot be a resighting of a marked
any study plots until 1992. Since 1992, the Nature Conservancy individual in a plot that was not surveyed in a given year.
program has delineated six study plots to monitor GCWA
population parameters. However, surveys were not conducted on Because of a lack of data in subsequent years, the HY Φ analysis
only included capture-resight data from 132 HY and 233 AHYAvian Conservation and Ecology 9(2): 4
http://www.ace-eco.org/vol9/iss2/art4/
male GCWAs captured from 1992 to 2000 on study plot Thirteen RESULTS
B. There were insufficient data to estimate one of the HY Φ A total of 17 models were included in the original candidate model
parameters when fitting a model with an interaction term between set for the AHY Φ analysis (Table 2). The goodness-of-fit test
age and time. Thus, we began by fitting a model where Φ varied suggested the most general model did not fit the data well (P <
with age and time additively (model a+t) and p varied across time 0.001), and ĉ was estimated to be 1.25. The best-supported model
(model t). We then fit models where Φ varied with age (model a), in the original candidate model set was model Φt, psp. In this model,
time (model t), or neither (model .), and also fit models where p Φ varied across time, but did not differ among study plots. Resight
was constant (model .). To test for a linear trend in Φ, we used the probabilities varied among study plots but were constant across
basic structure of the best-supported model and constrained Φ to time. Estimates of Φ ranged from 0.25 to 0.75 (Fig. 2), and
be different between age classes, with Φ for each age class having estimates of p ranged from 0.32 to 1, depending on the study plot.
a linear trend across time (model a+T). In the model that tested for temporal differences in the mean Φ,
A variance-components approach was used to decompose the i.e., Φdif, psp, the β parameter reflecting the difference between the
temporal variance of the Φ point estimates into components two periods was estimated at 0.40 (95% confidence interval =
associated with process variance and sampling variance 0.19-0.61). Thus, this model suggested the mean Φ during the
(Burnham and White 2002). It is suggested that this type of interval 1992-2001 was 10% higher than mean Φ during the
analysis be applied to the global model to estimate variance interval 2001-2011. However, this model had little support,
components for Φ using a model that does not have many ranking tenth overall. Using variance components, we estimated
constraints. We were interested in estimating a single overall mean that the overall mean ± SE AHY Φ was 0.47 ± 0.02, with process
Φ with its associated variances to use in GCWA population and sampling variances of 0.0120 and 0.0113, respectively. The
models. Consequently, we used an intercept variance-components CV for AHY Φ was 0.23.
model. Notably, an intercept model assumes that the underlying
Φ probabilities are distributed randomly around a central mean Table 2. Model selection statistics for after-hatch-year male
over time. As suggested, we applied the variance-components Golden-cheeked Warbler (Setophaga chrysoparia) capture-resight
approach to the global models for each age-class analysis, i.e., data from seven study plots on the Fort Hood Military
AHY analysis Φsp*t, psp*t, and HY analysis Φa*t, pt. All inestimable Reservation, Texas, USA, 1992-2011. Model selection was
parameters were excluded. To make direct comparisons corrected for overdispersion and based on change in Akaike’s
concerning the amount of variability in Φ, we used the mean and Information Criterion corrected for small sample size (ΔQAICc)
process variance Φ estimates to calculate the coefficient of and QAICc weights (wi) such that the best-supported model had
variation (CV) of Φ for each age class. the smallest ΔQAICc and the largest wi. Φ - apparent survival
Model selection was based on change in Akaike’s Information probability, p - resight probability, sp+t - study plot and time, sp
Criterion corrected for small sample size (ΔAICc) and AICc - study plot, t - time, . - constant, dif - separate β parameter for
weights (wi), such that the best-supported model had a value of intervals during 1992-2001.
zero for ΔAICc and the largest wi (Burnham and Anderson 2002).
Using a parametric-bootstrap approach, the goodness of fit of Model ΔQAICc wi K QDev
the most general model, i.e., AHY analysis Φsp+t, psp+t, and HY Φt, psp 0.00 0.87 26 388.70
analysis Φa+t, pt, was tested by simulating 1000 data sets, Φsp+t, psp 4.01 0.12 32 380.37
computing the deviance for each, and then comparing the Φt, psp+t 10.12 0.01 43 363.70
observed deviance with the distribution of deviances from the Φsp+t, p. 14.56 0.00 26 403.26
bootstrap to estimate the probability of observing a deviance as Φ., psp+t 15.04 0.00 26 403.74
extreme as we did. If there was evidence of a lack of fit, a variance- Φt, p. 15.35 0.00 20 416.31
inflation factor (ĉ) was estimated by dividing the observed Φsp+t, psp+t 17.64 0.00 49 358.69
deviance by the average simulated deviance. All analyses were Φsp+t, pt 18.01 0.00 43 371.59
conducted using program MARK (White and Burnham 1999). Φt, pt 18.10 0.00 37 384.14
Φdif, psp 18.97 0.00 9 442.24
After completing the process of initial model selection, we decided Φ., pt 19.82 0.00 20 420.78
to investigate the potential importance of a phenomenon that was Φsp, pt 20.21 0.00 26 408.91
not incorporated into the original model set for AHY birds. One Φsp, psp+t 23.65 0.00 32 400.02
possible cause of spatial variability in Φ, i.e., individuals might Φ., psp 30.75 0.00 8 456.03
choose to breed in alternate locations in subsequent years, implies Φsp, psp 40.58 0.00 14 453.73
that transient individuals might be prevalent. However, Φ., p. 47.81 0.00 2 485.15
individuals might be choosing to breed in alternate locations in Φsp, p. 49.57 0.00 8 474.86
subsequent years at the same rate across study plots. To test this
possibility, we used the basic structure of the model in the original As described above, we took the basic structure of the low-AIC
model set that was best supported and set apparent survival in model for the AHY analysis and added transient parameters in
the first interval after initial capture (Φ1) to differ from apparent three different ways. The transient model (Φ1+t, Φ2t, psp) actually
survival during subsequent intervals (Φ2; see Pradel et al. 1997), had a lower AICc, by 3.88 AICc units, than model Φt, psp. The
considering three different scenarios: (1) Φ1 was constant across transient models dealt with the possibility of transient birds by
the time series (model Φ1., Φ2t); (2) Φ1 varied across time (model allowing Φ1 to differ from, i.e., be smaller than, Φ2. However, the
Φ1*t, Φ2t); and (3) Φ1 varied across time, but paralleled Φ2 (model a posteriori transient models estimated higher, not lower, Φ
Φ1+t, Φ2t). probabilities for individuals that were newly marked; estimatesAvian Conservation and Ecology 9(2): 4
http://www.ace-eco.org/vol9/iss2/art4/
were 5% to 7% higher. These estimates were not consistent with
the existence of transients. We could think of no a posteriori Fig. 2. Annual probabilities of apparent survival for hatch-year
hypothesis for this pattern in Φ that was biologically relevant, so (HY-open circles) and after-hatch-year (AHY-solid circles)
we based our inferences on the original model set shown in Table male Golden-cheeked Warblers (Setophaga chrysoparia) on the
2. Fort Hood Military Reservation, Texas, USA. For AHY birds,
apparent survival (Φ) varied across time, and resight probability
For the HY Φ analysis, Φ varied additively between age classes
(p) differed among study plots (Φ t, p sp). For HY birds, Φ varied
and across time, but p was constant across time (Table 3). The
additively between age classes and across time, and p was
goodness-of-fit test suggested that the most general model fit the
constant (Φ a+t, p .). Error bars are 95% confidence intervals.
data (P = 0.11). Thus, we assumed ĉ was equal to one. Estimated
HY Φ probabilities ranged from 0.17 to 0.46 (Fig. 2). For this
analysis, the mean estimated AHY Φ was 0.54 and estimated p
was 0.84. The model that constrained Φ to vary linearly across
time, i.e., Φa+t, p., suggested there was a negative linear trend in
AHY and HY Φ probabilities from 1992 to 2000. This model,
however, ranked third overall, with a weight of only 0.06. Using
variance components, we estimated that the overall mean ± SE
HY Φ was 0.28 ± 0.06, with process and sampling variances of
0.0076 and 0.0149, respectively. The CV for HY Φ was 0.31.
Table 3. Model selection statistics for capture-resight data for
hatch-year and after-hatch-year male Golden-cheeked Warblers
(Setophaga chrysoparia) from study plot Thirteen B, Fort Hood
Military Reservation, Texas, USA, 1992-2000. Model selection
was based on change in Akaike’s Information Criterion corrected
for small sample size (ΔAICc) and AICc weights (wi) such that the
best-supported model had the smallest ΔAICc and the largest wi. 2001 and 2011 in the AHY analysis. Why these patterns emerged
Φ - apparent survival probability, p - resight probability, a+t - age is unclear, because these estimates were the product of both true
and time, a - age , t - time, . - constant, T - linear trend. survival and fidelity, which is the complement of permanent
emigration. It is possible that as GCWA densities increased on
Fort Hood and approached carrying capacity, GCWA dispersal
Model ΔAICc wi K Dev rates increased as available suitable habitat became more limited;
Φa+t, p. 0.00 0.78 10 117.87 that carryover effects from GCWA densities during the breeding
Φa, p. 3.36 0.15 3 135.62 season were impacting true survival; or that a change in overall
Φa+T, p. 5.21 0.06 4 135.43 mean Φ was driving the observed GCWA population dynamics.
Φa+t, pt 8.31 0.01 16 113.52 However, it is also possible that these patterns were a result of a
Φa, pt 12.90 0.00 10 130.77 few years with inclement weather conditions during migration
Φ., p. 22.19 0.00 2 156.46
that caused Φ to fluctuate in response to increased mortality
Φt, pt 30.26 0.00 15 137.60
(Stokke et al. 2005), and/or caused birds to be blown off course
Φ., pt 32.12 0.00 9 152.07
and establish territories in alternate locations. Regardless, these
models had little support compared with models with time-
varying Φ that were not constrained to a trend.
DISCUSSION We predicted that GCWA Φ would vary spatially because of
We present, to our knowledge, the first detailed analysis to
potential differences in emigration rates due to habitat structure
estimate Φ for the Golden-cheeked Warbler. Using long-term male
within each plot. Differences in habitat patch area, landscape
GCWA capture-resight data collected within multiple study plots
composition, i.e., percentage of woodlands within a 400-meter
on Fort Hood, we were able to test for spatial and temporal
radius, woodland edge, and woodland height have been linked to
patterns in AHY and HY Φ, and calculate more precise Φ
variation in GCWA occupancy and abundance across Fort Hood
estimates and their process and sampling variances. We found
(Collier et al. 2013, Farrell et al. 2013, Peak and Thompson 2013),
little evidence linking the observed GCWA population dynamics
and therefore support this possibility. However, the results provide
to temporal patterns in Φ. Nor did we detect spatial variation in
no evidence that AHY Φ is site specific. Whether or not HY Φ
Φ. The overall mean HY Φ estimate did not differ greatly from
varies spatially on Fort Hood is yet to be determined because of
previous estimates for the species. However, the lower overall
insufficient data in this study. These study plots are primarily used
mean AHY Φ estimate reported herein suggests that previous
to monitor GCWA territory size and density, age structure, mated
GCWA PVAs might have been overly optimistic with respect to
status, the proportion of territories producing at least one
AHY Φ.
fledgling, and nest survival (Peak and Grigsby 2011). Thus, we
A negative linear trend in Φ from 1992 to 2000 was detected using suspect that the lack of spatial variability in AHY Φ was primarily
a model that incorporated a linear trend in the HY analysis, and because study plots were selected based on those areas having
there was evidence that the mean Φ during intervals between 1992 high densities of GCWAs outside the live-fire training areas, as
and 2001 was higher than the mean Φ during intervals between opposed to randomly selected sites across the installation;Avian Conservation and Ecology 9(2): 4
http://www.ace-eco.org/vol9/iss2/art4/
therefore, they were areas with comparable GCWA habitats. approximate 95% confidence interval, i.e., the SE of ±0.06. All
Conversely, the apparent lack of spatial differences in Φ might be three of these HY Φ estimates are well above the HY Φ mean ±
a result of low discriminatory ability of the model selection SE estimates reported for Prothonotary Warblers, which are 0.06
procedure (the analog of low statistical power to detect a ± 0.01 and 0.11 ± 0.01, with and without cowbird nestmates,
difference; see Morrison et al. 2004). A retrospective overlay of respectively (McKim-Louder et al. 2013). However, Φ estimates
study-plot boundaries and GCWA habitat (as delineated by are not directly comparable between studies. McKim-Louder et
Diamond et al. 2010) suggests the first possibility might be true. al. (2013) banded young in nest boxes before fledging occurred
However, fine-scale vegetation cover and height data are not and had both males and females in their analysis, and Φ for HY
readily available to test these predictions. birds can be related to an assortment of factors including
differences in dispersal patterns among species and/or
Our three models that tested for transient AHY GCWAs provided
subpopulations. We currently do not have the data to assess
no evidence that transients were a part of the banded samples.
whether the relatively high HY GCWA Φ estimates are an artifact
Current observational reports concerning movement of banded
of the individual study plot, are an outcome of the sampling
GCWAs on Fort Hood support the possibility that there are no,
protocol used to band individuals, or are reasonable for this
or negligible numbers of, transient AHY GCWAs in these
particular species.
capture-resight data. In the past decade no movement among
study plots has been documented, and only two AHY male birds The temporal variance of the Φ point estimates consists of both
were ever resighted off a study plot. These birds were found process and sampling components. Process variance is the true
immediately outside the study-plot boundary where they were temporal variance in underlying Φ probabilities. On the other
banded in the previous year (R. Peak, personal communication). hand, sampling variance is a measure of the uncertainty in the
However, robust movement data are lacking for the species. estimates of Φ that can be attributed to the sampling process and
the inability to capture and detect all animals at all occasions.
The mean ± SE annual Φ for male AHY GCWAs was estimated
When the temporal variance of the Φ point estimates is not
to be 0.47 ± 0.02, which is within the range of annual male AHY
decomposed into process and sampling variance components, the
Φ estimates reported for other warbler species such as the Black-
perceived variability in Φ over time is positively biased as an
throated Blue Warbler (S. caerulescens) at 0.51 ± 0.03 and 0.43
estimate of process variance, which will artificially increase the
± 0.04 (Sillett and Holmes 2002); the American Yellow Warbler
risk of extinction for species if incorporated directly into PVAs
(S. petechia) at 0.49 ± 0.03 (Climburg et al. 2002) and a mean of
(Gould and Nichols 1998). Further, incorporating both process
0.48-0.60 (Mazerolle et al. 2005); Swainson’s Warbler
and sampling variances into PVAs in an appropriate manner
(Limnothlypis swainsonii) at a mean of ~0.30-0.80 depending on
might have a significant impact on projected population dynamics
body condition (Bensen and Bednarz 2010); the Prothonotary
and, by extension, considerably alter conservation decision
Warbler (Protonotaria citrea) at 0.44 ± 0.07 (Calvert et al. 2010);
making (McGowan et al. 2011). Thus, although these Φ variances,
and the Blackburnian (S. fusca) and Black-throated Green
i.e., process and sampling variance, are often not reported, these
Warblers (S. virens) at 0.48 ± 0.09 (Zitske et al. 2011). However,
estimates are critical for projecting population dynamics of any
our AHY Φ estimate was 16% lower than what was reported for
species. Herein, sampling variance accounted for 48.5% of the
this species in previous Φ analyses. USFWS (1996) analyzed
total variance of AHY Φ and 66.2% of the total variance of HY
capture-resight data collected by the Nature Conservancy
Φ, which illustrates the importance of partitioning the total
program from 1991 to 1995, and reported a mean AHY Φ estimate
variance into process and sampling components to gain a better
of 0.57. We chose to omit data collected in 1991 because study-
understanding of population dynamics. Our CV estimates
plot boundaries were not established until 1992. Thus, individuals
indicated that HY Φ had a greater year-to-year variation than
captured in 1991 had little to no chance of being resighted in
AHY Φ. This finding is consistent with the conclusions of Gould
subsequent years (R. Peak, personal communication). We
and Nichols (1998) when they investigated age-specific differences
estimated the mean AHY Φ from 1992 to 1995 as 0.65. Alldredge
in temporal variability of Mallard Duck (Anas platyrhynchos) Φ.
et al. (2004) reported a mean AHY Φ of 0.56 when analyzing
This pattern might be coupled with the experience and/or learned
capture-resight data collected on Fort Hood from 1997 to 2001.
behavior of AHY birds, allowing AHY birds to better compensate
We estimated a mean AHY Φ of 0.55 for the same interval, i.e.,
during adverse environmental conditions and reduce the year-to-
1997 to 2001. The differences in Φ estimates were likely because
year variation in Φ (Gould and Nichols 1998). We analyzed
we excluded data from 1991 when comparing our estimates with
longer-term capture-resight data than both USFWS (1996) and
those of USFWS (1996) and because we included data from
Alldredge et al. (2004), which should result in more precise
different study plots across a greater number of years.
estimates of variance. However, our estimate of process variance
Because of a lack of capture-resight data, HY Φ probabilities for for AHY Φ was 0.0120, which is no different than the value of
recent years could not be estimated. Both USFWS (1996) and 0.0119 that was calculated by USFWS (1996). Both these
Alldredge et al. (2004) estimated a mean HY Φ of 0.30 when estimates are larger than the value of 0.007 that was calculated
analyzing GCWA capture-resight data from the identical study by Alldredge et al. (2004). Conversely, our estimate of process
plot as that for the data used in our analysis, i.e., Thirteen B. The variance for HY Φ, 0.0076, is substantially smaller than the value
only difference in the time frame in which the data were collected of 0.058 that was calculated by Alldredge et al. (2004).
for this analysis is that we chose to omit data from 1991 and 2001
for reasons described earlier and included data from 1996. Thus, CONSERVATION IMPLICATIONS
it is not surprising that our estimated HY Φ is no different than The population parameter estimates calculated herein will be used
previous HY Φ estimates when taking into account the in future Golden-cheeked Warbler population models to aid inAvian Conservation and Ecology 9(2): 4
http://www.ace-eco.org/vol9/iss2/art4/
large-scale conservation decision making. Given current estimates
of vital rates, however, GCWA abundance should be declining Acknowledgments:
dramatically, a scenario that is not supported by the current survey
We are grateful to D. J. Brown, H. A. Mathewson, two anonymous
data. This suggests that GCWA movement might be widespread,
reviewers, and the subject editor for providing comments on a previous
causing Φ estimates to be biased low because of permanent
draft of the manuscript. This project was funded by the U.S. Fish and
emigration. Thus, the use of contemporary hierarchical models to
Wildlife Service through the U.S. Geological Survey Science Support
estimate GCWA movement parameters is a fruitful area for further
Partnership Program, Texas State University, the Houston Safari
study. It can be approached in at least two ways. If the within-season
Club, and the National Wild Turkey Foundation. R. G. Peak provided
GCWA location data were available, for instance, it would be
information concerning the protocols used to monitor Golden-cheeked
beneficial to reformat the data analyzed herein to match a robust-
Warblers. Any use of trade, product, or firm names is for descriptive
design sampling framework and use a spatial Cormack-Jolly-Seber
purposes only and does not imply endorsement by the U.S.
model structure (Royle et al. 2014). Open population spatial
government. This project was sponsored in part by the Department of
capture-recapture models allow for the estimation of Φ during
the Army, U.S. Army Garrison-Fort Hood, Directorate of Public
primary sampling periods and density for each trapping session, or
Works, Environmental Division, Natural and Cultural Resources
in this case each GCWA breeding season, but have the added benefit
Management Branch (NRMB). The content of the information does
of being able to explicitly model and estimate dispersal parameters
not necessarily reflect the position or the policy of the NRMB, and
as long as the scale of dispersal is not substantially greater than the
no official endorsement should be inferred.
scale of the study area. Further, by explicitly incorporating
movement information within the analysis, these models have
increased precision and accuracy in the derived Φ estimates (Ergon
and Gardner 2013). Another possibility is to combine the capture- LITERATURE CITED
resight data analyzed herein with ancillary GCWA population data Abadi, F., O. Gimenez, B. Ullrich, R. Arlettaz, and M. Schaub.
within an integrated population model (Besbeas et al. 2002, Brooks 2010. Estimation of immigration rate using integrated population
et al. 2004, Schaub and Abadi 2011). By combining the likelihoods models. Journal of Applied Ecology 47:393-400. http://dx.doi.
of multiple data sets, integrated population models allow for the org/10.1111/j.1365-2664.2010.01789.x
estimation of population parameters for which few or no explicit Alldredge, M. W., J. S. Hatfield, D. D. Diamond, and C. D. True.
data are available, including immigration rates (Abadi et al. 2010). 2004. Golden-cheeked Warbler (Dendroica chrysoparia) in Texas:
It is worth noting that these two approaches can be combined within importance of dispersal toward persistence in a metapopulation.
a single analysis using a Bayesian approach. Until movement Pages 372-383 in H. R. Akçakaya, M. A. Burgman, O. Kindvall,
parameters are better understood for the species, however, the direct C. C. Wood, P. Sjögren-Gulve, J. S. Hatfield, and M. A. McCarthy,
estimation of population growth rate (λ) using capture-resight data editors. Species conservation and management: case studies. Oxford
(see Pradel 1996, Nichols and Hines 2002) or state-space models University Press, New York, New York, USA.
(see de Valpine and Hastings 2002, Hatfield et al. 2012b) might be
a more effective strategy to assess the viability of individual GCWA Baccus, J. T., M. E. Tolle, and J. D. Cornelius. 2007. Response of
subpopulations than use of projection matrices with vital rate Golden-cheeked Warblers (Dendroica chrysoparia) to wildfires at
estimates. Fort Hood, Texas. Texas Ornithological Society, Occasional
Publication 7:1-37.
If population models are used to better understand GCWA
population dynamics, it should be noted that there is an inherent Benson, T. J., and J. C. Bednarz. 2010. Relationships among
limitation to using these Φ estimates within models that simulate survival, body condition, and habitat of breeding Swainson’s
population dynamics at the range-wide scale. Apparent survival on Warblers. Condor 112:138-148. http://dx.doi.org/10.1525/cond.2010.080089
Fort Hood might not accurately represent Φ across the species’ Besbeas. P., S. N. Freeman, B. J. T. Morgan, and E. A. Catchpole.
breeding range. The Balcones Canyonlands Preserve, located in 2002. Integrating mark-recapture-recovery and census data to
Travis County, initiated a GCWA capture-resight program in 2009 estimate animal abundance and demographic parameters.
(City of Austin 2012). Those data will provide the first estimates Biometrics 58:540-547. http://dx.doi.org/10.1111/j.0006-341X.2002.00540.
of GCWA Φ off Fort Hood. Still, capture-resight data to estimate x
Φ in the southwest and northern portions of the species’ breeding
range are lacking and, to our knowledge, no such study has been Brooks, S. P., R. King, and B. J. T. Morgan. 2004. A Bayesian
initiated. It is essential we understand how population parameters approach to combining animal abundance and demographic data.
vary across multiple ecoregions and under different management Animal Biodiversity and Conservation 27:515-529.
scenarios to model and conserve range-wide populations more Burnham, K. P., and D. R. Anderson. 2002. Model selection and
effectively. Furthermore, it is vital that such studies are initiated as multi-model inference: a practical information-theoretic approach.
soon as possible, given it might require 10 Φ estimates, i.e., 11 years Second edition. Springer, New York, New York, USA.
of capture-resight data, to provide precise variance estimates using
the variance-components approach (Burnham and White 2002). Burnham, K. P., and G. C. White. 2002. Evaluation of some random
effects methodology applicable to bird ringing data. Journal of
Applied Statistics 29:245-264. http://dx.doi.org/10.1080/02664760120108755
Responses to this article can be read online at: Calvert, A. M., J. Woodcock, and J. D. McCracken. 2010.
http://www.ace-eco.org/issues/responses.php/693 Contrasting seasonal survivorship of two migratory songbirds
wintering in threatened mangrove forests. Avian Conservation and
Ecology 5: 2. [online] URL: http://www.ace-eco.org/vol5/iss1/art2/Avian Conservation and Ecology 9(2): 4
http://www.ace-eco.org/vol9/iss2/art4/
Campomizzi, A. J., S. L. Farrell, T. M. Mcfarland, H. A. Hatfield, J. S., F. W. Weckerly, and A. Duarte. 2012a. Shifting
Mathewson, M. L. Morrison, and R. N. Wilkins. 2012. Species foundations and metrics for Golden-cheeked Warbler recovery.
conservation at a broad spatial scale: reproductive success of Wildlife Society Bulletin 36:415-422. http://dx.doi.org/10.1002/
Golden-cheeked Warblers across their breeding range. Wildlife wsb.181
Society Bulletin 36:440-449. http://dx.doi.org/10.1002/wsb.172
Hayden, T. J., H. J. Cornelius, L. L. Weinburg, L. L. Jette, and R.
Cilimburg, A. B., M. S. Lindberg, J. J. Tewksbury, and S. J. Hejl. H. Melton. 2001. Endangered species management plan for Fort
2002. Effects of dispersal on survival probability of adult Yellow Hood, Texas; FY01-05. Department of the Army, Engineer
Warblers (Dendroica petechia). Auk 119:778-789. http://dx.doi. Research and Development Center, Construction Engineering
org/10.1642/0004-8038(2002)119[0778:EODOSP]2.0.CO;2 Research Laboratory, Champaign, Illinois, USA.
City of Austin. 2012. City of Austin 2012 Golden cheeked Warbler Horne, J. S., K. M. Strickler, and M. Alldredge. 2011. Quantifying
(Setophaga chrysoparia) monitoring program. Balcones Canyonlands the importance of patch specific changes in habitat to
Preserve annual report FY 2011-12. City of Austin Water Utility metapopulation viability of an endangered songbird. Ecological
Wildland Conservation Division, Austin, Texas, USA. Applications 21:2478-2486. http://dx.doi.org/10.1890/10-2328.1
Collier, B. A., S. L. Farrell, A. M. Long, A. J. Campomizzi, K. B. Hunt, J. W., F. W. Weckerly, and J. R. Ott. 2012. Reliability of
Hays, J. L. Laake, M. L. Morrison, and R. N. Wilkins. 2013. occupancy and binomial mixture models for estimating abundance
Modeling spatially explicit densities of endangered avian species in of Golden-cheeked Warblers (Setophaga chrysoparia). Auk
a heterogeneous landscape. Auk 130:1-11. http://dx.doi. 129:105-114. http://dx.doi.org/10.1525/auk.2012.11093
org/10.1525/auk.2013.13017
Jolly, G. M. 1965. Explicit estimates from capture-recapture data
Cormack, R. M. 1964. Estimates of survival from the sighting of with both death and immigration-stochastic model. Biometrika
marked animals. Biometrika 51:429-438. http://dx.doi.org/10.2307/2334149 52:225-247. http://dx.doi.org/10.1093/biomet/52.1-2.225
de Valpine, P., and A. Hastings. 2002. Fitting population models Klassen, J. A., M. L. Morrison, H. A. Mathewson, G. G. Rosenthal,
incorporating process noise and observer error. Ecological and R. N. Wilkins. 2012. Canopy characteristics affect reproductive
Monographs 72:57-76. http://dx.doi.org/10.1890/0012-9615(2002) success of Golden-cheeked Warblers. Wildlife Society Bulletin
072[0057:FPMIPN]2.0.CO;2 36:54-60. http://dx.doi.org/10.1002/wsb.100
Diamond, D. D., L. F. Elliott, C. Blodgett, C. D. True, D. German, Martin, T. E., J. Clobert, and D. R. Anderson. 1995. Return rates
and A. Treuer-Kuehn. 2010. Texas ecological systems classification. in studies of life history evolution: are biases large? Journal of
Project ID 1⁄457. Missouri Resource Assessment Partnership. Applied Statistics 22:863-875. http://dx.doi.org/10.1080/02664769524676
University of Missouri, Columbia, Missouri, and the Texas Parks
Marshall, M. E., M. L. Morrison, and R. N. Wilkins. 2013. Tree
and Wildlife Department, Austin, Texas, USA. http://morap.
composition and food availability affect productivity of an
missouri.edu/index.php/texas-ecological-systems-classification/
endangered species: the Golden-cheeked Warbler. Condor
Duarte, A., J. L. R. Jensen, J. S. Hatfield, and F. W. Weckerly. 2013. 115:882-892. http://dx.doi.org/10.1525/cond.2013.130013
Spatiotemporal variation in range-wide Golden-cheeked Warbler
Mathewson, H. A., J. E. Groce, T. M. Mcfarland, M. L. Morrison,
breeding habitat. Ecosphere 4: 152. http://dx.doi.org/10.1890/
J. C. Newnam, R. T. Snelgrove, B. A. Collier, and R. N. Wilkins.
ES13-00229.1
2012. Estimating breeding season abundance of Golden-cheeked
Ergon, T., and B. Gardner. 2013. Separating mortality and Warblers in Texas, USA. Journal of Wildlife Management
emigration: modelling space use, dispersal and survival with robust- 76:1117-1128. http://dx.doi.org/10.1002/jwmg.352
design spatial capture-recapture data. Methods in Ecology and
Mazerolle, D. F., K. W. Dufour, K. A. Hobson, and H. E. den Haan.
Evolution, early view. http://dx.doi.org/10.1111/2041-210X.12133
2005. Effects of large-scale climatic fluctuations on survival and
Farrell, S. L., B. A. Collier, K. L. Skow, A. M. Long, A. J. production of young in a neotropical migrant songbird, the Yellow
Campomizzi, M. L. Morrison, K. B. Hays, and R. N. Wilkins. 2013. Warbler Dendroica petechia. Journal of Avian Biology 36:155-163.
Using LiDAR-derived vegetation metrics for high-resolution, http://dx.doi.org/10.1111/j.0908-8857.2005.03289.x
species distribution models for conservation planning. Ecosphere
McGowan, C. P., M. C. Runge, and M. A. Larson. 2011.
4:42. http://dx.doi.org/10.1890/ES12-000352.1
Incorporating parametric uncertainty into population viability
Groce, J. E., H. A. Mathewson, M. L. Morrison, and N. Wilkins. analysis models. Biological Conservation 144:1400-1408. http://dx.
2010. Scientific evaluation for the 5-year status review of the Golden- doi.org/10.1016/j.biocon.2011.01.005
cheeked Warbler. Texas A&M Institute of Renewable Natural
McKim-Louder, M. I., J. P. Hoover, T. J. Benson, and W. M.
Resources, College Station, Texas, USA.
Schelsky. 2013. Juvenile survival in a neotropical migratory
Gould, W. R., and J. D. Nichols. 1998. Estimation of temporal songbird is lower than expected. PLoS ONE 8:e56059. http://dx.
variability of survival in animal populations. Ecology doi.org/10.1371/journal.pone.0056059
79:2531-2538. http://dx.doi.org/10.1890/0012-9658(1998)079[2531:
Morrison, S. A., D. T. Bolger, and T. S. Sillett. 2004. Annual
EOTVOS]2.0.CO;2
survivorship of the sedentary Rufous-crowned Sparrow (Aimophila
Hatfield, J. S., M. H. Reynolds, N. E. Seavy, and C. M. Krause. ruficeps): no detectable effects of edge or rainfall in southern
2012b. Population dynamics of Hawaiian seabird colonies California. Auk 121:904-916 http://dx.doi.org/10.1642/0004-8038
vulnerable to sea-level rise. Conservation Biology 26:667-678. http:// (2004)121[0904:ASOTSR]2.0.CO;2
dx.doi.org/10.1111/j.1523-1739.2012.01853.xAvian Conservation and Ecology 9(2): 4
http://www.ace-eco.org/vol9/iss2/art4/
Nichols, J. D., and J. E. Hines. 2002. Approaches for the direct Seber, G. A. 1965. A note on the multiple-recapture census.
estimation of λ and demographic contributions to λ, using capture- Biometrika 52:249-259. http://dx.doi.org/10.1093/biomet/52.1-2.249
recapture data. Journal of Applied Statistics 29:539-568. http://dx.
Sillett, T. S., and R. T. Holmes. 2002. Variation in survivorship of
doi.org/10.1080/02664760120108809
a migratory songbird throughout its annual cycle. Journal of Animal
Peak, R. G. 2011a. Population trends of the Golden-cheeked Ecology 71:296-308. http://dx.doi.org/10.1046/j.1365-2656.2002.00599.
Warbler on Fort Hood, Texas 1992-2011. In Endangered species x
monitoring and management at Fort Hood, Texas. 2011 Annual
Stokke, B. G., A. P. Møller, B.-E. Sæther, G. Rheinwald, and H.
Report. Fort Hood, Directorate of Public Works, Natural
Gutscher. 2005. Weather in the breeding area and during migration
Resources Management Branch, Fort Hood, Texas, USA.
affects the demography of small long-distance passerine migrant.
Peak, R. G. 2011b. A field test of the distance sampling method Auk 122:637-647. http://dx.doi.org/10.1642/0004-8038(2005)122
using Golden-cheeked Warblers. Journal of Field Ornithology [0637:WITBAA]2.0.CO;2
82:311-319.
Travis County. 2011. Monitoring of the Golden-cheeked Warbler
Peak, R. G., and N. A. Grigsby. 2011. Golden-cheeked Warbler (Setophaga chrysoparia) on Travis County’s Balcones Canyonlands
demography on Fort Hood, Texas, 2011. In Endangered species Preserve. Travis County Parks and Preserves, Austin, Texas, USA.
monitoring and management at Fort Hood, Texas. 2011 Annual
U.S. Fish and Wildlife Service (USFWS). 1990. Endangered and
Report. Fort Hood, Directorate of Public Works, Natural
threatened wildlife and plants; final rule to list the Golden-cheeked
Resources Management Branch, Fort Hood, Texas, USA.
Warbler as endangered. Federal Register 55(87):53153-53160.
Peak, R. G., and D. J. Lusk. 2011. Test of the plumage
U.S. Fish and Wildlife Service (USFWS). 1992. Golden-cheeked
characteristics used to sex Golden-cheeked Warblers in the first
warbler (Dendroica chrysoparia) recovery plan. U.S. Fish and
basic plumage. North American Bird Bander 36:110-112.
Wildlife Service, Albuquerque, New Mexico, USA.
Peak, R. G., and F. R. Thompson, III. 2013. Amount and type of
U.S. Fish and Wildlife Service (USFWS). 1996. Golden-cheeked
forest cover and edge are important predictors of Golden-cheeked
warbler population and habitat viability assessment report. Compiled
Warbler density. Condor 115:659-668. http://dx.doi.org/10.1525/
and edited by C. Beardmore, J. Hatfield, and J. Lewis in conjunction
cond.2013.120043
with workshop participants. Report of a August 21-24, 1995
Pollock, K. H. 1981. Capture-recapture models allowing for age workshop arranged by the U.S. Fish and Wildlife Service in partial
dependent survival and capture rates. Biometrics 37:521-529. http:// fulfillment of U.S. National Biological Service grant no.
dx.doi.org/10.2307/2530565 80333-1423. U.S. Fish and Wildlife Service, Austin, Texas, USA.
Pollock, K. H., J. D. Nichols, C. Brownie, and J. E. Hines. 1990. Vaillant, H., H. R. Akcakaya, D. Diamond, and D. True. 2004.
Statistical inference for capture-recapture experiments. Wildlife Modeling the effects of habitat loss and fragmentation on the Golden-
Monographs 107:1-97. cheeked Warbler. Final report, submitted to the Engineering
Research and Development Center, Construction Engineering
Pradel, R. 1996. Utilization of capture-mark-recapture for the
Research Laboratory. Engineering Research and Development
study of recruitment and population growth rate. Biometrics
Center, Construction Engineering Research Laboratory, Champaign,
52:703-709. http://dx.doi.org/10.2307/2532908
Illinois, USA.
Pradel, R., J. E. Hines, J.-D. Lebreton, and J. D. Nichols. 1997.
Warren, C. C., J. A. Veech, F. W. Weckerly, L. O’Donnell, and J. R.
Capture-recapture survival models taking account of transients.
Ott. 2013. Detection heterogeneity and abundance estimation in
Biometrics 53:60-72. http://dx.doi.org/10.2307/2533097
populations of Golden-cheeked Warblers (Setophaga chrysoparia).
Pulich, W. M. 1976. The Golden-cheeked Warbler: a bioecological Auk 130:677-688. http://dx.doi.org/10.1525/auk.2013.13022
study. Texas Parks and Wildlife Department, Austin, Texas, USA.
White, G. C., and K. P. Burnham. 1999. Program MARK: survival
Pyle, P. 1997. Identification guide to North American birds, part I. estimation from populations of marked animals. Bird Study 46
Slate Creek, Bolinas, California, USA. (suppl 1):S120-S139. http://dx.doi.org/10.1080/00063659909477239
Royle, J. A., R. B. Chandler, R. Sollmann, and B. Gardner. 2014. Zitske, B. P., M. G. Betts, and A. W. Diamond. 2011. Negative
Spatial capture-recapture. Academic Press, Waltham, Massachusetts, effects of habitat loss on survival of migrant warblers in a forest
USA. mosaic. Conservation Biology 25:993-1001. http://dx.doi.
org/10.1111/j.1523-1739.2011.01709.x
Schaub, M., and F. Abadi. 2011. Integrated population models: a
novel analysis framework for deeper insights into population
dynamics. Journal of Ornithology 152:227-237. http://dx.doi.
org/10.1007/s10336-010-0632-7
Editor-in-Chief: Ryan Norris
Subject Editor: John R.SauerYou can also read