What kind of content are you prone to tweet? Multi-topic Preference Model for Tweeters
←
→
Page content transcription
If your browser does not render page correctly, please read the page content below
What kind of content are you prone to tweet?
                                              Multi-topic Preference Model for Tweeters

                                                             Lorena Recalde and Ricardo Baeza-Yates

                                                        Web Science and Social Computing Research Group
                                                    Department of Information and Communication Technologies
                                                                    Universitat Pompeu Fabra
                                                                      Barcelona, 08018 Spain
                                                           {lorena.recalde,ricardo.baeza}@upf.edu
arXiv:1807.07162v1 [cs.SI] 18 Jul 2018

                                               Abstract. According to tastes, a person could show preference for a
                                               given category of content to a greater or lesser extent. However, quanti-
                                               fying people’s amount of interest in a certain topic is a challenging task,
                                               especially considering the massive digital information they are exposed
                                               to. For example, in the context of Twitter, aligned with his/her prefer-
                                               ences a user may tweet and retweet more about technology than sports
                                               and do not share any music-related content. The problem we address in
                                               this paper is the identification of users’ implicit topic preferences by ana-
                                               lyzing the content categories they tend to post on Twitter. Our proposal
                                               is significant given that modeling their multi-topic profile may be useful
                                               to find patterns or association between preferences for categories, dis-
                                               cover trending topics and cluster similar users to generate better group
                                               recommendations of content. In the present work, we propose a method
                                               based on the Mixed Gaussian Model to extract the multidimensional
                                               preference representation for 399 Ecuadorian tweeters concerning twenty-
                                               two different topics (or dimensions) which became known by manually
                                               categorizing 68.186 tweets. Our experiment findings indicate that the
                                               proposed approach is effective at detecting the topic interests of users.

                                               Keywords: Multidimensional Profile; User Modeling; Expectation Max-
                                               imization; Group Recommender System, Topic Modeling, Twitter.

                                         1    Introduction

                                         In the light of the massive digital information people are exposed to, they show
                                         interest in diverse topics to a greater or lesser extent. Quantifying and measuring
                                         a user’s degree of interest in certain content and finding its correlation with
                                         his/her preference for another topic is a challenging task, especially in social
                                         media platforms where the user interests are not static. For example, people
                                         highly engaged to culture-related topics may often retweet posts about next
                                         concerts, but when their favorite soccer team wins a match, they generate posts
                                         according to that. Therefore, identifying this kind of topic preferences association
                                         represented as a multidimensional user model, (MUM ), may be meaningful to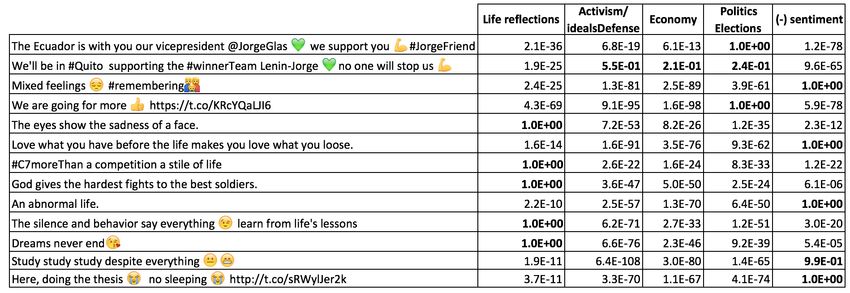
2         Multi-topic Preference Model for Tweeters

define how much the user shows interest in content categories as well as to group
like-minded users and address better recommendations for them.
    In the context of Twitter, automatically classifying a tweet into a topic cat-
egory is hard to achieve. Indeed, having a group of words that form a sentence
of less than 140 characters1 and that contains abbreviations, emoticons, URLs
and mentions of other users, which in particular do not provide a relevant mean-
ing by themselves, makes the semantic analysis a challenge. Then, during the
classification work of a tweet, the capture of other words like hashtags, proper
nouns, compound nouns and verbs lead to a better topic assignment. Accord-
ingly, to make the implementation of the comprehension and classification tasks
of a tweet possible (as the basic step to then associate topic interest to tweeters)
we propose a method that merges language modeling techniques and the Expec-
tation Maximization algorithm [1] (EM for Mixture of Gaussians). The strategy
is independent from the users’ posts language which makes it feasible to take
Spanish tweets posted by Ecuadorians as our case study. Respectively, aggre-
gating the Mixed Gaussian Model (topic soft assignments) of the target users’
tweets in order to find their MUM is useful to cluster them and find groups of
users interested in the same topics and to the same extent.
    There are loads of research works in the field of users’ topic preferences
modeling. However, to the best of our knowledge, our proposal represents the
first attempt to quantify the degree of responsibility a topic has over a given
tweeter. That is to say, the method allows to identify the percentage in which
each category takes part in the user profile. Given this real-world application
scenario, our scientific contributions are:
    – a method to define the multidimensional user model. MUM for tweeters,
      which can be further applied to cluster like-minded users and design group
      recommendations;
    – an evaluation of the accuracy of the proposed method considering, in terms
      of a comparative analysis, a baseline approach which takes a ground-truth
      dataset of labeled tweets. In such way, the MUM approach is compared to
      the results of a traditional machine learning classifier;
    – a detailed validation of our approach that shows its effectiveness in model-
      ing users. We show that similar tweeters, whose profiles were modeled with
      MUM, are able to be grouped together.
    In summary, in this paper we propose a novel method for unsupervised and
topic-based “soft” classification of tweets. Such approach is used to model Twit-
ter users. The remainder of the paper is organized as follows. Section 2 sum-
marizes the context of the present research and related literature; moreover, we
draw a comparison to our proposal; Section 3 describes our approach; in Sec-
tion 4 we present the experimental framework and the obtained results. Finally,
some conclusions and issues about future work are explained in Section 5.

1
    When the dataset was collected Twitter posts were limited to 140 characters. Cur-
    rently, the length of a tweet may be up 280 characters.
Multi-topic Preference Model for Tweeters 3 2 Context and Related Work Human factors such as need for approval, acceptance of a community, repu- tation as an expert, friendship, among others are implicitly present in Online Social Networks, OSNs [2]. Few of these factors have settled in a specific social media with more intensity than others, and human curiosity satisfaction is a widespread one. For example, curiosity to know about acquaintances’ activities is prevalent in Facebook; on the other hand, curiosity to know (and learn) about new content related to one’s topics of interest is seen in Twitter. Therefore, to meet user’s curiosity it is necessary to present them with others’ posts that are certainly of their preference. Modeling users’ profiles is essential to find the topics they enjoy consuming and provide the curious users with meaningful informa- tion. Accordingly, in this section we present related works considering Tweeters Modeling for Recommender Systems whose aim is to link tweeters with the cor- responding content/items. Later, Group Formation and Group Recommendation is detailed due to the further application of our approach in this area. Finally, as our proposal is based on the use of EM to find the degree of responsibility a topic has over a tweet, Tweets Classification works are also described. 2.1 Tweeters Modeling for Recommendation Recommender systems predict if an unseen item is going to be of interest of a target user. To address the problem of recommendation in the Social Web such systems mine people’s interactions, trust connections, previously adopted suggestions, use of self-annotated content (i.e. through hashtags), groups sub- scription, among others. Tweet recommendation has been studied due to the constant threat of content overload in the users time-line. In [3], the approach makes use of three components: tweet topic level factors, user social relation fac- tors and explicit features like authority of the tweet creator and quality of the tweet to define if a tweet can be recommended. Unlike our proposal, this article bases the user model in the social connections and not in topics of interest. Re- search presented in [4] proposes a URLs recommender system for tweeters based on content sources, topic interest models of users, and social voting. Their find- ings show that topic relevance and social interactions were helpful in presenting recommendations. As in our approach, [4] builds the user’s profile from his/her own tweets. However, they work with the weighting scheme tf-idf [5] to find the relevant topics for the user while we apply word embeddings. 2.2 Groups Formation and Recommendations From a general perspective, the benefits of using a microblogging platform such as Twitter emerge from the activity of the users themselves. This social and data-oriented phenomenon is known as collective intelligence [6,7]. For example, a recommender system that tracks events liked by the users may infer that the users who attend musicals twice a month also attend plays once a month. This generalization may be done because the system learns patterns from the
4       Multi-topic Preference Model for Tweeters

behavior of the whole community. In such a case, like-minded users need to
be grouped and analyzed together. A Group Recommender System supports
the recommendation process by using aggregation methods in order to model
the preferences of a group of people. This is needed when there is an activity
(domain) that can be done or enjoyed in groups [8]. For our proposal, it may be
possible to detect groups of tweeters interested in the same topics and suggest
for them, for example, lists to subscribe in.

2.3   Tweets Classification

In terms of tweets classification, in [9], 5 content categories (News, Events, Opin-
ions, Deals, and Private Messages) are proposed in order to classify short text.
In this work, tweets are modeled considering 8 specific features which lead to
determine the class of a tweet. For example, one of the features is presence of
time-event phrases that, in case it is true for a given tweet, might relate it to the
Events category. On the other hand, considering the feature presence of slang
words, shortenings as true for the tweet suggests a Private Message class. While,
this method works with more general categories and a supervised classifier, our
proposal allows a 300-dimension representation of tweets which are later classi-
fied (with soft assignments) considering 22 categories.
    In [10], the problem of hashtag prediction is investigated to recommend the
users proper hashtags for their tweets. As a first step, Naı̈ve Bayes and the
Expectation Maximization algorithm are employed to classify English and non-
English tweets. Later, LDA with Gibbs sampling is applied to find the tweet-topic
distribution. Like our proposal, EM was employed as a means of unsupervised
classification of tweets. However, we used it to model the tweets depending on
the hidden topics, to then seeing the tweet model as a percentage allocation per
topic. On the other hand, the mentioned work uses EM to identify the probability
of a tweet as being writing in English (it results in a hard class assignment).
    Topic modeling has been broadly used as means of tweet classification. In [11],
the authors propose a method where a group of four classifiers are trained to
learn the topics for tweet categorization. They define ten topics and with the
help of annotators, they classify a set of hashtags into those topics. Once the
hashtags are classified, they can label tweets (containing the hashtags) with the
corresponding topic. In their experiments they try to find the features and feature
classes relevant to maximize the topic classification performance. The baseline
method employed to validate our approach follows the same strategy in terms of
supervised classification. In [12], a real-time high-precision tweet topic modeling
system is proposed. 300 topics are considered, and the proposal is based on an
integrative inference algorithm trough supervised learning as well. In contrast, we
present a method to categorize tweets in an unsupervised manner. Our method
is effective in calculating the degree of participation of a topic in a given tweet
(soft clustering) and no labeled data is required.
Multi-topic Preference Model for Tweeters 5
3 Approach
In this section we present the core phases that were implemented to i) identify
the level of participation or responsibility that each category has over a tweet
and ii) aggregate the user’s tweets classification extracted in the former phase
to then define his/her multidimensional user model MUM. The MUM approach,
consists of:
1. Tweets Modeling. By using word2vec [13], we find a vector representation
for a given tweet.
2. Extraction of the suitable Number of Topics. A widely known tech-
nique to define the number of topics hidden in a corpus is the Elbow method
[14]. We use it to decide how many dimensions our tweet/user model will
have.
3. Tweets Classification. To define the topics’ responsibility degree over a
tweet we use EM. As a result, every tweet will have a vector with K dimen-
sions where K depends on the number of topics. Every feature value of the
vector is the percentage of the participation of the corresponding topic in
the given tweet.
4. Twitter Users Model. Once the strategy to model a tweet is established
as formulated in the previous phase, it is applied to the tweets of the target
user. We aggregate the results to define the multidimensional user model.
5. Grouping like-minded Users. M U M provides a profile of tweeters who
may be clustered in groups of homogeneous interests.
What follows presents the details of our approach considering each task.
3.1 Tweets Modeling
A collection of tweets is employed to build a vector representation model for
the words (vocabulary). We use a word embedding strategy based on a neural
language model, word2vec, and its implementation skip-gram. The model learns
to map each word into a low-dimensional continuous vector-space from its dis-
tributional properties observed in the provided corpus of tweets2 . To train the
model, a file that contains a tweet per row is needed.
Other input parameters have to be provided: size or number of vector dimen-
sions, window or maximum skip length between words, sample or threshold for
how often the words occur, and min count or minimum number of times a word
must occur to be considered. The output of the trained model is a vector for
each word in the corpus. Since the vectors are linear, we can sum several vectors
to obtain a unique model representation (additive compositionality property).
Therefore, in order to create a model of a tweet from the words in it, we sum its
words vectors. Let Wt be the set of words in the considered tweet t. By taking
2
https://code.google.com/archive/p/word2vec/6 Multi-topic Preference Model for Tweeters
their embeddings, wt being the vector for a given word, we build the tweet model
as follows: X
wt0 = wt (1)
wt ∈Wt
Then, the vector representation for t is wt0 .
The authors of this paper have worked in tweets modeling with word2vec in
previous research projects, and the detailed methodology which covers tweets
cleaning/pre-processing and text modeling is explained in [15]. It is worth men-
tioning that the tweets are being represented as 300-dimension vectors. The
values that the parameters took in this study are reported in the section 4.3 to
ensure the repeatability of the experiments.
3.2 Extraction of the suitable Number of Topics
To define the number of topics in which tweeters tend to get involved, we take
the wt0 or tweets representation extracted previously and try to find the appro-
priate number of clusters of tweets. Therefore, we may find a meaningful topic
per cluster by inspecting the tweets in it (in case the clusters need to be la-
beled). To separate the tweets into clusters, we applied K-Means++ [16]. This
method spreads out the initial set of cluster centroids, so that they are not too
close together. By applying K-Means++, it is possible to find an optimal set of
centroids, which is required to have optimal means to initialize EM.
The intuition behind clustering is that objects within a cluster are as similar
as possible, whereas objects from different clusters are as dissimilar as possible.
However, the optimal clustering is somehow subjective and dependent of the
final purpose of the clusters; that is to say, the level of detail required from
the partitions. The clusters we obtain may suffer from a wide variation of the
number of samples in each cluster (e.g. few tweets talking about religion and lots
talking about politics) so the distribution is not normal. Nevertheless, we can
select the number of clusters by using the heterogeneity convergence metric as
the Elbow method specifies. We are required to run tests considering different K
values (i.e. number of clusters). To measure distances we use the cosine distance
metric. Then, having K, we measure the intra-cluster distances between n points
in a given cluster Ck and the centroid cC of that cluster.
n
X
Dk = cosineDistance(xi , cC )2 xi ∈ C k ∧ n = |Ck |
i=1
Finally, adding the intra-cluster sums of squares gives a measure of the com-
pactness of the clustering:
XK
hetk = Dk (2)
k=1
In the Elbow heuristic we need to visualize the curve by plotting the heterogene-
ity value hetk against the number of clusters K. At certain point, the gain will
drop, forming an angle in the graph. Therefore, the graph where we have theMulti-topic Preference Model for Tweeters 7
heterogeneity versus K allows us to look for the “Elbow” of the curve where the
heterogeneity decreases rapidly before this value of K, but then only gradually
for larger values of K. The details of the analysis for the case of our study are
presented in the experimental setup (Section 4.3).
While doing the experiments with different K values, we need to keep track
not only the heterogeneity (used to apply the Elbow method), but also the
centroids cC calculated for the clusters.
3.3 Tweets Classification: the EM algorithm applied over tweets
When the number of topics, specified by the number of clusters found in the
previous phase is obtained, the next step is the implementation of the Expec-
tation Maximization algorithm. EM is sensitive to the choice of initial means.
With a bad initial set of means, EM might generate clusters that span a large
area and are mostly overlapping. Then, instead of initializing means by selecting
random points, we take the final set of centroids calculated before (suitable set of
initial means). Indeed, the initialization values for EM will be: i) initial means,
the cluster centroids cC extracted for the chosen K; ii) initial weights, we will
initialize each cluster weight as the proportion of tweets assigned by k-means++
to that cluster Ck ; in other words, n/N for n = |Ck | and N = total number of
tweets; iii) initial covariance matrix, to initialize the covariance parameters, we
PN
compute i=1 (xij − µCk j )2 for each dimension j.
When the initial parameters are set, the input for the algorithm will be the
vectors which belong to the tweets that we want to model. The EM algorithm will
be in charge of defining the degree of responsibility the topics will have over each
tweet. Then, the output after running the algorithm will be the responsibility
matrix 3 which cardinality is N xK. The rows of the matrix specify in which extent
the observation xi was assigned to the different K topics (columns). In other
words, if the topic 0 (or cluster 0) has full responsibility over the observation the
value is going to be 1. If we see shared responsibility between eight topics over
another tweet, the sum of those values will be 1 (Refer to Section 4.3 to see an
example).
3.4 Twitter Users Model: extraction of the M U M
Having the responsibility matrix, we need to identify which tweets (rows of
the matrix) correspond to the given user (noting t as a modeled tweet ∈ Tu ).
Whence, for the user being analyzed we will have a |Tu |xK submatrix, which
will be noted as U . To establish the user model, we apply next equations.
|Tu |−1
X
sumj = tij (3)
i=0
3
Refer to the repository https://github.com/lore10/Multidimensional_User_
Profile to access the code related to the EM algorithm (datasets and other files are
also included).8 Multi-topic Preference Model for Tweeters
For j ∈ [0, K − 1]. Then, we sum the vector values j to obtain the total:
K−1
X
total = sumj (4)
j=0
Finally, the model for the user will be represented as percentages:
M U Mj = (sumj /total) ∗ 100 (5)
In conclusion, MUM is going to be a vector of K dimensions that models the
given user according to the topics he/she tends to tweet about. The j values will
express the extent of topic participation in the user’s Twitter profile.
3.5 Grouping like-minded Users
One of the applications of the multi-topic model of users would be clustering
similar users to analyze audiences on Twitter, targeting certain groups of tweet-
ers with recommendations, studying subtopics of interest given a group, among
others. In the case of our study, this step was taken to evaluate the proposed
approach performance. The clustering algorithm we used was K-means++ [17],
which implementation is provided in the tool Graphlab [18] for Python (K-means
with smart centers initialization). The feasibility and low cost of the algorithm
to process partitions of big datasets allow the wide use of this clustering method
oriented to many applications. To define the optimal number of groups of users,
given the dataset in analysis we also applied the Elbow Heuristic.
4 Experimental Framework
In this section, we detail the experimental framework which validates our pro-
posal. We present a case study based on a real-world scenario and have divided
the section in the following. First, we describe the datasets employed during the
experiments; then, we provide an explanation about the baseline approach used
for comparison. Later, the experimental setup followed by the corresponding
results are discussed.
4.1 Data Collection
To run the experiments and implement our approach we need some datasets:
– a set of tweets to train the word2vec model,
– a list of users and their tweets/retweets, and
– a list of users whose profile or preferred topic is well known in order to
evaluate the performance of the baseline method and the proposed approach.
The detailed description of the data is provided next.Multi-topic Preference Model for Tweeters 9 Training Corpus to obtain the Vocabulary Model As it was said before, the authors collected datasets with the aim of applying word2vec. The trained model, which was the result of the research done in [19], was used in the present work because of the advantages the dataset presented: i) diverse nature of con- tent because of a pool of 319,889 tweets posted by Ecuadorian users during a month, and ii) the authors have knowledge of the context involved, i.e. hashtags and their topics, meaning of referenced places and events, and public figures as well as the category their posts fall in. The previous research explored and vali- dated the quality of the training dataset. Indeed, the vocabulary extracted and represented as vectors covers most of the words Ecuadorian tweeters tend to use. Therefore, it suggests that the model can be generalized for similar scenarios as the one presented in this research. Besides, after doing some tests, it was found that the appropriate representation for this kind of input text (short sentences in Spanish) is of 300 dimensions. The trained model corresponds to the output of the approach phase presented in Section 3.1, Tweets Modeling. Once these tweets are modeled we identified the number of topics involved (Section 3.2) and the centroids to then initialize EM. Moreover, the vocabulary vectors are later used to define other tweet models. Sample of Users and their Timeline A set of 360 users was sampled from the list of tweeters who created the tweets in section 4.1. Every tweet in the corpus has meta-data that has information about of it, such as ‘text’ of the tweet, ‘creation date’, ‘list of hashtags’ contained in the tweet, ‘user’ (id number and screen name) who posted the tweet, among others. Given that we have a list of 37,628 users, we had to randomly sample 360 of them due to the Twitter API rate limits. To apply the proposed method, we extracted the last 3,200 tweets from their accounts. Finally, the amount of tweets collected from the users’ timelines is of 236,453. Sample of Users for Approach Evaluation We considered a list of 39 po- litical figures who currently participate in the government as public employers or who were candidates for government positions during the 2017 elections. We query their Twitter accounts and extracted a total list of 58,533 tweets. These tweets were added to the set previously obtained. Then, we will apply our ap- proach (Section 3.3) considering a dataset of 294,986 tweets in total. It is worth mentioning that those tweets belong to the 399 users. 39 of them are politicians intentionally added to test the accuracy of the proposed approach. In other words, the political figures help us to validate if after getting their MUMs and clusters (Sections 3.4, 3.5), they are going to be found as similar (homogeneous profile models) and put together. In such a case, we can assure that the tweets and users are being correctly modeled. 4.2 Baseline Approach To compare the performance of the MUM approach at modeling tweeters, a base- line method is proposed. We elaborate a strategy made of core techniques. What
10       Multi-topic Preference Model for Tweeters

follows is a map of our approach phases and the decisions made to construct the
baseline.
1. Tweets Modeling. The dataset of tweets presented in 4.1 (training cor-
   pus) was modeled by applying tf-idf [20]. Such a strategy is one of the core
   information retrieval techniques used to create a vector representation of
   text.
2. Extraction of the suitable Number of Topics. To build a ground truth
   about the topics hidden in the tweets dataset and get a subset of classi-
   fied tweets, we extracted a list of the most frequent hashtags present in
   the tweets. We inspect the hashtags to identify keywords corresponding to
   a given category. For example, the hashtags #ecu911, #routesecu911 and
   #ecu911withme lead us to define the topic Citizens Safety and Emergencies.
   As a result, 22 topics were extracted and the corresponding tweets, which
   contained the studied hashtags, were labeled accordingly. Usually, this man-
   ual classification technique allows the categorization of 20% of the tweets. In
   our case, from 319,889 tweets we classified 68,186 which corresponds to the
   21.3%. The 22 categories define the number of dimensions the users’ model
   will have.
3. Tweets Classification. In our approach, EM is used to generate a topic-
   soft-assignment for each tweet (Mixture of Gaussians). For the baseline ap-
   proach, we will predict the topic of the given tweet by applying a traditional
   machine learning algorithm. We did a series of tests to select an appropriate
   classification algorithm. First, we chose three machine learning approaches
   used to realize multi-class prediction. These were logistic regression, decision
   trees and boosting trees. Then, we took 80% of the previously label tweets
   to be the training dataset. The rest of the tweets were used to test the mod-
   els. As it is shown in Figure 1, Boosting Trees algorithm [21] outperformed
   the others, so it was used to classify the users’ tweets in next phase. The
   algorithm is based on a technique called gradient boosting, which combines
   a collection of base learners (i.e. decision tree classifiers) for predictive tasks.
   It can model non-linear interactions between the features and the target. It
   is worth clarifying that for precision and recall we calculated the micro and
   macro values. Micro precision/recall calculates the metrics globally by count-
   ing the total true positives, false negatives, and false positives. On the other
   hand, the macro value calculates the metrics for each label and finds their
   unweighted mean (label imbalance is not considered). We use the trained
   boosted trees model to get the class/topic of the new observations (294,986
   tweets of the 399 users with their tf-idf representation). As output, we obtain
   the class and the corresponding class-probabilities 4 .

4. Twitter Users Model. According to our proposal, the M U M method
   aggregates the results of the EM algorithm applied over the tweets of a
   given user. On the other hand, considering the baseline approach, we take
4
     https://turi.com/products/create/docs/generated/graphlab.boosted_trees_
     classifier.BoostedTreesClassifier.classify.html
Multi-topic Preference Model for Tweeters 11
Fig. 1: Comparison of the performance of the machine learning algorithms (multi-
class prediction).
the tweets of the target user Tu and their probabilities associated to the
class prediction Pt (results of the boosting trees classifier). At last, to define
the user’s model M , we average the probabilities obtained for each of the 22
classes:
|Tu |−1
X ij
Mj = avg( Pt )
i=0
For j ∈ [0, 21].
At the end of these baseline method’s stage, the users will have a set of val-
ues (j) that quantify the level of preference of the user for the corresponding
topics.
5. Grouping like-minded Users. We take this phase to evaluate the perfor-
mance of the baseline approach. In order to compare our method and the
baseline, this step was identically applied in both M U M and M (Refer to
Section 3.5). More detailed about the obtained results is given in Section 4.4.
4.3 Experimental Setup and Strategy
The parameters used to apply word2vec over the training corpus are: size=300,
window=5, sample=0 and min count=5. Other parameters are not modified and
take the default values. The output of the word2vec model contains a vocabulary
of 39,216 words represented as vectors. Equation 1 is applied to have the vectors
of the tweets in the training corpus. When the set of wt0 is ready we can move
on to the next phase to define the number of clusters in which the tweets are
classified. We run some experiments considering K (number of clusters to find)12 Multi-topic Preference Model for Tweeters
Fig. 2: Elbow Heuristic: Heterogeneity vs K values.
equal to several values. For each given K we apply K-Means++ to cluster the
tweets and after that, we will be able to calculate the heterogeneity (Equation
2)5 . The results are shown in Figure 2 where we have the heterogeneity vs K
plot. The Elbow Heuristic specifies that by analyzing this plot, we can define the
optimal number of clusters for the provided data points. The diagram shows that
the gain reduces significantly from K=3 to K=20. Besides, we see a flattening
out of the heterogeneity for K >= 30 (overfitting for larger values of K). So,
it might indicate that the K searched is in a range of 20 and 30. To make a
decision, we take into account the manual classification of the training tweets
in the baseline method, where 22 topics were found. Whereby, as the Elbow
Heuristic also suggests, we consider 22 topics, or K = 22 to continue working
on our approach. The centroids for the 22 clusters are calculated and used to
initialize the means for EM. When applying the EM algorithm in order to get a
soft topic assignment per tweet, we will be using the dataset of 399 users’ tweets
(39 of the users are political figures, which results are employed in Section 4.4 for
validation). The resulting responsibility matrix is used to define the MUM of the
users by implementing Equations 3, 4 and 5. As an example, Figure 3 shows 5
topics and the degree of responsibility they have over 13 tweets of a given user6 .
The user we took had 698 tweets and once we extracted his/her MUM, the model
5
It has to be mentioned that for the given K we run K-Means++ with some ini-
tialization seeds: 0, 20000, 40000, 60000, 80000. The considered seed to define the
centroids for our work was the one which reported the minimum heterogeneity.
6
It is worth noting that, as other unsupervised methods, the names of the classes,
categories or topics are not defined by the proposed clustering strategy. For the
example in Figure 3, to provide the topic labels, we extracted and analyzed the
tweets classified in the corresponding topic with a minimum value of 0.90. Doing so,
we were able to annotate the category names.Multi-topic Preference Model for Tweeters 13
presented a value of 49.1 for the topic ‘(-) sentiments’ and 11.4 in ‘life reflections’
(highest category weights). The model of tweeters is finally obtained and may
Fig. 3: Example of Topic assignment with EM algorithm
be used with many purposes. Actually, to align the results with the goals of our
research we cluster the users to define groups of tweeters with similar profiles or
tastes about content topics (last phase of our approach, Section 3.5). By making
use of the notion about heterogeneity and Elbow Heuristic we find that the users
in our dataset form 5 clusters. To evaluate the behavior of our approach facing
the chosen baseline, we introduced a set of politicians. The assumption behind
this is that if their profile is well represented, they are going to be grouped in
the same cluster. This validation is presented in next Section.
4.4 Validation of Results
The users we take to do this validation are well-known political figures who
have a position in the government or were candidates in different democratic
elections. The clustering algorithm we applied with the aim of validating the
M U M approach as well as the results of the baseline method was K-Means++.
The details about the results for both approaches are presented in Table 1. The
Table 1: Summary of Users Clusters: Baseline and MUM methods.
Politicians Politicians
Total Size Total Size
Cluster ID Classification Classification
(Baseline) (M U M )
(Baseline) (M U M )
0 50 100 17 36
1 165 6 0 0
2 126 45 0 1
3 16 122 2 1
4 43 127 20 114 Multi-topic Preference Model for Tweeters
Table also shows how the politicians were classified. In the case of the baseline
implementation, we can see that there are two prominent groups of politicians.
One group covers 44% of them, while the other groups the 51%. By analyzing
the centroids of the two clusters, we identified that cluster 4, differently from
cluster 0, groups users who tend to talk more about economy. Compared to
our approach, it is shown that MUM performance at clustering politicians has
92% of precision. From the 39 politicians, only 3 were left out of the political-
related cluster. The ‘screen name’ of these users are lcparodi, ramiroaguilart
and mmcuesta. By verifying their MUM (the 22 dimensions of the model) and
their tweets, it is seen that their profiles are different from the rest of politicians
who mostly talk about elections, economy and social issues. Instead, lcparodi
tweeted about capital market and investment, ramiroaguilart posted about his
interviews in radio media and talks directly to people loading his account of
mentions (@); besides, our model separated mmcuesta because she talks about
recipes/food and cooking, and she promotes few enterprises7 .
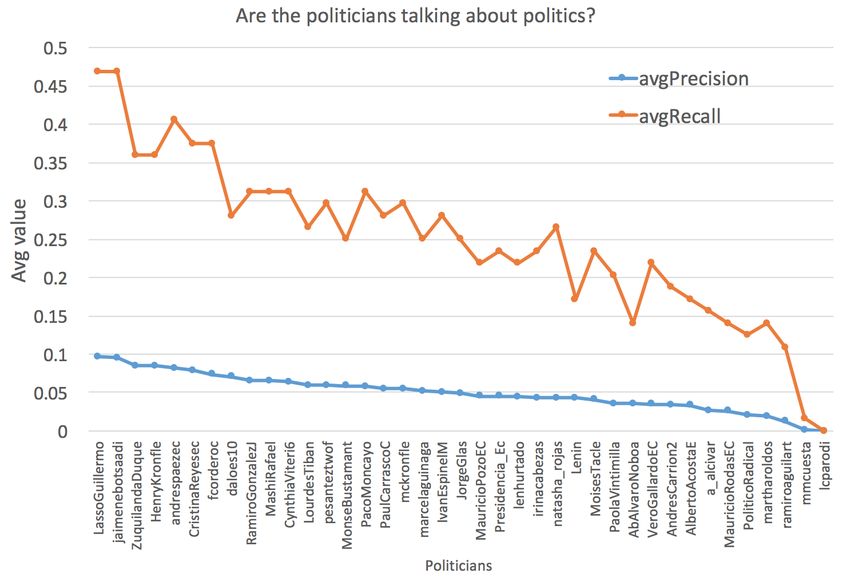
In order to make a deeper comparison of the politicians who were clustered
together and the rest three, we did text mining over their Twitter accounts.
As we already collected their time-lines, we consider every politician’s tweets
as a document, i.e. there is a collection of 39 documents to be analyzed. We
apply tf-idf over this corpus and found the most relevant words for the corre-
sponding politicians’ profiles. From among the most frequent words in the whole
corpus, a list of meaningful words in the context of “politics” was extracted.
The mentioned list contains the words: Ecuador, government, country, Ecuado-
rians, president, ‘the people’ (pueblo), job, work, city, production, laws, taxes,
congress, health, justice, and citizens. In this experiment we try to find if the
previous list was present among the relevant words extracted for the politicians.
We worked with the 30, 50, 100 and 200 most relevant words taken from their
profiles. The results for the average precision and recall are explained in Figure
4. As it is showed, the users ramiroaguilart, mmcuesta and lcparodi have the
minimum values for both precision and recall; then, it is proved that they did
not discuss about political issues as the rest of the politicians.
5 Conclusions and Future Work
People may show preference for several topics to a greater or lesser extent. In
this research, we have proposed a method that creates a vector representation of
tweets by applying word2vec. Then, by using a Mixture of Gaussians through the
Expectation Maximization algorithm, it calculates the degree of responsibility
that a set of topics have over a tweet. Finally, we aggregate the results of the
tweets which correspond to a given user to define his/her multi-topic preference
model. We have validated our proposal by comparing it with the results of a
baseline approach. This evaluation showed that our method was able to cluster
92% of politicians in the same group, facing the results of the baseline method
7
We have to mention that lcparodi and mmcuesta are the users who belong to cluster
3 in the Politicians Classification - Baseline Method.Multi-topic Preference Model for Tweeters 15
Fig. 4: Relevance of the context of “Politics” in the politicians’ Twitter accounts
which divided the politicians in two clusters. In summary, we can conclude that
our method is effective when modeling the topic interests of Twitter users.
There are other issues to be discussed. In fact, the authors think that the
most important step is the definition of the training dataset. Then, for future
work, we consider updating the vocabulary obtained with word2vec algorithms
due to new topics/hashtags appear over time. We think that our method can
be used in recommender systems to find new content and subscription lists that
match the users’ profiles. We propose for further research to label the groups of
users and to apply a validation not only by identifying the group of politicians
but also other clusters of users modeled with MUM. Also, we plan to evaluate our
approach with other probabilistic topic models like LDA and test its performance
at topic assignment for short text.
References
1. A. P. Dempster, N. M. Laird, and D. B. Rubin, “Maximum likelihood from incom-
plete data via the EM Algorithm,” Journal of the Royal Statistical Society. Series
B (Methodological), vol. 39, no. 1, pp. 1–38, 1977.
2. S. Grabner-Kräuter, “Web 2.0 social networks: The role of trust,” Journal of Busi-
ness Ethics, vol. 90, pp. 505–522, Dec 2009.
3. K. Chen, T. Chen, G. Zheng, O. Jin, E. Yao, and Y. Yu, “Collaborative personal-
ized tweet recommendation,” in Proceedings of the 35th International ACM SIGIR
Conference on Research and Development in Information Retrieval, (NY, USA),
pp. 661–670, ACM, 2012.
4. J. Chen, R. Nairn, L. Nelson, M. Bernstein, and E. Chi, “Short and tweet: Ex-
periments on recommending content from information streams,” in Proceedings of
the SIGCHI Conference on Human Factors in Computing Systems, CHI ’10, (New
York, NY, USA), pp. 1185–1194, ACM, 2010.16 Multi-topic Preference Model for Tweeters
5. G. Salton and C. Buckley, “Term-weighting approaches in automatic text re-
trieval,” Inf. Process. Manage., vol. 24, pp. 513–523, Aug. 1988.
6. L. S. L. Lai and E. Turban, “Groups formation and operations in the web 2.0 envi-
ronment and social networks,” Group Decision and Negotiation, vol. 17, pp. 387–
402, Sep 2008.
7. J. Surowiecki, The Wisdom of Crowds. Anchor, 2005.
8. L. Boratto and S. Carta, “State-of-the-art in group recommendation and new ap-
proaches for automatic identification of groups,” in Information Retrieval and Min-
ing in Distributed Environments, vol. 324, pp. 1–20, Springer Berlin, 2011.
9. B. Sriram, D. Fuhry, E. Demir, H. Ferhatosmanoglu, and M. Demirbas, “Short
text classification in twitter to improve information filtering,” in Proceedings of
the 33rd International ACM SIGIR Conference on Research and Development in
Information Retrieval, SIGIR ’10, (New York, NY, USA), pp. 841–842, ACM, 2010.
10. F. Godin, V. Slavkovikj, W. De Neve, B. Schrauwen, and R. Van de Walle, “Using
topic models for twitter hashtag recommendation,” in Proceedings of the 22Nd
International Conference on World Wide Web, WWW ’13 Companion, (New York,
NY, USA), pp. 593–596, ACM, 2013.
11. Z. Iman, S. Sanner, M. R. Bouadjenek, and L. Xie, “A longitudinal study of topic
classification on Twitter,” in Proceedings of the Eleventh International AAAI Con-
ference on Web and Social Media, ICWSM ’17, pp. 552–555, 2017.
12. S.-H. Yang, A. Kolcz, A. Schlaikjer, and P. Gupta, “Large-scale high-precision
topic modeling on twitter,” in Proceedings of the 20th ACM SIGKDD International
Conference on Knowledge Discovery and Data Mining, KDD ’14, (New York, NY,
USA), pp. 1907–1916, ACM, 2014.
13. T. Mikolov and J. Dean, “Distributed representations of words and phrases and
their compositionality,” Advances in neural information processing systems, 2013.
14. R. L. Thorndike, “Who belongs in the family,” Psychometrika, pp. 267–276, 1953.
15. L. Recalde, J. Mendieta, L. Boratto, L. Teran, C. Vaca, and G. Baquerizo, “Who
you should not follow: Extracting word embeddings from tweets to identify groups
of interest and hijackers in demonstrations,” IEEE Transactions on Emerging Top-
ics in Computing, vol. PP, no. 99, pp. 1–1, 2017.
16. D. Arthur and S. Vassilvitskii, “K-means++: The advantages of careful seeding,”
in Proceedings of the 18 ACM-SIAM Symposium on Discrete Algorithms, SODA
’07, (Philadelphia, PA, USA), pp. 1027–1035, Society for Industrial and Applied
Mathematics, 2007.
17. J. Macqueen, “Some methods for classification and analysis of multivariate observa-
tions,” in In 5-th Berkeley Symposium on Mathematical Statistics and Probability,
pp. 281–297, 1967.
18. Y. Low, J. Gonzalez, A. Kyrola, D. Bickson, C. Guestrin, and J. M. Heller-
stein, “Graphlab: A new framework for parallel machine learning,” CoRR,
vol. abs/1006.4990, 2010.
19. L. Recalde and A. Kaskina, “Who is suitable to be followed back when you are
a twitter interested in politics?,” in Proceedings of the 18th Annual International
Conference on Digital Government Research, dg.o ’17, (New York, NY, USA),
pp. 94–99, ACM, 2017.
20. R. A. Baeza-Yates and B. Ribeiro-Neto, Modern Information Retrieval. Boston,
MA, USA: Addison-Wesley Longman Publishing Co., Inc., 1999.
21. Y. Freund and R. E. Schapire, “Experiments with a new boosting algorithm,”
in Proceedings of the Thirteenth International Conference on International Con-
ference on Machine Learning, ICML’96, (San Francisco, CA, USA), pp. 148–156,
Morgan Kaufmann Publishers Inc., 1996.You can also read