Mortality Impact of COVID-19 Vaccination in England - Counterfactual Insights from Gompertz to Machine Learning Authors: Institute ...
←
→
Page content transcription
If your browser does not render page correctly, please read the page content below
Mortality Impact of COVID-19
Vaccination in England
Counterfactual Insights from Gompertz to
Machine Learning

Authors:
* John Ng, MA FIA BPharm
Scott Reid, B.Sc. (Hons), FFA

 1st March 2021
Disclaimer; The views expressed in this publication are those of invited contributors and not
necessarily those of the Institute and Faculty of Actuaries. The Institute and Faculty of Actuaries do
not endorse any of the views stated, nor any claims or representations made in this publication and
accept no responsibility or liability to any person for loss or damage suffered as a consequence of
their placing reliance upon any view, claim or representation made in this publication. The information
and expressions of opinion contained in this publication are not intended to be a comprehensive
study, nor to provide actuarial advice or advice of any nature and should not be treated as a substitute
for specific advice concerning individual situations. On no account may any part of this publication be
reproduced without the written permission of the Institute and Faculty of Actuaries.

 2
Abstract

The U.K. launched the world’s first mass COVID-19 vaccination on 8th December 2020. This paper
explores whether the data supports early signs of immunity build up and mortality impact on people
80 years of age and above in England.

By considering percentage weekly change in COVID-19 hospital admission and hospital deaths, this
suggests the 80+ age group is seeing a reduction in January 2021. However, the percentage weekly
change in COVID-19 associated deaths and registered deaths are less clear.

We measured the relative mortality between the age groups by using the Gompertz function. This
approach shows that the rate of age-related increase in mortality (α) has a remarkably consistent
weekly pattern in the last 12 weeks of 2020 and throughout various phases of the pandemic before
the start of vaccinations. This implies that the mortalities of the younger age groups are great
predictors of the mortality of the 80+ age group.

Using this key insight, we constructed the counterfactual scenarios assuming the environment after 8th
December 2020 is taken to be the same as before. Then we applied linear regression and machine
learning to predict the expected level of mortality in the 80+ age group using the mortality data from
the largely unvaccinated younger age groups. The actual versus expected results for ages 80+ show
both hospital and registered deaths have statistically significant mortality reductions from middle of
January 2021 onwards:

 • Registered deaths show an estimated reduction of 32% by 12th February 2021; and
 • Hospital deaths show consecutive mortality reductions for many weeks and arrived at an
 estimated 50% reduction by 20th February 2021.

The timing of the mortality reduction is compatible with the drastic increase in the prevalence of
community antibody positivity among the 80+ age group according to data published by the Office of
National Statistics.

We then discussed to what extent the mortality reduction is due to other confounding factors such as
the January lockdown. However, whilst this may explain some of the effects, there is compelling
evidence using the counterfactual scenarios that the key driving force for the mortality reductions in
England from middle of January 2021 onwards is likely due to the vaccination roll-out.

Correspondence details

*Correspondence to: John Ng wui_hua@cantab.net

Keywords

COVID-19, Vaccination, Mortality, Hospital, Linear Regression, Gompertz Network, Machine Learning

Acknowledgements

Chris Reynolds

Emily Demetriades

Adele Groyer

 3

Contents
1 Introduction ...................................................................................................................................... 6
 1.1 Hospital admissions ................................................................................................................ 6
 1.2 Hospital deaths........................................................................................................................ 7
 1.3 Deaths within 28 days of positive test ..................................................................................... 8
 1.4 Registered deaths ................................................................................................................... 8
2 Patterns of age dependency of COVID-19 deaths in England ...................................................... 10
 2.1 Proportion of deaths by age .................................................................................................. 10
 2.2 Rate of age-related increase in mortality .............................................................................. 11
 2.3 The new variant ..................................................................................................................... 12
3 Time lags from vaccine uptake to death registration ..................................................................... 13
 3.1 Vaccine build up .................................................................................................................... 13
 3.2 Infection to symptom onset ................................................................................................... 13
 3.3 Symptom onset to death ....................................................................................................... 13
 3.4 Death registration .................................................................................................................. 13
 3.5 Estimation of onset time of effect from vaccination............................................................... 14
 3.6 Vaccination data .................................................................................................................... 14
4 Hospital data in England and Israel ............................................................................................... 16
 4.1 Consecutive reductions in Hospital Mortality Ratios in England ........................................... 16
 4.2 60% reduction in hospitalisations for 60+ age group in Israel .............................................. 16
5 Counterfactual predictive modelling ............................................................................................... 18
 5.1 Model R1 – Linear Regression for registered deaths ........................................................... 20
 5.2 Model R2 – Mortality Ratio for registered deaths .................................................................. 20
 5.3 Model R3 – Simple Gompertz for registered deaths ............................................................. 21
 5.4 Model R4 – Gompertz Network for registered deaths........................................................... 21
 5.5 Model H1 – Linear Regression for hospital deaths ............................................................... 22
 5.6 Model H2 – Mortality Ratio for hospital deaths ..................................................................... 23
 5.7 Summary of results ............................................................................................................... 24
 5.7.1 Registered deaths ............................................................................................................. 24
 5.7.2 Hospital deaths.................................................................................................................. 24
6 Antibody data for the community population in England ............................................................... 26
7 Discussion of the causes of mortality reduction in the 80+ age group .......................................... 29
8 Limitations ...................................................................................................................................... 31
9 Conclusion ..................................................................................................................................... 32
10 Appendices .................................................................................................................................... 33
 10.1 Mortality ratios by age ........................................................................................................... 33
 10.2 Rate of age-related increase in mortality ratio ...................................................................... 33

 4
10.3 Additional counterfactual models .......................................................................................... 35
 10.3.1 Model P1 – Linear Regression for PHE deaths based on date of occurrence ............. 35
 10.3.2 Model O1 – Linear Regression for ONS deaths based on date of occurrence ............ 36
11 Bibliography ................................................................................................................................... 37

 5
1 Introduction

The U.K. launched the world’s first mass COVID-19 vaccination on 8th December 2020. In England,
the percentage of people 80 years of age and above who received the first dose was 18.5% by 27th
Dec 2020. By 17th January 2021, this percentage rose to 56.3% [1].

The questions we will attempt to address in this paper include:

 1. Are we starting to see early signals of the immunity build up in the 80+ age group and
 prevention of deaths, compared to the younger age groups?
 2. Is it possible to disentangle vaccine impact from other confounding factors?
 3. Can actuarial science and data science techniques be employed to provide greater insights?

Initially we will consider hospital admissions, hospital deaths, deaths within 28 days of positive test
and registered deaths to compare the weekly percentage change for different age groups to
understand if there is a clear difference starting to emerge between the 80+ ages (who are included in
the initial vaccination rollout) against the unvaccinated younger age groups.

In the later sections, we consider several counterfactual modelling approaches to understand the
change in mortality in the 80+ age group when compared to the younger age groups.

Multiple data sources are considered. In the modelling section, we have used Office of National
Statistics (ONS) deaths data by date of registration and hospital deaths data by date of death.
Additionally, we have considered in the appendices ONS data by date of occurrence and Public
Health England (PHE) data by date of occurrence.

1.1 Hospital admissions

COVID-19 hospital admissions data was sourced from the National Health Service (NHS). The data
shows the number of patients admitted with COVID-19 and number of inpatients diagnosed with
COVID-19 by reporting date. Figure 1 considers the weekly percentage change in hospital admissions
in England, split by three distinct age groups including 55-64, 65-74 and 75+, as well as the broad age
group consisting of those less than 75 years old [2].

There are several confounding factors including: a lockdown in November 2020; a stricter lockdown in
January 2021 where schools were closed; a higher prevalence of a more transmissible/severe new
variant; the death clusters in care homes; and the successful rollout of the vaccination programme
that started 8th December 2020. From the 17th January 2021 there appears to be a slight divergence
as the weekly percentage change of the 75+ age group falls below that of the under 75 age group,
implying a slightly faster rate of decrease in the 75+ age group but isn’t conclusive.

 6
Figure 1: Weekly percentage change of COVID-19 hospital admissions by age groups

1.2 Hospital deaths

COVID-19 hospital deaths data was sourced from the NHS and recorded against the date of death.
Figure 2 considers the weekly percentage change in hospital deaths in England, split by three distinct
age groups including 40-59, 60-79 and 80+, as well as the broad age group consisting of those under
80 years of age [3].

As with hospital admission, there are many confounding factors impacting the hospital deaths. The
weekly percentage changes in the 80+ age group are slightly more negative than the under 80 age
group for most of the time in January 2021. However, from the end of January they do appear to
diverge over a 3-week period up to 20th February 2021 which perhaps could be an impact of the
vaccine roll out in 80+ age group.

Figure 2: Weekly percentage change of COVID-19 hospital deaths by age groups

 7
1.3 Deaths within 28 days of positive test

COVID-19 associated deaths data by date of death was sourced from the PHE, where deaths are
only included if the deceased had a positive test for COVID-19 and died within 28 days of the positive
test [4]. Figure 3 considers the weekly percentage change in PHE’s COVID-19 associated deaths in
England and Wales, split by four distinct age groups including 50-59, 60-69, 70-79 and 80+, as well
as the broad under 80 age group.

The weekly percentage changes in the 80+ age group started to decrease faster and falls below the
under 80 age group from week ending 3rd February 2021.

Figure 3: Weekly percentage change of PHE’s COVID-19 associated deaths by age groups

1.4 Registered deaths

COVID-19 registered deaths data was sourced from the Office of National Statistics (ONS). Figure 4
considers the weekly percentage change in registered deaths in England and Wales, split by four
distinct age groups including 50-59, 60-69, 70-79 and 80+, as well as the broad under 80 age group
[5].

As discussed, there are many confounding factors impacting registered deaths such as clusters of
deaths of care homes in January 2021. Based on this information, it is difficult to establish if there is
any reduction in mortality up to the end of January 2021 as the 80+ and under 80 age groups are
closely aligned from weeks ended 8th to 29th January 2021. However, there is a sign of divergence
from week ended 5th February 2021.

 8
Figure 4: Weekly percentage change of ONS’ COVID-19 registered deaths by age groups

By considering percentage weekly change in COVID-19 hospital admission, hospital deaths, deaths
within 28 days of positive test and registered deaths, this suggests there may be an impact in the 80+
age group, but the evidence is not conclusive. We will consider in later sections the impact on
mortality using predictive modelling approaches to see if we can glean further insights into differences
between the 80+ compared to younger age groups (Section 5).

 9
2 Patterns of age dependency of COVID-19 deaths in England

In this section, the weekly COVID-19 registered deaths data of England and Wales, where
coronavirus was mentioned on the death certificate, was sourced from the ONS [5].

2.1 Proportion of deaths by age

The COVID-19 deaths data from 2020 is aggregated into four distinct periods of the pandemic in
England:

i. Mar - Jun 2020: The first wave and first lockdown.

ii. Jul - Oct 2020: The period between the first wave and second lockdown, coinciding with the
summer season.

iii. Nov - early Dec 2020: During the second wave, second lockdown, increasing prevalence of the
new coronavirus variant B.1.1.7, but prior to vaccine rollout.

iv. Early Dec 2020 – 1st Jan 2021: Rollout of vaccines begins.

Figure 5: Bar plots of proportion of deaths in different age groups, by time period (a) [Mar - Jun 2020, July - Oct
2020, Nov - early Dec 2020, early Dec 2020 – 1st Jan 2021] and by weeks ended (b) [6th Nov 2020 – 29th Jan
2021]

COVID-19 deaths are known to be disproportionately higher in older people. The 80+ age group
comprised 60% of total deaths in 2020, whilst the corresponding percentage is 84% for ages 70+ and
98% for ages 50+ (Figure 5).

The proportion of deaths in the older age groups were broadly similar during the four periods and for
every week in the last two months of 2020. A reduction in the proportion in the 80+ age group is
observed from 8th Jan 2021; however, it is unclear if this is due to lockdown, vaccinations or other
confounding factors.

The proportion of deaths by age group is a simple metric that exhibits a crude age-related pattern for
the last few months of 2020. It is based on absolute death numbers, but there are other metrics which
we will explore further that may provide better insights into the relative mortality relationship between
age groups.
 10
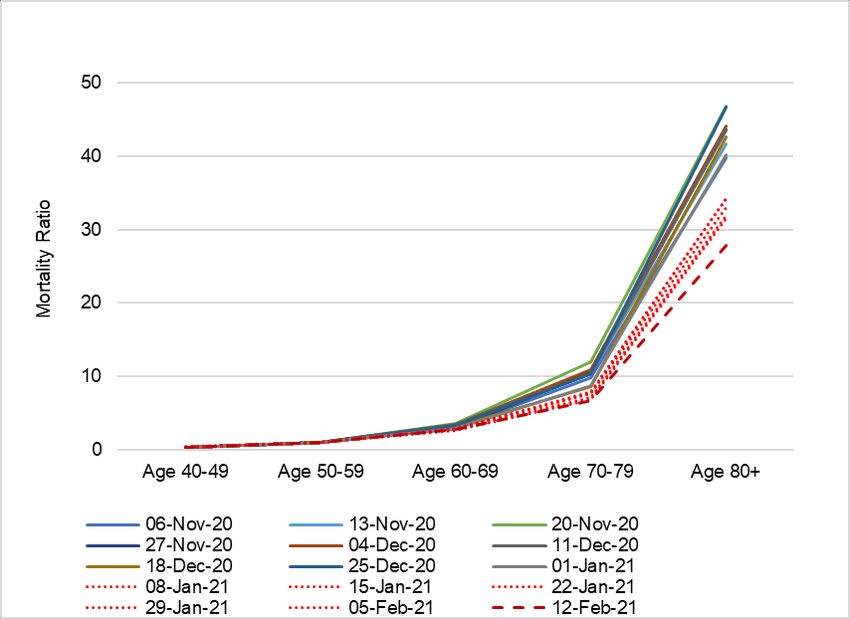
2.2 Rate of age-related increase in mortality

An alternative way to consider the impact change in older age groups is to consider the rate of age-
related increase in COVID-19 mortality. We have considered the increase in COVID-19 mortality risk
by considering mortality ratios (Appendix 10.1 and 10.2) that we then used to calibrate a Gompertz
function:

 ( ) =

where m(x) is the force of mortality for an adult with age x, where A is the baseline mortality and α is
the rate of age-related increase in mortality (also known as the senescent component).

The exponential patterns of COVID-19 mortality rates are observed in many countries and are
associated with all-cause mortality. Therefore, α is a useful metric for mortality experience
comparisons [6] [7].

The parameter α measures the gradient of the mortality ratios by age, through its derivation from the
slope of regression line of log mortality ratios by age. Note α is a generalisation of mortality ratios,
because it measures the relative mortalities of the 80+ age group, with respect to the 40-49, 50-59,
60-69, 70-79 age groups simultaneously.

Figure 6: Rate of age-related increase in mortality and by weeks ended 16th Oct 2020 – 12th Feb 2021

Figure 6 shows that the values of α for each of the final 12 weeks of 2020 are remarkably similar -
they are notably consistent even with the introduction of new lockdown measures in November, the
continued shielding of vulnerable patients, different levels of acquired immunity, the emergence of a
more infectious new variant, as well as increasing levels of infection and death. In other words, the
mortality relationship between age groups is preserved under this metric for many weeks under many
external influences leading up to the vaccination programme.

In addition to the above, the slope of mortality by age is generally consistent during various periods in
2020 (Appendix 10.2). This implies that the mortality of younger ages is predictive of the mortality of
older ages throughout the pandemic prior to the vaccination roll out.

 11
There is a material change from weeks ending 8th January to 12th February 2021 compared to
previous weeks. The reduction of age slope coincides with a period when a stricter lockdown was
introduced and when a vaccination programme may have begun to take effect.

2.3 The new variant

The SARS-CoV-2 lineage B.1.1.7, also known as VOC 202012/01 (Variant of Concern, year 2020,
month 12, variant 01), was first recorded on 20th September 2020 in Kent, UK and sequenced in early
October 2020 [8]. Studies showed it had a rate of transmission 71% higher than other variants and
had an absolute increase in the R-value of between 0.39 and 0.93 [9].

An Imperial College London study by Volz et al found that there is a larger share of under 20 year
olds among reported VOC than non-VOC cases [10]. Neil Ferguson, a NERVTAG member, said that
this was expected because of schools remaining open during lockdown, and among those aged under
15 there were slightly more cases of the variant virus in the community than the non-variant, though
not significantly so [8].

The fact that the cases of B.1.1.7 are slightly higher for those under 20 years old should not skew the
value of α, which is based on mortality of 40+ age groups (section 10.2).

In addition to increased transmissibility, there were concerns that the new variant may be more
severe. The London School of Hygiene & Tropical Medicine (LSHTM) reported the relative hazard of
death within 28 days of test for VOC-infected individuals was 1.35 compared to non-VOC. Imperial
College London reported the mean ratio for COV-infected individuals compared to non-VOC was
1.29-1.36. Both studies demonstrated that the relative increases in case fatality rate (CFR) appeared
to be consistent across age groups [11].

If B.1.1.7 can induce a selective mortality effect (including infection and fatality after infection) on any
age groups which are more than 40 years old, then it would have manifested in the mortality curves in
December 2020, because the proportions of new variant in all cases in England were as high as 20%
and 30% in the 25th November 2020 and 2nd December 2020 weeks respectively [12]. However, the
trends show remarkably consistent slopes of mortality ratios by age and α to end of 2020 (section
10.1), suggesting it is unlikely that B.1.1.7 has a significant mortality bias on the 40+ age groups.

 12
3 Time lags from vaccine uptake to death registration

3.1 Vaccine build up

The following are some data concerning the time required for the vaccine to build up immunity:

 1. The NHS and Public Health England (PHE)’s “COVID-19 vaccination: What to expect” leaflet
 states that “it may take a week or two for your body to build up some protection from the first
 dose of vaccine”. This advice is given to patients attending vaccination appointments [13].
 2. The Commission on Human Medicine says partial immunity occurs after the first dose of
 Pfizer vaccine and people will be immune seven days after the second dose [14].
 3. Based on the timing of cases accrued in the phase 3 study, the PHE’s green book said that
 most of the Pfizer vaccine failures in the period between doses occurred shortly after
 vaccination, suggesting that short term protection from dose 1 is very high from day 10 after
 vaccination [15].
 4. Preliminary findings of the AstraZeneca vaccine showed that neutralising antibodies were
 induced at day 14 and 28 after first vaccination and titres increased after a second dose [15].

Compared to the following stages, there is more uncertainty in estimating the duration required for
vaccine build up.

3.2 Infection to symptom onset

The median incubation period of COVID-19 was estimated by the Annals of Internal Medicine to be
5.2 days (95% CI 4.5 to 5.8 days). The 25th percentile is 3.8 days and the 75th percentile is 6.7 days
[17].

3.3 Symptom onset to death

The ISARIC-CCP-UK study reported that hospital patients in the 80+ age group had a median time of
7 days from symptom onset to death, based on data after 1st August 2020 (before this period the
corresponding median time was 14 days). The median duration from hospital admission to death in
hospitalised patients aged 80+ is 2 days [18]. This implies the median time from symptom onset to
hospital admission is 5 days.

Given a substantial proportion of deaths of age 80+ are from care home patients, who are frailer and
may not have immediate access to ICU, the average time from symptomatic infection to death might
be shorter than 1 week [5].

3.4 Death registration

For deaths in care homes, notification must be sent to the Care Quality Commission (CQC) without
delay, typically within 2-3 days of death [20]. The figures are published as part of the ONS’s weekly
release. In England & Wales, all deaths must be registered within 5 days [21].

 13
3.5 Estimation of onset time of effect from vaccination

Table 1: Estimation of time lags

 Low estimate Middle estimate of time High estimate of
 of time lags lags time lags

 Time from infection to 4 days 5 days 7 days
 symptomatic onset

 Time from symptomatic onset 5 days 7 days 10 days
 to death (assuming frailty (for hospital deaths: 5
 in care homes) days from symptomatic
 onset to hospitalisation,
 then 2 days to death)

 Delay in registration of death 2 days 4 days 5 days
 (maximum)

 Total Vaccine build up Vaccine build up time Vaccine build up
 time + 11 days + 16 days time + 22 days

Suppose the vaccine-induced protection occurs after 10-14 days, then the total time lag from vaccine
uptake to ONS registered deaths is estimated to have a range of 21-36 days (Table 1).

3.6 Vaccination data

The percentage of vaccine uptake is the number of people vaccinated divided by the size of the
population in the cohort. The National Immunisation Management Service (NIMS) data shows the
cumulative percentages of vaccine uptake by age groups over different periods of time (Table 2). This
data did not have a split by care homes; however, it was reported on 15th January 2021 that the
British Prime Minister said 40% of elderly care home residents had been vaccinated at that point [22].

Table 2: Vaccination data for England [1] [23]

 Ages 80+ Age 79 and under
 First Dose – Second Dose – First Dose – Second Dose –
 Cumulative % Cumulative % Cumulative % Cumulative %
 vaccine uptake vaccine uptake vaccine uptake vaccine uptake
 8th Dec 2020 – 18.5 0 0.6 0
 27th Dec 2020
 8th Dec 2020 – 23.1 0.2 1.0 0.03
 3rd Jan 2021
 8th Dec 2020 – 28.0 5.8 1.6 0.12
 7th Jan 2021
 8th Dec 2020 – 36.5 9.8 2.3 0.19
 10th Jan 2021
 8th Dec 2020 – 59.4 10.7 4.4 0.24
 17th Jan 2021
 8th Dec 2020 – 79.7 11.6 8.3 0.26
 24th Jan 2021
 8th Dec 2020 – 88.1 11.8 13.1 0.29
 31st Jan 2021

 14
Based on vaccination data of England (Table 2), 18.5% of aged 80+ population, nearly a fifth, had
received the first dose between 8th December 2020 and 27th December 2020. Based on a weighted
average estimation this cohort received the first jab on 21st December 2020 [24].

For this cohort, the onset of impact on the ONS registered deaths is estimated to be between 11th and
26th January 2021, using the time lags estimates of 21-36 days (Section 3.5). Therefore, we may
observe some early degree of effect of the vaccination feeding through into mortality in the 2nd half of
January 2021.

For hospital deaths in this cohort, the onset time is estimated to be between 9th and 21rd January 2021
using the 19-31 days estimate (as the data is based on date of death and not when registered), and
the magnitude of impact, if present, is expected to increase over time.

 15
4 Hospital data in England and Israel

4.1 Consecutive reductions in Hospital Mortality Ratios in England
This section focuses on the deaths data of patients who have died in hospitals in England and have
tested positive for COVID-19, sourced from the National Health Service (NHS). Deaths reported in
this data are recorded against the date of death rather than the day the deaths were announced [3]

Figure 7: COVID-19 deaths in hospitals in England: Weekly mortality ratios for ages 80+ by weeks ended 31st
October 2020 – 20th February 2021, when the reference groups are (a) ages 40-59 (b) ages
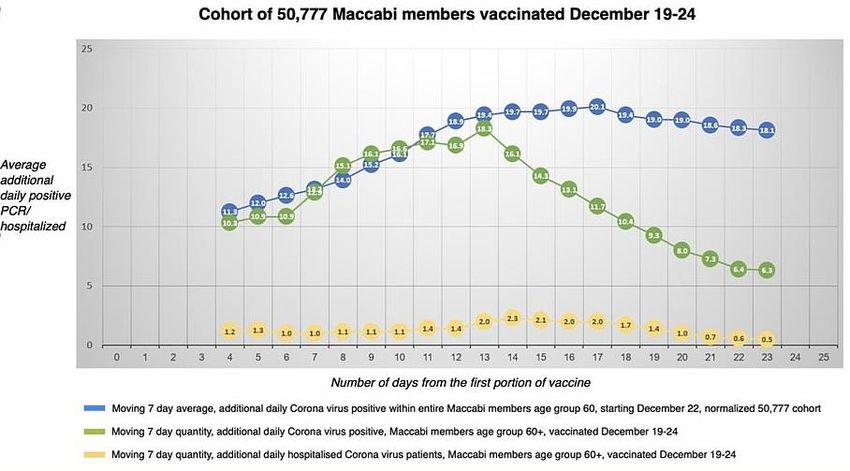
Figure 8: Average additional daily positive PCR and hospitalisation by the number of days from first dose of
vaccination, among Maccabi members. Image is sourced from the MailOnline and the KSM Maccabi Research
and Innovation Center

Source: [16]

In Figure 8, the blue line represents the infection rate in the general population, the green line
represents the infection rate among those vaccinated in December and the yellow line represents
hospitalisation among those vaccinated. The improvement began to show on day 14 after the first
dose, where infections in vaccinated group started to fall. Hospitalisation rates of the vaccinated
group started to improve on day 18. By 23rd day of vaccination after the first dose, there is a decrease
of slightly more than 60 per cent in the number of new hospitalised patients, according to the study
[16].

Regarding the emerging positive results from Israel, Prof Ran Balicer, founder director of the Clalit
Research Institute, said: “That could have two potential explanations. One is that somehow the over
60s have become much more careful about their daily conduct, and are very careful not to get
infected, or that vaccines on the population level begin to show their effects. I would strongly agree
that these ecologic data are quite reassuring and are quite promising. I would have been exceedingly
worried had we not seen on a population level already such a picture.” [27]

 17
5 Counterfactual predictive modelling

The aim of predictive modelling is to estimate the level of deaths in the 80+ age group in the
counterfactual scenario, where the modelled environment after 8th December 2020 (start date of
vaccination programme in the U.K.) is taken to be the same as that in the period of October to
November 2020, including but not limited to no vaccination.

If we hypothetically assume that the vaccination rollout is the cause of the diverging mortality risk
observed in hospital deaths and registered deaths, with no other external influences, then this
counterfactual scenario becomes a so-called “unvaccinated” scenario.

A variety of predictive models are used to explore the counterfactual scenario for registered deaths:

 • a linear regression approach across age groups (Model R1)
 • a simple approach based on mortality ratios (Model R2)
 • an epidemiological approach based on Gompertz function (Model R3), and
 • a hybrid approach of epidemiology and machine learning, known as Gompertz Network
 (Model R4)

The following predictive models are applied in the counterfactual scenario for hospital deaths:

 • a linear regression approach across age groups (Model H1)
 • a simple approach based on mortality ratios (Model H2)

The heuristics of the above approaches comes from the observation that the mortality of younger
ages is predictive of the mortality of older ages throughout the pandemic and pre-vaccination
(Appendix 10.2).

For each model the inputs are mortality rates (derived from COVID-19 registered death counts and
population data) of younger age groups, and the model outputs are predicted mortality rates for ages
80+ for a given time period. 70-79 age group was not used due to its vaccination coverage, because
the modelling approach assumes the input age groups are unvaccinated. In addition, modelling with
or without 70-79 age group as an input gave very similar accuracy, so leaving it out can help with
reducing model complexity.

For registered deaths, the training data from weeks ending 16th October 2020 to 4th December 2020 is
used to fit the model parameters. The model is then evaluated on an out-of-sample test dataset
covering the weeks ending 11th December 2020 to 1st January 2021. The best performing model is
used to predict the expected level of deaths in ages 80+, in the counterfactual scenario, for the future
weeks.

For hospital deaths, the training period is from weeks ending 3rd October 2020 to 5th December 2020
while the out-of-sample evaluation period is from weeks ending 12th December 2020 to 2nd January
2021.

Model accuracy or performance is measured by mean absolute percentage error (MAPE), which is
calculated as the average of the absolute difference in the residual (predicted mortality less actual
mortality of 80+ age group) over the actual mortality.

The comparisons of time series results are presented using the “Actual vs Expected” (AvE) metric,
calculated as dividing the actual mortality over the expected mortality of ages 80+, where the
expected mortality is the mortality prediction under the counterfactual scenario.

 18
Table 3: Overview of predictive models for registered deaths

 Model R1 - Model R2 – Model R3- Model R4 -
 Linear regression Mortality Ratio Simple Gompertz Gompertz Network

 Description Weighted average Estimate the Derive (rate of age- Four Gompertz models
 of mortality from average mortality related increase in are derived from four age
 age groups 30-39, ratio of ages 80+ mortality) from training groups: 30-39, 40-49, 50-
 40-49, 50-59 and and ages 50-59 from data. Thereafter use it 59 and 60-69. They are
 60-69. training data. for model scoring. combined using a
 Thereafter use it for weighted average
 model scoring. approach, using Lasso
 regularisation.

 Train Accuracy 4.4% 5.9% 5.7% 5.4%
 (MAPE1)
 Test Accuracy 4.5% 4.4% 5.3% 3.5%
 (MAPE)

 Advantage Good accuracy Simple calculation considers multiple Best test accuracy
 Easy to understand and decent accuracy age groups

 Disadvantage Slightly less test Subject to Subject to fluctuations Less intuitive to
 accuracy than fluctuations in the in the reference age understand
 Gompertz Network reference age group group

Table 4: Overview of predictive models for hospital deaths

 Model H1 - Model H2 –
 Linear regression Mortality Ratio

 Train Accuracy 4.2% 6.8%
 (MAPE)

 Test Accuracy 7.1% 6.5%
 (MAPE)

We also constructed counterfactual modelling for:

 • PHE’s COVID-19 associated deaths, where deaths are only included if the deceased had a
 positive test for COVID-19 and died within 28 days of the positive test [4].
 • ONS’ COVID-19 associated deaths, where deaths are based on date of occurrence [5].

PHE and ONS show similar results but are more volatile. The corresponding linear regression
approach has a training error of 7.8% and test error of 12.6% for PHE, and a training error of 6.4%
and test error of 7.8% for ONS. Hence the associated models were not used. For completeness, we
included the results for these models in Appendices 10.3.

1MAPE is the mean absolute percentage error. Assuming a MAPR of 3%, a death count of 100 is
expected (on average) to be accurate to the degree of +/- 3 deaths.
 19
5.1 Model R1 – Linear Regression for registered deaths

Method:

 80 = 30 39 ∗ 30 39 + 40 49 ∗ 40 49 + 50 59 ∗ 50 59 + 60 69 ∗ 60 69
 + − − − − − − − −
M is the force of mortality (central rate of mortality) and the 30-39, 40-49, 50-59, 60-69 and 80+ refer
to the age groups. W is the weight that is estimated by minimising the MAPE.

This weighted average approach simultaneously takes all of the age groups (30-39, 40-49, 50-59, 60-
69) as reference groups, hence the fluctuations are decreased and the prediction are driven more by
common patterns present in all of the age groups, rather than from just a single reference group. The
model automatically allocates more weights to the age groups that are more credible, for example
some of the lower age groups can suffer from little data and some of the older age groups have more
heterogeneity [28].

Figure 9: Results of the Model R1 (Linear Regression) by (a) Actual vs Expected (b) Registered deaths

The AvE was stable, i.e. close to the 100% line from 16th October 2020 to 1st January 2021, showing
the model is generalisable to many weeks in the last three months of 2020, despite the lockdown in
November, the emergence of new variant as well as varying levels of infections and deaths (Figure 9).

It is worth noting that the predictive model seemed capable to capture the upward trends, downward
trends and peak of the mortality of 80+ age group, through translating the patterns from the younger
age groups.

5.2 Model R2 – Mortality Ratio for registered deaths

Method:

 80 = 50 59 ∗ 50 59
 + − −
R50-59 is the average mortality ratio calculated by averaging the ratios of 80+ mortality rate over 50-59
mortality rate during the training period. The estimated value of R50-59 is 43.4.

The reference group of 50-59 is chosen based on variable importance test on the age groups. This
approach is very simple to use and understand, but the accuracy is less than the linear regression

 20
approach because the prediction is subject to fluctuations in the reference age group. The shape of
the AvE is similar to the linear regression approach (Figure 10).

Figure 10: Results of the Model R2 (Mortality Ratio) by (a) Actual vs Expected (b) Registered deaths

5.3 Model R3 – Simple Gompertz for registered deaths

Method:

 80 = 40 59 ∗
 + −
α is the rate of age-related increase in mortality (section 2.2) and estimated to be 0.107.

The Simple Gompertz model has a similar structure to the Mortality Ratio model, but the derivation of
α involves multiple age groups’ mortality rather than just the mortality of ages 50-59. However, this
approach still has the weakness of extrapolating from a reference age group. The shape of the AvE
is similar to models R1 and R2 (Figure 11).

Figure 11: Results of the Model R3 (Simple Gompertz) by (a) Actual vs Expected (b) Registered deaths

5.4 Model R4 – Gompertz Network for registered deaths

Method:

The “Gompertz Network” mortality model demonstrated the best out-of-sample accuracy. It is made
up of a few layers, as seen in Figure 12. The Gompertz function takes advantage of the “invariant”
 21
metric discussed in section 2.2 and section 10.2, i.e. the rate of the age-related increase in mortality.
The weighted average approach considers the Gompertz projections from each age group onto ages
80+, reducing variance while allocating more weights to the age groups that are more credible,
ultimately improving accuracy. The shape of the AvE is similar to models R1, R2 and R3 (Figure 13).

Figure 12: The Gompertz Network mortality model

Figure 13: Results of the Model R4 (Gompertz Network) by (a) Actual vs Expected (b) Registered deaths

5.5 Model H1 – Linear Regression for hospital deaths

Method:

 (80 +) = 0 19 ∗ 0 19 + 20 39 ∗ 20 39 + 40 59 ∗ 40 59 + 40 59 ∗ 40 59
 − − − − − − − −
M is the force of mortality (central rate of mortality) and the 0-19, 20-39 and 40-59 refer to the age
groups. W is the weight that is calculated by minimising the mean absolute percentage error.

 22
Figure 14: Results of the Model H1 (Linear Regression) by (a) Actual vs Expected (b) Hospital Deaths

Compared to registered deaths, there are slightly more fluctuation in predictions of hospital death
between October and December 2020. Nevertheless, the model accuracy of 4.2% (in October and
November 2020) is reasonable showing that the model is generalisable to predict 80+ mortality
despite only having 3 inputs. There is a visible increase in actual hospital deaths in ages 80+ in
December 2020 which results in a higher error during that period (Figure 14).

5.6 Model H2 – Mortality Ratio for hospital deaths

Method:

 80 = 40 59 ∗ 40 59
 + − −
R40-59 is the average mortality ratio calculated by averaging the ratios of 80+ mortality rate over 40-59
mortality rate during the training period. The estimated value of R40-59 is 52.7.

The reference group of 40-59 is chosen based on variable importance test on the age groups. As
discussed, the predictions given by this approach is subject to noise in the reference age group
(Figure 15).

Figure 15: Results of the Model H2 (Mortality Ratio) by (a) Actual vs Expected (b) Hospital Deaths

 23
5.7 Summary of results

5.7.1 Registered deaths

Overall, the registered deaths results are similar across the different approaches where Model R4
(Gompertz Network) is showing a slightly lower reduction compared to other models (Figure 16). The
Gompertz Network has the best test accuracy and is a more sophisticated approach but less intuitive
to understand compared to the simpler models (Models R1, R2 and R3). As with other models, the
Gompertz Network model shows a statistically significant reduction in mortality, where the confidence
interval no longer overlaps with 100%, from mid-January that is sustained up to 12th February 2021
and the associated reduction is 32%.

Figure 16: Registered deaths: Actual vs Expected comparison of predictive models

5.7.2 Hospital deaths

Overall, the results are similar across the two models H1 (Linear regression) and H2 (Mortality ratio).
The reduction of deaths becomes statistically significant, like the registered deaths, from mid-January
onwards (Figure 17). Since then, the hospital mortality reduces consistently for many weeks, and the
AvE level was 50% in the week ending 20th February 2021.

 24
Figure 17: Hospital deaths: Actual vs Expected comparison of predictive models

For ease of comparison in Figure 18, the weeks recording the hospital mortality data differs with those
of registered deaths by one day, for example the week ending 8th January 2021 for registered deaths
was plotted together with the week ending 9th January 2021 for hospital deaths. Note we expect the
trend of registered deaths to delay behind the trend of hospital deaths because it is subject to
registration delays.

This modelling illustrates a steeper improvement in hospital mortality compared to registered deaths
and is again sustained until February 2021.

For registered deaths, there was a slight uptick in the period around 22nd January 2021, which is likely
due to outbreaks in care homes. This could mask the potential improvement in mortality if the impact
of vaccination is present.

Figure 18: Hospital deaths and registered deaths – Actual vs Expected using model H1 and model R4

 25
6 Antibody data for the community population in England

The ONS published data on presence of antibody to the coronavirus within the community population,
excluding those in care homes or other institutional settings. It is estimated that 90% of people aged
80 years and over live in private households and 10% live in other establishments such as care
homes [29] [30].

The ONS analysis is based on blood test results used to test for antibodies, as a result of past
infection or vaccination. The analysis shows ages 80+ is the age group with the highest percentage of
people testing positive for antibodies for both periods 22nd December 2020 to 18th January 2021 and
5th January 2021 to 1st February 2021 (Figure 19).

Figure 19: Estimated percentage of people testing positive for antibodies to SARS-CoV-2 from a blood sample by
age, for the periods 22nd Dec 20 to 18th Jan 21 and 5th Jan 21 to 1st Feb 21

On the other hand, antibody detection remained highest in younger age groups (during the period 5
January to 1 February 2021) in Wales, Scotland and Northern Ireland, which have immunised a
smaller proportion of the older population [30].

The Real Time Assessment of Community Transmission (REACT2) study in England between 15 th to
28th September 2020, shows that ages 75+ has the lowest prevalence of antibody positivity compared
to ages 18-24, ages 25-34, 35-44, 45-54, 55-64 and 65-74 [31].

If the 80+ age group had one of the lowest antibody prevalence leading up to the vaccination
programme, then the fact that it became the age group with the highest level in the period 22 nd
December 2020 to 18th January 2021, and three times the multiple of the percentage of the 75-79 age
group, implies that the vaccination is likely starting to give results within this time period.

 26
Figure 20: Changes in percentage of people testing positive for antibodies to SARS-CoV-2, for the periods 22nd
Dec 2020 to 18th Jan 2021 and 5th Jan 2021 to 1st Feb 2021

Figure 20 shows that age 80+ shows the highest increase, i.e. 15.2%, between the two periods,
where the percentage testing positive for antibodies increase from 25.7% to 40.9%.

Without access to granular data, we perform a crude estimation on whether the 15.2% increase is
associated with an impact on the mortality metrics. Considering the antibody data comes from the
community population, hospital death is a more suitable metric than registered death because it is
less influenced by deaths of care home residents.

A simplistic approach is adopted by assuming the change comes from the medians of the two
periods, i.e. 15.2% from 5th January to 19th January 2021. The duration from infection to hospital
deaths is estimated to be 12 days in Section 3, so the corresponding reference period for hospital
deaths is 17th January to 31st January 2021. Using results from the predictive models in section 5.5,
the estimated reduction in hospital mortality from 17th January to 31st January is 13%, and from 22nd
January to 6th February 2021 is 15%. Hence the 15.2% increase in percentage of positive antibody
tests to SARS-CoV-2 is associated with 13-15% reduction in hospital mortality for the 80+ age group
(Figure 21).

The ONS suggested the high percentage of antibody presence in the 80+ age-group is “mostly likely
due to the high vaccination rate in this group” [30], this suggest that the vaccination is likely to play a
role in both the increase in antibody prevalence and the reduction in hospital mortality (Figure 22).

 27
Figure 21: Association between the increase in percentage of community population testing positive for
antibodies to SARS-CoV-2 and the increase in estimated mortality improvement of hospital deaths

Figure 22: Timeline of percentage of vaccination uptake, percentage of community population testing positive for
antibodies to SARS-CoV-2, as well as estimated mortality improvement of hospital deaths and registered deaths
of ages 80+ in England

 28
7 Discussion of the causes of mortality reduction in the 80+ age group

In order to better understand the impact of the vaccination rollout on mortality of the 80+ age group,
we have used various actuarial and data science techniques to model the relative mortality in the 80+
age group compared to younger ages groups, where the latter is relatively unaffected by vaccinations.

Are we starting to see early signals of the immunity build up in the 80+ age group and preventing
deaths, compared to younger age groups?

Considering the time lags from infection to death due to COVID-19, for the cohort of lives vaccinated
between the 8th and 27th December 2020 (nearly a fifth of the 80+ age group), we expect to start
seeing an effect between the dates 9th to 21st January 2021 for hospital deaths and 11st to 26th
January 2021 for registered deaths. Therefore, we expect the vaccine roll out to start reducing
mortality even more in the second half of January 2021 and onwards.

We do see a fall in hospital and registered mortality of 80+ age group in the first half of January but it
is still within 95% confidence intervals. There might be a mild vaccination effect, but we suspect the
reductions are mostly due to noise and other confounding factors. However, we are seeing
statistically significant reductions in deaths against the counterfactual scenario from mid-January
2021 (section 5) that is consistent with what we expect from the time lag for vaccination to translate
into mortality impacts in the 80+ age group.

A pre-requisite for the plausibility of vaccination-induced mortality reduction depends on the existence
of antibody build up from vaccination. Evidence from the ONS and REACT study (section 6) suggests
drastic increases in prevalence of antibody positivity in the 80+ age group in England, which achieved
25.7% for the period 22nd Dec 2020 – 18th January 2021 and 40.9% for the period 5th January 2021 –
1st February 2021, especially considering their lower levels than younger age groups historically and
in Wales, Scotland and Northern Ireland. These timings suggest a degree of immunity build up could
have happened by the end of December 2020 or early January 2021. There is more certainty in
seeing how the 15.2% increase in prevalence between the two periods is associated with a similar
magnitude of hospital mortality reduction (section 6).

If one believes the deviation of mortality experience is solely due to vaccination, then the above
counterfactual scenario becomes a so-called “unvaccinated” scenario. However, we have seen a
much tighter lockdown going into January (compared to November) where schools were closed,
people’s behaviour may have changed given the government messaging and the intensive pressure
in hospitals around the end of December 2020. This could lead to people in the 80+ age group
changing behaviour and becoming more cautious compared to other age groups. We believe this
could be possible, but unlikely to have caused the observed significant change in mortality based on
evidence from previous lockdowns.

Is it possible to disentangle vaccine impact from other cofounding factors?

The predictive modelling work in section 5 was carried out using four different approaches for
registered deaths and two different approaches for hospital deaths. Each of them gave a similar
shape indicating of mortality reduction for the 80+ age group when compared to the counterfactual
scenario.

The lockdown in November 2020 had little effect (looking at data from mid Nov – mid Dec) on the rate
of age-related increase in mortality (α). Similarly, “Actual” is still very close to “Expected” across a
range of different predictive models for both November and December 2020. On the contrary, there
are signs of actual mortality slightly higher than expected in December 2020. The November 2020
lockdown is less strict than the January 2021 lockdown which involved school closures. However, if
lockdown is a significant factor affecting the model (in the form of mortality reduction in 80+ age

 29
group) then we would expect to see at least “some reduction effect” from mid-November to mid-
December, which is not the case.

The stricter national lockdown started on 4th January 2021. If the lockdown has a steep mortality
impact, we expect to see a step change in the second half of January 2021 and this reduction is
expected to plateau afterwards as there is a limit to behavioural change and the lockdown has not
become stricter. However, there is no sign of slowing down because the hospital mortality reduction
continued consistently, going from 28% reduction by 23rd January 2021 to 50% reduction by 20th
February 2021.

The rising and descending levels of infection and death are accounted for because the predictive
models are capable of credibly picking up upwards trends, downwards trends and peaks, as
evidenced by the actual vs predicted number of deaths charts in section 5.

We also considered the new variant where the evidence suggested that there isn’t a significant age
bias for ages 40+ (section 2.3).

The shape of the counterfactual modelling scenarios tells us that if there is one main source driving
the change in the mortality of ages 80+, then this single force was:

 1. non-existent between October and December 2020
 2. started to exert impact in January 2021
 3. increases in intensity since January 2021

Compared to other factors listed in this paper, the immunity build-up from vaccination is most likely to
exhibit the above characteristics.

On the other hand, one of the advantages of the counterfactual modelling approach is that upon
seeing an effect, one can perform scenario testing on whether 100% or 80% or even none of the
observed effect is due to vaccination. To better account for the confounding factors, the predictive
models would benefit from more granular data of those factors.

We attempted to mitigate model risk by using several different approaches. There exist some
differences but overall, they all suggest a slightly fall early January followed by a statistically
significant reduction in the 80+ age group compared to younger age group from mid-January 2021.

Overall, we are seeing good evidence of the impact of vaccination roll-out was starting to reduce
mortality in the 80+ age group in the second half of January 2021. The results also suggest that the
impact of the vaccination is increasing over time as the reduction continues to reduce as the 80+ age
group builds up immunity.

 30
8 Limitations

It is important to highlight the following limitations and caveats on the calculations performed and
results presented within this paper:

 • Hospital deaths made up 76% of registered deaths in the last three months of 2020. It reflects
 a majority of deaths in the population, but it missed out a sizeable proportion too, particularly
 those from care homes. However, this death metric is less skewed by care home outbreak
 when compared to total deaths.
 • Deaths registered in the week ending 8th January 2021 should be interpreted with caution due
 to possible registration delays over the Christmas period. It is assumed that any delay
 affected all age groups similarly, so that the effect is nullified in mortality ratio calculations.
 • Our calculations focused on mortality impact and does not estimate infection risk explicitly.
 However, infection risk is implicitly accounted for, since mortality risk is the combination of
 infection risk and fatality after infection. Note that α remained consistent throughout the final
 12 weeks of 2020 despite being subject to different levels of infection.
 • The vaccination roll-out consists of first doses, second doses and two types of vaccines,
 which could be difficult to unpick. Generally, the early effect of vaccination, if present, is likely
 due to the first dose of the Pfizer-BioNTech vaccine. The Oxford-AstraZeneca vaccine was
 only rolled out after 4 January 2021.
 • More accurate estimates of population mortality impact due to vaccination require controlled
 trial or matched demographics with granular data of timing for first and second doses as well
 as tracking of infections, hospitalisations and deaths.
 • Could the relative time lag underestimate deaths in the 80+ age group? This is unlikely
 because the younger age groups (40 to 69 years old) have similar median of days from
 symptom onset to death as the 80+ age group, according to ISARIC-CCP-UK study [18]. The
 average timing of death registration for 80+ age group is likely to be slightly faster than
 younger age groups due to care home registrations, potentially contributing to a little
 overestimation of relative mortality rather than underestimation.
 • There was divergence of coverage and regional variation in vaccinated patients aged 80 or
 over and not living in a care home. OpenSAFELY reported lower rates among ethnic minority
 and deprived groups. Patients with pre-existing medical conditions were equally likely, or
 more likely, to have received a vaccine, except those with severe mental illness or a learning
 disability [32]. These differences have not been allowed for.
 • There could be other confounding factors that have been allowed for such as a step change
 improvement in administered treatments used in 80+ age group but not younger age groups,
 however, we consider this unlikely.
 • Insights derived from α and the predictive models assume that the younger age groups are
 not vaccinated. As the vaccination is rolled out to younger age groups, the trends of these
 metrics are expected to revert at some point.

 31
9 Conclusion

There is good evidence that the vaccination roll-out is starting to impact the mortality in the 80+ age
group from mid-January onwards, and more evidence of such impact in February 2021. The results
also suggest that the impact of the vaccination is increasing over time as the reduction persists as the
80+ age group builds up immunity.

We discussed to what extent the mortality reduction observed could have been due to other
confounding factors such as the January lockdown, however, whilst this may explain some of the
effect, there is compelling evidence using counterfactual scenarios that a key driving force for the
mortality reductions in 80+ age group from mid-January 2021 onwards is due to the vaccination roll-
out.

As a summary, actual versus expected results for ages 80+ under the counterfactual scenarios show
both hospital and registered deaths have statistically significant mortality reductions from middle of
January 2021 onwards:

 • Registered deaths show an estimated reduction of 32% up to 12th February 2021; and
 • Hospital deaths show consecutive mortality reductions for weeks and arrived at an estimated
 50% reduction by 20th February 2021.

The timing of the mortality reduction is compatible with the drastic increase in the prevalence of
community antibody positivity among the 80+ age group according to data published by the Office of
National Statistics.

We considered a range of modelling approaches which have provided greater insights, in addition to
looking at weekly changes in hospital admissions, hospital deaths or registered deaths. The key
concept is that younger age groups are great predictors of the mortality of the 80+ age group. This
enabled us to extract patterns and changes in mortality to give insights into the possible impact of
vaccination in the older age groups in England. It is imperative to continue monitoring the data to see
whether these results persist over the coming weeks.

 32
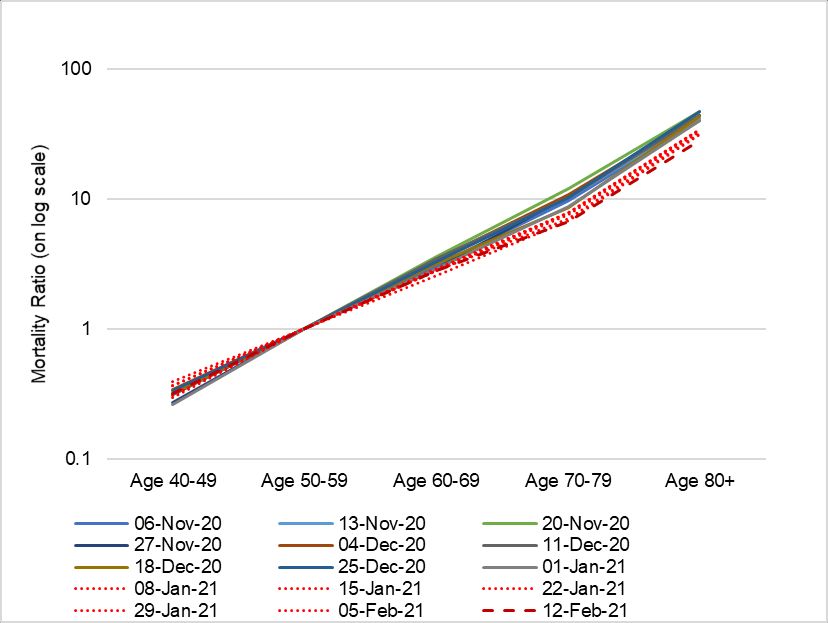
10 Appendices

10.1 Mortality ratios by age

When standardising death counts by population size, more meaningful comparisons can be made
between different age groups. The population data for England and Wales is extracted from the Office
of National Statistics [33].

The mortality rate for each age segment, X, is calculated as follows:

 ℎ
 =

One way to measure the relative mortality relationship between two age groups is to calculate the
ratio of their mortality rates. Using age group 50-59 as the reference group, the mortality ratio for
another age segment, Y, is calculated as follows:

 =
 50 − 59

Age group 50-59 was chosen as the reference group due to a few reasons. The younger age groups
have much smaller number of deaths (section 2.1) resulting in low credibility. Ideally, the chosen
reference group needs to be unaffected by vaccination to help with data comparison, and the
vaccination priority of ages 50-59 is behind ages 60-69, 70-79 and 80+. A final but very important
consideration comes from a University of Cambridge study which concluded that the age distribution
of deaths under 65 years old is highly consistent across different settings and likely to be a reliable
indicator of the number of infections in the population [34]. This study involved COVID-19 deaths data
from 45 countries and 22 seroprevalence studies [28]. The conclusion of this study is consistent with
the variable importance test which was run during the steps in section 5, which finds that the mortality
in ages 50-59 is the most important factor in predicting mortality in ages 80+, compared to ages 30-
39, 40-49, 60-69 and 70-79. Perhaps it is because ages 50-59 has more credibility than the younger
age groups and less heterogenous than the older age groups.

10.2 Rate of age-related increase in mortality ratio

Mortality ratios, when plotted for each age group in on a logarithmic scale, are remarkably linear,
implying that the mortality risk of COVID-19 increases exponentially with age (Figure 23).
Furthermore, it is interesting to see consistent slopes of the line for the four time periods considered in
2020, despite experiencing varying level of infections.

 33
You can also read