Health Policy Commission Board Meeting - November 1, 2017 - Mass.gov
←
→
Page content transcription
If your browser does not render page correctly, please read the page content below

Health Policy Commission
            Board Meeting
                November 1, 2017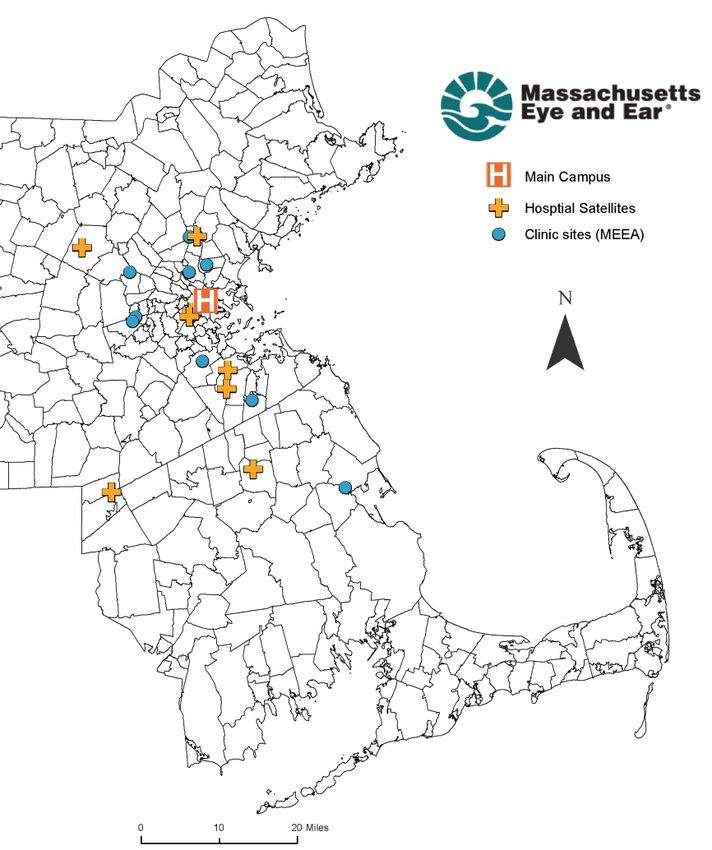
AGENDA Call to Order Approval of Minutes from the September 13, 2017 Meeting Chairman’s Report Market Performance Research Presentation Investment and Certification Programs Schedule of Next Board Meeting (December 12, 2017)
AGENDA Call to Order Approval of Minutes from the September 13, 2017 Meeting (VOTE) Chairman’s Report Market Performance Research Presentation Investment and Certification Programs Schedule of Next Board Meeting (December 12, 2017)
AGENDA Call to Order Approval of Minutes from the September 13, 2017 Meeting (VOTE) Chairman’s Report Market Performance Research Presentation Investment and Certification Programs Schedule of Next Board Meeting (December 12, 2017)

VOTE: Approving Minutes

MOTION: That the Commission hereby approves the minutes
of the Commission meeting held on September 13, 2017 as
presented.

                                                          5
AGENDA Call to Order Approval of Minutes from the September 13, 2017 Meeting (VOTE) Chairman’s Report Market Performance Research Presentation Investment and Certification Programs Schedule of Next Board Meeting (December 12, 2017)

2018 Health Policy Commission Calendar

 Board Meetings                       Special Events                   Advisory Council
 January 31, 2018       March 13, 2018 - Hearing on the Potential       January 17, 2018
  April 25, 2018           Modification of the 2019 Benchmark             May 9, 2018
   July 18, 2018        April 4, 2018 - Spring Special Event (TBA)        July 11, 2018
September 12, 2018   October 15 and 16, 2018 - 2018 Health Care Cost   November 14, 2018
December 11, 2018                    Trends Hearing

                                                                                           7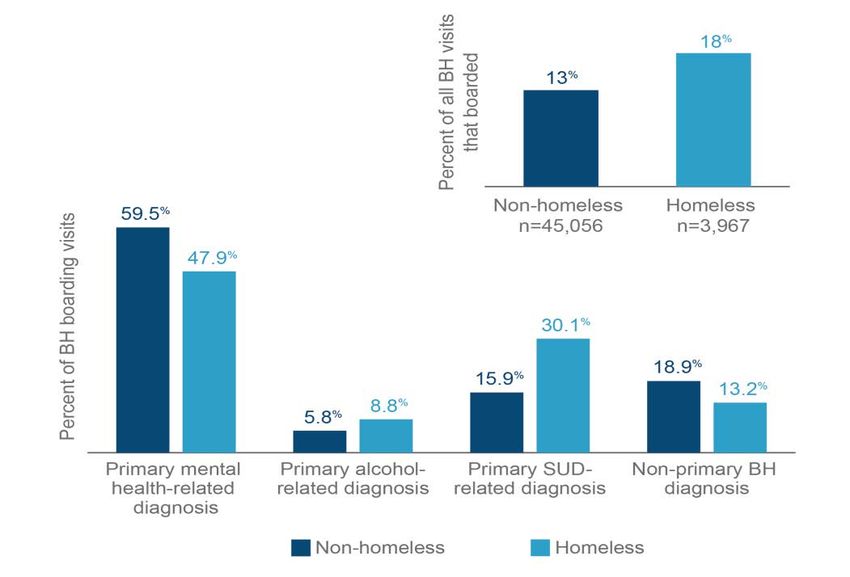
AGENDA
Call to Order
Approval of Minutes from the September 13, 2017 Meeting (VOTE)
Chairman’s Report
Market Performance
– Notices of Material Change
– Preliminary Cost and Market Impact Review: Partners HealthCare and
Massachusetts Eye and Ear Infirmary (VOTE)
Research Presentation
Investment and Certification Programs
Schedule of Next Board Meeting (December 12, 2017)
Types of Transactions Noticed

 April 2013 to Present

                                                         Number of
       Type of Transaction                                             Frequency
                                                        Transactions

       Clinical affiliation                                 20           23%

       Physician group merger, acquisition, or
                                                            19           22%
       network affiliation

       Acute hospital merger, acquisition, or
                                                            19           22%
       network affiliation

       Formation of a contracting entity                    15           17%

       Merger, acquisition, or network affiliation of
                                                             9           10%
       other provider type (e.g., post-acute)

       Change in ownership or merger of
                                                             5            6%
       corporately affiliated entities

       Affiliation between a provider and a carrier          1            1%

                                                                                   10
Notices Currently Under Review
Proposed acquisition of the non-hospital-based diagnostic laboratory business of Cape
Cod Healthcare by Quest Diagnostics Massachusetts, a subsidiary of a national
diagnostic testing provider.
Proposed acquisition of the non-clinical assets of Reliant Medical Group by the
OptumCare business of Collaborative Care Holdings, a subsidiary of UnitedHealth
Group.
Proposed merger of CareGroup, Lahey Health System, and Seacoast Regional Health
Systems, the related acquisition of the Beth Israel Deaconess Care Organization by
the merged entity, and the contracting affiliation between the merged entity and Mount
Auburn Cambridge Independent Practice Association.
Received Since 9/13
Acquisition of eight Community Health Systems hospitals in Ohio, Pennsylvania,
and Florida by Steward Health Care.
Acquisition of all 18 IASIS Healthcare Corporation hospitals by Steward Health
Care.
11Notices Currently Under Review
Received Since 9/13
Proposed joint venture between Shields Health Care Group and
Baystate Health that would own and operate an urgent care clinic for
patients in Baystate’s geographic region.
Proposed clinical affiliation between Harrington Memorial Hospital
(Harrington), its affiliated physician group, Harrington Physician Services
(HPS), and UMass Memorial Health Care under which several HPS
OB/GYN physicians would apply for staff membership and privileges at
UMass Memorial Medical Center.
Proposed acquisition of AdCare Hospital of Worcester, a for-profit
hospital that provides inpatient and outpatient substance use disorder
treatment services throughout Massachusetts and Rhode Island, by the
AAC Healthcare Network, a national for-profit provider of substance use
disorder treatment services.
12Elected Not to Proceed
Proposed acquisition of Community Health Care d/b/a Health Care
Resources Center, a for-profit provider of opioid dependency treatment
services throughout Massachusetts, by BayMark Health Services, a national
for-profit provider of opioid dependency treatment services.
Our analysis suggested little potential for changes in prices or shifts in referral
patterns.
The parties stated that they do not anticipate any changes to the services CHC
provides or the clinical management of CHC.
We did not find any evidence suggesting negative impacts on quality or access.
13CMIR In Progress
Proposed acquisition of the Foundation of the Massachusetts Eye and Ear
Infirmary and its subsidiaries, including the Massachusetts Eye and Ear
Infirmary and Massachusetts Eye and Ear Associates, by Partners
HealthCare System.
14AGENDA
Call to Order
Approval of Minutes from the September 13, 2017 Meeting (VOTE)
Chairman’s Report
Market Performance
– Notices of Material Change
– Preliminary Cost and Market Impact Review: Partners HealthCare and
Massachusetts Eye and Ear Infirmary (VOTE)
Research Presentation
Investment and Certification Programs
Schedule of Next Board Meeting (December 12, 2017)Overview of Cost and Market Impact Reviews
The HPC conducts cost and market impact reviews (CMIRs) of transactions
anticipated to have a significant impact on health care costs or market functioning.
CMIR INPUTS CMIR OUTPUTS
▪ Publicly available data and ▪ Preliminary report
documents
▪ Feedback from parties and other
▪ Confidential data and documents market participants
from parties, payers and other
providers ▪ Final report; transaction may close
30 days later
▪ Support from expert consultants,
including actuaries, accountants, ▪ Potential referral to Massachusetts
economists and care delivery Attorney General’s Office and/or
experts submission to Department of Public
Health Determination of Need
▪ Feedback from Commissioners Program
16About the Transaction
Partners HealthCare proposes to acquire the Foundation for the Massachusetts
Eye and Ear Infirmary (MEE), including:
Its anchor hospital, the Massachusetts Eye and Ear Infirmary (MEEI), and its
hospital and clinic satellite locations
Its physician group, Massachusetts Eye and Ear Associates (MEEA)
The proposed acquisition is also under review by the Department of Public Health’s
Determination of Need Program.
The parties have identified several goals of this acquisition:
For MEE to become the system-wide ophthalmology and otolaryngology resource
for Partners.
For MEE to utilize existing Partners facilities to provide its services in more
locations with substantially less capital investment than would be required to invest
in its own new facilities.
For MEE to achieve operating cost savings by utilizing Partners corporate services.
The parties have also stated that they expect to achieve “market competitive rates”
for MEEI and MEEA physicians in contracts not already negotiated by Partners.
17Background on the Parties: Partners HealthCare System
Largest health system in Massachusetts, with
$11.7B in operating revenue in FY15
Includes:
8 general acute care hospitals in Mass. with
2,928 staffed beds in FY15
A specialty psychiatric hospital (McLean)
A rehabilitation network (Spaulding)
A home health agency
An insurance carrier
A physician group, PCPO, contracting on
behalf of more than 6,700 physicians
Partners’ hospitals and physician groups are
among the highest priced in the Commonwealth
Partners hospitals do not participate in a number
of limited network products and Medicaid MCO
networks, and are often in the highest-priced tier
of tiered network products
18Background on the Parties: Mass. Eye and Ear
MEE Hospital and Physician
Acute care hospital specializing in ophthalmology Practice Sites
and otolaryngology
18 locations in Massachusetts, including the main
campus in Boston with 41 beds (21 adult, 20
pediatric), and 8 hospital satellites
Approximately $163M in net patient service
revenue; 90% of patient revenue is from
outpatient services
Medical group, Mass. Eye and Ear Associates
(MEEA), includes approximately 200 employed
specialists who already contract through the
Partners network with the three largest
commercial payers
MEEA physicians have dual appointments at
MEEI and MGH and serve as MGH’s
ophthalmology and otolaryngology departments
19Review Structure
Costs and Market Care Delivery and
Access
Functioning Quality
The HPC evaluated the Baseline Performance and current trends for each of
the parties across these areas.
Then, we evaluated the Impact of the Transaction across these areas.
20Costs/Market Quality Access
Cost and Market Baseline: Key Findings
Partners is the largest health care system in the state, with high
inpatient, outpatient, and physician market shares.
MEEI provides more outpatient otolaryngology and ophthalmology
services than any other provider in its service area, but a relatively small
share of inpatient services. Partners provides some overlapping
services, particularly outpatient otolaryngology.
Partners’ hospitals and physicians garner some of the highest prices in
the state, and its primary care patients have among the highest health
status adjusted medical spending.
MEE has substantially lower prices than Partners, and is frequently
treated by payers as a more efficient provider than Partners providers in
tiered and limited network products.
21Costs/Market Quality Access
Partners is the largest healthcare system in the state.
Costs/Market
Access
Quality
Commercial inpatient and outpatient market share statewide
2016 CHIA hospital discharge data and 2014 APCD data for the three largest payers
Hospital Share of Inpatient Share of Outpatient Facility
System/Network Discharges Visits
Partners 27.0% 26.7%
BIDCO 14.0% 13.0%
Lahey 8.1% 10.6%
UMass 7.0% 5.4%
Wellforce 6.2% 6.5%
Steward 5.9% 5.6%
All Other 31.9% 32.2%
Costs/Market
Quality Access
Commercial primary care market share statewide
2014 APCD data for the three largest payers
Physician
Share of Primary Care Physician Visits
Network
Partners 15.8%
Steward 10.7%
Children’s 9.8%
Wellforce 9.0%
All Other 54.4%
22Costs/Market Quality Access
MEE provides more outpatient otolaryngology and ophthalmology
services than other providers in its service area.
Shares of commercial outpatient facility visits in MEEI’s PSA
2014 APCD data for the three largest payers
Hospital Share of Hospital Share of
System/Network Otolaryngology Visits System/Network Ophthalmology Visits
MEEI 26.5% MEEI 34.6%
Partners 18.7% Wellforce 16.1%
Children’s 16.0% Lahey 11.5%
Lahey 7.1% BMC 8.9%
HealthSouth 6.2% Partners* 1.0%
All Other All Other
25.5% 27.9%
Combined Combined
Note: Although other providers have higher ophthalmology shares, Partners’ share is shown for reference
• MEEI facilities do not provide a substantial share of inpatient or all outpatient services.
• Partners facilities provide some services that overlap with MEE, particularly outpatient
otolaryngology. Partners physicians also provide a substantial share of ophthalmology
services in non-facility settings and in non-Partners facilities.
23Costs/Market Quality Access
Partners hospitals and physicians receive some of the highest prices in
the state; its community hospitals and AMCs are higher priced than MEEI.
Inpatient and Outpatient Blended Relative Price for Partners Community Hospitals and
AMCs, MEEI, and Local Comparators - BCBS 2015
24Costs/Market Quality Access
MEE has substantially lower prices than Partners, and is frequently
treated by payers as an efficient provider in tiered and limited networks.
For the three largest payers, Partners’ inpatient hospital prices are
approximately 11.5% higher (for some of its community hospitals) to
34.6% higher (for MGH) than MEEI’s prices.
For the three largest payers, Partners’ outpatient hospital prices are
approximately 6% - 52% higher (for some of its community hospitals) to
58% - 105% higher (for MGH) than MEEI’s prices.
MEEA physicians have low to mid-range prices for those payers for which
they don’t already contract through Partners. Partners’ physician prices
are higher.
Reflecting its relative efficiency, MEEI is frequently included in limited
network products and placed in the most efficient tier of tiered network
products.
25Costs/Market Quality Access
Quality Baseline: Key Findings
Partners is generally a high-quality provider system, performing equal to
or above the state average on most of the measures we examined.
Fewer standard measures are applicable to MEE, as a specialty provider,
but MEEI generally performs well on applicable quality measures.
Partners and MEE both demonstrate notable commitment to high quality
care through their internal quality measurement and reporting systems.
26Costs/Market Quality Access
Access Baseline: Key Findings
MEEI is the principal provider of a small number of uncommon specialty
services in its service area.
MEEI participates in more limited network insurance products and
Medicaid MCO networks than Partners hospitals, and is generally in
more favorable cost sharing tiers in tiered network products.
MEEI and most Partners hospitals have higher commercial payer mix
and lower Medicaid payer mix relative to comparator hospitals.
27Costs/Market Quality Access
MEEI participates in more limited network products than Partners and is
in more efficient tiers than Partners for tiered network products.
Tiered and Limited Networks for the Three Largest Commercial Payers
BCBS HPHC THP
Hospital
Tiered
Limited Network Tiered Networks Limited Network Tiered Networks Limited Network
Networks*
MEEI In Network Most Efficient In Network Most Efficient Out of Network Most Efficient
BWH Out of Network Least Efficient Out of Network Least Efficient Out of Network Least Efficient
MGH Out of Network Least Efficient Out of Network Least Efficient Out of Network Least Efficient
BWH Faulkner Out of Network Most Efficient Out of Network Middle Out of Network Least Efficient
Newton-
Out of Network Most Efficient Out of Network Middle Out of Network Least Efficient
Wellesley
NSMC Out of Network Most Efficient Out of Network Middle Out of Network Least Efficient
28Costs/Market Quality Access
MEEI participates in more Medicaid Managed Care Organization products
than Partners.
Medicaid Managed Care Organization Payer
Hospital
Neighborhood Health Tufts Health Public
BMC HealthNet Plan CeltiCare Health Plan
Plan Plan
MEEI In Network Out of Network In Network In Network
BWH Out of Network Out of Network In Network Out of Network
MGH Out of Network Out of Network In Network Out of Network
BWH Faulkner Out of Network Out of Network In Network Out of Network
Newton-Wellesley Out of Network Out of Network In Network Out of Network
NSMC In Network Out of Network In Network Out of Network
29Costs/Market Quality Access
MEEI and most Partners hospitals have higher commercial payer mix and
lower Medicaid mix than comparator hospitals.
Combined Inpatient and Outpatient Payer Mix for MEEI and Boston-area AMCs- 2016 GPSR
100%
90%
80%
70%
60%
Other
50%
Other Govt
40% Commercial
Medicaid
30%
Medicare
20%
10%
0%
Boston Medical Tufts Medical Beth Israel Massachusetts Brigham and Massachusetts
Center Center Deaconess General Hospital Women's Hospital Eye and Ear
Medical Center Infirmary
Note: Graph is in descending order of government payer patients, which is the sum of the yellow (Medicare), dark
blue (Medicaid/CHIP) and orange (Other Government) bars.
Source: CHIA Hospital Cost Report Data Access Tool (FY 2016 data).
30Costs/Market Quality Access
Cost and Market Impact: Key Findings
• The transaction is not anticipated to substantially increase Partners’ overall
hospital inpatient or outpatient market share. However, the transaction would
substantially increase its share of outpatient otolaryngology and ophthalmology
services.
• Partners would likely seek substantial hospital rate increases for MEEI’s main
campus and hospital-licensed outpatient sites after an acquisition.
• Over time, we estimate that health care spending would increase by $14.9 million
to $55.3 million annually if Partners achieves parity between MEEI’s rates and
those of Partners’ other hospitals, consistent with Partners’ past practice.
• As the MEEA physicians join Partners contracts for all commercial payers,
changes in MEEA’s physician rates would additionally increase total medical
spending in Massachusetts by approximately $5.9 million annually.
• The parties claim that the transaction would yield operational efficiencies and allow
MEEI to avoid capital expenditures. However, they have not committed to using
any resulting savings to reduce prices or otherwise reduce spending for payers or
consumers.
31Costs/Market Quality Access
Impact on Specialty Inpatient and Outpatient Services
Shares of commercial inpatient discharges in MEEI’s PSA
2016 CHIA hospital discharge data
Hospital System/ Network Share of MEEI Core Service Discharges Post-Acquisition
Partners + MEE 37.6% (34.0% + 3.5%)
BIDCO 12.7%
Lahey 12.1%
Wellforce 8.0%
Children’s 7.9%
All Other Combined 21.7%
Shares of commercial outpatient facility visits in MEEI’s PSA
2014 APCD data for the three largest payers
Share of Share of
Hospital System/ Otolaryngology Visits Hospital System/ Ophthalmology Visits
Network Post-Acquisition Network Post-Acquisition
MEEI + Partners 45.2% (26.5% + 18.7%) MEEI + Partners 35.6% (34.6% + 1.0%)
Children’s 16.0% Wellforce 16.1%
Lahey 7.1% Lahey 11.5%
HealthSouth 6.2% BMC 8.9%
All Other 25.5% All Other 27.9%
32Costs/Market Quality Access
Overview of Spending Impacts
Our analysis suggests that the proposed transaction would likely increase health
care spending for commercial payers due to rate increases in three areas:
Spending Included in Category
Facility billing for hospital inpatient services
Hospital inpatient rates if MEEI’s rates increase to be comparable to
other Partners hospitals
Facility billing for hospital outpatient services
(both at MEEI’s main campus and at
Hospital outpatient rates hospital-licensed outpatient sites)
if MEEI’s rates increase to be comparable to
other Partners hospitals
Professional billing for physician services in
hospital inpatient, hospital outpatient, and
MEEA physician rates
clinic settings as MEEA physicians join
Partners contracts with the remaining payers
33Costs/Market Quality Access
There would be a substantial increase to hospital spending over time if
Partners achieves parity in prices between MEEI and its existing hospitals.
The proposed transaction could increase commercial health care spending by $14.9
million to $55.3 million annually if Partners achieves parity between MEEI rates and
those of its other hospitals, which would be consistent with past practice.
34Costs/Market Quality Access
There would be an immediate increase to physician spending if MEEA
physicians join all Partners’ commercial payer contracts.
• The proposed transaction would increase commercial health care
spending by $5.9 million if MEEA physicians join Partners
contracts for the payers for which MEEA currently negotiates
independently.
• Unlike for hospital price changes, which would require contract
renegotiation, price changes for MEEA physicians may occur
immediately as these physicians join existing Partners contracts.
In total, the proposed transaction is projected to increase commercial
health care spending by $20.8 million to $61 million annually from
hospital and physician rate increases combined.
35Costs/Market Quality Access
The parties have not committed to using any savings from operational
efficiencies to reduce prices or otherwise reduce spending.
The parties claim that the transaction would yield operational efficiencies and
allow MEEI to avoid capital expenditures:
MEEI anticipates a need for new additional operating rooms due to increasing
demands for its services. By utilizing available operating room capacity at
Partners sites, MEEI expects to avoid capital expenditures.
In addition, the parties have identified several areas where they expect to achieve
operational efficiencies. These include integration of administrative and
information technology functions, sharing the costs of research infrastructure,
and improved borrowing rates for MEE.
Despite the parties’ expectation that these efficiencies would improve MEE’s
margins and support its clinical and research activities, they have not
committed to using the resulting savings to reduce prices or otherwise reduce
spending for payers or consumers.
36Costs/Market Quality Access
Quality Impact: Key Findings
The parties have stated that the proposed transaction would improve quality
by:
Integrating MEE into the Partners ACO model and integrating the parties’ quality
data and measurement programs.
Removing current HIPAA restrictions on sharing protected health information that
prevents clinicians from having “complete” access to a patient’s medical record.
It is unclear to what extent additional integration into Partners’ data infrastructure
would meaningfully alter MEE’s already-strong quality performance.
The parties have not described how the transaction would change ACO
participation and incentives for MEEA physicians, who already participate in
Partners contracts with the top three commercial payers.
While changes in the parties’ shared EHR system may result in administrative
efficiencies, the potential impact on overall clinical quality is uncertain.
The parties have not provided sufficient information for HPC to assess the
appropriateness of the quality improvement measures they have proposed.
37Costs/Market Quality Access
Access Impact: Key Findings
The parties have stated that the proposed transaction would improve patient
access to care by:
Making MEEI the Partners system-wide resource for ophthalmology and
otolaryngology services,
Meeting a growing need for ophthalmology and otolaryngology services by enabling
MEE to provide services at Partners community facilities, and
Ensuring that MEE can remain viable as a provider of specialty services in a market
shifting to ACO structures.
It is unclear why the proposed merger is necessary for MEE to be the Partners
system-wide resource.
Without details on where MEE may offer new or expanded services, the HPC cannot
evaluate to what extent MEE’s already broad geographic presence would expand.
Patient volume at MEE has increased substantially in recent years, despite its status
as an independent provider.
If MEE were to adopt Partners contracting patterns, patients in limited and tiered
plans may face barriers to accessing MEE’s services, potentially creating barriers to
access for the specialized services MEE provides.
38Next Steps
▪ Per M.G.L. c. 6D, § 13, the HPC issues a preliminary report
▪ The parties will have the opportunity to respond, and the
Commission will issue a final report thereafter
▪ The parties may not close the transactions until at least 30
days following the issuance of the final report
39Vote: Issuance of a Preliminary CMIR Report
Motion: That, pursuant to section 13 of chapter 6D of the Massachusetts
General Laws, the Commission hereby authorizes the issuance of the
attached preliminary report on the cost and market impact review of
Partners HealthCare System’s proposed acquisition of the Foundation of
the Massachusetts Eye and Ear Infirmary.
40AGENDA
Call to Order
Approval of Minutes from the September 13, 2017 Meeting (VOTE)
Chairman’s Report
Market Performance
Research Presentation
– Out-of-Network Billing
Investment and Certification Programs
Schedule of Next Board Meeting (December 12, 2017)AGENDA
Call to Order
Approval of Minutes from the September 13, 2017 Meeting (VOTE)
Chairman’s Report
Market Performance
Research Presentation
– Out-of-Network Billing
Investment and Certification Programs
Schedule of Next Board Meeting (December 12, 2017)Executive Summary and Key Findings
Goal of the study
• Building off past HPC reports¹, this study analyzes a sample of commercial health insurance claims to
better understand the characteristics of out-of-network billing in Massachusetts.
• This analysis is intended to inform the discussion of policies to address out-of-network billing in order to
protect consumers, improve market functioning, enhance the viability of limited network products, and
reduce costs.
Key findings
The HPC examined 70,000 distinct out-of-network Ambulance and ERAP providers (emergency,
claims in two of the largest commercial payer radiology, anesthesiology, or pathology)
networks in 2014, representing over 30,000 accounted for over 90% of out-of-network claims
members.
Average out-of-network payment rates for
Across a range of identical services, the average common ambulance services exceeded in-
spending on out-of-network claims far exceeded network rates by 22% to more than 200%
the average spending on in-network claims
For non-emergency ambulance transportation
In almost 2/3 of the cases, the insurer paid the full services, average out-of-network payment rates
charge amount of an out-of-network claim; in exceeded $1,100, compared to an in-network
other cases, the patient may have been liable for average payment rate of approximately $340
partial or full payment
Average out-of-network payment rates for
common ED visits were around 70% higher than
in-network rates
1 HPC 2016 Annual Cost Trends Report; HPC 2015 Annual Cost Trends Report; HPC 2015 Policy Brief on Out-of-Network Billing
43Background on Out-of-Network Billing
Out-of-network billing occurs when patients receive services from providers that
do not have a negotiated rate with the patient’s insurer
– Sometimes patients see out-of-network providers knowingly
– But, often, it is outside of the patients’ control, e.g.
• a third party firm staffing an Emergency Department (ED) at an in-
network hospital; or
• an out-of-network physician participating in a surgery without the
patient’s knowledge; or
• an ambulance company serving a geographic region.
With no negotiated rate, payment to providers is typically based on a price that
providers set for their services
– Payers may pay some or all of these charges, but they typically pay a higher
rate for these out-of-network services than they would pay in-network.
44Out-of-Network Billing Implications for Payers, Consumers, and Overall
Market Functioning
When payers pay higher rates to out-of-network providers:
– Those costs are passed along through higher premiums; and
– The costs of out-of-network payments may diminish or even surpass any
savings the payer may be able to achieve through limited network products.
If a payer does not pay the full amount charged by an out-of-network provider, the
patient can be “balance billed” and expected to pay the difference, sometimes
totaling thousands of dollars.
– This can occur even where the patient did not knowingly choose to see an out-
of-network provider (e.g. through a “surprise bill”).
Because of the cost of out-of-network billing, some payers seek to bring as many
providers in-network as possible, even at higher negotiated rates.
Looking at frequency of out-of-network billing, particularly for the largest/broadest
payer networks, therefore understates the impact of out-of-network billing on total
health care spending.
45National Research and Data on Out-of-Network Billing
Using data from one of the largest national insurers, Cooper and Morton (2016) found
that 22% of ED visits nationally involved an out-of-network ED physician1
In a follow-up study (2017) using data from the same payer they found2
– 50% of hospitals nationally have rates of out-of-network billing below 5%;
15% have a rate of out-of-network billing above 80%
– Rates of out-of-network billing are substantially higher at for-profit hospitals
– Outsourcing emergency staffing is a lead contributor to out-of-network billing
• 2/3 of hospitals nationally outsource ED staffing (for comparison, 1/3 of
Massachusetts hospitals substantially outsource ED staffing3 )
1 Cooper Z, Morton FS. Out-of-Network Emergency Physician Bills—An Unwelcome Surprise. Health Affairs; 2016 Nov 17.
2 Cooper Z, Morton FS, Shekita N. Surprise! Out-of-Network Billing for Emergency Care in the United States. National Bureau of Economic Research; 2017 Jul 20.
3 Registration of Provider Organizations, hospitals fall into this category if they report that an outside provider group provides “complete or substantial staffing” of their
ED
46HPC Study of Out-of-Network Claims
Out-of-network billing was identified by the HPC as an area of policy interest in the
2015 and 2016 Annual Cost Trends reports. Building off of past analyses, the HPC
sought to better understand the characteristics of out-of-network billing in
Massachusetts using the all-payer claims database (APCD).
We used 2014 claims from two large MA commercial payers that together represent
over 50% of the Massachusetts commercial market
– We identified out-of-network claims by using the ‘in network’ designation
submitted by these payers
– Claims are from MA residents under 65 who received care in Massachusetts
– Professional claims only (excludes facility claims)
Sample is limited to sites of service that could have involved multiple providers or
resulted in a surprise out-of-network bill:
– Emergency department All acute care hospitals in
– Ambulance Massachusetts are in both
– Hospital inpatient payers’ networks.
– Hospital outpatient
– Ambulatory surgical centers
– Urgent care
47Important Context and Caveats
Our estimates apply only to the portion of the Massachusetts commercial market
covered by the two payers in our sample
Estimates about the frequency and scale of out-of-network billing based on these two
payers are likely to be conservative:
– These are two of the largest payers in Massachusetts with the broadest networks
– The broader a payer’s network, the less likely it is that its members will encounter
out-of-network providers
– Insurers that are dominant in a particular market have more leverage to bring local
providers into their networks.
– Even between the two payers in this sample, the one with the larger market share
has a lower rate of out-of-network billing
– Estimates of out-of-network billing for payers with a national presence are much
higher1
1 The four largest national payers made up 24% of the MA commercial market in March 2017 (CHIA Enrollment Trends, 2017)
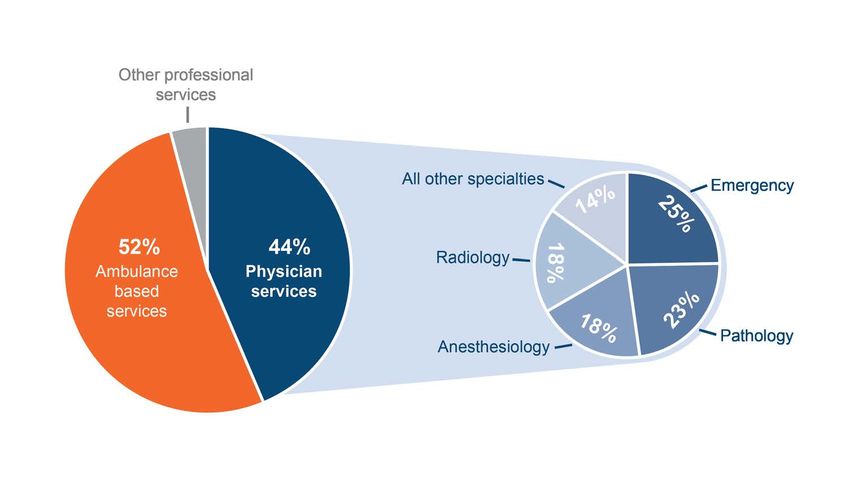
48By service/provider type, ambulance and ERAP providers account for
90% of out-of-network claims
The HPC identified 70,107 out-of-network professional claims for services provided to
30,538 individuals
Claims for ambulance-based services are the largest share of out-of-network claims for
professional services
Out of all out-of-network physician service claims, 85% were for emergency, radiology,
anesthesiology, or pathology (ERAP) providers
49How are out-of-network claims paid?
In almost 2/3 of cases, the insurer paid the full charge amount on an out-of-network claim
Nearly 1/4 of network claims in this sample may have resulted in a balance bill
– 9,668 Massachusetts residents in this sample could have received balance bills
– Average potential balance bill per member with any outstanding balance: $355
Potential balance bill: An out-of-network claim where the combined amount
paid by the insurer and the member (through deductible, copay, and
coinsurance) is less than the charge amount on the claim
50Across a range of services, the average spending on out-of-network
claims far exceeds the average spending on in-network claims
Combined spending on out-of-network professional claims for both payers in the sample
totaled $28.7 million in 2014.
– $27.0 million paid by insurers
– $2.2 million that might have been balance billed to patients
51For the same services, the range of spending on out-of-network claims is
often larger than for in-network claims
52Out-of-network payment rates for common ambulance services exceed
in-network rates by 22% to more than 200%, on average
Ambulance ground mileage
• In network: $214 22% 47% of all ambulance claims
• Out-of-network: $261
Emergency transport with advanced life support
• In network: $967 19% of all ambulance claims
67%
• Out-of-network: $1619
Non-emergency transport with basic life support
• In network: $338 9% of all ambulance claims
227%
• Out-of-network: $1107
Distribution of per claim spending for emergency transport with advanced life support
53Out-of-network payment rates for common ED visit types exceed in-network
rates by 68% to 81%, on average
ED visit moderate severity (99283)
• In network: $143
73%
• Out-of-network: $248 These three E & M codes for moderate
ED visit high severity (99284) to very severe ED visits make up
• In network: $237 46% of in-network ED claims and
• Out-of-network: $399 68%
71% of out-of-network ED claims
ED visit highest severity (99285)
• In network: $328
81%
• Out-of-network: $595
54State Policies to Address Out-of-Network Billing
Some states have taken effective approaches to protecting patients from out-of-
network emergency care and surprise billing
A handful of states have banned balance billing and established guidelines for
provider reimbursement (CA, NY, CT, FL, NJ)
In addition, these states have introduced some novel policies to address out-of-
network billing:
– New York (2014) resolves payment disputes about out-of-network claims through
a binding third party arbitration process
• Cooper et al. found that the NY law lowered the incidence of out-of-network
billing by one third
– California (2016) allows patient cost-sharing to count toward patient’s annual
maximum out-of-pocket allowance and requires out-of-network providers to
refund with interest any cost-sharing in excess of in-network rates
– Connecticut (2015) requires surprise bills issued to a patient to be marked with
“this is not a bill” and prohibits their referral to a collection agency if the patient
doesn’t pay
Note that state policies that address out-of-network billing may not affect self-funded
plans, which are federally regulated under ERISA (60% of the Massachusetts
commercial market)
55AGENDA
Call to Order
Approval of Minutes from the September 13, 2017 Meeting (VOTE)
Chairman’s Report
Market Performance
Research Presentation
Investment and Certification Programs
– Care Delivery Certification Programs
– Strategic Investment Programs
– Future Care Delivery Investments
Schedule of Next Board Meeting (December 12, 2017)AGENDA
Call to Order
Approval of Minutes from the September 13, 2017 Meeting (VOTE)
Chairman’s Report
Market Performance
Research Presentation
Investment and Certification Programs
– Care Delivery Certification Programs
– Strategic Investment Programs
– Future Care Delivery Investments
Schedule of Next Board Meeting (December 12, 2017)Practices Participating in PCMH PRIME
Since January 1, 2016 program launch:
42 practices
are PCMH PRIME Certified
107
Total
64 practices Practices
are on the Pathway to PCMH PRIME Participating
1 practice
is working toward NCQA PCMH Recognition and
PCMH PRIME Certification concurrently
58ACO Certification Program: Application Submission and Timeline
Beta Launch Certified ACOs
Community Care Cooperative (C3)
Boston Accountable Care Organization (BACO)
Full Launch
15 additional applications now under review
Timeline and Next Steps
October 1, 2017 – ACOs submit certification applications
By January 1, 2018 – HPC issues certification decisions
Full certification decisions are valid until December 31, 2019
2018 – HPC analyzes and reports on information received, re-opens application system as
needed, Applicants with provisional certification submit for full certification, etc.
59AGENDA
Call to Order
Approval of Minutes from the September 13, 2017 Meeting (VOTE)
Chairman’s Report
Market Performance
Research Presentation
Investment and Certification Programs
– Care Delivery Certification Programs
– Strategic Investment Programs
– Future Care Delivery Investments
Schedule of Next Board Meeting (December 12, 2017)CHART Phase 2 Statewide Convening: October 16, 2017
4 panels
> 250 Panel 1: Reducing
readmissions for high risk
attendees patients
Panel 2: Slowing the cycle
representing of high utilization for multi-
CHART visit patients
hospitals, state Panel 3: Improving care for
government, behavioral health patients
in the ED
payers, and Panel 4: Lessons learned,
providers capabilities developed, and
the future
8
breakout sessions
61CHART Phase 2 workforce: multidisciplinary and committed
250 full-time equivalents engaging approximately
CHART Phase 2
180,000 CHART-eligible acute encounters.1
1Based on reports received from CHART Phase 2 awardees through September 2017.
62Example panel slide: BID – Plymouth
Reducing returns for high risk patients
Team
29%
4 FTEs reduction
4 role to date
RN
types
Manager
1 Resource
1 RN CM 1 SW CM
Specialist
Average volume Success factors
85 Transition from telephone to community
70 outreach
125
(82%) patients/ Co-management of patients
month Leverage Resource Specialist’s skills
Discharges
Discharges/ served/ Engage patients while hospitalized
month month
CHART Phase 2 teams developed content for these slides for the purposes of the October 2017 Statewide Convening that reflects their hands-on experience, self-
reported data analysis, and key findings.
63Example panel slide: Harrington Memorial Hospital
Improving care for behavioral health ED patients
Team
34%
RN
8 FTEs reduction
4 role to date
Manager
types
SW
Analyst
Supervisor
LCSW 4 Navigators
Average volume Success factors
275
Address patients’ basic needs first
200 Creatively leverage community resources
120
(73%) Effective engagement tactics, frequent
patients/
contact
month
ED visits Adapt care model to achieve outcomes
ED visits/ served/ Drill down on data to understand impact
month month
CHART Phase 2 teams developed content for these slides for the purposes of the October 2017 Statewide Convening that reflects their hands-on experience, self-
reported data analysis, and key findings.
64CHART Phase 2 teams are passionate about their work and eager to
share their lessons learned with a broad group of stakeholders
“CHART allowed us to
shift the paradigm from
‘talk and tell’ to “listen
and ask.”
Mary Beth Strauss,
Winchester Hospital
“The CHW role is so important for
the ‘hand-holding’ – we’re all in this
room because we have someone to
hold our hands; our patients do
not.”
Lisa Brown, Lowell General Hospital
65CHART Phase 2: Progress as of October 2017
Baystate Joint Award
Lahey-Lowell Joint Award
Southcoast Joint Award
Hallmark Joint Award
96%
Holyoke Medical Center
Addison Gilbert Hospital
Baystate Franklin Medical Center
Baystate Noble Hospital
of Measurement
Baystate Wing Hospital Period program
CHART Phase 2 Awards
Beverly Hospital
months complete
HealthAlliance Hospital
Lowell General Hospital
Winchester Hospital
Anna Jaques Hospital
18 Teams
BIDH-Milton
BIDH-Plymouth
Emerson Hospital
Harrington Memorial Hospital will pursue No Cost Extensions,
Heywood-Athol Joint Award using unspent funds to continue
Lawrence General Hospital
the model or finalize reporting for
Mercy Medical Center
Milford Regional Medical Center
up to six months
Signature Healthcare Brockton Hospital
UMass Marlborough Hospital
Berkshire Medical Center
CHART Phase 2 Month
66CHART Phase 2: Activities since program launch1
15 865+ 3,523 unique visits
to the CHART hospital
hours of coaching phone
regional meetings calls
resource page
with
900+ 21
hospital and CHART newsletters
community provider
attendees
290+
technical assistance 550+
working meetings data reports received
1 Updated through October 17, 2017. Phase 2 hospital programs launched on a rolling basis beginning September 1, 2015. 67CHART Phase 2: The HPC has disbursed $M to date
100% $59,051,711*
90%
Remaining
80%
$16,548,632.46
$42,503,078.54 is inclusive of
70%
$7,217,898
60% maximum
outcome-based
50%
Achievement Payment
opportunity
40%
30%
20%
10%
0%
Updated October 12, 2017
* Not inclusive of Implementation Planning Period contracts. $100,000 per awardee hospital authorized March 11, 2015.
68By the Numbers: Health Care Innovation Investment (HCII) Program
All 20 3 HCII newsletters
~6,500 patients
initiatives will be served, including
patients with SUD, chronic
funded by the HPC
have launched homelessness, and
comorbid conditions
>100 Awardees span the
organizations Commonwealth:
collaborating to deliver care $40M
From the Berkshires to Boston
$ in estimated
health care
220 initiative- cost savings
specific measures Initiatives will
recording patient deliver lower-cost
experience, provider
experience, quality,
care by shifting site
process, and outcomes and scope
69HCII Program Timeline and Next Steps
We Are
Period of Performance
Here
3-6 months 12-24 months 3 months
Preparation Close
Implementation Period Out
Period
Period
Awardees are continuously enrolling patients in their target
populations and delivering services, including:
• Assessing students for unmet behavioral health needs
• Expanding outreach on the streets to engage homeless patients
• Investigating new use cases for tele-psychiatry services
• Training physicians in holding advance care conversations with
patients nearing the end of life
70AGENDA
Call to Order
Approval of Minutes from the September 13, 2017 Meeting (VOTE)
Chairman’s Report
Market Performance
Research Presentation
Investment and Certification Programs
– Care Delivery Certification Programs
– Strategic Investment Programs
– Future Care Delivery Investments
Schedule of Next Board Meeting (December 12, 2017)Goals and principles of HPC’s care delivery investments
Vision for Care Delivery Transformation
A health care system that efficiently delivers on the triple aim of better care for individuals, better
health for populations, and lower cost through continual improvement and the support of alternative
payment.
Goals of investments
• To accelerate transformation of care for people, families and communities
• Support successful achievement of target aims (e.g., readmissions, ED use)
• Promote state policy priorities (e.g., addressing the opioid epidemic, integrating behavioral
health)
Principles of investments
• Meet providers where they are
• Promote a system of learning and continuous improvement
• Align HPC and state activities for care delivery transformation (e.g., MassHealth DSRIP TA)
• Minimize administrative burden to and reporting by providers
• Encourage partnership and collaboration with community partners
72Proposal: Dedicate approximately $10 million from the HPC Trust Funds
for the next round of investment
Health Care Payment Reform Trust Fund Distressed Hospital Trust Fund
• Primary Purposes: • Primary Purpose:
• Grants to providers and their • Grants to low-priced community
partners to foster innovation in hospitals and their partners to
health care payment and service reduce unnecessary hospital
delivery through a competitive utilization and enhance
grant program (“Health Care behavioral health through the
Innovation Investment Program”) Community Hospital
• Technical assistance and provider Acceleration, Revitalization, and
supports related to the Transformation Investment
PCMH/ACO certification Program (CHART)
programs
All investment programs are carefully designed to further
the Commonwealth’s goal of better health and better care
at a lower cost
73Proposal: Ground design proposal in lessons learned from CHART and
HCII
Proposed design components are informed by HPC’s experience with $80M of
awards, spread over 75 awards
Maximize value by focusing on a parsimonious
CHART Performance
set of core measures, but allow applicants to
measures
Phases I and II propose additional initiative-specific measures
Awards of all sizes were successful in
transforming care delivery, serving vulnerable
Award size
patients, and achieving measurable results in
CHART Phase 2
Alignment with organizational strategy and
Financial
requiring in-kind contributions and strong
support &
sustainability plans can maximize long term
sustainability impact of investment
HCII
Awardees and program staff valued having a
Prep period preparation period before performance period
began to hit the ground on day 1
There is utility in using investments to continue to
Building the build the evidence base/ return on investment
evidence base case for innovative care models that integrate
medical, behavioral, and social needs.
74The 2017 Cost Trends Hearings reinforced that avoidable acute care
utilization is driving costs and poor quality in the Commonwealth
Growth in health care
expenditures is concentrated
69.2% of providers and
in complex patients
vulnerable to social risks.2,3
54.6% of payers submitted
pre-filed testimony attesting that
reducing unnecessary hospital
utilization is a critical cost
containment strategy.
Community appropriate The readmission rate for patients
inpatient care is increasingly with a behavioral health diagnosis
being provided by teaching was
hospitals and AMCs.
20.2%
in 20151
1 CHIA Hospital-Wide Adult All Payer Readmissions in Massachusetts, December 2016: http://www.chiamass.gov/assets/docs/r/pubs/16/Readmissions-Report-2016-12.pdf
2 United States Department of Health and Human Services: Office of the Assistant Secretary for Planning and Evaluation. Report to Congress: Social Risk Factors and
Performance Under Medicare’s Value-Based Purchasing Programs A Report Required by the Improving Medicare Post-Acute Care Transformation (IMPACT) Act of 2014.
December 2016.
3 Presentation by Karen Joynt Maddox.
75Proposal: Next round of funding should focus on reducing avoidable
acute care utilization
Next round of funding should focus on promoting an efficient, high-quality healthcare
delivery system by investing in innovative ways to reduce avoidable ED visits and
inpatient readmissions
Patients with a primary
Opioid-related ED BH diagnosis were
42%
ED visits
utilization increased
26% of all first ED revisits that
by 16.3
of inpatient discharges
occurred within 30 days of
were followed by a
return to the ED within
30 days in SFY 2015*
inpatient discharge
occurred within 7 days
of discharge*
87% times
more likely to board than
from 2011-2015**
other patients in 2015**
MA all payer unplanned In 2016, HPC
Readmissions
readmissions has recommended a
41% stayed at around reduction in all-cause
all-payer 30-day
Reducing readmissions
to 13% would yield
of commercial spending
growth in 2015 was
16% readmissions to
$245 M
attributable to hospital
care**
for the past 5 years,
while the nationalProposal: Next round of funding should promote community based health
care systems
“ I don’t see any future for community hospitals…I think there’s a fantastic future for
community health systems. If small stand-alone hospitals are only doing what hospitals have
done historically, I don’t see much of a future for that. But I see a phenomenal future for
health systems with a strong community hospital that breaks the mold [of patient care].
- COMMUNITY HOSPITAL CEO
”
Home health
Mental and visiting
Hospitals health Schools Child care
nurse
providers associations
Community Fitness Inpatient
health centers Law Primary care
psychiatric Specialists
centers enforcement providers
facilities
Addiction
Food Vocational
Pharmacies treatment Shelters
pantries programs
providers
Source: HPC analysis of MHDC 2013 discharge data and raw CHIA relative price data.
Note: Figures shown are differences in average commercial revenue per CMAD for hospitals in each region compared to those in Metro Boston,
adjusted for payer mix. 77Proposed design components
1
Tracks
2
Award size and duration
3
Financial support and
sustainability
4
Competitive factors
78Proposal: Two funding tracks to reduce avoidable acute care use
Funding Track 1: Reduce avoidable acute care use through addressing social determinants of
health
Support for innovative models that address social determinants of health after an acute care visit or stay in
order to prevent a future visit or stay (e.g., respite care for patients experiencing housing instability at time of
discharge)
Partnership with social service providers / community based organizations required
Funding Track 2: Reduce avoidable acute care use through increasing immediate access to
behavioral health care
Support innovative care models to increase immediate access to real time behavioral health services,
(e.g. plans to expand access to 24/7 psychiatric assessment and short term prescribing, using telemedicine
and/or mobile integrated health, and/or other innovative strategies)
Partnership with outpatient behavioral health providers required, if applicant is a BH provider,
partnership with medical care provider required
focus on opioid use disorder treatment
Section 178 of ch. 133 of the Acts of 2016 directed the HPC to invest not more than $3M from the
DHTF to support hospitals in further testing ED initiated pharmacologic treatment for SUD, with
the goals of increasing rates of engagement and retention in evidence-based treatment
Eligible entities would include hospitals with EDs; partnership with outpatient providers required
Eligible entities include HPC certified ACOs* and their
participants and/or CHART eligible hospitals
*including provisionally certified ACOs
79Proposal: Award size and duration
Total funding
Up to $10,000,000
Individual awards*
Up to $750,000
Duration
18 – 24 months
*Any given awardee will receive maximum of one award (may apply for
multiple tracks)
80Proposal: Financial support and sustainability
$
Require
• Require in-kind contributions sustainability
plans to ensure
• For every eligible expense in the award, the continuation beyond
awardee will be reimbursed at 75% (i.e., grant cycle (no
awardee is responsible for 25%) separate
sustainability plan
award)
81Proposal: Four key domains of competitive factors
Competitive factors
Care Model and Impact
• Collaborative multi-disciplinary team approach to care delivery
• Strength of evidence-base
• Projected impact and logic model (e.g. 5% reduction in readmissions)
• Strength and role of relationship with community partner, including pass
through of award dollars
Leadership and Organization
• Alignment of project with organizational strategy (e.g. population health
management approach or community health needs assessment)
• Financial health of organization and demonstration of financial need
• Past performance in HPC awards
• Organizational leadership and project leadership engagement (e.g. % of time
spent on the project)
Sustainability and Scalability
• Solid sustainability plan, including in-kind funds and anticipated utilization
reduction
• Alignment with organization’s DSRIP plan, if applicable
Evaluation
• Strength of evaluation plan to determine impact of model
See appendix for definition of community partners 82Summary of new investment proposal
Enhancing and ensuring sustainability of community-based,
THEME collaborative approaches to care delivery transformation that
drive reductions in avoidable acute care utilization
FUNDING Proposed total funding of up to $10M
Care model and impact
Organizational leadership, strategy and demographics
COMPETITIVE
Evaluation
FACTORS
Sustainability and scalability
Address one or more of the HPC’s key target areas for reducing
avoidable acute care utilization and improving quality:
OUTCOMES
Reduce all-cause 30-day hospital readmissions
Reduce 30-day ED revisits
Increase initiation of and engagement in OUD treatment
83Next steps
Preliminary design Investment
Draft investment procurement
concept procurement released
Aug Sept Oct Nov Dec Jan
2017/2018
Committee & board
input on investment
design
Conduct stakeholder Board vote on RFP
interviews
84AGENDA Call to Order Approval of Minutes from the September 13, 2017 Meeting (VOTE) Chairman’s Report Market Performance Research Presentation Investment and Certification Programs Schedule of Next Board Meeting (December 12, 2017)
Contact Information

        For more information about the Health Policy Commission:

                      Visit us: http://www.mass.gov/hpc

                          Follow us: @Mass_HPC

                      E-mail us: HPC-Info@state.ma.us

                                                                   86
Appendix
87Evidence: Patients with unaddressed social complexities such as
homelessness are more likely to utilize high cost and inefficient acute
care treatment
See appendix for additional data supporting rationale for track 1
Sources: HPC analysis of Center for Health Information and Analysis Emergency Department Database, 2015
Note: Emergency department (ED) boarding is definied as patients who had an ED stay of 12 or more hours from their time of arrival to their time of departure. BH
ED visits identified using NYU Billings algorithm and include any discharge with a mental health, substance abuse, or alcohol-related diagnosis code. 88Evidence: Patients with comorbid behavioral health diagnoses are more
likely to be readmitted
Hospital
Readmits
In 2015, patients with a behavioral health comorbidity had a
readmission rate of 20.8%, nearly twice that of those without a
behavioral health diagnosis
Graph and analyses created by the Center for Health Information and Analysis, using FY15 data (2017). 89You can also read